Author Contributions
Conceptualization, S.O.W., A.H., N.H., V.-V.V. and M.S.; methodology, S.J., S.O.W., V.-V.V. and M.S.; software, S.J., S.O.W. and A.H.; validation, S.J., V.-V.V. and N.H.; formal analysis, S.J.; investigation, S.J. and N.H.; resources, S.O.W. and N.H.; data curation, S.J. and S.O.W.; writing—original draft preparation, S.J.; writing—review and editing, S.O.W., V.-V.V. and M.S.; visualization, S.J. and A.H.; supervision, S.O.W. and V.-V.V.; project administration, S.O.W. and V.-V.V.; funding acquisition, S.O.W. and M.S. All authors have read and agreed to the published version of the manuscript.
Figure 1.
State variables in the EAF process model. T, T and T can be compared to real-time process data.
Figure 2.
Illustration of (left) melting and (right) freezing. indicates the steel melting temperature and d is a constant used for calculating the rates of melting and freezing.
Figure 3.
Variable and static dimensions used to calculate arc visibility for the arc efficiency model.
Figure 4.
Steel meltdown dynamics and change in (A) solid mass and (B) liquid mass during five consecutive two-basket heats.
Figure 5.
Agreement of model predictions with process measurements from 250 heats for (A) liquid steel temperature and (B) liquid steel weight after tapping. Model biases for temperature and weight are negligible while residual standard deviations reflect scatter.
Figure 6.
Comparison of arc efficiency estimation and model for (A) one-basket heats, (B) two-basket heats and (C) three-basket heats. The x-axis is the normalized progress of each heat as measured by the percentage of total electric energy added to the furnace. Low %kWh-results are not meaningful as the efficiency estimation requires several samples to change from the initial guess factor of 0.02.
Figure 7.
Example of arc loss coefficient estimation during five consecutive two-basket heats. (left) A constant produces model results that follow the cooling water dynamics but sometimes overpredict the outlet temperature. (right) Estimation of produces more accurate model results.
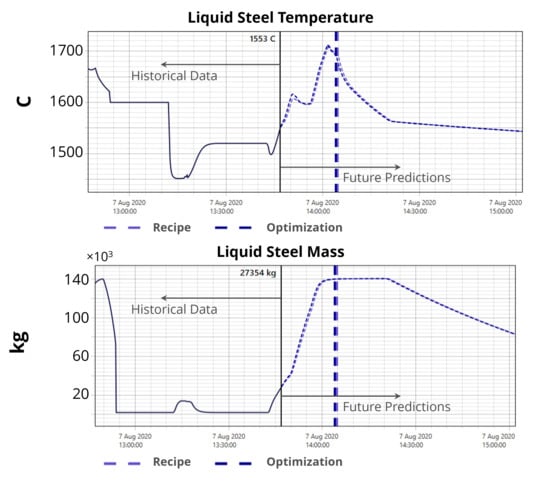
Figure 8.
An illustration of MPC optimization for batch time and electric arc efficiency. Historical MV and model CV predictions are shown as solid black lines. Within the prediction horizon, optimized MV (MPC output) and CV are shown in orange, while nominal MV and the resulting CV are shown in blue.
Figure 9.
Change in specific energy consumption (SEC) due to MPC for (A) one-basket heats, (B) two-basket heats and (C) three-basket heats. ΔSEC is calculated by subtracting the logged SEC up to the point where the model predicts steel meltdown from the MPC simulation result.
Figure 10.
Logged specific energy consumption (SEC) up to the point of melting vs. change in SEC due to MPC for (
A) one-basket heats, (
B) two-basket heats and (
C) three-basket heats. ΔSEC is calculated as described in
Figure 9.
Table 1.
Modeled components in the steel and slag phases.
| Dissolved Component | Phase(s) | Reactive with O in Model? | Equilibrium Reaction in Model? |
|---|
| Fe | Liquid, Solid | Yes | Yes |
| C | Liquid, Solid | Yes | Yes |
| Cr | Liquid, Solid | Yes | Yes |
| Si | Liquid, Solid | Yes | Yes |
| Al | Liquid, Solid | Yes | Yes |
| Mn | Liquid, Solid | No | Yes |
| FeO | Slag | No | Yes |
| SiO | Slag | No | Yes |
| Cr2O3 | Slag | No | Yes |
| Al2O3 | Slag | No | Yes |
| MnO | Slag | No | Yes |
Table 2.
Prefactors for linear heat transfer between different masses in the furnace. The subscript letters (s, l, c, b, r, v, g) refer to (solid steel, liquid steel, solid slag, liquid slag, roof, vessel, gas), respectively. An empty table entry indicates that linear heat transfer between the two masses is omitted from the model.
| | Inner Solid | Outer Solid | Inner Liquid | Outer Liquid | Solid Slag | Liquid Slag | Roof | Vessel | Gas |
|---|
| Inner Solid | - | | | | | | - | - | |
| Outer Solid | | - | | | | | - | - | |
| Inner Liquid | | | - | | | | - | - | |
| Outer Liquid | | | | - | | | - | - | |
| Solid Slag | | | | | - | - | - | - | - |
| Liquid Slag | | | | | - | - | - | - | - |
| Roof | - | - | - | - | - | - | - | - | |
| Vessel | - | - | - | - | - | - | - | - | |
| Gas | | | | | - | - | | | - |
Table 3.
Radiative heat transfer between different masses in the furnace. The subscript letters (s, l, b, r, v) refer to (solid steel, liquid steel, liquid slag, roof, vessel), respectively.
| | Roof | Vessel |
|---|
| Inner Solid | | |
| Outer Solid | | |
| Inner Liquid | | |
| Outer Liquid | | |
Table 4.
Temperature of fully-liquefied steel prior to tapping as predicted by the model when following logged process data and MPC simulations. Both means and standard deviations are presented.
| | T | T | T |
|---|
| 1-Basket | 1688.5 °C ± 27.8 °C | 1684.5 °C ± 27.9 °C | 1693.0 °C ± 13.0 °C |
| 2-Basket | 1693.3 °C ± 21.6 °C | 1687.6 °C ± 23.4 °C | 1703.7 °C ± 17.1 °C |
| 3-Basket | 1717.9 °C ± 2.1 °C | 1717.2 °C ± 2.2 °C | 1702.5 °C ± 0.9 °C |


 ,
, 


