Article

Influence of Cooling Rate on Microstructure Formation of Si–Mo Ductile Iron Castings

1
Department of Cast Alloys and Composites Engineering, Faculty of Foundry Engineering, AGH University of Science and Technology, Reymonta St. 23, 30-059 Krakow, Poland
2
Department of Foundry Processes Engineering, Faculty of Foundry Engineering, AGH University of Science and Technology, Reymonta St. 23, 30-059 Krakow, Poland
3
Faculty of Mechanics and Technology, Rzeszow University of Technology, W. Pola St. 2, 35-959 Rzeszow, Poland
*
Author to whom correspondence should be addressed.
Metals 2021, 11(10), 1634; https://doi.org/10.3390/met11101634
Submission received: 14 September 2021 / Revised: 10 October 2021 / Accepted: 13 October 2021 / Published: 14 October 2021
(This article belongs to the Special Issue Thin Wall Iron Castings)

Abstract

:
The present study highlights the effect of the cooling rate on the microstructure formation of Si–Mo ductile iron. In this study, experiments were carried out for castings with different wall thicknesses (i.e., 3, 5, 13, and 25 mm) to achieve various cooling rates. The simulation of the cooling and solidification was performed through MAGMASOFT to correlate the cooling conditions with the microstructure. The phase diagram of the investigated alloy was calculated using Thermo-Calc, whereas the quantitative metallography analyses using scanning electron microscopy and optical microscopy were performed to describe the graphite nodules and metallic matrix morphologies. The present study provides insights into the effect of the cooling rate on the graphite nodule count, nodularity, and volumetric fractions of graphite and ferrite as well as the average ferritic grain size of thin-walled and reference Si–Mo ductile iron castings. The study shows that the cooling rates of castings vary within a wide range (27 °C–1.5 °C/s) when considering wall thicknesses of 3 to 25 mm. The results also suggest that the occurrence of pearlite and carbides are related to segregations during solidification rather than to cooling rates at the eutectoid temperature. Finally, the present study shows that the longitudinal ultrasonic wave velocity is in linear dependence with the number of graphite nodules of EN-GJS-SiMo45-6 ductile iron.

1. Introduction

The ongoing development of high-quality cast iron mainly concerns ductile iron, which can be used to produce high-tech components that have an attractive combination of mechanical and usable properties that can compete with the so-called light alloys [1,2,3,4,5]. Ductile iron (especially of the Si–Mo, ADI, and Ni–Resist grades) should, therefore, be treated as a potential material to produce light castings with good mechanical and operational properties and at a relatively small cost. From the point of view of economy and ecology, thin-walled ductile iron castings can also compete in terms of their mechanical properties with “light” castings made of aluminum alloys (from the group of high-strength Al–Cu and Al–Si alloys that are subjected to heat treatment of the T6 type).
Recently, Si–Mo ductile irons have been widely used for high-temperature automotive components such as exhaust manifolds as well as turbine castings and many types of furnace applications [6,7,8,9,10,11,12]. Moreover, Si–Mo castings can perform and maintain dimension stability for many thousands of thermal cycles that can reach temperatures of up to greater than 750 °C [13].
The use of Si–Mo ductile iron is closely related to the thermal stability of the structure and is important in the design of cast components (especially in automotive production, where structural stability and functional properties are of key importance when choosing a given material). The main factors that affect the microstructure and properties of ductile iron are its chemical composition, cooling rate, liquid treatment, and heat treatment [1,14,15]. In the case of castings with different wall thicknesses, the key issue in attaining homogeneous structures and properties is the sensitivity of cast iron to the cooling rate, especially when we “enter” the range of the high cooling rates that take place in the production of thin-walled castings.
The as-cast microstructure of Si–Mo ductile iron is governed by the solidification process and by the subsequent eutectoid transformation. Significantly increasing the cooling rate influences the as-cast microstructure (refining both the graphite size and matrix structure) and, therefore, the mechanical properties and chilling tendency; these factors result in increasing the hardness, decreasing the strength, and severely impairing a casting’s machinability. The sensitivity of cast iron to the cooling rate is closely related to the microsegregation of the alloying elements, which affects the crystallization of the primary structure as well as the eutectic and eutectoid transformations. Many types of ductile iron are very sensitive to the cooling rate, which results from (among other things) the presence of an asymmetric coupled eutectic zone and the fact that the chemical composition is not the only factor that determines the presence of the austenite dendrites or primary graphite in the microstructures of castings–the cooling rate, temperature gradient, phase fractions, and modification procedure also contribute.
Given the above considerations, many kinds of ductile iron (including the Si–Mo grade) are underestimated in their abilities to achieve optimum mechanical properties and performance. Therefore, the optimization of the microstructure from the point of view of the morphological features of the phases that occur in cast iron (e.g., striving for a unimodal distribution of the size of the graphite spheres or minimizing the microstructure gradient) is necessary in the production of high-quality components for demanding industries (e.g., automotive). The impact of the wall thickness and cooling rate (including those that are characteristic of thin sections on the sensitivity of Si–Mo ductile iron castings) is, thus, of great importance. Moreover, the high tendency for carbide precipitation into the cell boundaries of Si–Mo ductile iron has scarcely been dealt with in the literature. Limited data on the cooling rate-microstructure of Si–Mo ductile iron relationship (which is crucial for the formation of castings) in a wide range of wall thicknesses has been provided in [16]. Nofal [16] stated that the morphology and composition of the carbide precipitate depend on the cooling rate of the casting. Additionally, he concluded that as the cooling rate increases, the precipitate gains a lamellar structure that is typical of pearlite, while at a slower cooling rate, the precipitate gains a spheroidal or rod-like structure.
The main objective of this work is, thus, to investigate the influence of the cooling rate of Si–Mo ductile iron (with section thicknesses ranging from thin-wall castings [3 and 5 mm] up to castings with a typical wall thickness of 25 mm in green sand molds) on the microstructure and solidification parameters with the use of Magma software. Moreover, the non-destructive testing (NDT) technique (i.e., the velocity of the longitudinal ultrasonic wave) was determined to be accurate, fast, and of a high throughput in achieving quality control and reliability.

2. Experimental Procedures

The experimental melts were prepared in a 15-kg-capacity (Mammut type A-15) graphite crucible using an electrical induction furnace of an intermediate frequency. The furnace charge consisted of Sorelmetal (high-purity pig iron: 4.46% C, 0.132% Si, 0.01% Mn, 0.006% S, 0.02% P), technically pure silica, Fe–Mn, Fe–Mo, and steel scrap. After being melted at 1490 °C, the liquid metal was held for two minutes followed by spheroidization and inoculation operations using the bell method. An Fe–Si–Mg (6% Mg) foundry alloy was used for spheroidization, while Foundrysil (73–78% Si, 0.75–1.25% Ca, 0.75–1.25% Ba, 0.75–1.25% Al, Fe [balance]) was used for inoculation purposes. The pouring temperature was 1360 °C. The experimental castings applied in the investigations were test blocks that satisfied the ASTM A 536–84 standard, with plate section sizes of g = 3–25 mm at the bottom end (Figure 1). The sand molds were made using conventional green molding sand consisting of silica sand, bentonite (7 wt.%), a water/bentonite ratio of 0.4, and a granularity of 100–200 μm.
The chemical composition tests of the experimental ductile irons were carried out using a SPECTRAMAXx emission spectrometer with spark excitation (Table 1).
A metallographic characterization was made using a Leica MEF 4M microscope and a QWin v3.5 quantitative analyzer at various magnifications to determine the graphite and matrix morphologies. The nodularity was calculated using Formulas (1) and (2) according to the ISO-945-4 standard:
ρ = 4 A π   l m 2
ρ n o d = A 0.625 1 + 0.5 A 0.525 0.625 A A l l × 100
where: ρ—roundness; A—area of graphite particles; lm—maximum Feret diameter of graphite particle; A0.625-1 and A0.525–0.625—total area of graphite particles from appropriate range of roundness values; AAll—total area of all graphite particles that meet size criteria (lm < 5 µm), excluding particles that intersect border of area of view. In addition, the samples were examined by a JEOL JSM-550LV scanning electron microscope (SEM) operated at 20 kV.
The simulations of the cooling and solidification were performed through the Iron module of the MAGMASOFT v5.3 commercial software by MAGMA to correlate the cooling conditions with the microstructure. The inputs for this simulation were the 3D geometry of the casting system (Figure 1), the chemical composition of the alloy, the thermophysical parameters of the materials involved, and the alloy-mold and mold-environment heat transfer coefficient. During the pre-processing, some virtual thermocouples were placed in the center of the plate specimens to record the simulated cooling curves. As the sand mold material, green sand was used from the MAGMASOFT database. The numbers of the graphite nodule counts were taken from the center of the plates (from the areas where the thermocouples were placed).
The velocities of the longitudinal ultrasound wave were measured with an Echometer 1073 vs. with a 10.4/6 PB 4 head.
Phase diagram of investigated alloy was calculated using “Thermo-Calc 2019a” database: TCFE7 and volume fraction of phases as well as transformation temperatures were estimated.

3. Results

3.1. Solidification and Solid-State Transformation

The Thermo-Calc phase diagram of the investigated Si–Mo ductile iron is shown in Figure 2a,b, which illustrates the formation of its structure during the cooling and solidification to room temperature. According to the equilibrium system that was defined by Thermo-Calc, the composition of the Si–Mo ductile iron is slightly hypereutectic, which is marked by the dashed red line in Figure 2a. The liquidus temperature is around 1220 °C and is associated with the crystallization of a small fraction of the primary graphite. Carbides of the M6C type (Fe2Mo2Si2C) were formed during the crystallization at a temperature of about 1158 °C; in accordance with the equilibrium system, these remained in the alloy throughout the entire range up to the ambient temperature. There is also eutectoid transformation in the system; therefore, the ferrite and austenite coexist within a temperature range of 935 °C–871 °C for the entire range of the carbon content.
The volume fraction under equilibrium conditions in terms of temperature is shown in Figure 2b. From this, it follows that the ambient temperature microstructure mainly consists of graphite (9.6 vol.%), ferrite (88.8 vol.%), and carbide phases (i.e., M6C [1.2 vol.%] and M7C3 [0.2 vol.%]). In fact, the real microstructure of Si–Mo ductile iron consists of a graphite nodules, ferritic metallic matrix and small percentage of pearlite plus Fe–Mo carbides in intercellular regions [9,16]. It is worth also pointing that as Thermo-Calc analysis provides estimations in equilibrium conditions, a fraction of a percent of carbides forming elements such as, e.g., Cr gave trace percentage of M7C3 in Si–Mo ductile iron. XRD analysis in Si–Mo ductile iron with Mo < 1 wt.% show only carbides Fe3C formed in the alloy, due to eutectoid transformation, i.e., in pearlite without any marks from M7C3 or molybdenum carbides [17]. Black et al. in [9] presented the TEM crystal structure analysis of carbides in Si–Mo ductile iron, from which it follows that they were identified as M6C and Fe2MoC.

3.2. Cooling Curves

The simulated cooling curves and cooling rates are reported in Figure 3. The virtual thermocouples were in the geometrical center of each mold cavity. The eutectic (Ts) and eutectoid (Te) equilibrium temperatures can be estimated based on the chemical composition [18,19]:
Ts = 1154 + 5.25 Si – 14.88 P = 1178.2 °C
Te = 739 + 18.4 Si + 2 Si2 – 14 Cu – 45 Mn + 2 Mo – 24 Cr – 27.5 Ni + 7.1 Sb = 859.3 °C.
Table 2 summarizes the cooling rates at the transformation temperatures along with the undercooling below the eutectic equilibrium temperature, which is calculated as the difference between the eutectic temperature according to Equation (3) and the minimum temperature at the beginning of the solidification.
Figure 3 and Table 2 show that the cooling rates of thin-walled castings with wall thicknesses of 3–5 mm were much greater than the values obtained for the conventional castings (i.e., with wall thicknesses of 13 and 25 mm). Additionally, the Si–Mo thin-walled castings were characterized by pronounced changes in the cooling rates with only minute changes in the wall thicknesses (which is in accordance with [15]). This also applies to the eutectoid transformation, where the cooling rate values were similar to wall thicknesses of 13 and 25 mm, while entering the range of the thin-walled castings resulted in a significant increase in the cooling rate.

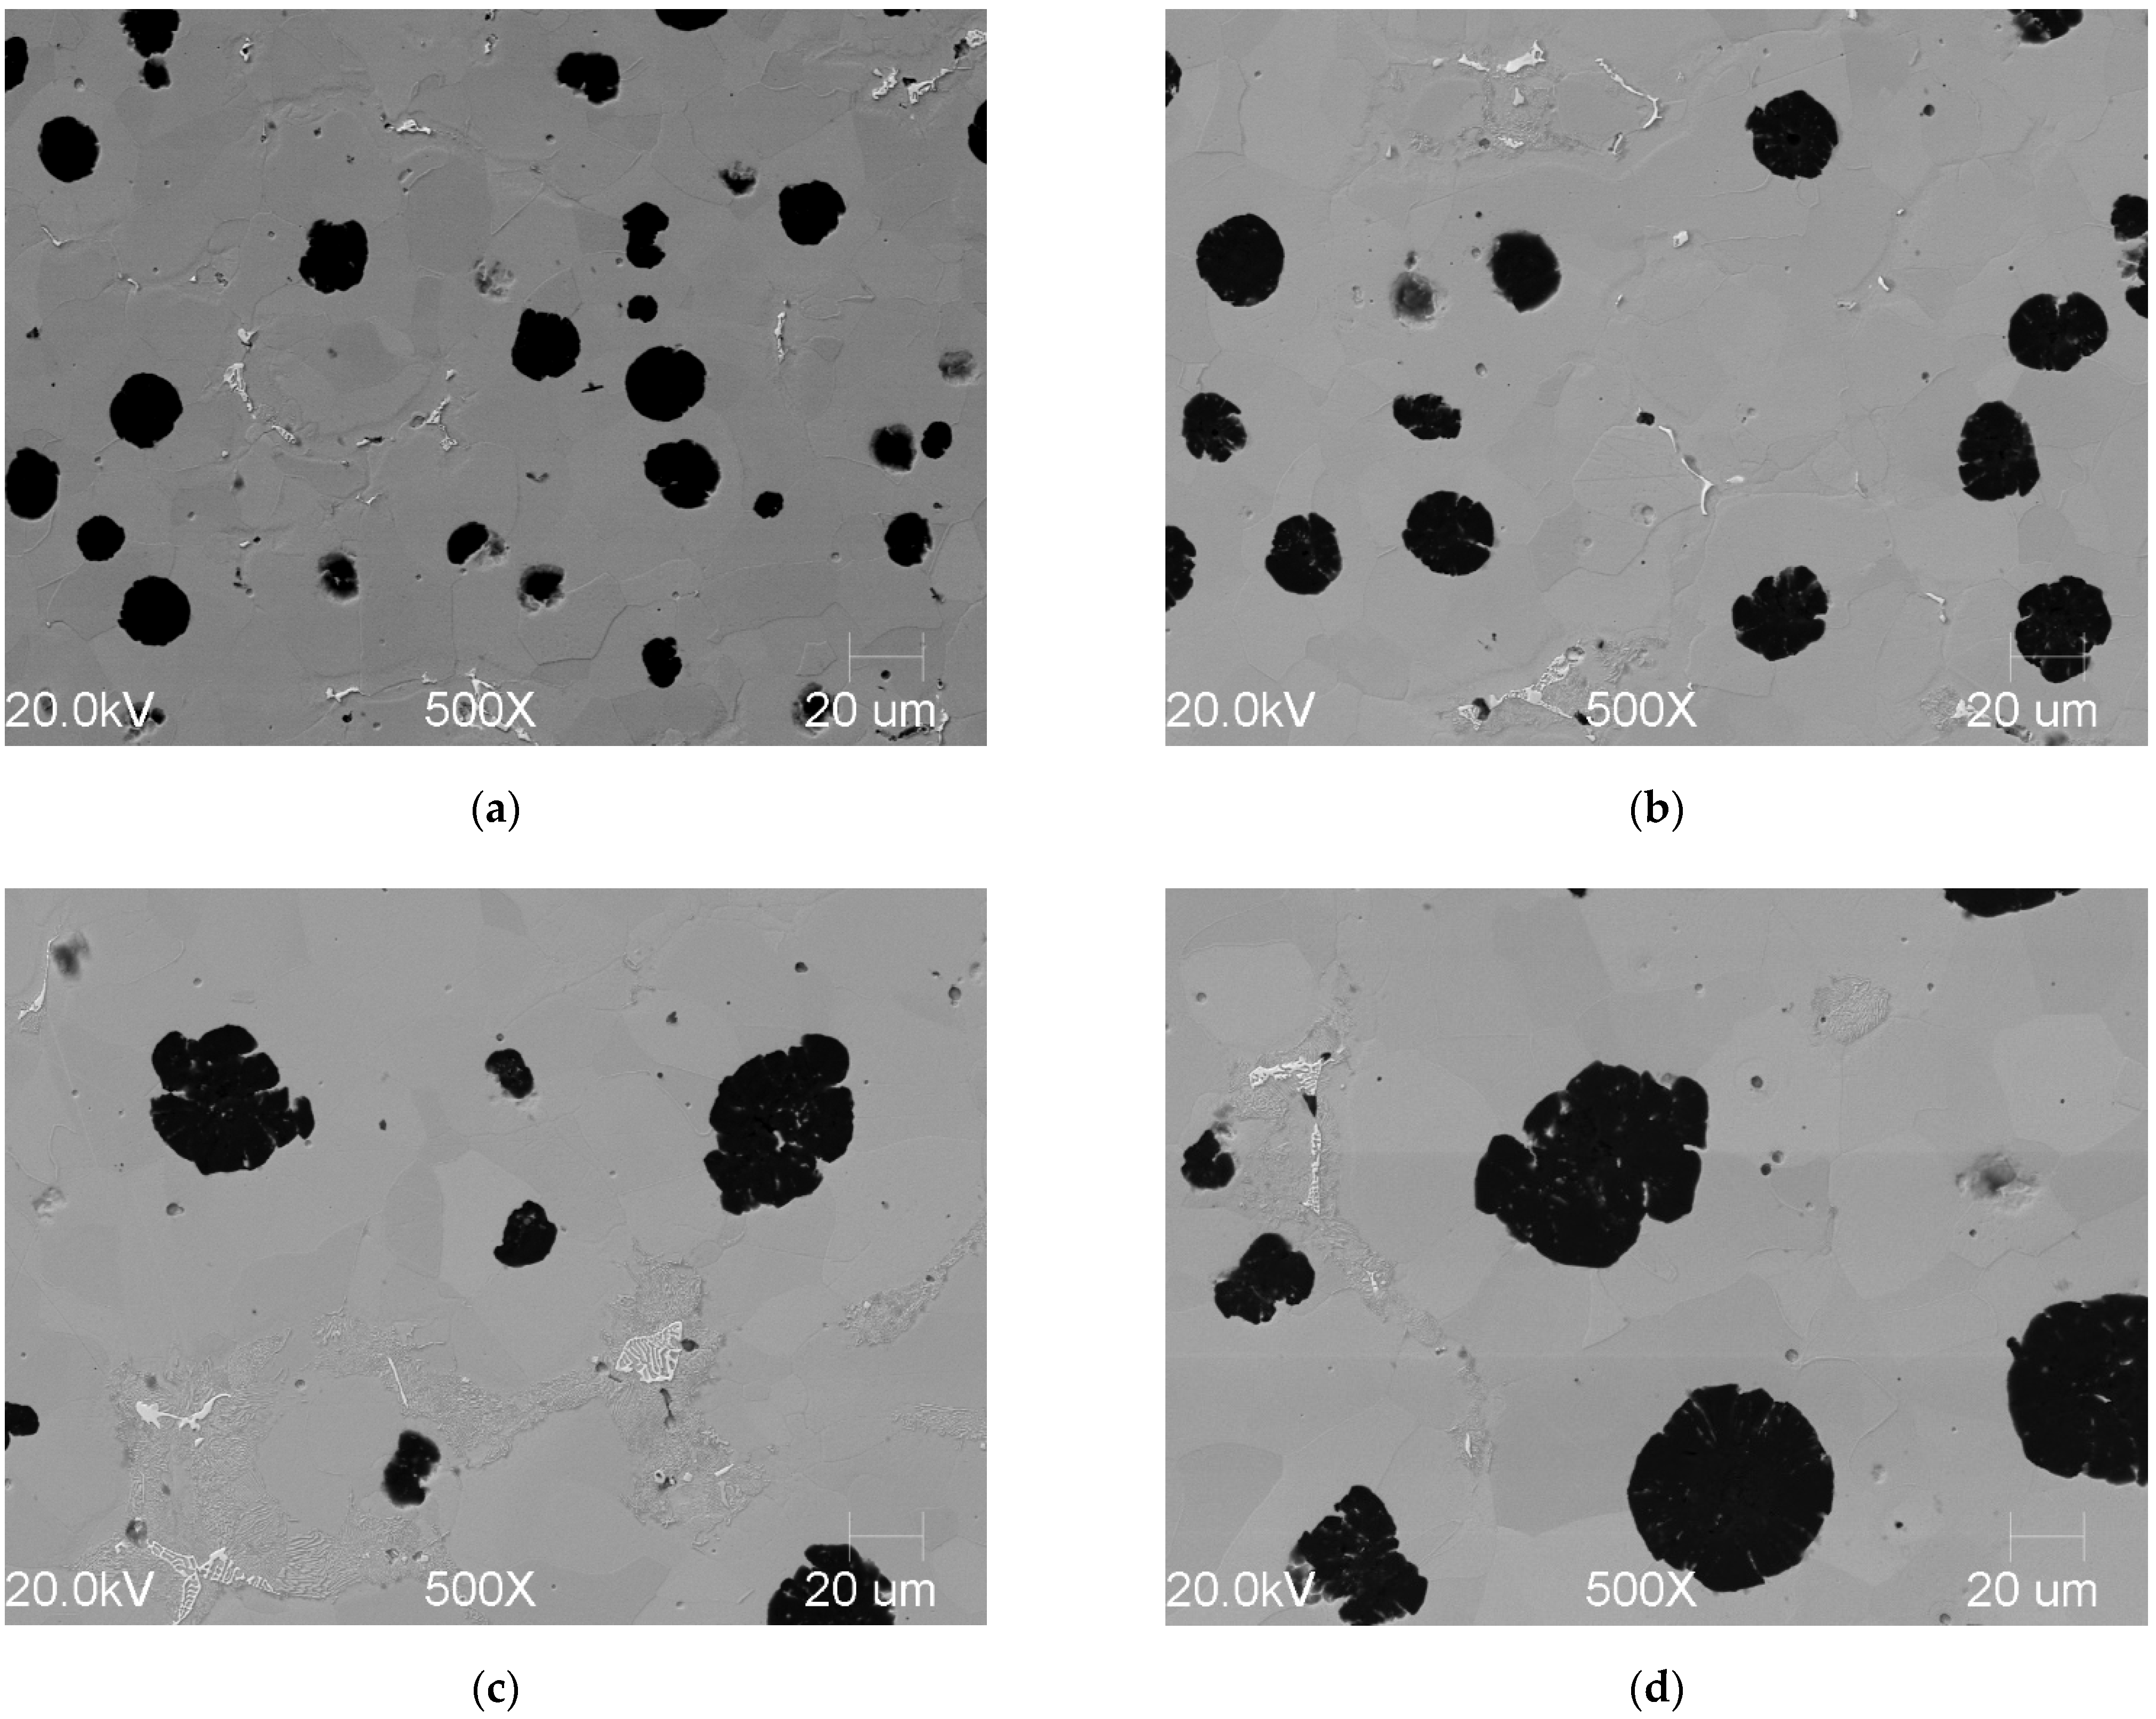
3.3. Microstructures

Figure 4 and Figure 5 show the exhibited microstructures that can be found in castings with different wall thicknesses.
In Figure 5a,b, the micrographs show microstructures with visible pearlite islands in castings with wall thicknesses of 3–25 mm. Both lamellar and granular pearlite occurs in the intercellular region between the graphite nodules. The microstructure consists of graphite nodules, a significant share of ferrite (>70%), perlite, and a maximum of 5% of carbides of the Fe2MoC and M6C types as reported in [9] (Figure 6).
Increasing the cooling rate (i.e., the graphite nodule count) reduces the carbon and molybdenum segregation to the intercellular regions and, hence, reduces the number of intercellular precipitates. Increasing the wall thickness leads to higher segregation levels and the formation of eutectic carbides that are surrounded by fine precipitates at the intercellular regions. In the castings with wall thicknesses of 13 and 25 mm, well-formed carbide skeletons filled with perlite are visible. This carbidic network improves the dimensional stability and increases the tensile strength, creep resistance, and corrosion resistance; however, it reduces the plastic properties [20,21].
This qualitative description can be supported through quantitative measurements that are connected to the graphite nodules as well as the metallic matrix (Table 3).

3.4. Ultrasonic

The velocity of the longitudinal ultrasonic wave was affected by the volume fractions of the structural constituents in the unit volume of the alloy, graphite nodularity, and number of graphite nodules as well as by the morphology, size, and shape of the metal matrix components.
The results of the tests of longitudinal ultrasonic wave velocity cL are presented in Table 4.

4. Discussion

The EN-GJS-SiMo45-6 microstructures are consistent with the solidification rates (Figure 3), so the microstructural features are finer when the cooling rates are higher (Table 3); this is consistent with what is reported in the literature [1,15]. Higher cooling rates around the eutectic temperature lead to higher undercooling (Figure 7a), which can be somewhat related to the graphite features (Figure 7b).
The cooling rate influences the maximum degree of undercooling; as a result, this also affects the structure of the examined Si–Mo ductile iron. If the cooling rate Q increases, this affects the maximum degree of undercooling ΔTS; this contributes to an increase in the driving force of the solidification process. It is worth mentioning that the increase in the degree of undercooling as a result of an increased cooling rate exhibits a clear power function with a high correlation coefficient of R = 0.99. Figure 8 shows the particle size distribution of the graphite in castings with different wall thicknesses.
The analysis of the graphite particle distribution showed that in the thin-walled castings, unimodal graphite distribution was achieved in a relatively narrow range of graphite sizes. In the other cases, we saw that the graphite distributions were not unimodal. The transition from high cooling rates to castings with typical wall thicknesses causes a gradual change of the graphite distribution from unimodal to bimodal. In extreme cases (often in hypereutectic–thick-wall castings), a trimodal graphite distribution will occur with the presence of primary graphite and the occurrence of secondary nucleation during the eutectic crystallization, which is particularly unfavorable from the point of view of the structure homogeneity and, therefore, the final casting properties.
Similar to those features that are related to the graphite, the ferritic grain size also becomes smaller when the solidification rate increases (Figure 9); this has already been found in the literature (for wall thicknesses ranging from 25 to 75 mm) [22,23].
During solidification, solid-state transformations take place. In particular, ferrite nucleates and grows in the austenitic grains, which mainly transforms into ferrite and graphite. If the cooling rate at the equilibrium eutectoid transformation temperature is fast enough, supercooling may occur (which allows for pearlite crystallization) [18]. Table 2 and Figure 3b show that the cooling rates at the eutectoid temperature are relatively low for all the investigated castings when compared to the cooling rate values that are obtained around the eutectic transition temperature. This is consistent with low pearlite volume fractions that are found in the metallic matrixes of all castings ranging from 3 to 25 mm. Moreover, an analysis of the results shows that the fraction of perlite does not increase as the thickness of the walls decreases (as is typically the case with unalloyed irons). This suggests that a major role is played by the cooling rate at the beginning of the solidification, which was much higher in the thin sections at the eutectic temperature as compared to the thicker ones. This may have reduced the Mo segregations, thus lowering the pearlite and carbide content. Therefore, pearlite and molybdenum carbides are the products of microsegregations during solidification rather than the result of different cooling rates through the Ac1-Ac3 intercritical interval. In the thin-walled castings (3 and 5 mm), the pearlite is barely detectable (even though the cooling rates at the eutectoid transformation were higher than in the typical wall thicknesses of 13 and 25 mm).
Tested longitudinal ultrasonic wave velocity cL decreased according to the power function with respect to the wall thickness (Figure 10a) and is linear-dependent on the number of graphite nodules NA (Figure 10b) of the ductile iron; this has already been found in the literature for standard EN-GJS 500-7 unalloyed ductile iron with casting wall thicknesses that vary from 10 to 50 mm [24].
The ultrasonic wave velocity and attenuation measurements also depend on the morphological features of the graphite (shape, size, and distribution) and the metallic matrix [24,25]. Increasing the ferrite content causes a decrease in the acoustic velocity to an order of 200 m/s for a complete transformation from pearlite to ferrite (as reported by Willcox [26]). It is well-known that there is little effect of the cooling rate on the ferrite content of ferritic irons, while a higher cooling rate increases the amount of ferrite for pearlitic irons because of their higher nodule counts. In the case of the analyzed ductile iron of the EN-GJS-SiMo45-6 grade, increasing the cooling rate caused an increase in the number of graphite nodules and the ferrite fraction. The changes in the number of graphite nodules from 608 to 168 (ΔNA = 440/mm2) when changing the wall thicknesses from 3 to 25 mm resulted in a change in ultrasonic wave velocity cL from 5745 to 5685 m/s (ΔcL = 60 m/s). Comparing the changes in the values of ΔcL to the ΔNA of both materials, it turns out that the ultrasonic wave velocity cL in the tested ductile iron (EN-GJS-SiMo45-6) is more than 3.5-times less sensitive to the change in the number of graphite precipitates as compared to unalloyed cast iron. This can be explained by the fact that in casting crystallizing at lower rates, the volume fraction of the carbides increases due to the presence of Mo and the greater tendency towards microsegregation; this causes an increase in the ultrasonic wave velocity. This means that despite the great differences in the cooling rates, the tested cast iron from the Si–Mo group is characterized by a much lower sensitivity to the cooling rate that is expressed by the ultrasonic wave velocity as well as the microstructure features that are related to the graphite, matrix metal, and carbides that are present.

5. Conclusions

  • Different microstructures of EN-GJS-SiMo45-6 were attained for thin-walled castings with wall thicknesses of 3 and 5 mm as well as reference castings with typical wall thicknesses of 13 and 25 mm, which lead to various cooling rates that were calculated through the simulation of an actual gravity-casting system.
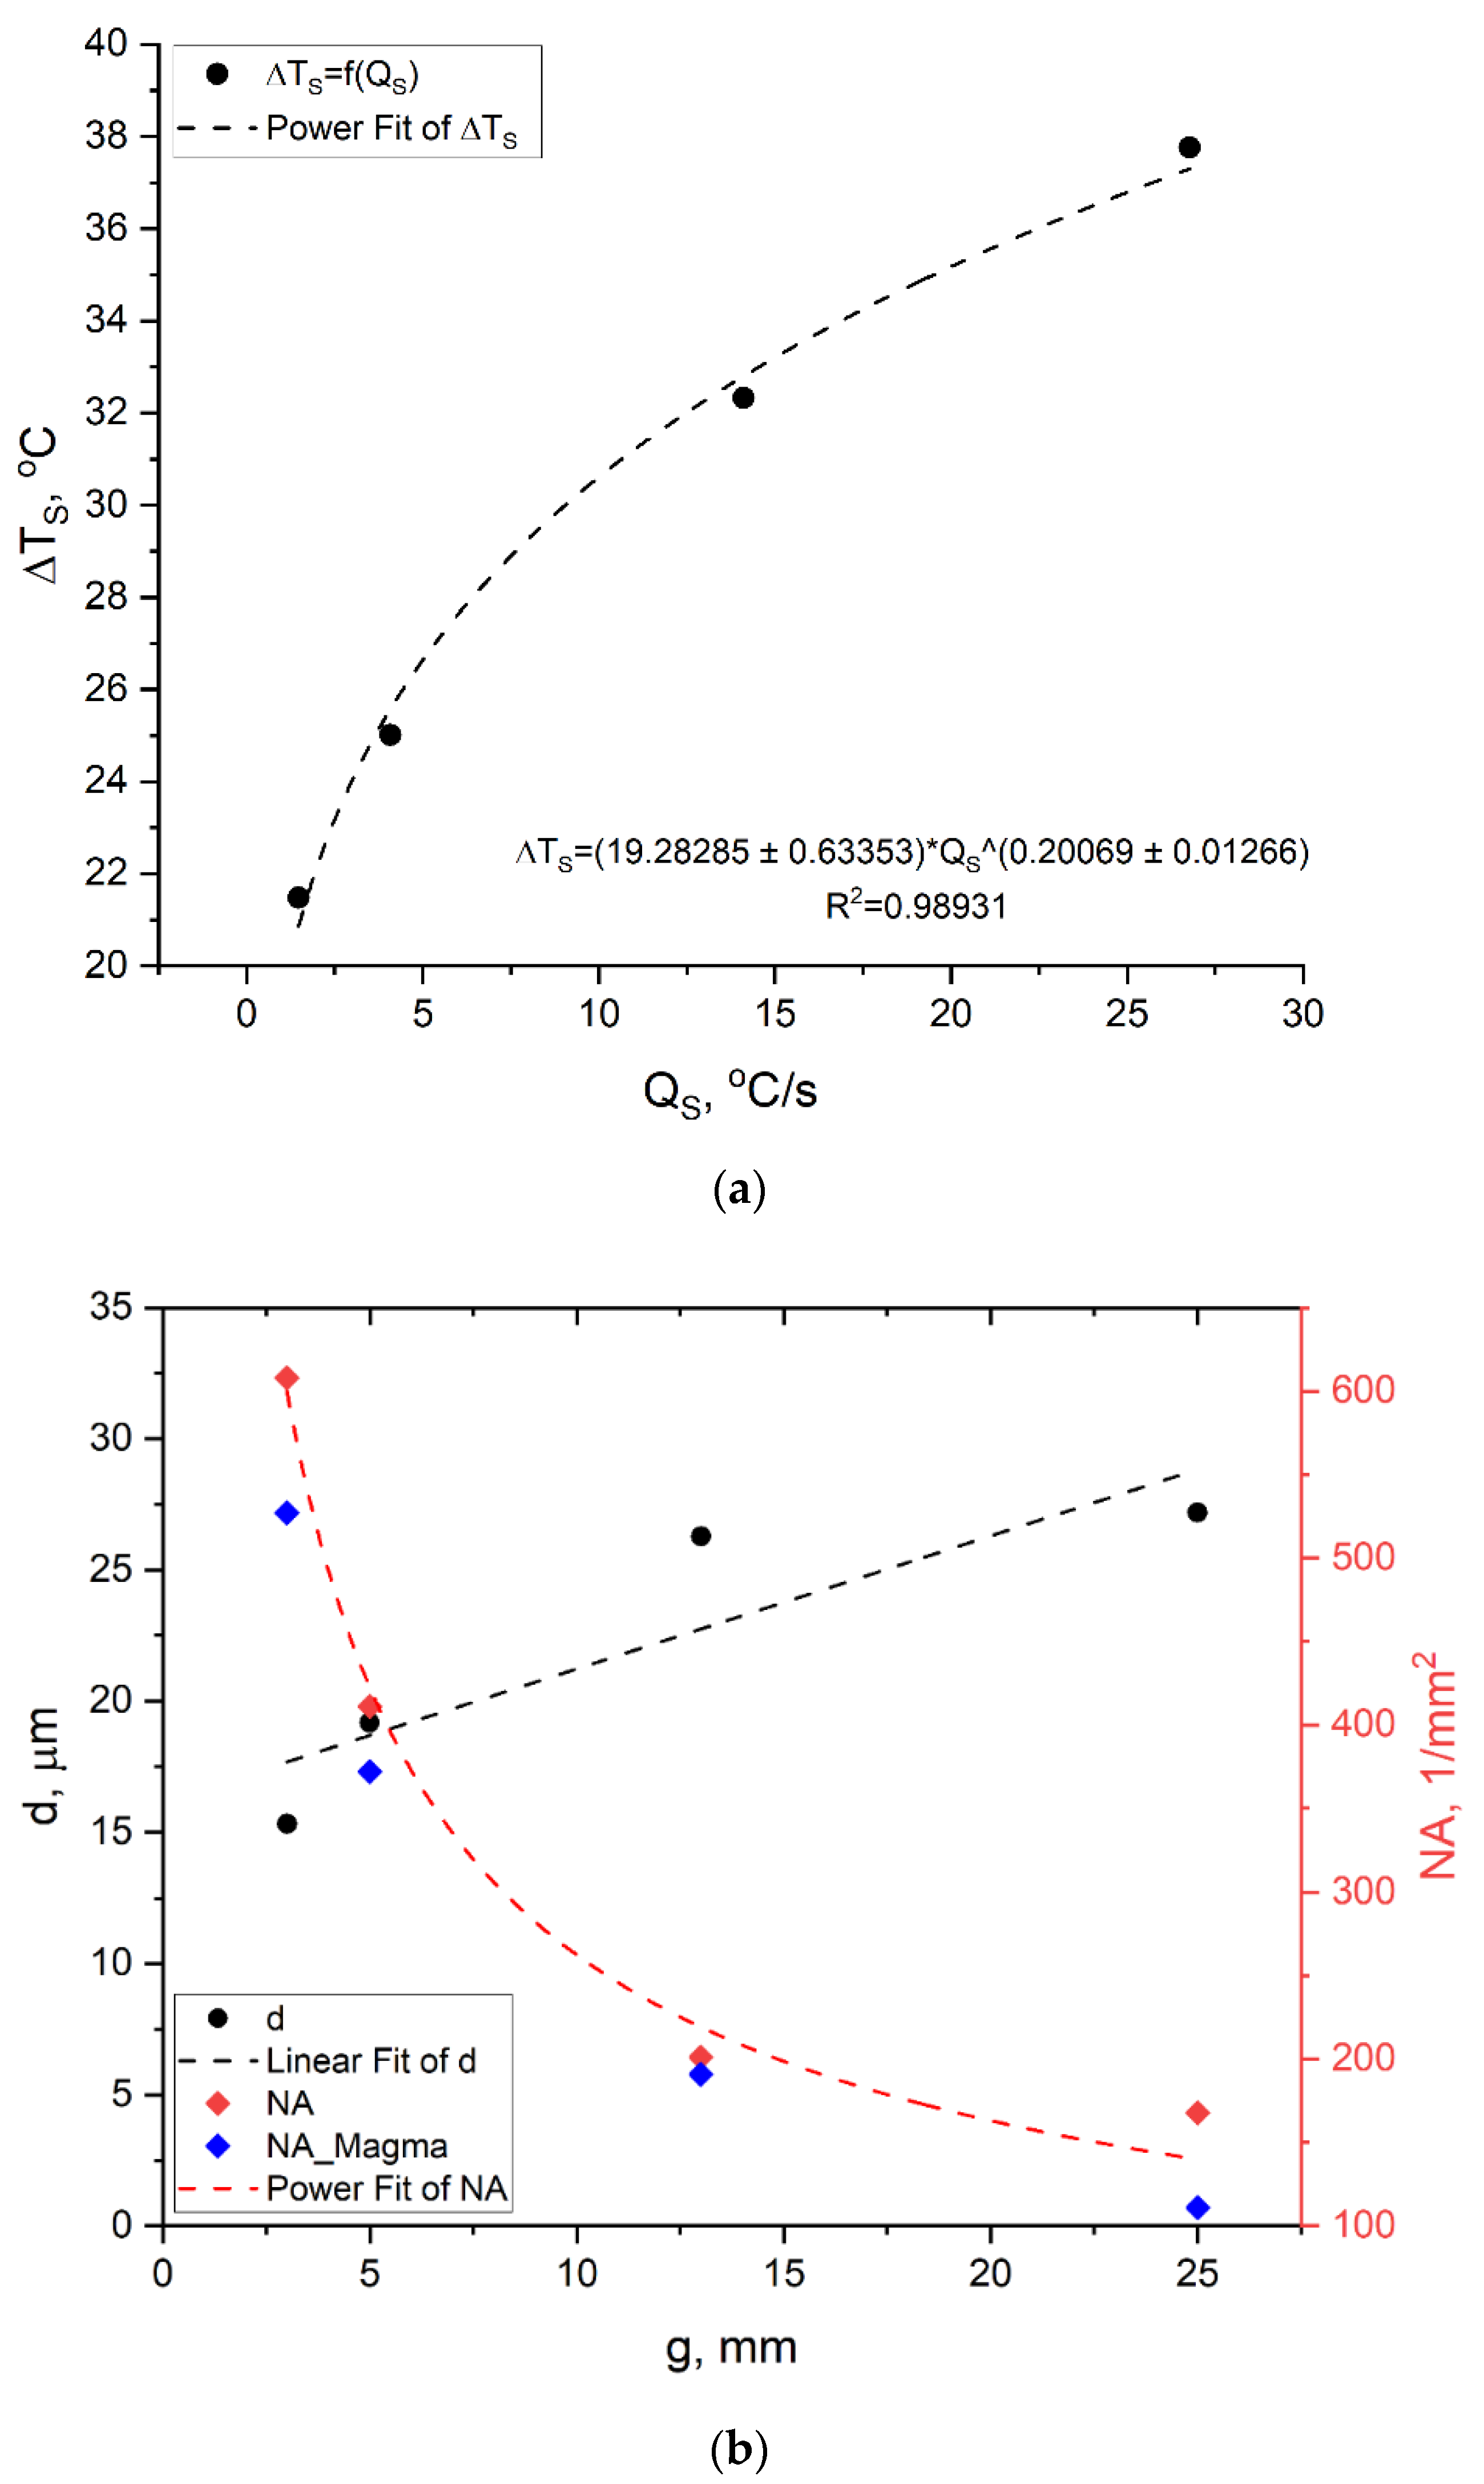
  • The microstructures were characterized in detail, quantifying the nodule count, nodularity, average diameter of the graphitic nodules, and volumetric fractions of the graphite and ferrite as well as the average ferritic grain size. These features become finer as the solidification rate increases. A positive segregation (enrichment) of the Mo was observed in the pearlitic islands; this led to the formation of Fe–Mo carbides. The cooling rates around the eutectoid temperature were correlated with the ferritic grain size. The results suggest that the occurrence of pearlite and carbides is related to segregations during solidification rather than to cooling rates at the eutectoid temperature.
  • Longitudinal ultrasonic wave velocity cL was found to be linear-dependent with the number of graphite nodules NA of the EN-GJS-SiMo45-6 ductile iron. In castings that crystallize at lower speeds due to the presence of Mo and the greater tendency towards microsegregation, the volume fraction of the carbides increases, which causes an increase in the ultrasonic wave velocity. The final effect is the relatively low sensitivity of ductile iron to changes in the values of longitudinal ultrasonic wave velocity cL when changing the wall thicknesses from 3 to 25 mm, which should result in slight variations in the mechanical properties.

Author Contributions

Conceptualization, M.G. and M.K.; methodology, M.G., M.K., software, B.G., formal analysis M.G., investigation, M.G., B.G. and M.T., writing—original draft preparation, M.G., writing—review and editing, M.G., M.K., B.G. and M.T., supervision, M.G. All authors have read and agreed to the published version of the manuscript.

Funding

This research received no external funding.

Institutional Review Board Statement

Not applicable.

Informed Consent Statement

Not applicable.

Data Availability Statement

Some data used during the study are available from the corresponding author by reasonable request.

Conflicts of Interest

The authors declare no conflict of interest.

References

  1. Górny, M.; Stefanescu, D.M. Thin-wall ductile iron castings. In ASM Handbook; Stefanescu, D.M., Ed.; ASM International: Materials Park, OH, USA, 2017; Volume 1A, pp. 617–628. [Google Scholar]
  2. Fras, E.; Górny, M.; Lopez, H. Thin Wall Ductile and Austempered Iron Castings as Substitutes for Aluminum Alloy Castings. Int. Foundry Res. Giess. 2009, 61, 2–10. [Google Scholar]
  3. Stefanescu, D.M.; Dix, L.P.; Ruxanda, R.E.; Corbitt-Coburn, C.; Piwonka, T.S. Tensile Properties of Thin Wall Ductile Iron. AFS Trans. 2002, 110, 1149–1161. [Google Scholar]
  4. Ruxanda, R.E.; Stefanescu, D.M.; Piwonka, T.S. Microstructure Characterization of Ductile Thin Wall Iron Castings. AFS Trans. 2002, 110, 1131–1147. [Google Scholar]
  5. Druschitz, A.P.; Fitzgerald, D.C. Lightweight Iron and Steel Castings for Automotive Applications; SAE Tech. Pap. 2000-01-0679; SAE International: Warrendale, PA, USA, 2000. [Google Scholar] [CrossRef] [Green Version]
  6. Xiang, S.; Jonsson, S.; Hedström, P.; Zhu, B.; Odqvist, J. Influence of ferritic nitrocarburizing on the high-temperature corrosion-fatigue properties of the Si-Mo-Al cast iron SiMo1000. Int. J. Fatigue 2021, 143, 105984. [Google Scholar] [CrossRef]
  7. Xiang, S. Oxidation, Creep and Fatigue Synergies in Cast Materials for Exhaust Manifolds. Ph.D. Thesis, KTH Royal Institute of Technology, Stockholm, Sweden, 2021. [Google Scholar]
  8. Pierce, D.; Haynes, A.; Hughes, J.; Graves, R.; Maziasz, P.; Muralidharan, G.; Shyam, A.; Wang, B.; England, R.; Daniel, C. High temperature materials for heavy duty diesel engines: Historical and future trends. Prog. Mater. Sci. 2019, 103, 109–179. [Google Scholar] [CrossRef]
  9. Black, B.; Burger, G.; Logan, R.; Perrin, R.; Gundlach, R. Microstructure and Dimensional Stability in Si-Mo Ductile Irons for Elevated Temperature Applications. SAE Pap. 2002, 111, 976–991. [Google Scholar]
  10. Li, D.; Perrin, R.; Burger, G.; McFarlan, D.; Black, B.; Logan, R.; Williams, R. Solidification Behavior, Microstructure, Mechanical Properties, Hot Oxidation and Thermal Fatigue Resistance of High Silicon SiMo Nodular Cast Irons; SAE Tech. Pap. 2004-01-0792; SAE International: Warrendale, PA, USA, 2004. [Google Scholar] [CrossRef]
  11. Choe, K.; Lee, S.; Lee, K. High Temperature Oxidation Behavior of Si-Mo Ferritic Ductile Cast Iron. Mater. Sci. Forum 2010, 654–656, 542–545. [Google Scholar] [CrossRef]
  12. Choe, K.; Lee, K.; Kim, M. Effect of Mo on the microstructure and thermal expansion of high Si ferritic heat-resistant ductile iron. In Proceedings of the International Conference on Materials, Environmental and Biological Engineering (MEBE 2015), Guilin, China, 28–30 March 2015. [Google Scholar]
  13. Ductile Iron Group. Ductile Iron Data for Design Engineers; Rio Tinto Iron & Titanium Inc.: Montreal, QC, Canada, 1990. [Google Scholar]
  14. Fras, E.; Lopez, H.F. A Theoretical and Experimental Study of the Dependence between Undercooling and Nodular Eutectic Grains Density. Arch. Metall. 1998, 43, 227–240. [Google Scholar]
  15. Górny, M.; Tyrała, E. Effect of Cooling Rate on Microstructure and Mechanical Properties of Thin-Walled Ductile Iron Casting. J. Mater. Eng. Perform. 2013, 22, 300–305. [Google Scholar] [CrossRef] [Green Version]
  16. Youssef, M.; Nofal, A.; Hussein, A. Influence of Cooling Rate on Nature and Morphology of Intercellular Precipitates in Si-Mo Ductile Irons. Mater. Sci. Forum 2018, 925, 231–238. [Google Scholar] [CrossRef] [Green Version]
  17. Stawarz, M. The Role of Intermetallic Phases in Silicon Cast Iron; Polish Academy of Sciences: Katowice, Poland, 2019. [Google Scholar]
  18. Gerval, V.; Lacaze, J. Critical Temperature Range in Spheroidal Graphite Cast Irons. ISIJ Int. 2000, 40, 386–392. [Google Scholar] [CrossRef]
  19. Neuman, F. The influence of additional elements on the physic-chemical behaviour of carbon in saturated molten iron. In Recent Research on Cast Iron; Merchant, H.D., Ed.; Gordon and Breach: New York, NY, USA, 1968; pp. 659–705. [Google Scholar]
  20. Ibrahim, M.M.; Nofal, A.; Mourad, M.M. Microstructure and Hot Oxidation Resistance of SiMo Ductile Cast Irons Containing Si-Mo-Al. Metall. Mater. Trans. B 2017, 48, 1149–1157. [Google Scholar] [CrossRef]
  21. Stawarz, M. SiMo Ductile Iron Crystallization Process. Arch. Foundry Eng. 2017, 17, 147–152. [Google Scholar] [CrossRef] [Green Version]
  22. Angella, G.; Ripamonti, D.; Górny, M.; Masaggia, S.; Zanardi, F. The Role of Microstructure on Tensile Plastic Behavior of Ductile Iron GJS 400 Produced through Different Cooling Rates, Part I: Microstructure. Metals 2019, 9, 1282. [Google Scholar] [CrossRef] [Green Version]
  23. Goodrich, G.M. Cast iron microstructure anomalies and their causes. AFS Trans. 1997, 105, 669–683. [Google Scholar]
  24. Orłowicz, W.; Tupaj, M.; Mróz, M. Quality Control by Means of Ultrasonic in the Production of Ductile Iron. ISIJ Int. 2010, 50, 906–912. [Google Scholar] [CrossRef]
  25. Imasogie, B.I. Spheroidal Graphite Iron. In Encyclopedia of Iron, Steel, and Their Alloys, 1st ed.; Colás, R., Totten, G.E., Eds.; Taylor and Francis: New York, NY, USA, 2006; pp. 3237–3254. [Google Scholar]
  26. Willcox, M. Ultrasonic Velocity Measurements Used to Assess the Quality of Iron Castings. Insight NDT. Available online: https://www.insight-ndt.com/papers/ (accessed on 8 September 2021).
Figure 1. Outline of test block castings with different wall thicknesses (g = 3, 5, 13, and 25 mm).
Metals 11 01634 g001
Figure 2. (a) Thermo-Calc phase diagram of Si–Mo ductile iron; (b) volume fraction of all phases formed.
Metals 11 01634 g002aMetals 11 01634 g002b
Figure 3. Simulated cooling curves and cooling rates of ductile iron in samples with different wall thicknesses: (a) 3 mm; (b) 5 mm; (c) 13 mm; (d) 25 mm.
Metals 11 01634 g003
Figure 4. Microstructure of Si–Mo ductile iron in castings with different wall thicknesses: (a) 3 mm; (b) 5 mm; (c) 13 mm; and (d) 25 mm. No etched samples.
Metals 11 01634 g004
Figure 5. SEM microstructure of Si–Mo ductile iron in castings with different wall thicknesses: (a) 3 mm; (b) 5 mm; (c) 13 mm; and (d) 25 mm. Nital-etched samples.
Metals 11 01634 g005
Figure 6. SEM microstructure of investigated ductile iron in intercellular region (g = 13 mm) with visible pearlite and carbides morphology.
Metals 11 01634 g006
Figure 7. (a) Effect of cooling rate on maximum degree of undercooling, and (b) relationship between wall thickness and number of graphite nodules and graphite mean diameter.
Metals 11 01634 g007
Figure 8. Graphite particle size distribution: (a) casting with wall thickness of 3 mm; (b) 5 mm; (c) 13 mm; (d) 25 mm.
Metals 11 01634 g008
Figure 9. Ferrite grain size as function of cooling rate at beginning of eutectoid temperature Te.
Metals 11 01634 g009
Figure 10. Relationship between longitudinal ultrasonic wave velocity cL and (a) wall thickness and (b) number of graphite nodules NA.
Metals 11 01634 g010
Table 1. Chemical compositions of EN-GJS-SiMo45-6 alloy (wt. %).
CSiMnCuNiCrMgMoSFe
3.164.630.180.010.010.020.0360.650.01Bal.
Table 2. Undercooling and cooling rates at eutectic and eutectoid transformation temperatures.
g, mmUndercooling
(°C)
Cooling Rate at Te
(°C/s)
Cooling Rate at Ts
(°C/s)
337.7626.783.57
532.3314.111.42
1325.014.090.30
2521.481.480.29
Table 3. Image analysis results for samples with four wall thicknesses.
Wall Thickness, mmGraphite Nodule Count, 1/mm2Graphite Nodularity, %Graphite Mean Diameter, µmFerrite Volume Fraction, %Ferrite Grain Size, µm
3608 ± 359115.32 ± 0.2586 ± 220.17 ± 2.56
5411 ± 289019.17 ± 0.2885 ± 223.23 ± 3.71
13201 ± 138726.27 ± 1.1181 ± 234.17 ± 2.44
25168 ± 158527.19 ± 0.8178 ± 236.73 ± 4.19
Table 4. Velocity of longitudinal ultrasonic wave vs. wall thickness.
g, mmcL, m/s
35745
55714
135698
255685
Publisher’s Note: MDPI stays neutral with regard to jurisdictional claims in published maps and institutional affiliations.

