Article

The Effect of Nickel on the Viscosity of Iron-Based Multicomponent Melts

by
Vladimir S. Tsepelev
1,*,
Yuri N. Starodubtsev
1,2 and
Viktor V. Konashkov
1,2
1
Research Center for Physics of Metal Liquids, Ural Federal University, 620002 Yekaterinburg, Russia
2
Gammamet Research and Production Enterprise, 620131 Yekaterinburg, Russia
*
Author to whom correspondence should be addressed.
Metals 2021, 11(11), 1724; https://doi.org/10.3390/met11111724
Submission received: 30 September 2021 / Revised: 24 October 2021 / Accepted: 25 October 2021 / Published: 28 October 2021
(This article belongs to the Special Issue Modeling and Simulation of Metal Processing)

Abstract

:
In this work, we investigated the temperature dependence of the kinematic viscosity of multicomponent Fe72.5−xNixCu1Nb2Mo1.5Si14B9 melts with a Ni content of up to 12.7 at. %. The peculiarities of the temperature dependence of Ni-containing melts were explained by the tendency of Ni atoms to surface segregation. Ni atoms are concentrated near the interfaces of the liquid and solid phases in the mushy zone at the stage of melting and restrain the melting of the solid phase. With increasing Ni content, the Arrhenius type of viscous flow begins at a higher temperature. Ni atoms are concentrated at the periphery of clusters, increasing their size and decreasing their mobility. The movement of Ni-containing clusters increases the activation energy and decreases the kinematic viscosity. The change in the activation energy at a temperature of about 1700 K was associated with a liquid-liquid structure transition (LLST). This structural transition is reversible since it is observed both at the heating and cooling stages. The increase in kinematic viscosity at temperatures above 1900 K was associated with the decomposition of high-temperature clusters based on cementite and silicon oxides.

1. Introduction

The viscosity is associated with the movement of liquid particles (atoms, molecules, clusters) relative to each other, and it depends on the diffusion mobility of these particles. According to the Stokes-Einstein relation, the diffusion coefficient is inversely proportional to viscosity. Since the temperature dependence of the diffusion coefficient is expressed by the Arrhenius equation [1], the viscosity can be represented in the form [2]:
ν = ν 0 e E a R T ,
where ν is the kinematic viscosity (m2·s−1), ν0 is the pre-exponential factor with the dimension of the kinematic viscosity, Ea is the activation energy of the viscous flow (J·mol−1), R is the gas constant (J·K−1·mol−1), T is the absolute temperature (K).
From relation (1) it follows that the viscosity decreases with increasing temperature at the constant activation energy Ea. The activation energy depends on the size and interaction of the particles participating in the viscous flow, and the transition of individual particles to a new state occurs after the particle reaches the activated state. Therefore, we can assume that the melt structure remains sufficiently stable if the activation energy does not change. The change in the activation energy on the temperature dependence of the viscosity is associated with a change in melt structure, and this phenomena is interpreted as a liquid-liquid structure transition (LLST) [3,4,5,6,7,8,9,10,11].
LLST is often observed in multicomponent melts since different groups of atoms within them can form clusters that are stable over a wide temperature range. One of the materials of great practical importance is the Fe-Cu-Nb-Si-B alloy, which is used for the production of nanocrystalline soft magnetic materials [12]. At the initial stage of production, a precursor is obtained from the melt in the form of a thin metal ribbon with an amorphous structure. Then, as a result of heat treatment, a nanocrystalline structure with an average grain size of about 10 nm is formed in the ribbon. Together with Nb, the alloy can also contain Mo, V or other inhibitors of nanograin growth, which affect the crystallization process [13]. The alloy may also contain Ni or Co, which affects the constant of magnetic anisotropy and makes it possible to obtain nanocrystalline material with a linear magnetization curve and different levels of magnetic permeability [14,15,16]. Ni atoms have negative energy of surface segregation in iron [17,18]. Therefore, Ni atoms tend to be located near the free surface, slowing down the motion of grain boundaries and smoothing the peak of heat release in the process of nanocrystallization [19]. These features should affect the temperature dependence of the viscosity of Ni-containing iron-based melts.
In this work, we investigated the temperature dependences of the kinematic viscosity of the multicomponent Fe72.5−xNixCu1Nb2Mo1.5Si14B9 melt with a Ni content of up to 12.7 at. %.

2. Materials and Methods
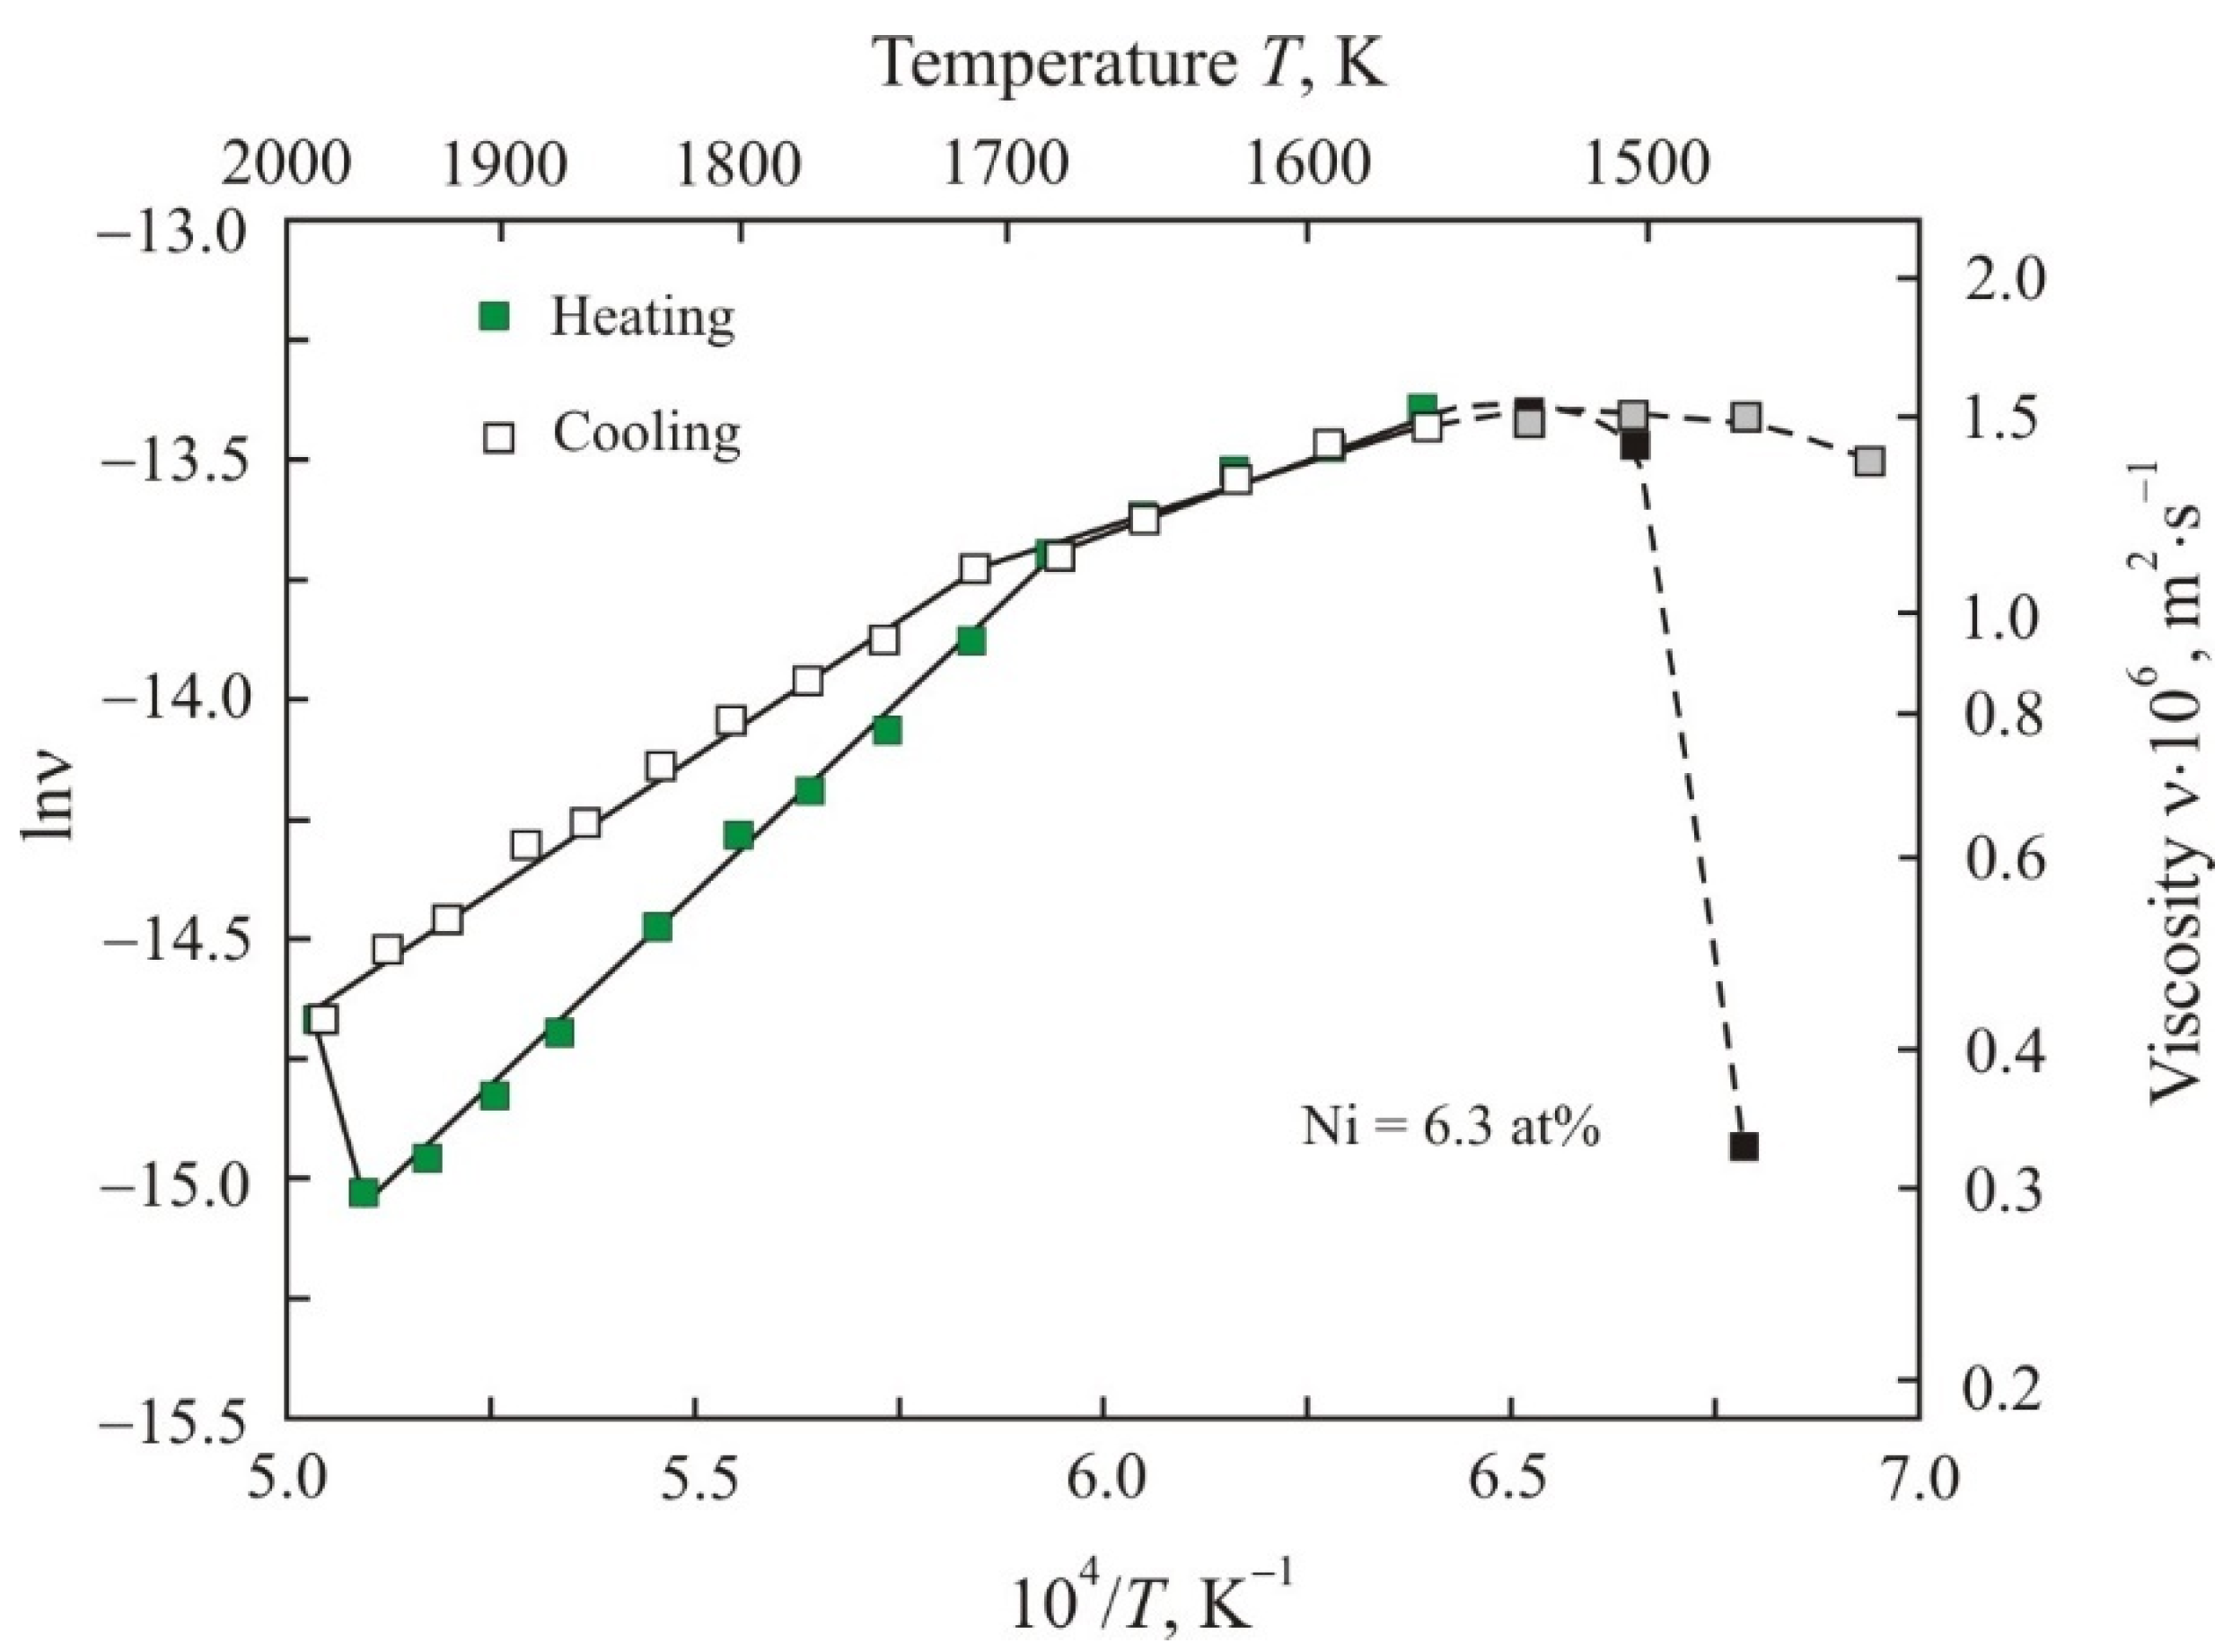
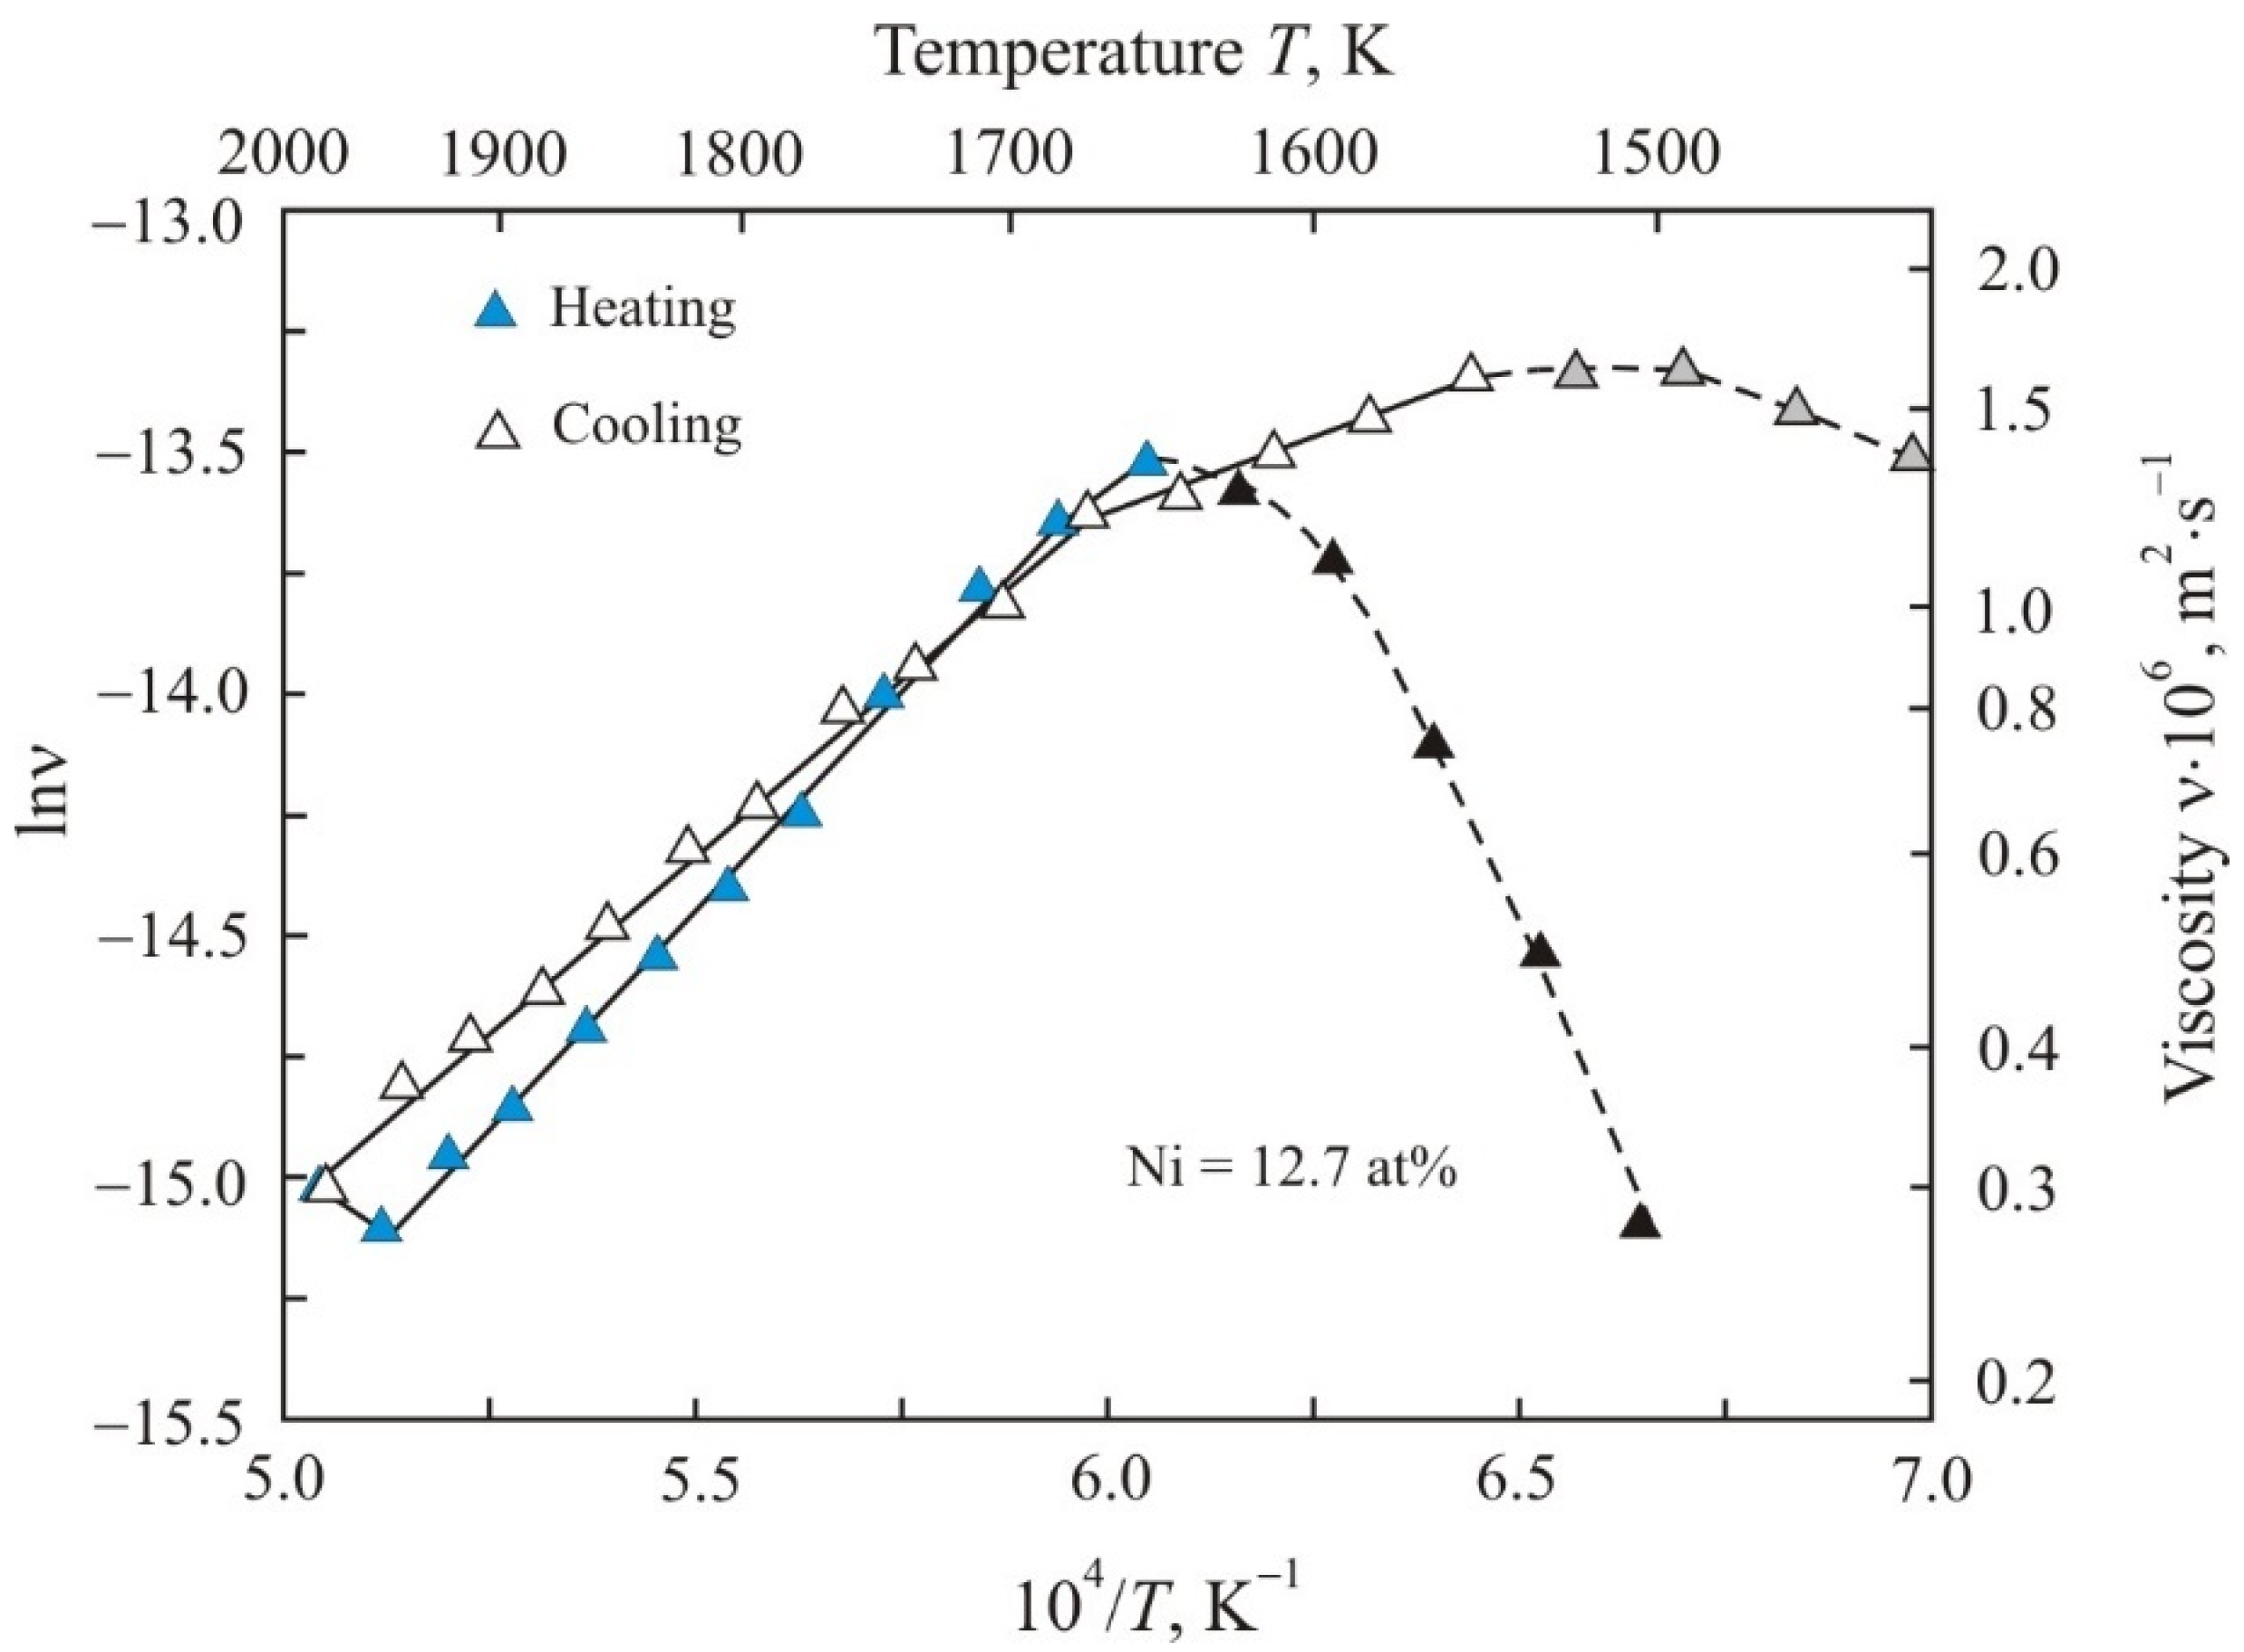
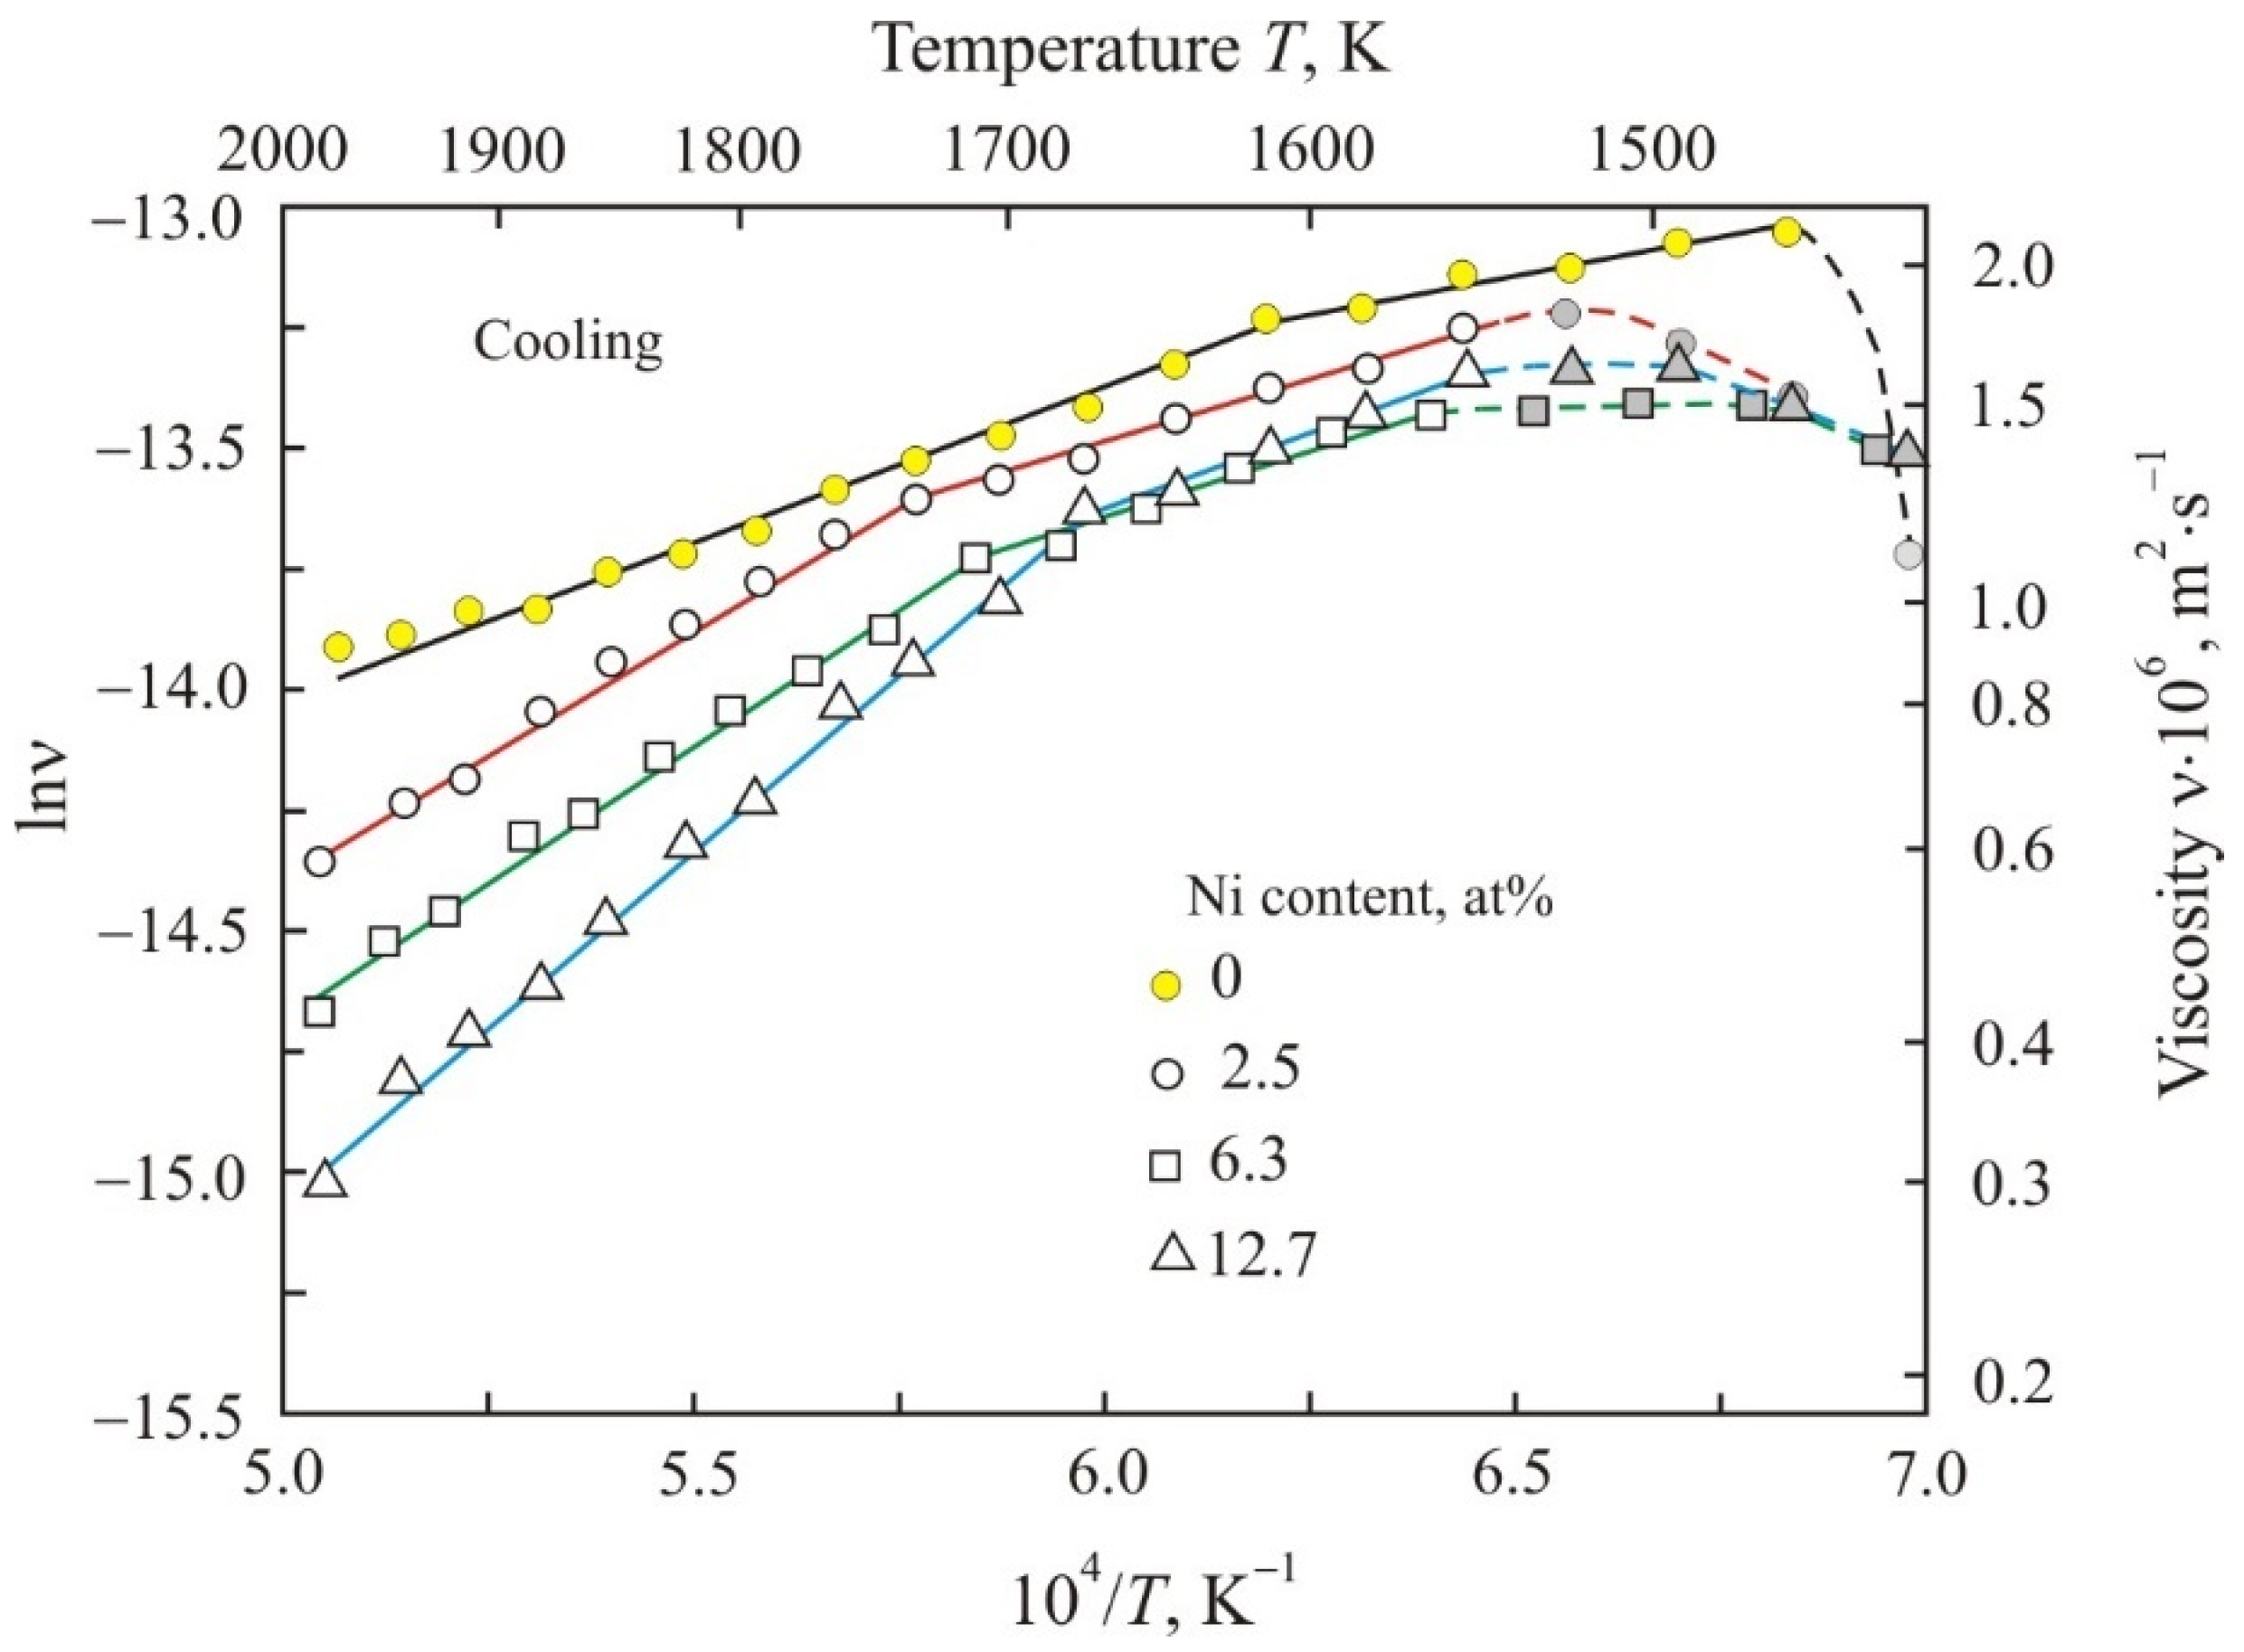
Fe72.5−xNixCu1Nb2Mo1.5Si14B9 alloys with Ni = 0; 2.5; 6.3; 12.7 at. % were smelted in an induction vacuum furnace at a temperature of 1820 K and cooled in a flat mold. The finished ingots were melted again at 1775 K, the melt was held at this temperature for 5 min, and then an amorphous ribbon with a thickness of 20 μm thick and 10 mm wide was obtained using the planar flow casting process. The temperature dependence of the kinematic viscosity was measured on toroidal samples wound from an amorphous ribbon, which was placed in a beryllium oxide cup. The determination of the kinematic viscosity was carried out by the method of torsional vibrations in an atmosphere of pure helium under a pressure of 105 Pa [20]. Using this method, the logarithmic decrement was measured, and the kinematic viscosity was calculated from the formulas connecting the logarithmic decrement with the kinematic viscosity. Before the measurement, the melt was kept at a predetermined temperature for 8 min to stabilize the structural state. During heating and cooling, the melt temperature was changed with a step of 30 K at a speed of 30 K/min. The error in the determination of the kinematic viscosity was 3%.
In addition to the main chemical elements, the content of Al, C, N and O was also determined in the alloy. These elements have a high electronegativity and form strong bonds with metals. The nature of these impurities is associated with the charge materials. There is no interaction of the melt with the beryllium oxide cup, as evidenced by the appearance of the cup after high-temperature studies. The content of the main chemical elements, as well as aluminum and carbon, was determined using a DFS-500 Optical Emission Spectrometer, OKB Spectr, Saint-Petersburg, Russia. An ARL 4460 Metals Analyzer Thermo Fisher Scientific, Walthan, MA, USA, was used to determine the N and O content. The error in determining the chemical composition was 1%.

3. Results

Figure 1, Figure 2 and Figure 3 show the kinematic viscosity on a natural logarithmic scale lnν as a function of the inverse absolute temperature T−1 upon heating to maximum temperature Tmax = 1985 K and cooling of the Fe72.5−xNixCu1Nb2Mo1.5Si14B9 alloy with Ni = 2.5 (1); 6.3 (2); and 12.7 at. % (3) as Arrhenius plot:
ln ν = ln ν 0 + E a R T ,
The viscosity should decrease with increasing temperature. However, in the low-temperature regions, which are marked with gray and black symbols, the viscosity increases. This temperature region corresponds to the mushy zone, in which the liquid and solid phases coexist [8]. An increase in the logarithmic decrement and calculated viscosity with increasing temperature is caused by an increase in the volume of the liquid phase in the measuring cup. Melts with a Ni content of 2.5 and 6.3 at. % begin to behave like the Arrhenius type at temperatures above 1560 K both at the heating and cooling stages. The melt with a Ni content of 12.7 at. % flows according to the Arrhenius equation when heated above 1685 K, and at the cooling stage, this type of viscous flow takes place down to a temperature of 1560 K.
The linear sections of the Arrhenius plots in Figure 1, Figure 2 and Figure 3 are obtained as a result of linear regression of experimental points and they correspond to a melt flow with constant activation energy Ea. Upon heating, the activation energy changes at a temperature of 1685 K for all Ni-containing melts. On cooling, the transition temperature drops with increasing Ni content. Table 1 shows the calculated activation energies for the low-temperature and high-temperature regions and additionally includes data for the Ni-free melt at the cooling stage. It can be seen that in the low-temperature region the activation energy is lower and has approximately the same value during heating and cooling. In the high-temperature region, the activation energy is noticeably higher, and the highest value of Ea is in the melt with a high Ni content.
At temperatures above 1900 K at the heating stage, the drop in kinematic viscosity is replaced by an increase, see Figure 1, Figure 2 and Figure 3. An increase in viscosity is observed at temperatures above 1915 K in an alloy with a Ni content of 2.5 at. % and at temperatures above 1955 K in alloys with a Ni content of 6.3 and 12.7 at. %.
Figure 4 and Figure 5 show the kinematic viscosity on a natural logarithmic scale lnν as a function of the inverse absolute temperature T−1 separately for heating (4) and cooling (5) in Fe72.5−xNixCu1Nb2Mo1.5Si14B9 alloys. It follows from these figures that, at the heating stage in the temperature range of 1700–1900 K, Arrhenius plots differ insignificantly, while the viscosity is higher in the melt with a low Ni content. After heating to the maximum temperature Tmax = 1985 K, the melt with a low Ni content of 2.5 at. % has the highest viscosity. The maximum temperature is the starting point for the cooling stage. Therefore, at the cooling stage in the temperature range of 1700–1900 K, melts with a low Ni content have a flatter Arrhenius plot and lower activation energy, see Table 1. In general, at the cooling stage, the kinematic viscosity is lower in alloys with a higher Ni content.

4. Discussion

When discussing the experimental results, we will estimate the activation energy of a viscous flow. The activation energy is equal to the energy that the particle must receive in order to overcome the potential barrier and move to an empty place (hole) in the melt. From general considerations, it follows that the activation energy is higher for large particles, which have a large size and mass. Based on the theory of the transition state [21], the following relationship was obtained between the reduced activation energy Ea/RT and the size of particle a participating in a viscous flow [22]:
E a R T = C 1 + 0 . 5 ln a ,
where C1 is a constant, which in general depends on temperature. Thus, the activation energy of viscous flow increases with increasing particle size.
When discussing the results, we will also use the relationship between particle size and viscosity. Analysis of simple pure metals at the melting temperature, at which oscillations of atoms about equilibrium positions prevail, showed [23,24] that the viscosity decreases with an increase in the ratio of the atom mass to the square of their size m/a2. The viscosity should decrease with an increase in the number of atoms in the cluster [23]. In the theory of the transition state [21], the motion of one layer of liquid relative to another occurs due to the transition of a particle from one equilibrium state to another in the same layer. In this case, with an increase in the particle size, their velocity increases and the viscosity decreases. A decrease in viscosity with an increase in the particle size in nanofluid was observed experimentally [25].
Figure 4 shows that with an increase in the Ni content, the Arrhenius type of viscous flow begins at a higher temperature. Boron is introduced into the Fe72.5−xNixCu1Nb2Mo1.5Si14B9 alloy to lower the melting point. Thus, the melting point of the Fe83B17 eutectic alloy is 1450 K. Therefore, the liquid phase in the mushy zone is formed on the basis of iron-boron, in which Cu, Si and Ni are also present. Ni atoms have a high negative energy of surface segregation and their concentration is highest near the interfaces. It can be assumed that the high concentration of Ni near the interface between the solid and liquid phases restrains the melting of the residual solid phase in the mushy zone. This process also contributes to the active transition of Ni to the liquid phase and the depletion of the solid phase. Similar experimental results were obtained when studying the composition of the solid, partially melted and liquid phases in Ni-containing alloys [26,27].
Electronegativity on the Luo-Benson scale for the main chemical elements Fe, Ni, Cu, Nb, Mo, Si and B are 1.72; 1.90; 2.30; 1.43; 1.46; 3.41 and 3.66, respectively [28]. Boron atoms are most strongly associated with iron atoms since this pair of elements has the most distinct electronegativities. Therefore, in the low-temperature region, the most stable clusters in the melt are formed on the basis of iron boride Fe2B with a melting point of 1663 K [29]. Clusters based on FeSi with a melting point of 1683 K are less stable and have a lesser effect on structural transformations [30]. Therefore, the change in the activation energy upon heating above 1685 K, see Figure 4 and Table 1, can be associated with the decay of Fe2B-based clusters and the formation of new clusters based on iron triboride FeB3. A similar model of structural transformations was proposed in [6]. The narrow temperature range of LLST indicates that only one type of structural transition predominates.
From Figure 4 and Table 1, it follows that upon heating after the transition to the high-temperature region, the activation energy increases. As we assumed earlier, with an increase in the activation energy, the size and mass of the clusters participating in the viscous flow increase. As a result of the transformation of Fe2B-based clusters into FeB3-based clusters, the number of new B-containing clusters is reduced by three times, while five iron atoms are released for each new cluster. As the temperature rises, the structure of the melt should become more disordered, and various atoms and clusters tend to have a more chaotic distribution. A more uniform arrangement of atoms and clusters corresponds to a larger-scale structure of the multicomponent melt [31]. Clusters can be joined by Ni, Nb, Mo atoms, as well as free Fe and Si atoms, which form a cloud around B-containing clusters. The Ni and Nb atoms have a large negative surface segregation energy of −0.65 eV per atom [17]; therefore, they are located at the cluster periphery. Due to coalescence, clusters can form even larger associates—fractal clusters [32,33].
The Fe72.5−xNixCu1Nb2Mo1.5Si14B9 melt contains impurities: C = 0.1; Al = 0.05; O = 0.05; and N = 0.005 at. %. These impurities can form clusters based on compounds whose melting temperatures are between 1900 and 2000 K, that is, in the region of kinematic viscosity growth at the heating stage, see Figure 4. Cementite Fe3C has a melting point of 1923 K [34]. The melting point of silicon oxide in the β-cristobalite form is 1996 K, and in the β-tridymite form, it is 1943 K [30]. Aluminum oxide Al2O3 and aluminum nitride AlN have a melting point above 2300 K. An increase in kinematic viscosity at temperatures above 1900 K can be associated with the decomposition of high-temperature clusters based on cementite and silicon oxides. A similar increase in viscosity in the high-temperature region was observed in liquid pipe steel [31]. The growth of the viscosity in the high-temperature region in Figure 4 corresponds to the beginning of LLST. With an increase in temperature and after the end of the structural transition, the Arrhenius plot should again become linear with a certain activation energy. This was previously demonstrated in [23] for Fe84.5Cu0.6Nb0.5Si1.5B8.6P4C0.3 melt.
The wide temperature transition region indicates that this process involves several types of clusters based on phases with different melting points. The maximum heating temperature Tmax = 1985 K forms the melt structure at the stage of decomposition. At this temperature, the melt with a low Ni content has the highest viscosity, i.e., clusters break up into smaller particles. According to the small-scale structure obtained by the melt at the maximum heating temperature, the melt with a low Ni content has the lowest activation energy, see Table 1.
At the cooling stage, there is also a transition temperature at which the activation energy of the viscous flow changes. The transition temperature is about 1700 K and it is slightly higher than the temperature of 1685 K for LLST at the heating stage. This allows us to assume that the structural transition of Fe2B-based clusters into FeB3-based clusters is reversible.
It follows from Figure 4 and Figure 5 that melts with Ni have lower viscosity and higher activation energy. This effect of Ni can also be associated with the tendency of Ni atoms to surface segregation. It can be assumed that Ni atoms are concentrated at the periphery of B-containing clusters, increasing their size and decreasing their mobility.

5. Conclusions

The temperature dependence of the kinematic viscosity of multicomponent Fe72.5−xNixCu1Nb2Mo1.5Si14B9 melts with a Ni content of up to 12.7 at. % was studied. An increase in the Ni content decreases the melt viscosity and increases the activation energy of the viscous flow. The change in the activation energy at a temperature of about 1700 K was associated with LLST, as a result of which Fe2B-based clusters disintegrate and new clusters based on iron triboride FeB3 are formed. This structural transition is reversible since it is observed both at the heating and cooling stages. The increase in kinematic viscosity at temperatures above 1900 K was associated with the decomposition of high-temperature clusters based on cementite and silicon oxides. At the maximum heating temperature Tmax = 1985 K, a structure is formed, which is the initial one for the activation energy at the cooling stage. The specific features of the temperature dependence of the kinematic viscosity in Ni-containing melts can be explained by the tendency of Ni atoms to surface segregation. Ni atoms are concentrated near the interface between the liquid and solid phases in the mushy zone at the stage of melting and restrain the melting of the solid phase. Due to the increased Ni content in melts, the Arrhenius type of viscous flow begins at a higher temperature. Ni atoms are concentrated at the periphery of B-containing clusters, increasing their size and decreasing their mobility. The movement of such clusters leads to a decrease in the kinematic viscosity and an increase in the activation energy.

Author Contributions

Conceptualization, V.S.T., Y.N.S. and V.V.K.; methodology, Y.N.S.; software, V.V.K.; validation, Y.N.S. and V.S.T.; formal analysis, V.S.T. and Y.N.S.; investigation, V.V.K.; resources, V.S.T.; data curation, V.S.T.; writing—original draft preparation, Y.N.S.; writing—review and editing, Y.N.S.; visualization, Y.N.S.; supervision, V.S.T. and V.V.K.; project administration, V.S.T.; funding acquisition, V.S.T. All authors have read and agreed to the published version of the manuscript.

Funding

This research received no external funding.

Institutional Review Board Statement

Not applicable.

Informed Consent Statement

Not applicable.

Data Availability Statement

The data presented in this article is available upon request from the corresponding author.

Acknowledgments

The article was made within the framework of state work No. FEUZ-0836-0020.

Conflicts of Interest

The authors declare no conflict of interest.

References

  1. Mehrer, H. Fundamentals, Methods, Materials, Diffusion-Controlled Processes. In Diffusion in Solids; Springer: Berlin/Heidelberg, Germany; New York, NY, USA, 2007; pp. 127–132. [Google Scholar]
  2. Frenkel, J. Kinetic Theory of Liquids; Nauka: Leningrad, Russia, 1975; pp. 224–228. [Google Scholar]
  3. Tanaka, H. General view of a liquid-liquid phase transition. Phys. Rev. E 2000, 62, 6968–6976. [Google Scholar] [CrossRef]
  4. Vasin, M.G.; Lad’yanov, V.I. Structural transitions and nonmonotonic relaxation processes in liquid metals. Phys. Rev. E 2003, 68, 051202. [Google Scholar] [CrossRef] [Green Version]
  5. Zu, F.-Q. Temperature-induced liquid-liquid transition in metallic melts: A brief review on the new physical phenomenon. Metals 2015, 5, 395–417. [Google Scholar] [CrossRef]
  6. Dong, B.; Zhou, S.; Qin, J.; Li, Y.; Chen, H.; Wang, Y. The hidden disintegration of cluster heterogeneity in Fe-based glass-forming. Prog. Nat. Sci. Mater. 2018, 28, 696–703. [Google Scholar] [CrossRef]
  7. Dong, B.S.; Zhou, S.X.; Wang, Y.G.; Li, Y.; Qin, J.Y.; Li, G.Z. Revealing a structure transition in typical Fe-based glass-forming alloy. J. Non-Cryst. Solids 2018, 498, 305–308. [Google Scholar] [CrossRef]
  8. Zhao, X.; Wang, C.; Zheng, H.; Tian, Z.; Hu, L. The role of liquid-liquid transition in glass formation of CuZr alloys. Phys. Chem. Chem. Phys. 2018, 19, 15962–15972. [Google Scholar] [CrossRef]
  9. He, Y.; Li, J.; Wang, J.; Kou, H.; Beagunon, E. Liquid-liquid structure transition and nucleation in undercooled Co-B eutectic alloys. Appl. Phys. A 2017, 123, 391. [Google Scholar] [CrossRef]
  10. Tsepelev, V.S.; Starodubtsev, Y.N.; Kochetkova, Y.A. Anomalous temperature dependence of kinematic viscosity in a multicomponent metal melts. Key Eng. Mater. 2021, 902, 3–8. [Google Scholar]
  11. Tsepelev, V.S.; Starodubtsev, Y.N.; Konashkov, V.V.; Kochetkova, Y.A. Kinematic viscosity and electrical resistivity of a multicomponent melt due to liquid-liquid structure transition. Key Eng. Mater. 2021, 904, 11–116. [Google Scholar]
  12. Yoshizawa, Y.; Oguma, S.; Yamauchi, K. New Fe-based soft magnetic alloys composed of ultrafine grain structure. J. Appl. Phys. 1988, 64, 6044–6046. [Google Scholar] [CrossRef]
  13. Tsepelev, V.S.; Starodubtsev, Y.N. Nanocrystalline soft magnetic iron-based materials from liquid state to ready product. Nanomatarials 2021, 11, 108. [Google Scholar] [CrossRef] [PubMed]
  14. Yoshizawa, Y.; Fujii, S.; Ping, D.H.; Ohnuma, M.; Hono, K. Magnetic properties of nanocrystalline FeMCuNbSiB alloys (M: Co, Ni). Scr. Mater. 2003, 48, 863–868. [Google Scholar] [CrossRef]
  15. Kataev, V.A.; Starodubtsev, Y.N.; Mikhalitsyna, E.A.; Belozerov, V.Y.; Tsyngalov, R.V. Magnetic properties and induced anisotropy of nanocrystalline Fe72.5−xNixCu1.1Nb1.9Mo1.5Si14.3B8.7 alloys. Phys. Met. Metallogr. 2017, 118, 558–563. [Google Scholar] [CrossRef]
  16. Lukshina, V.A.; Dmitrieva, N.V.; Volkova, E.G.; Shishkin, D.A. Magnetic properties of the Fe63.5Ni10Cu1Nb3Si13.5B9 alloy nanocrystallized in the presence of tensile stresses. Phys. Met. Metallogr. 2019, 120, 320–324. [Google Scholar] [CrossRef]
  17. Ruban, A.V.; Skriver, H.L.; Nørskov, J.K. Surface segregation energy in transition-metal alloys. Phys. Rev. B 1999, 59, 15990–16000. [Google Scholar] [CrossRef] [Green Version]
  18. Ruban, A.V. On segregation in multicomponent alloys: Surface segregation in austenite and FeCrCoNiMn alloys. Comp. Mater. Sci. 2021, 187, 110080. [Google Scholar] [CrossRef]
  19. Tsepelev, V.S.; Starodubtsev, Y.N.; Wu, K.M. Influence of Ni on crystallization and magnetic properties of Fe72.5−xNixCu1.1Nb2Mo1.5Si14B9 alloys. J. Cryst. Growth 2019, 528, 125256. [Google Scholar] [CrossRef]
  20. Tsepelev, V.; Konashkov, V.; Starodubtsev, Y.; Belozerov, Y.; Gaipishevarov, D. Optimum regime of heat treatment of soft magnetic amorphous materials. IEEE Trans. Magn. 2012, 48, 1327–1330. [Google Scholar] [CrossRef]
  21. Glasstone, S.; Laidler, K.; Eyring, H. The Kinetics of Chemical Reactions, Viscosity, Diffusion and Electrochemical Phenomena. In The Theory of Rate Processes; McGraw Hill: New York, NY, USA; London, UK, 1941; pp. 477–551. [Google Scholar]
  22. Starodubtsev, Y.N.; Tsepelev, V.S.; Tsepeleva, N.P. Kinematic viscosity of multicomponent FeCuNbSiB-based melts. Nanomaterials 2021, 11, 1042. [Google Scholar] [CrossRef]
  23. Starodubtsev, Y.N.; Tsepelev, V.S. Analisys of the kinematic viscosity and self-diffusion of liquid metals at the melting temperature. High Temp. 2021, 59, 306–311. [Google Scholar]
  24. Starodubtsev, Y.N.; Tsepelev, V.S. Analisys of surface tension and viscosity of liquid metals. Metall. Mater. Trans. B 2021, 52, 1886–1890. [Google Scholar] [CrossRef]
  25. Koca, H.D.; Doganay, S.; Turgut, A.; Tavman, I.H.; Saidur, R.; Mahbubul, I.M. Effect of particles size on viscosity of nanofluids: A review. Renew. Sust. Energy Rev. 2018, 82, 1664–1674. [Google Scholar] [CrossRef] [Green Version]
  26. Thi, H.N.; Drevet, B.; Debierre, J.M.; Camel, D.; Dabo, Y.; Billia, B. Preparation of the initial solid-liquid interface and melt in directional solidification. J. Cryst. Growth 2003, 253, 539–548. [Google Scholar]
  27. Mas, F.; Tassin, C.; Roch, F.; Yescas, M.; Todeschini, P.; Bréchet, Y. Growth morphologies and primary solidification modes in a dissimilar weld between a low-alloy steel and an austenitic stainless steel. Metals 2018, 8, 284. [Google Scholar] [CrossRef] [Green Version]
  28. Filippov, G.G.; Gorbunov, A.I. Novel approach to selection of practical scale of electronegativity of atoms. Ross. Chim. Zh. 1995, 39, 39–43. [Google Scholar]
  29. Greim, J.; Schwetz, K.A. Boron carbide, boron nitride, and metal borides. In Ullmann’s Encyclopedia of Industrial Chemistry; Wiley-VCH Verlag: Weinheim, Germany, 2012; Volume 6, pp. 219–236. [Google Scholar]
  30. Kiessling, R.; Lange, N. Non-Metallic Inclusions in Steel; Metallurgiya: Moscow, Russia, 1978; pp. 23–34. [Google Scholar]
  31. Tsepelev, V.S.; Starodubtsev, Y.N.; Tsepeleva, N.P. Thermophysical properties of pipe steel in liquid state. Metals 2021, 11, 1099. [Google Scholar] [CrossRef]
  32. Smirnov, B.M. The properties of fractal clusters. Phys. Rep. 1990, 188, 1–78. [Google Scholar] [CrossRef]
  33. Yang, M.H.; Li, J.H.; Liu, B.X. Fractal analysis on the cluster network in metallic liquid and glass. J. Alloys Comp. 2018, 757, 228–232. [Google Scholar] [CrossRef]
  34. Goldschmidt, H.J. Interstitial Alloys; Butterworths: London, UK, 1967; pp. 88–101. [Google Scholar]
Figure 1. Kinematic viscosity on a natural logarithmic scale lnν as a function of the inverse absolute temperature T−1 upon heating to maximum temperature Tmax = 1985 K and cooling the Fe72.5−xNixCu1Nb2Mo1.5Si14B9 alloys with Ni content 2.5 at. %.
Metals 11 01724 g001
Figure 2. Kinematic viscosity on a natural logarithmic scale lnν as a function of the inverse absolute temperature T−1 upon heating to maximum temperature Tmax = 1985 K and cooling the Fe72.5−xNixCu1Nb2Mo1.5Si14B9 alloys with Ni content 6.3 at. %.
Metals 11 01724 g002
Figure 3. Kinematic viscosity on a natural logarithmic scale lnν as a function of the inverse absolute temperature T−1 upon heating to maximum temperature Tmax = 1985 K and cooling the Fe72.5−xNixCu1Nb2Mo1.5Si14B9 alloys with Ni content 12.7 at. %.
Metals 11 01724 g003
Figure 4. Kinematic viscosity on a natural logarithmic scale lnν as a function of the inverse absolute temperature T−1 upon heating to maximum temperature Tmax = 1985 K the Fe72.5−xNixCu1Nb2Mo1.5Si14B9 alloys with Ni content 2.5; 6.3; and 12.7 at. %.
Metals 11 01724 g004
Figure 5. Kinematic viscosity on a natural logarithmic scale lnν as a function of the inverse absolute temperature T−1 upon cooling after heating to maximum temperature Tmax = 1985 K the Fe72.5−xNixCu1Nb2Mo1.5Si14B9 alloys with Ni content 0; 2.5; 6.3; and 12.7 at. %.
Metals 11 01724 g005
Table 1. The calculated activation energy of viscous flow Ea in Fe72.5−xNixCu1Nb2Mo1.5Si14B9 melt for linear sections of Arrhenius plots.
Ni Content (at. %)Activation Energy Ea (kJ·mol−1)
HeatingCooling
T > 1700 KT < 1700 KT > 1700 KT < 1700 K
05524
2.5141428843
6.3134549544
12.715112050
Publisher’ Note: MDPI stays neutral with regard to jurisdictional claims in published maps and institutional affiliations

