
Experimental Study on FGH95 Superalloy Turbine Disk Joint Material by Oblique Laser Shock Processing
by
 , ,
, ,
Chaohui Lin
1,2,* ,
,
Longwei Yu
2,
Jingling Zeng
2,
Hebin Wu
1,2,
Xiaojun Guo
3,
Jianxin Liu
3 and
Yongkang Zhang
1,2,* 1
State Key Laboratory of Precision Electronic Manufacturing Technology and Equipment, Guangdong University of Technology, Guangzhou 510006, China
2
School of Electromechanical Engineering, Guangdong University of Technology, Guangzhou 510006, China
3
AECC Hunan Aviation Powerplant Research Institute, Zhuzhou 412002, China
*
Authors to whom correspondence should be addressed.
Metals 2021, 11(11), 1770; https://doi.org/10.3390/met11111770
Submission received: 3 October 2021
/
Revised: 28 October 2021
/
Accepted: 30 October 2021
/
Published: 3 November 2021
Abstract
:The FGH95 superalloy used for turbine disk manufacturing was strengthened by the oblique laser shock processing (OLSP). The laser energy, beam diameter, and number of impacts were selected as the test factors, and the three-factor three-level oblique laser shock processing orthogonal test was carried out. Based on the analysis of variance and range of the surface residual stress, microhardness, roughness, tensile strength, and yield strength of FGH95 superalloy after LSP, the factor level combination of relative best comprehensive performance was obtained. The results showed that, within the 10% confidence level, the order of influencing factors with significant difference is: laser energy > number of impacts > beam diameter. Compared with the unimpacted sample, the microhardness of the material surface was increased by about 25% after OLSP. With the increase of laser energy, the dimple distribution of the sample was more uniform, smaller in size, and shallower in depth. However, the thickness of the affected layer was very low, and there was no significant effect on the tensile properties. In general, and under the test conditions selected in this study, the combination of 8 Joule laser energy, 3 mm beam diameter, and three impacts can be selected to obtain the best comprehensive performance. The results of this paper provide a reference for the OLSP of the FGH95 superalloy turbine disk and other aero engine parts.
1. Introduction
As the most widely used structural materials in aircraft and aerospace fields, nickel-based superalloys have been widely used due to their excellent tensile and creep properties and high temperature stability after long exposure [1]. The FGH95 alloy is the first generation of precipitation-strengthened high tensile nickel-based powder superalloys, specifically developed for aero engines in China. It is based on the gamma phase (γ-phase), and the content of the gamma prime (γ’) enhanced phase accounts for 50–55% of the total volume. It has high thermal stability at 650 °C and can maintain high strength. FGH95 alloy has been widely used in many essential parts of aero engine turbine disks, turboshafts, and turbine disk baffle bearings by alternating cyclic load under a high-temperature working environment [2]. With the required continuous improvements in the working performance of the new generations of aero engines, the various performance indicators of FGH95 superalloys have put forward higher requirements.
In order to improve the performance of the FGH95 superalloy, several scholars have carried out numerous studies using various processes such as powder pretreatment, alloy forming, and heat treatment. The FGH95 superalloy has been studied and analyzed for its strength, fatigue life, and other performance indicators by means of the plasma rotating electrode process (PREP) for powder superalloy preparation [3], spray forming [2], isothermal forging [4], solid solution heat treatment [5], and ageing treatment [6]. In general, the preparation and heat treatment process of the FGH95 superalloy have made more progress, but studies related to enhancing the performance of the FGH95 superalloy from the perspective of surface treatment processing are still in the initial stage.
Laser shock processing (LSP), as a new surface modification technology for materials, has several advantages such as non-contacting behavior, small heat-affected zone (HAZ), strong controllability, and good adaptability as compared to traditional technologies such as shot peening, cold extrusion, and heat treatment [7]. Zhang et al. analyzed the microstructure, residual stress distribution, and equivalent strain distribution of 7075-T6 aviation aluminum alloy after LSP. The results showed that LSP gave rise to grain refinement. The residual compressive stress layer with a thickness of about 0.5 mm was induced on the surface, which improved the strength and fatigue properties of the 7075-T6 aerospace aluminum alloy. The most uniform deformation peened area can be obtained by using a 58% overlap ratio in LSP, avoiding stress concentration and improving fatigue life [8]. Park et al. experimentally investigated the effects of LSP on friction characteristics of JIS-AC8A aluminum–silicon alloy, a piston material for automotive engines. The results showed that the surface hardness increased by 22% and that compressive residual stress enhanced significantly. Friction coefficients of the laser peened surface decreased by 19%, 41%, and 45% from those of the unimpacted surface in 50, 100, and 150 N normal load conditions, respectively, demonstrating the effectiveness of laser shock peening in reducing surface friction [9]. LSP technology helps the surface of the metals to obtain a high amplitude of residual stress and greatly improves the material strength, hardness, and fatigue life; therefore, it has been widely used in the surface strengthening processing of various metal materials. Several extensive experimental studies using LSP technology for the treatment of nickel-based superalloy materials were carried out. Li et al. [10] repaired the surface of the FGH96 superalloy using LSP technology and tested and analyzed its residual stress and fatigue life. The authors found that the residual stress induced by the laser shock clearly reduced the propagation rate of the fatigue crack. Gao et al. [11] conducted several comparative tests of LSP and shot peening technologies on the FGH97 superalloy to measure the residual stress and rotational bending fatigue performance at 650 °C. The former was found to have a deeper residual stress layer and better surface roughness than the latter, and the residual stress had less relaxation under high-temperature fatigue loading. Tang et al. [12] conducted tensile tests on the surface of a GH3039 superalloy sample with a thickness of 2 mm using different LSP technologies. The results showed that as the laser energy increased, the tensile properties of the alloy noticeably improved, but the plasticity obviously reduced. Luo et al. [13] performed LSP on K4030 nickel-based superalloy turbine blades and found that the laser power density and number of impacts had a significant influence on the microhardness and the residual stress amplitude and depth, which significantly improved the fatigue life of the turbine blades by up to 2.4 times. Karthik et al. [14] performed the uncoated LSP on a nickel-based superalloy called Inconel 600 to measure its residual stress, microhardness, microstructure, and surface roughness. The authors optimized the LSP parameters to obtain larger and deeper residual stress and relatively small surface roughness. In summary, previous research related to LSP technology was mainly performed on nickel-based superalloy, and there are fewer experimental studies on the LSP technology of the FGH95 superalloy.
2. Objectives and Scope
The main objective was to evaluate the processing of FGH95 superalloy used for turbine disk manufacturing. An orthogonal test was carried out, and variance analysis and range analysis were carried out on the measured index data. Figure 1 shows the complex shape of the mortise area of the turbine disks and turbine blade, in which the structure of the mortise tooth and groove is narrow. Typical problems such as poor beam accessibility and optical path interference occur when the laser is impacted perpendicular to the workpiece surface in the actual machining process, which cannot achieve the strengthening effect. Therefore, the oblique incidence of the laser beam was used to strengthen the impact, to explore the influence of the LSP parameters on the properties of FGH95 superalloy materials, and to optimize the LSP parameters [15]. This provides a reference for the practical processing test of FGH95 superalloy turbine disk by OLSP.
3. Materials and Methods
3.1. Experimental Materials
3.2. Experimental Treatment and Arrangement
First, the FGH95 superalloy material was machined into metal tensile standard samples using the wire cutting process. The dimensions are shown in Figure 2. The surface of the samples to be machined was polished with silicon carbide (SiC) abrasive paper of 240# to 2000# then polished with diamond polish and wool felt polishing cloth to make the surface roughness as uniform as possible. Finally, the sample was inserted into acetone solution for ultrasonic cleaning to remove oil and dirt and then dried with a hairdryer in cold air.
The laser shock strengthening equipment is the PROCUDO200 laser shock peening system designed and manufactured by LSP Technologies in the United States. As shown in Figure 2, the processing area was 50 mm × 12.5 mm, the ellipse represents the beam area of each impact, and the processing route was S-shaped to ensure the uniform distribution and comprehensive coverage of residual stress in the effective area of the sample. For the sample of multiple impacts, and after each complete route, the sample was re-pasted with black tape to ensure the surface of the sample was not directly ablated by the laser. After the shocking, the samples were ultrasonically cleaned with anhydrous ethanol to remove the residual black tape and any other impurities on the surface.
During the oblique laser shock processing (OLSP), the confining layer was 1 to 2 mm in thickness of flowing deionized water, which extends the expansion time of plasma and increases the amplitude and duration of the impact pressure. The absorption layer was 1 mm thick black tape for laser shock strengthening produced by 3M company in the United States, which can absorb the laser energy and protect the sample surface from ablation simultaneously. The schematic diagram of the OLSP is shown in Figure 3a, and the effect of the sample covered with the black tape after shocking is shown in Figure 3b.
In this study, and in order to explore the effect of the selected test factors on the index, the OLSP parameters were set as fixed values, with the exception of the test factors. In order to ensure the uniform distribution of residual stress on the sample surface, and also to make sure that the residual stress between the beam areas did not cancel each other, the laser beam lap rate was set to 30%, the laser pulse width was set to 20 ns, the laser wavelength was set to 1064 nm, and the working frequency was set to 20 Hz. The larger the oblique incident angle of the laser beam, the smaller the laser power density received by the material surface and the less noticeable strengthening effect. The oblique incident angle of the laser beam was very small and could not be distinguished from the vertical impact. The included angle between the laser beam and the normal line of the sample surface was set to 30°. The three parameters of laser energy, spot diameter, and number of impacts were selected as test factors through the literature [9,10,11], and three levels were selected for OLSP tests on FGH95 superalloy. The test factors and corresponding level values are shown in Table 2.
Due to the high cost and long test period, the orthogonal test was adopted in this study to save manpower and material resources and avoid time-consuming procedures by using the comprehensive test. On the premise of ensuring a small error in the test, the test workload can be greatly reduced and the reasonable and effective arrangement of the test factors can be made. In addition, the variance analysis can be used to process the test data to obtain the influence degree of each factor on each index, so as to obtain the optimal combination to achieve the purpose of the test [17]. Therefore, the three-factor three-level oblique angle laser shock processing orthogonal test was carried out (L9 (33)), and the orthogonal test schedule is shown in Table 3. The interaction between factors was not considered in this test.
3.3. Index Measurement and Data Processing
The residual stress on the sample’s surface was measured using an AstaTech XL-640 X-ray stress tester. The resolution of the X-ray detector can reach 0.04°, and the average error of the stress obtained is within ±14 MPa. The Mahr XT20 probe surface profiler was used to measure the surface roughness of the samples. The Mahr XT20 has a relative error of less than 3%, which can obtain abundant surface profile data. The Shanghai temin HVS-1000Z microhardness tester was used to measure the surface microhardness of the samples. The measuring range of the HVS-1000Z is 5 to 3000 HV, with a value error of less than 3% and a minimum measuring unit of 0.05 μm. The Macro GHS50K microcomputer-controlled electronic universal testing machine was used to measure the tensile strength, yield strength, and elongation of the samples. The maximum test force of the Macro GHS50K is 100 KN, the test force error is within 0.5%, and the resolution is ±1/300,000 of the maximum test force. The deformation error is within 0.5%, and the resolution is up to 1/300,000. The Zeiss optical microscope was used to observe the grains and measure the grain size after the corrosion of the samples. The German Zeiss microscope uses a coded 5× objective turntable with magnifications from 2× to 250×. The tensile fracture morphology of the samples was observed using an S-3400N (II) type tungsten filament bench scanning electron microscope produced by Hitachi. The acceleration voltage of the S-3400N (II) is 3 to 30 kV, the resolution of the secondary electron image is 3 to 10.0 nm, and the magnification is 10 to 100,000 times.
The test results were analyzed by variance analysis and range analysis using Data Processing System (DPS v7.03) data analysis software to obtain the influence rule of each factor on each index. The surface roughness of the impact area and the average grain size of the material surface layer should be as small as possible. In addition, the larger the absolute value of the other indicators, the better the performance of the sample, and the better the strengthening effect. The statistics of the test results are shown in Table 4.
4. Result and Discussion
4.1. Variance Analysis
In order to compare the results of the different indicators under the condition of various factors, the variance of each factor under different performance indicators was first compared, and then the F-test was used to judge the significance. The results are shown in Table 5. In order to visually and clearly represent the significant difference between the indicators under each factor condition, a Venn diagram was adopted to supplement the expression and presentation, as shown in Figure 4.
Results of the variance analysis showed that the differences in residual stress, surface roughness, microhardness, and average grain size were significant within the 5% confidence level for different laser energy. For different beam diameters, the difference of residual stress was significant within the 5% confidence level, while the difference of microhardness, surface roughness, and average grain size was significant within the 10% confidence level. For different numbers of impacts, the difference of residual stress was significant within the 5% confidence level, and the difference of microhardness, surface roughness, yield strength, and average grain size was significant within the 10% confidence level, as shown in Table 5 and Figure 4.
Within the 10% confidence level, there was no significant difference in tensile strength, yield strength, and elongation under different levels of other factors, with the exception of the yield strength that was only significantly different under different numbers of impacts. This might be due to the very small value range of laser energy and beam diameter or the because the sample was too thick. In addition, the shallow depth of the plastic deformation caused by the laser-induced shock wave did not adequately change the morphology, structure, and distribution of grain inside the sample, which cannot significantly affect the tensile properties of the material.
4.2. Range Analysis
The residual stress, surface roughness, microhardness, yield strength, average grain size, and other performance indicators with significance within the 10% confidence level were selected for the range analysis, and the analysis results are shown in Table 6. The results showed that, for the indicators with significant differences, the primary and secondary orders of the factors were as follows:
- For residual stress and microhardness, the laser energy is larger than the beam diameter, which is larger than number of impacts. The influence of laser energy was very clear and the range of residual stress and microhardness were 27.69 and 31.09, which was much larger than the other two factors, respectively.
- For surface roughness and average grain size, the laser energy is larger than the number of impacts, which is larger than the beam diameter. The influence degree of number of impacts and beam diameter was very close. The range of surface roughness was 2.21 and 1.91, and the range of average grain size was 1.33 and 1.23, respectively.
- For the yield strength, the number of impacts are larger than the laser energy, which is larger than the beam diameter. The number of impacts were very obvious, with a range of 137.67, which was much larger than the other two factors.
Based on an overall consideration, the primary and secondary orders of the factors in actual machining were as follows: The laser energy is larger than the number of impacts, which is larger than the beam diameter.
The values of Ki (i = 1,2,3) of each factor in Table 6, at different performance indicators, were taken as the variation trends of surface residual stress, microhardness, yield strength, and average grain size under different factor levels, as shown in Figure 5a–d. As the variation trends in surface roughness and residual stresses were similar, they are not described in this paper.
In Figure 5, as the laser energy increases, the residual stress and microhardness of samples increase, and the average grain size decreases. The yield strength decreased 59.67 MPa first and then increased 35 MPa. As shown in Figure 5c, the yield strength of the sample only showed some fluctuation in a small range of less than 10% compared with the unimpacted sample (971 MPa), with no significant trend of increase or decrease. It can be concluded that the increase of laser energy had almost no effect on the yield strength, which was also consistent with the results of the statistical significance in the variance analysis. The yield strength represents the limit of the material’s resistance to yield. The external forces greater than this limit cause the material to undergo a permanent and irrecoverable plastic deformation. This plastic deformation usually begins with precipitated phases and defects in the middle area of the thickness direction perpendicular to the external force, and the micro-pores in the material continue to grow, extend, and gather, which results in crack formation, which eventually leads to macroscopic yield and permanent deformation of the material [18]. In this study, the shock wave induced by laser energy influence depth was shallow, the laser-induced shock wave completely attenuated before propagating to the middle region of the material thickness direction, and the residual compressive stress layer was very thin and could not inhibit the growth of microvoids in the material or significantly affect the overall plastic deformation and yield capacity of the material. As the beam diameter increased, the residual stress and microhardness of samples increased, the average grain size decreased, and the yield strength decreased first and then increased, which was consistent with the influence of the laser energy. As the number of impacts increased, the residual stress, microhardness, and yield strength of the sample increased, and the average grain size decreased. This was caused by the plastic deformation by the laser-induced shock wave directly accumulated on the material surface, the residual compressive stress layer that deepened, and the grain refinement and dislocation that were continuously superimposed [19].
In Figure 5b,d, when the number of impacts increased from 2 to 3, the microhardness and average grain size slightly changed. This may be due to the laser shock, which made the dislocation inside the grain proliferate continuously to form sub-grain boundaries, dislocation walls, dislocation entanglements, and other dislocation structures in the grain, which are annihilated and rearranged, and then the grain is refined [20]. When the refinement reached a certain level, the proliferation and annihilation of the dislocation structure reached a dynamic balance. At this time, whether the number of impacts increased or not, the grain size no longer decreases, and the uniform and stable surface microstructure no longer significantly change the microhardness.
4.3. Fracture Morphology Analysis
The tensile samples of the FGH95 superalloy before and after the laser shock strengthening are shown in Figure 6. Macroscopically, the fracture cross-sections of all the samples had a clear shrinkage phenomenon; thus, all samples showed a ductile fracture.
The macroscopic and the microscopic fracture morphology of 10 samples after tensile fracture are shown in Figure 7. When the samples were subjected to unidirectional tensile force, plastic deformation occurred first, causing necking. Then, the cracks expanded in the perpendicular direction to the external force at the necking position. When the cracks reached a certain degree of instability, they rapidly developed to a fracture of about 45° along the direction of the external force, as shown in Figure 7a. The surface of the fracture is shown in Figure 7b, and the fracture was the cross-section of the through-going fault. Figure 7b shows the fracture sample magnified 40 times, indicating that the uneven part in the middle of the sample fracture formed the “bottom of the cup” and produced different degrees of tightening. The section was gray, as shown in the area circled by the dashed lines. The elongation index after fracture was higher, and plasticity was better. Figure 7d was obtained by magnifying the solid circle area of Figure 7c 6000 times. It was found that a large number of torn edges, micropores, and equiaxed dimples appeared on the fracture surface. The white ridges around the dimples were torn edges, and the dimples came in different sizes. The second phase particles can be found at the bottom of some micropores, and their size, shape, and distribution were some of the main factors affecting the size of dimples. When plastic deformation of the specimen occurs, the micropores form in the deformation area. The micropores were small and isolated from each other. Under the action of loading force, the micropores were connected with each other, resulting in sample failure, which was also one of the reasons for crack propagation.
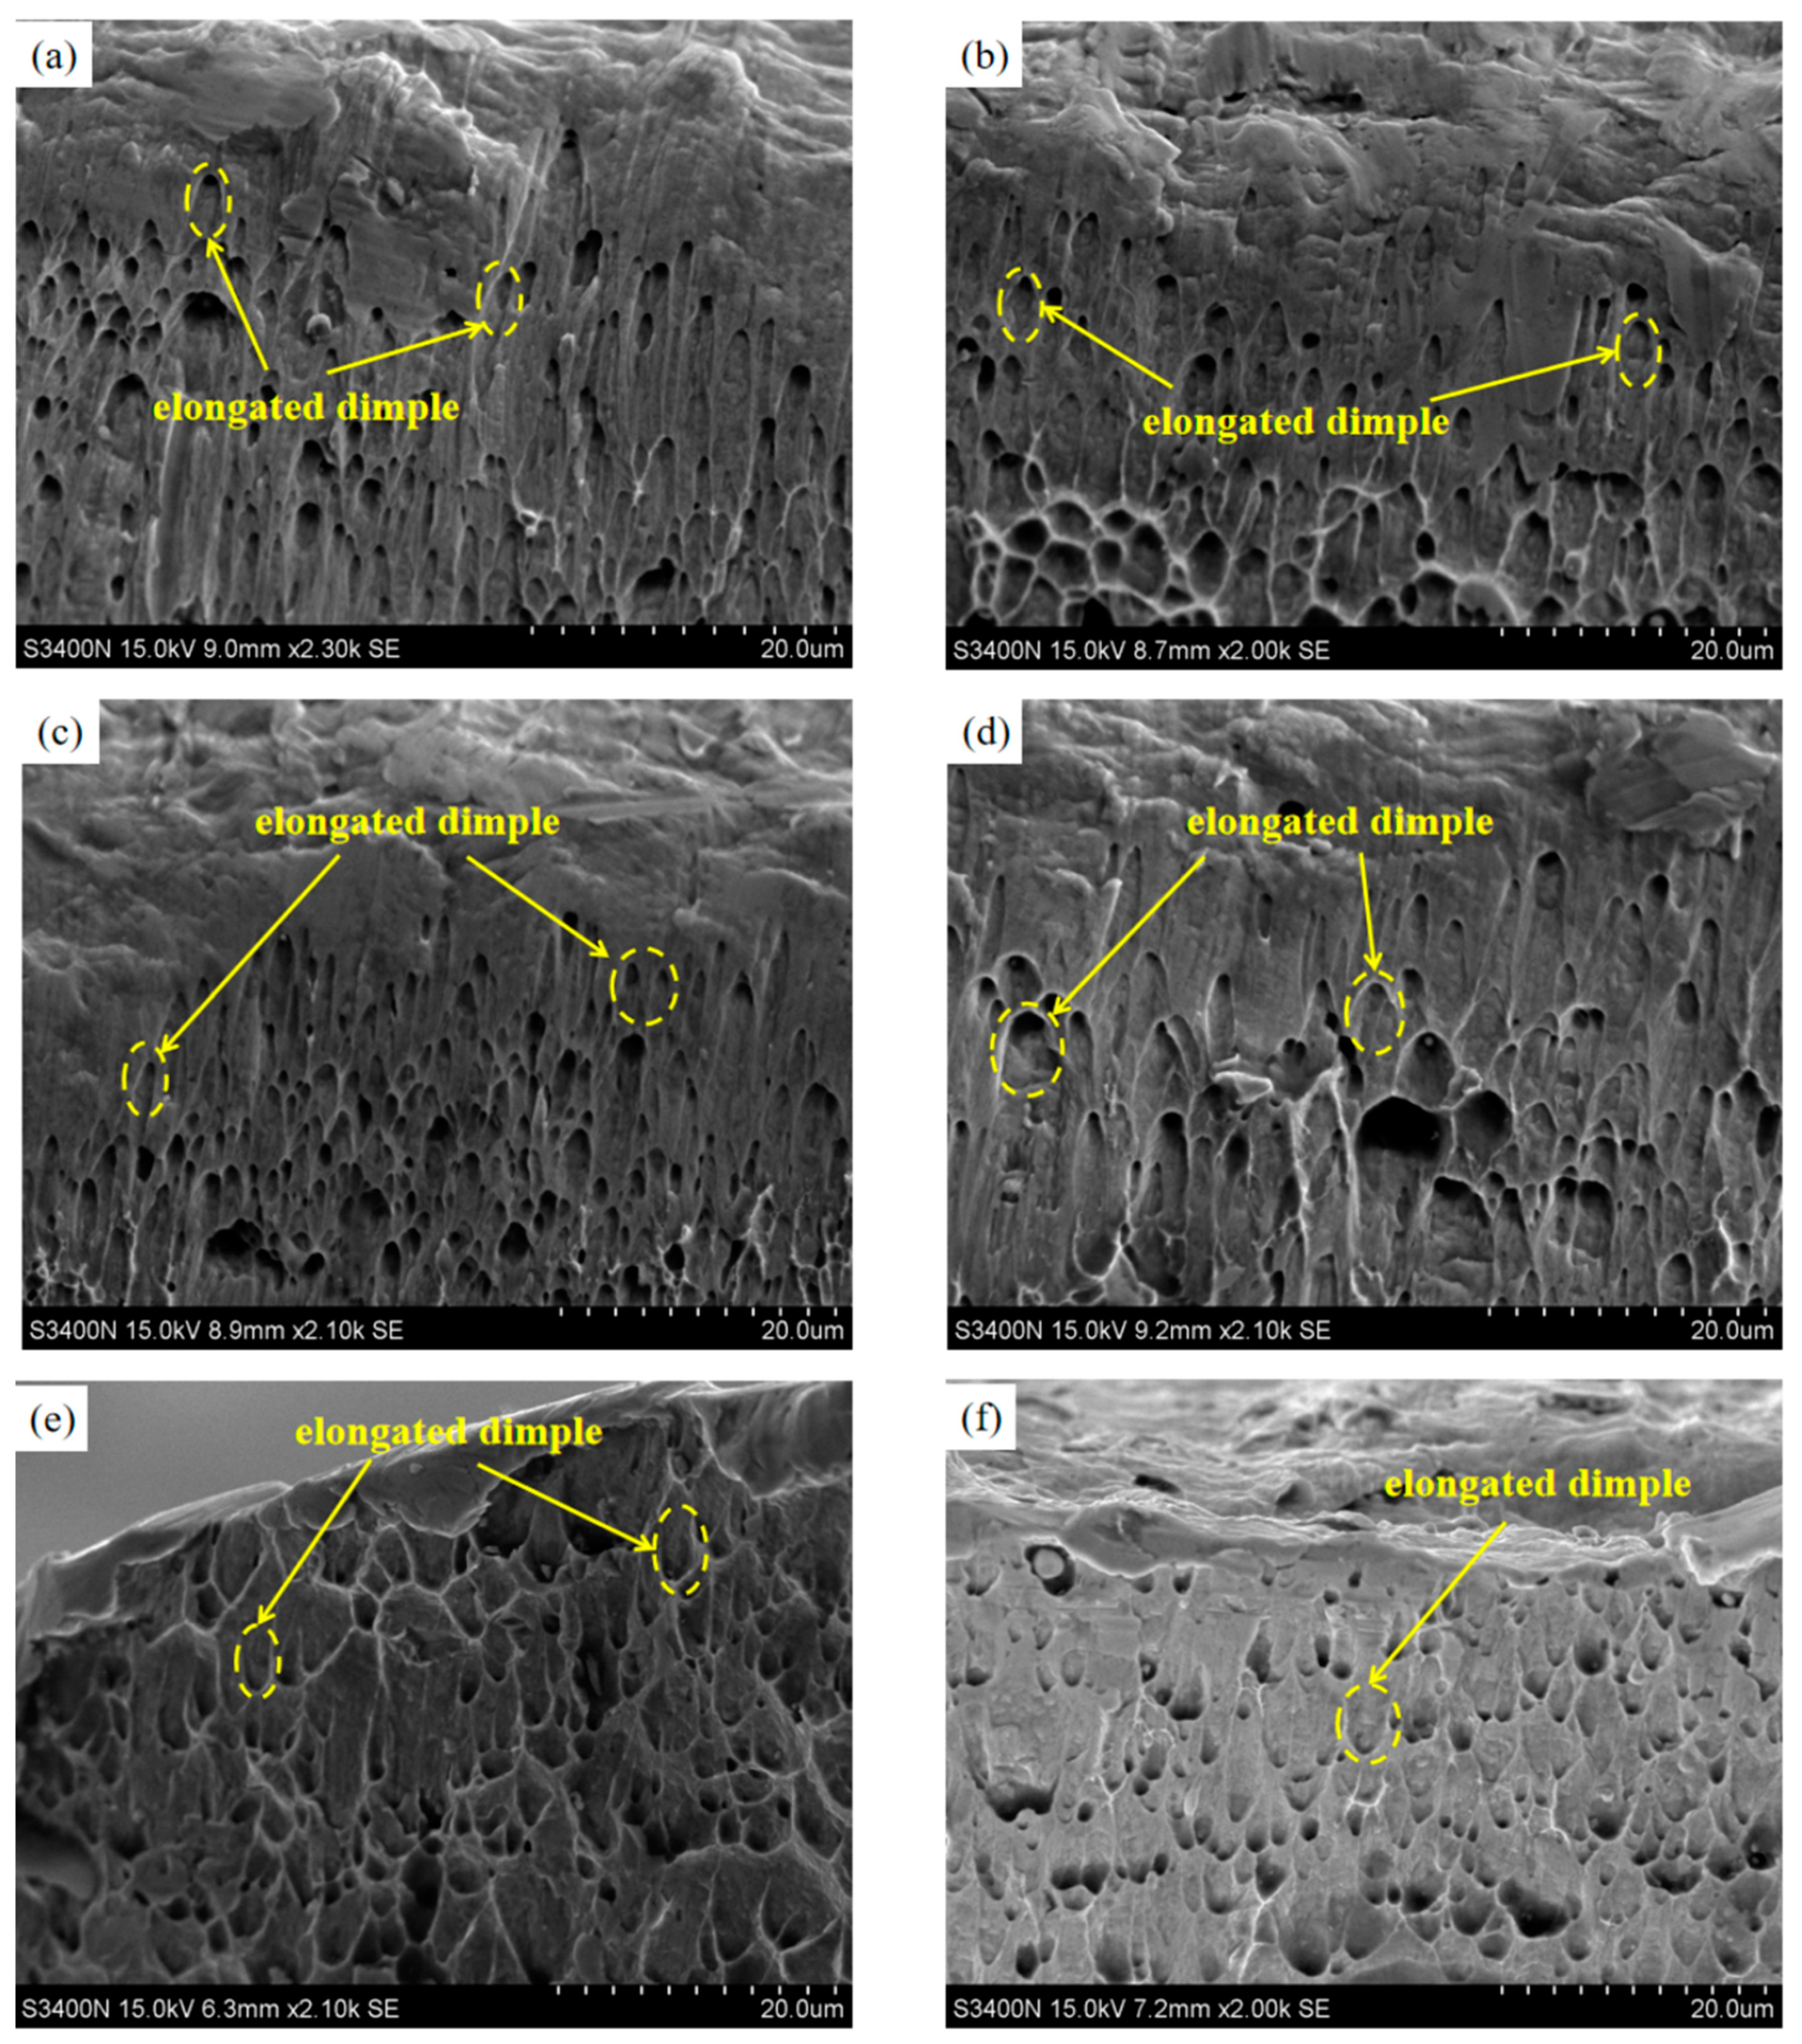
The tensile fracture microstructure of 10 samples is shown in Figure 8. Due to the shallow residual stress layer induced by the OLSP (generally within 1 mm), the observation area was selected as close as possible to the edge of the impact surface of the sample to obtain the effect of laser shock strengthening on tensile properties when observing the fracture morphology. Figure 8a–i show the fracture morphology of the samples by different OLSP parameters (corresponding to samples 1 to 9 of the experiment). Figure 8j shows the fracture morphology of the unimpacted sample no. 10. The surface of the unimpacted sample mostly presents equiaxed dimples or slightly elongated dimples, as shown in the dotted circles of Figure 8j. In Figure 8a–d, a gradually transitional elongated dimple was found with a parabolic shape along the internal direction of the material from the impact surface, as shown by the dotted elliptic circle. Compared with the dimple shape of tensile sample fracture morphology strengthened by vertical lasers from Reference [21], it is found that this is due to the surface residual stress caused by the OLSP that was affected by the combined force of unidirectional tension and residual stress during the tensile process, resulting in the elongation of dimple along the stress direction. When the laser energy increased to 6–8 J, the effect of the dimple elongated by force was weakened. The fracture morphology of the sample was mainly manifested in the small size and shallow depth of the dimple, and the dimples were more uniformly distributed, as shown in the solid line circle in Figure 8e–i. This might be due to the grain refinement and deformation hardening caused by the OLSP. The stronger the laser-induced shock wave force, the higher the degree of deformation hardening. Therefore, it was more difficult for necking to occur in the material, and this led to smaller dimple size [22].
Compared with the unimpacted sample, the impacted samples showed a slight increase in tensile and yield strengths, a slight decrease in elongation, and a generally minor change in the size and depth of the dimples. This is due to the peak pressure of the laser-induced shock wave exceeding the dynamic yield strength of the material, causing intense plastic deformation at the impact surface and generating large residual stresses. This caused grain refinement and dislocation entanglement on the material surface, impeding dislocation movement, hardening, reducing plasticity and ductility and inhibiting the occurrence of necking, thus reducing elongation and increasing microhardness. It also inhibited the dimple deepening and elongation near the impact surface to a certain extent, giving the dimple a small size, shallow depth, and evenly distribution, which prolonged the elastic deformation phase and thus increased the tensile and yield strengths to a certain extent [23]. However, due to the shallow strengthening layer, there was a little strengthening effect on the middle area in the thickness direction of the sample, with no significant effect on the overall tensile strength and elongation of the material. This is also consistent with the conclusion of the variance analysis that the tensile strength and elongation were not significant under all factors’ conditions.
5. Conclusions
Under different level factors, the FGH95 superalloy tensile sample was strengthened by OLSP through the orthogonal test method. After shocking, all performance indicators were improved compared with those without processing. The specific conclusions were as follows:
The results of variance analysis showed that only the yield strength was significantly different under different numbers of impacts within a 10% confidence level, and there was no significant difference in tensile strength, yield strength, or elongation under different levels of other factors. This is because the laser energy of the shock wave induced by residual stress produced by hardening layer is very shallow, about 1 mm, and the growth of the ductile fracture of microporous materials can significantly affect the material’s ability to resist plastic deformation and overall yield, so the tensile strength, yield strength, and elongation of tensile performance do not show an obvious difference between the various levels. The significant difference of residual stress, surface roughness, microhardness, and average grain size is very obvious, and these factors should be considered as the main performance indexes.
The results of range analysis showed that the primary and secondary orders of the factors affecting each index were as follows: laser energy > number of impacts > beam diameter. The analysis results of the fracture morphology showed that laser shock strengthening could make the dimples more uniformly distributed, smaller in size, and shallower in depth. However, compared with the unimpacted sample, there was little difference in the entire performance, and the thickness of the affected layer was extremely limited and could not affect the overall tensile properties of the material. This is consistent with the conclusion that there is almost no significant difference in tensile properties under various factors.
Combined with the above analysis and results, with the factor level combination of 8 J laser energy, 3 mm spot diameter, and three impacts, the FGH95 superalloy sample can obtain the best comprehensive performance, which provides a reference for the OLSP of FGH95 superalloy turbine disks and other aeronautical parts. The results are only applicable to the test conditions and parameter value range in this paper, and different processing conditions of FGH95 turbine disk joint materials need further study and optimization.
Finally, this experiment only focused on the influence of laser energy, spot diameter, and number of impacts on the performance of the FGH95 superalloy sample, while other factors such as beam lap rate and laser pulse width need to be further analyzed and explored.
Author Contributions
Conceptualization, C.L. and Y.Z.; methodology, L.Y. and J.Z.; investigation, L.Y., J.Z., H.W. and X.G.; data curation, H.W., X.G. and J.L.; writing—original draft preparation, C.L., L.Y. and J.Z.; writing—review and editing, J.L. and Y.Z.; supervision, Y.Z.; funding acquisition, Y.Z. All authors have read and agreed to the published version of the manuscript.
Funding
The work described in this study was supported by National Natural Science Foundation of China (No. 51775117), the Science and Technology Planning Project of Guangdong Province of China (No. 2017KZ010103), and the Science and Technology Planning Project of Jiangsu Province of China (No. BA2018070).
Conflicts of Interest
The authors declare no conflict of interest.
References
- Gao, Y.X.; Zou, J.W.; Wang, X.Q.; Wang, X.F.; Yang, J.; Wang, H.M. Microstructure and Mechanical Performance of Graphene Nanosheets Reinforced Nickel-Based Superalloy FGH95 Composite. Nanomaterials 2020, 10, 100. [Google Scholar] [CrossRef] [Green Version]
- Xu, Y.; Ge, C.C.; Shu, Q. Microstructure, Tensile Properties and Heat Treatment Process of Spray Formed FGH95 Superalloy. J. Iron Steel Res. Int. 2013, 20, 59–63. [Google Scholar] [CrossRef]
- Hu, B.F.; Chen, H.M.; Song, D.; Li, H.Y. The effect of pre-heating on carbide precipatites in FGH95 superalloy powders prepared by PREP. Acta Metall. Sin. 2003, 39, 470–475. [Google Scholar]
- Guo, B.; Sun, C.S.; Zhang, S.C.; Ge, C.C. Isothermal forging process design for spray-formed FGH95 superalloy turbine disk based on numerical simulation. Rare Met. 2013, 32, 347–353. [Google Scholar] [CrossRef]
- Peng, Z.C.; Wang, X.Q.; Zhang, Y.; Feng, Y.F.; Fan, X.S. Effects of Solid Solution Temperature on Microstructure and Properties of Extruded and Forged FGH95 Superalloys. Mater. Sci. Forum 2019, 4734, 3–7. [Google Scholar] [CrossRef]
- Tian, S.G.; Xie, G.L.; Xie, J.; Zhou, X.M. Influence of Long-term Aging on Microstructure and Creep Behaviors of FGH95 Nickel-based Superalloy. High Temp. Mater. Process. 2012, 31, 755–758. [Google Scholar] [CrossRef]
- Wu, J.J.; Zhao, J.B.; Qiao, H.C.; Lu, Y.; Sun, B.Y.; Hu, T.Y.; Zhang, Y.N. The application status and development of laser shock processing. Opto-Electron. Eng. 2018, 45, 6–12. [Google Scholar]
- Zhang, J.H.; Cheng, X.Q.; Xia, Q.X.; Yan, C. Strengthening effect of laser shock peening on 7075-T6 aviation aluminium alloy. Adv. Mech. Eng. 2020, 12, 1687814020952177. [Google Scholar] [CrossRef]
- Park, J.; Yeo, I.; Jang, I.; Jeong, S. Improvement of friction characteristics of cast aluminium-silicon alloy by laser shock peening. J. Mater. Process. Technol. 2018, 266, 283–291. [Google Scholar] [CrossRef]
- Li, T.; Ding, W.W. Characterizationof Ni-Based FGH96 Supperalloy Surface-Modified by Ageing and Laser Shock Processing. Chin. J. Vac. Sci. Technol. 2020, 40, 342–346. [Google Scholar]
- Gao, Y.K.; Zhong, Z.; Lei, L.M. Influence of Laser Peening and Shot Peening on Fatigue Properties of FGH97 Superalloy. Rare Met. Mater. Eng. 2016, 45, 1230–1234. [Google Scholar]
- Tang, Y.; Ge, M.Z.; Zhang, Y.K.; Wang, T.M.; Zhou, W. Improvement of Fatigue Life of GH3039 Superalloy by Laser Shock Peening. Materials 2020, 13, 3849. [Google Scholar] [CrossRef] [PubMed]
- Luo, S.H.; Zhou, L.C.; He, W.F.; Wang, X.D.; Lai, Z.L. Effects of laser shock processing on the high temperature fatigue life of K4030 nickel based alloy. Laser Infrared 2014, 44, 850–854. [Google Scholar]
- Karthik, D.; Swaroop, S. Laser shock processing enhanced corrosion properties in a nickel based Inconel 600 superalloy. J. Alloys Compd. 2016, 694, 1309–1319. [Google Scholar] [CrossRef]
- Zhang, Y.K.; Zuo, D.W.; Zhang, L.H.; Kong, D.J.; Zhou, J.Z.; Feng, A.X.; Zhang, L.F.; Ge, T.; Ren, X.D. Study on deformation behaviors of LD31 (6063) aluminum alloy sheet by oblique angle laser shock. Key Eng. Mater. 2005, 315–316, 511–515. [Google Scholar]
- Guo, W.M.; Zhao, M.H.; Dong, J.X.; Zeng, Q.; Zhang, L.F.; Yan, P. Research and Development in FGH95 P/M Nickel Based Superalloy. J. Mech. Eng. 2013, 49, 38–45. [Google Scholar] [CrossRef]
- Tiwary, A.P.; Shivakoti, I. Laser Beam Micromarking on Inconel 625 Superalloy. Lasers Eng. 2021, 50, 173–191. [Google Scholar]
- Liu, K.; Yang, H.F.; Xiong, F.; Man, J.X.; Chen, H.X. Research on the dynamic yield strength and forming depth of microscale laser shock imprinting. Opt. Laser Technol. 2019, 116, 189–195. [Google Scholar]
- Lin, Q.J.; Liu, H.J.; Zhu, C.C.; Chen, D.F.; Zhou, S.S. Effects of different shot peening parameters on residual stress, surface roughness and cell size. Surf. Coat. Technol. 2020, 398, 126054. [Google Scholar] [CrossRef]
- Ding, H.; Li, Y.W.; Zhang, Z.K.; Yuan, D.Q. Analysis of microstructural evolution properties based on laser shock peening. Optik 2019, 179, 361–366. [Google Scholar] [CrossRef]
- Zhou, W.F.; Ren, X.D.; Yang, Y.; Tong, Z.P.; Chen, L. Tensile behavior of nickel with gradient microstructure produced by laser shock peening. Mater. Sci. Eng. A-Struct. 2020, 771, 138603. [Google Scholar] [CrossRef]
- Ge, M.Z.; Xiang, J.Y. Effect of laser shock peening on microstructure and fatigue crack growth rate of AZ31B magnesium alloy. J. Alloys Compd. 2016, 680, 544–552. [Google Scholar] [CrossRef]
- Wang, C.; Wang, L.; Wang, C.L.; Li, K.; Wang, X.G. Dislocation density-based study of grain refinement induced by laser shock peening. Opt. Laser Technol. 2020, 121, 105827. [Google Scholar] [CrossRef]
Figure 1.
Schematic diagram of oblique laser shock processing of mortise tooth and groove.
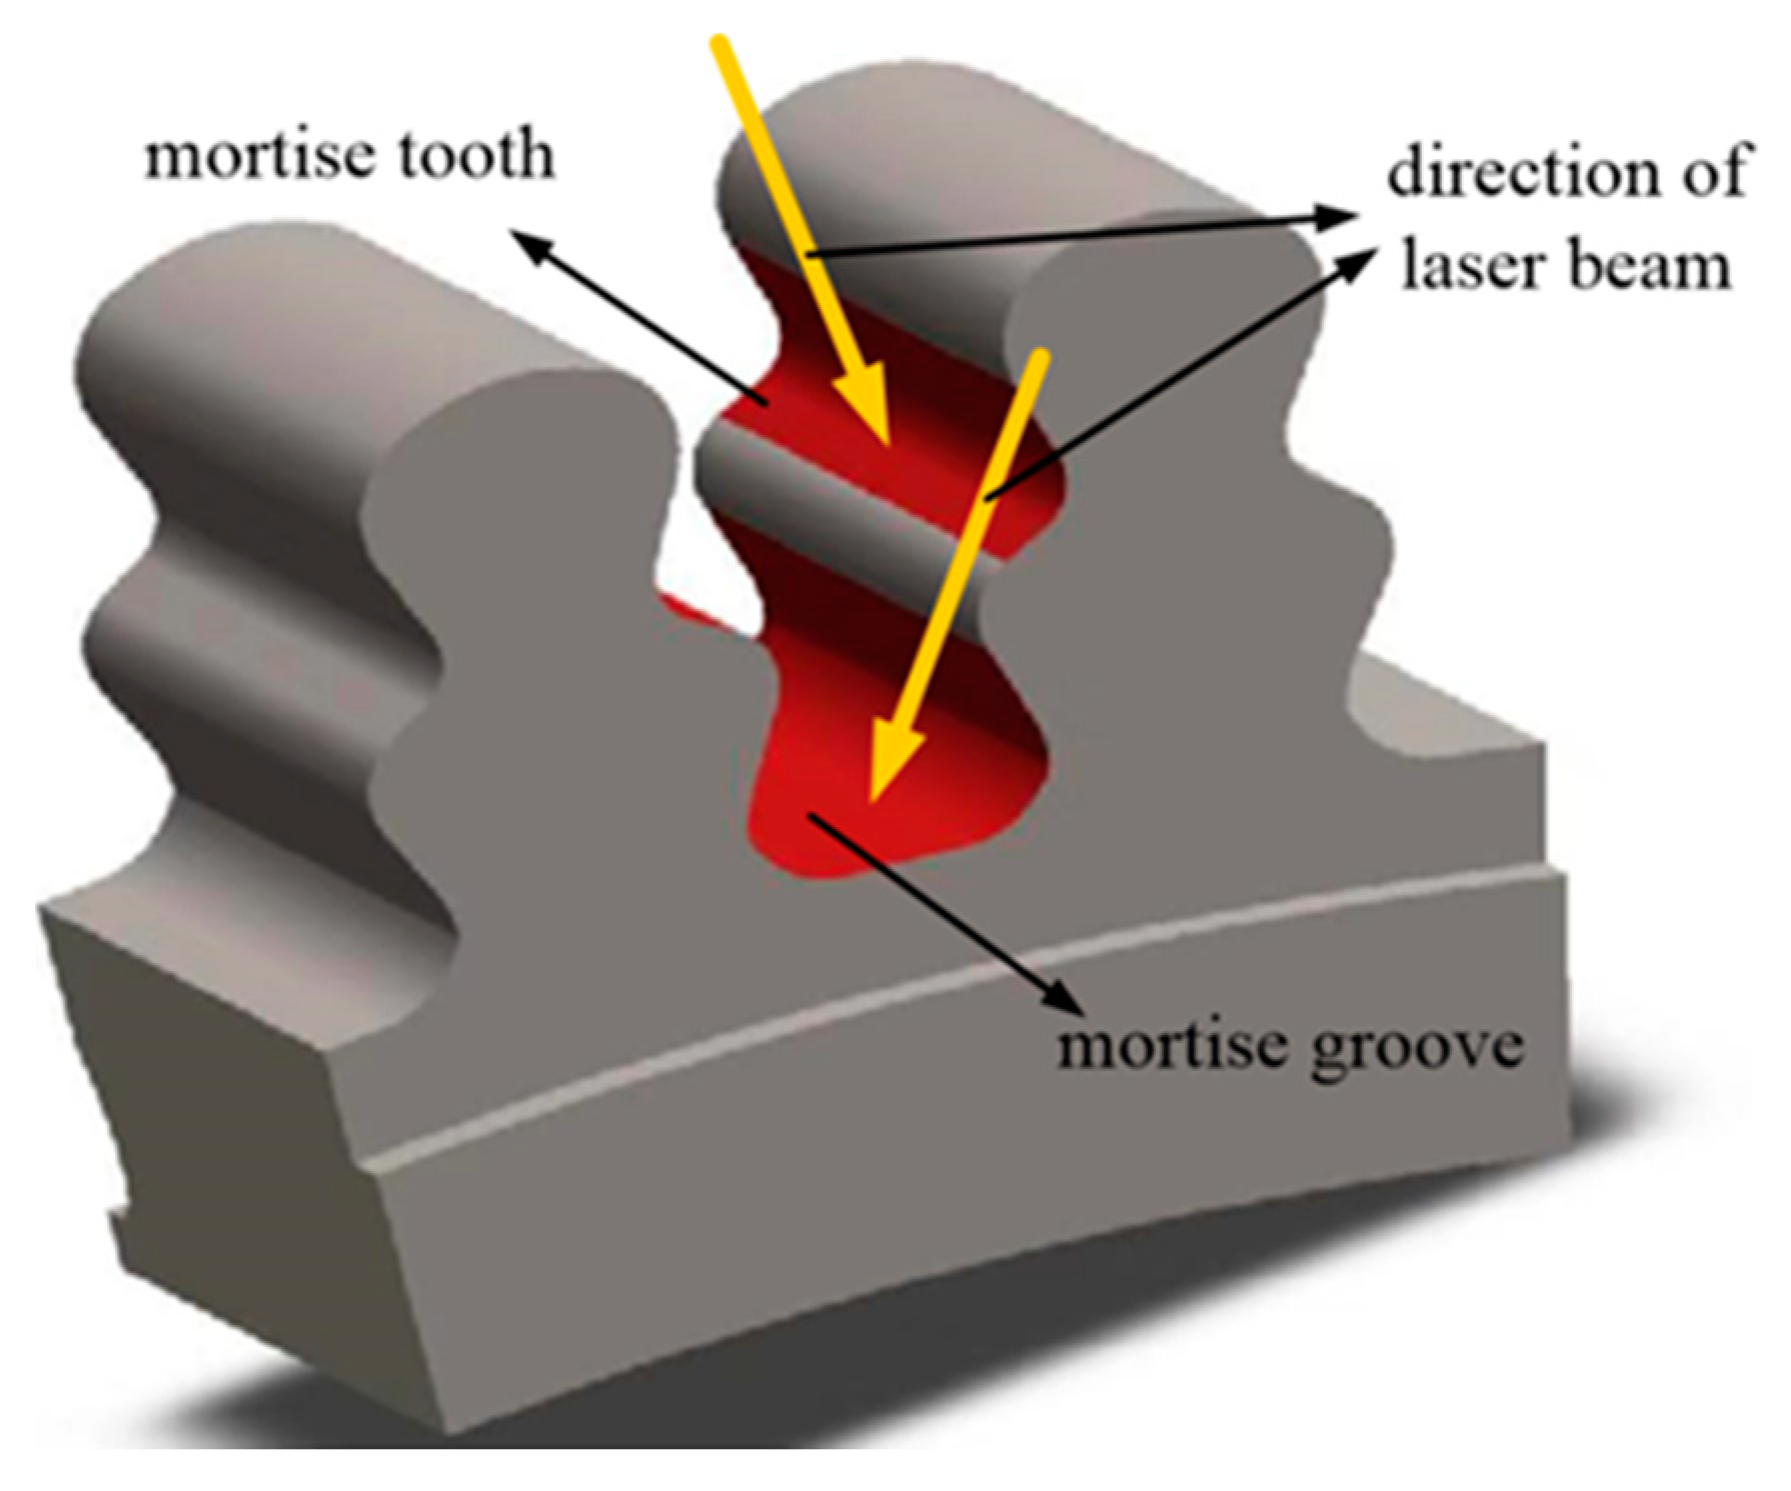
Figure 2.
Schematic diagram of FGH95 standard tensile sample dimension with the processing area and processing route.
Figure 2.
Schematic diagram of FGH95 standard tensile sample dimension with the processing area and processing route.
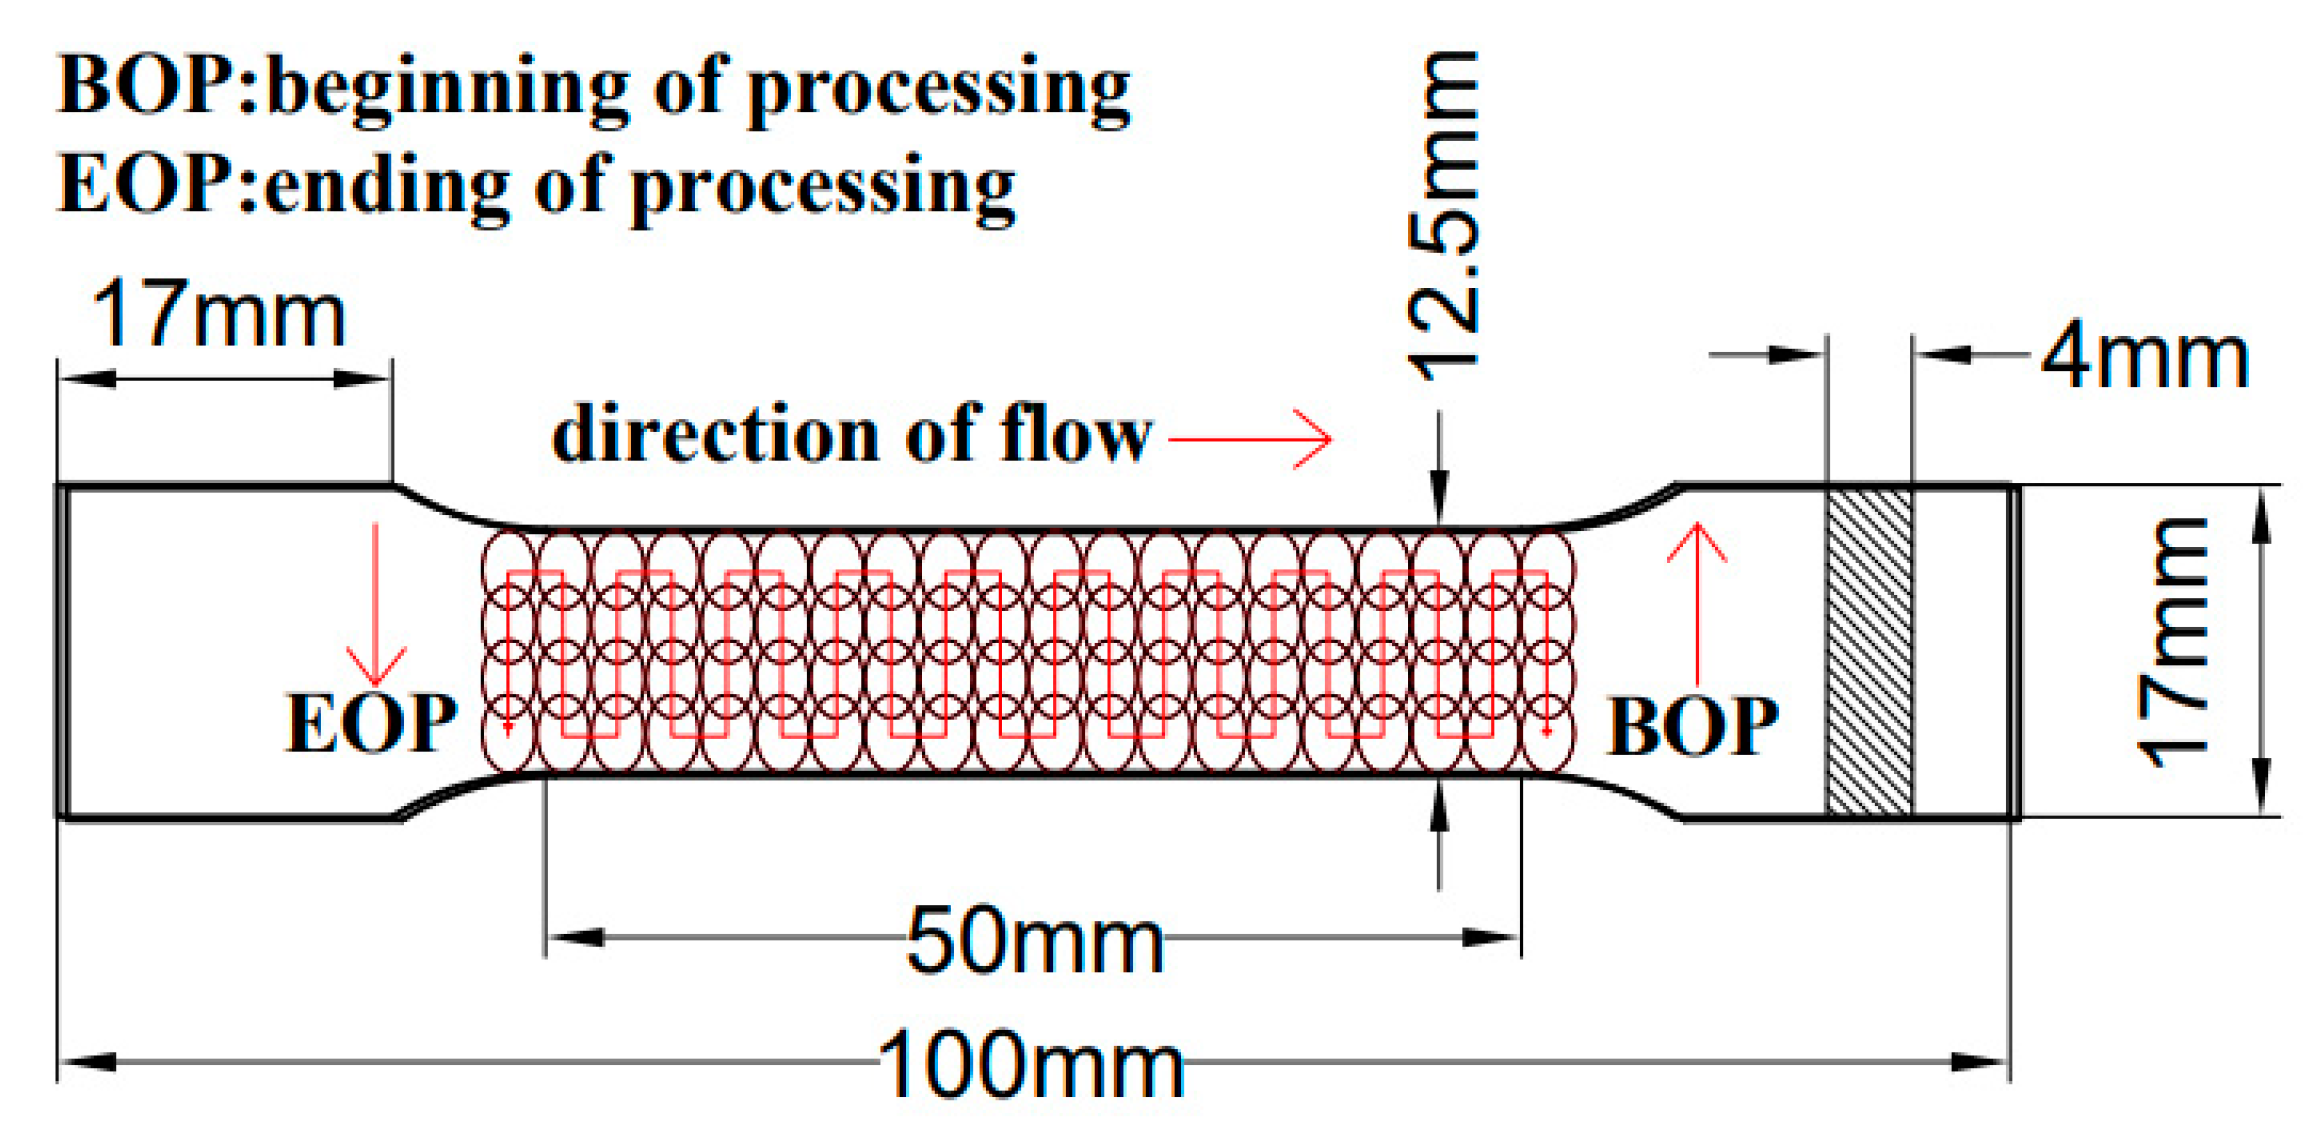
Figure 3.
OLSP schematic diagram and the sample after OLSP. (a) The OLSP schematic diagram. (b) the sample after OLSP.
Figure 3.
OLSP schematic diagram and the sample after OLSP. (a) The OLSP schematic diagram. (b) the sample after OLSP.

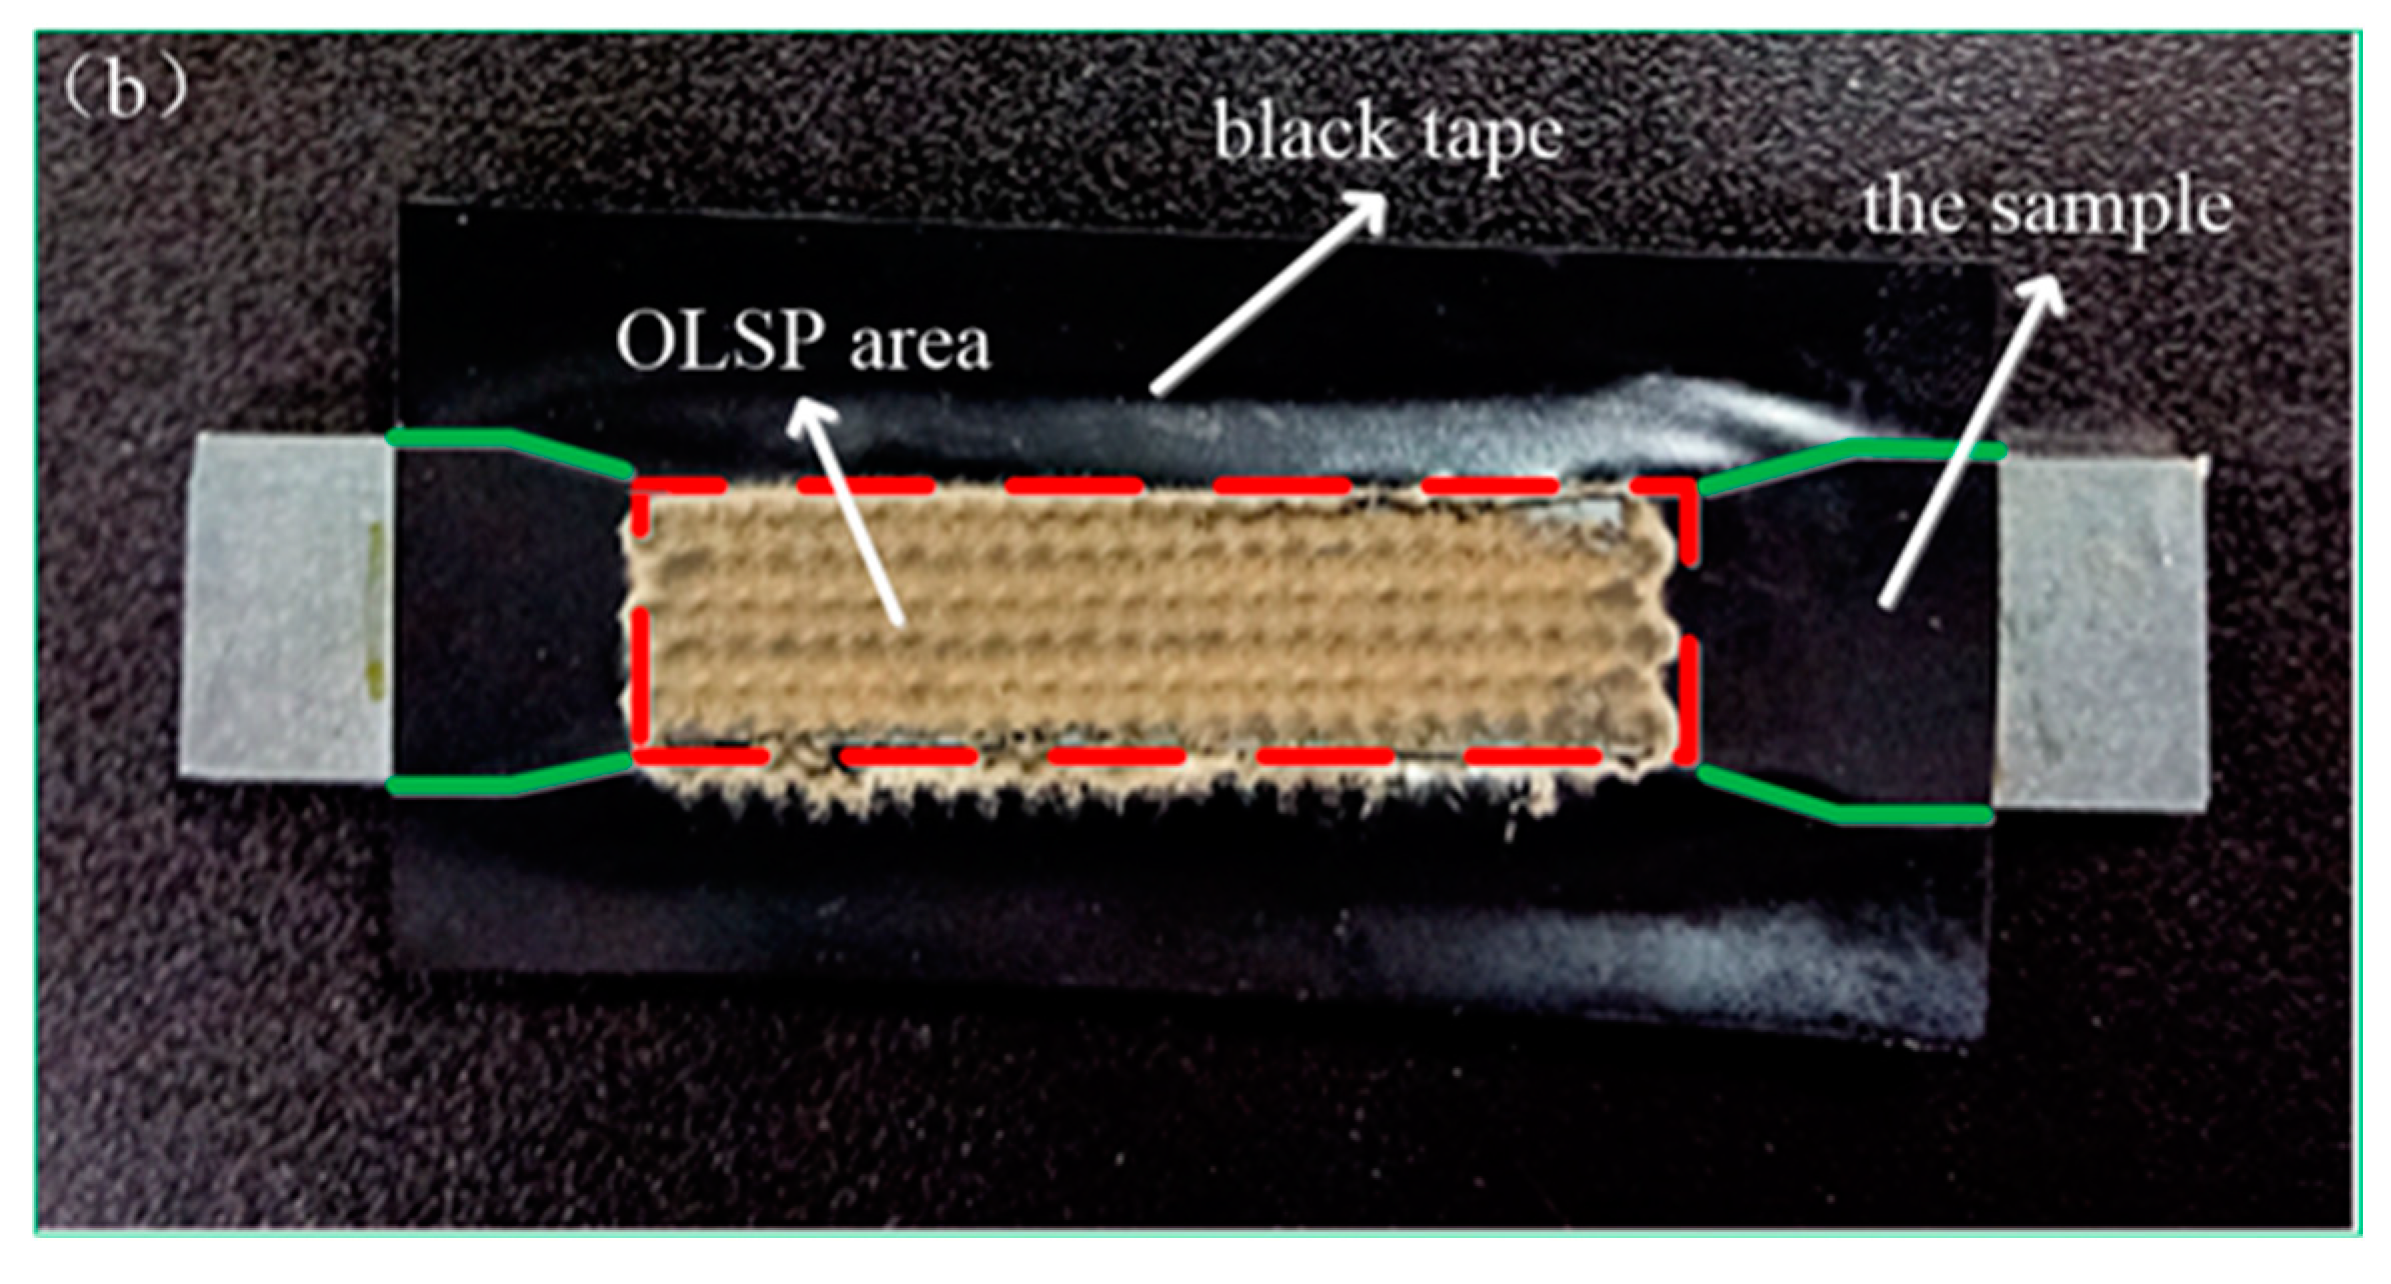
Figure 4.
Different statistical significances of different performance indicators under each factor condition.
Figure 4.
Different statistical significances of different performance indicators under each factor condition.
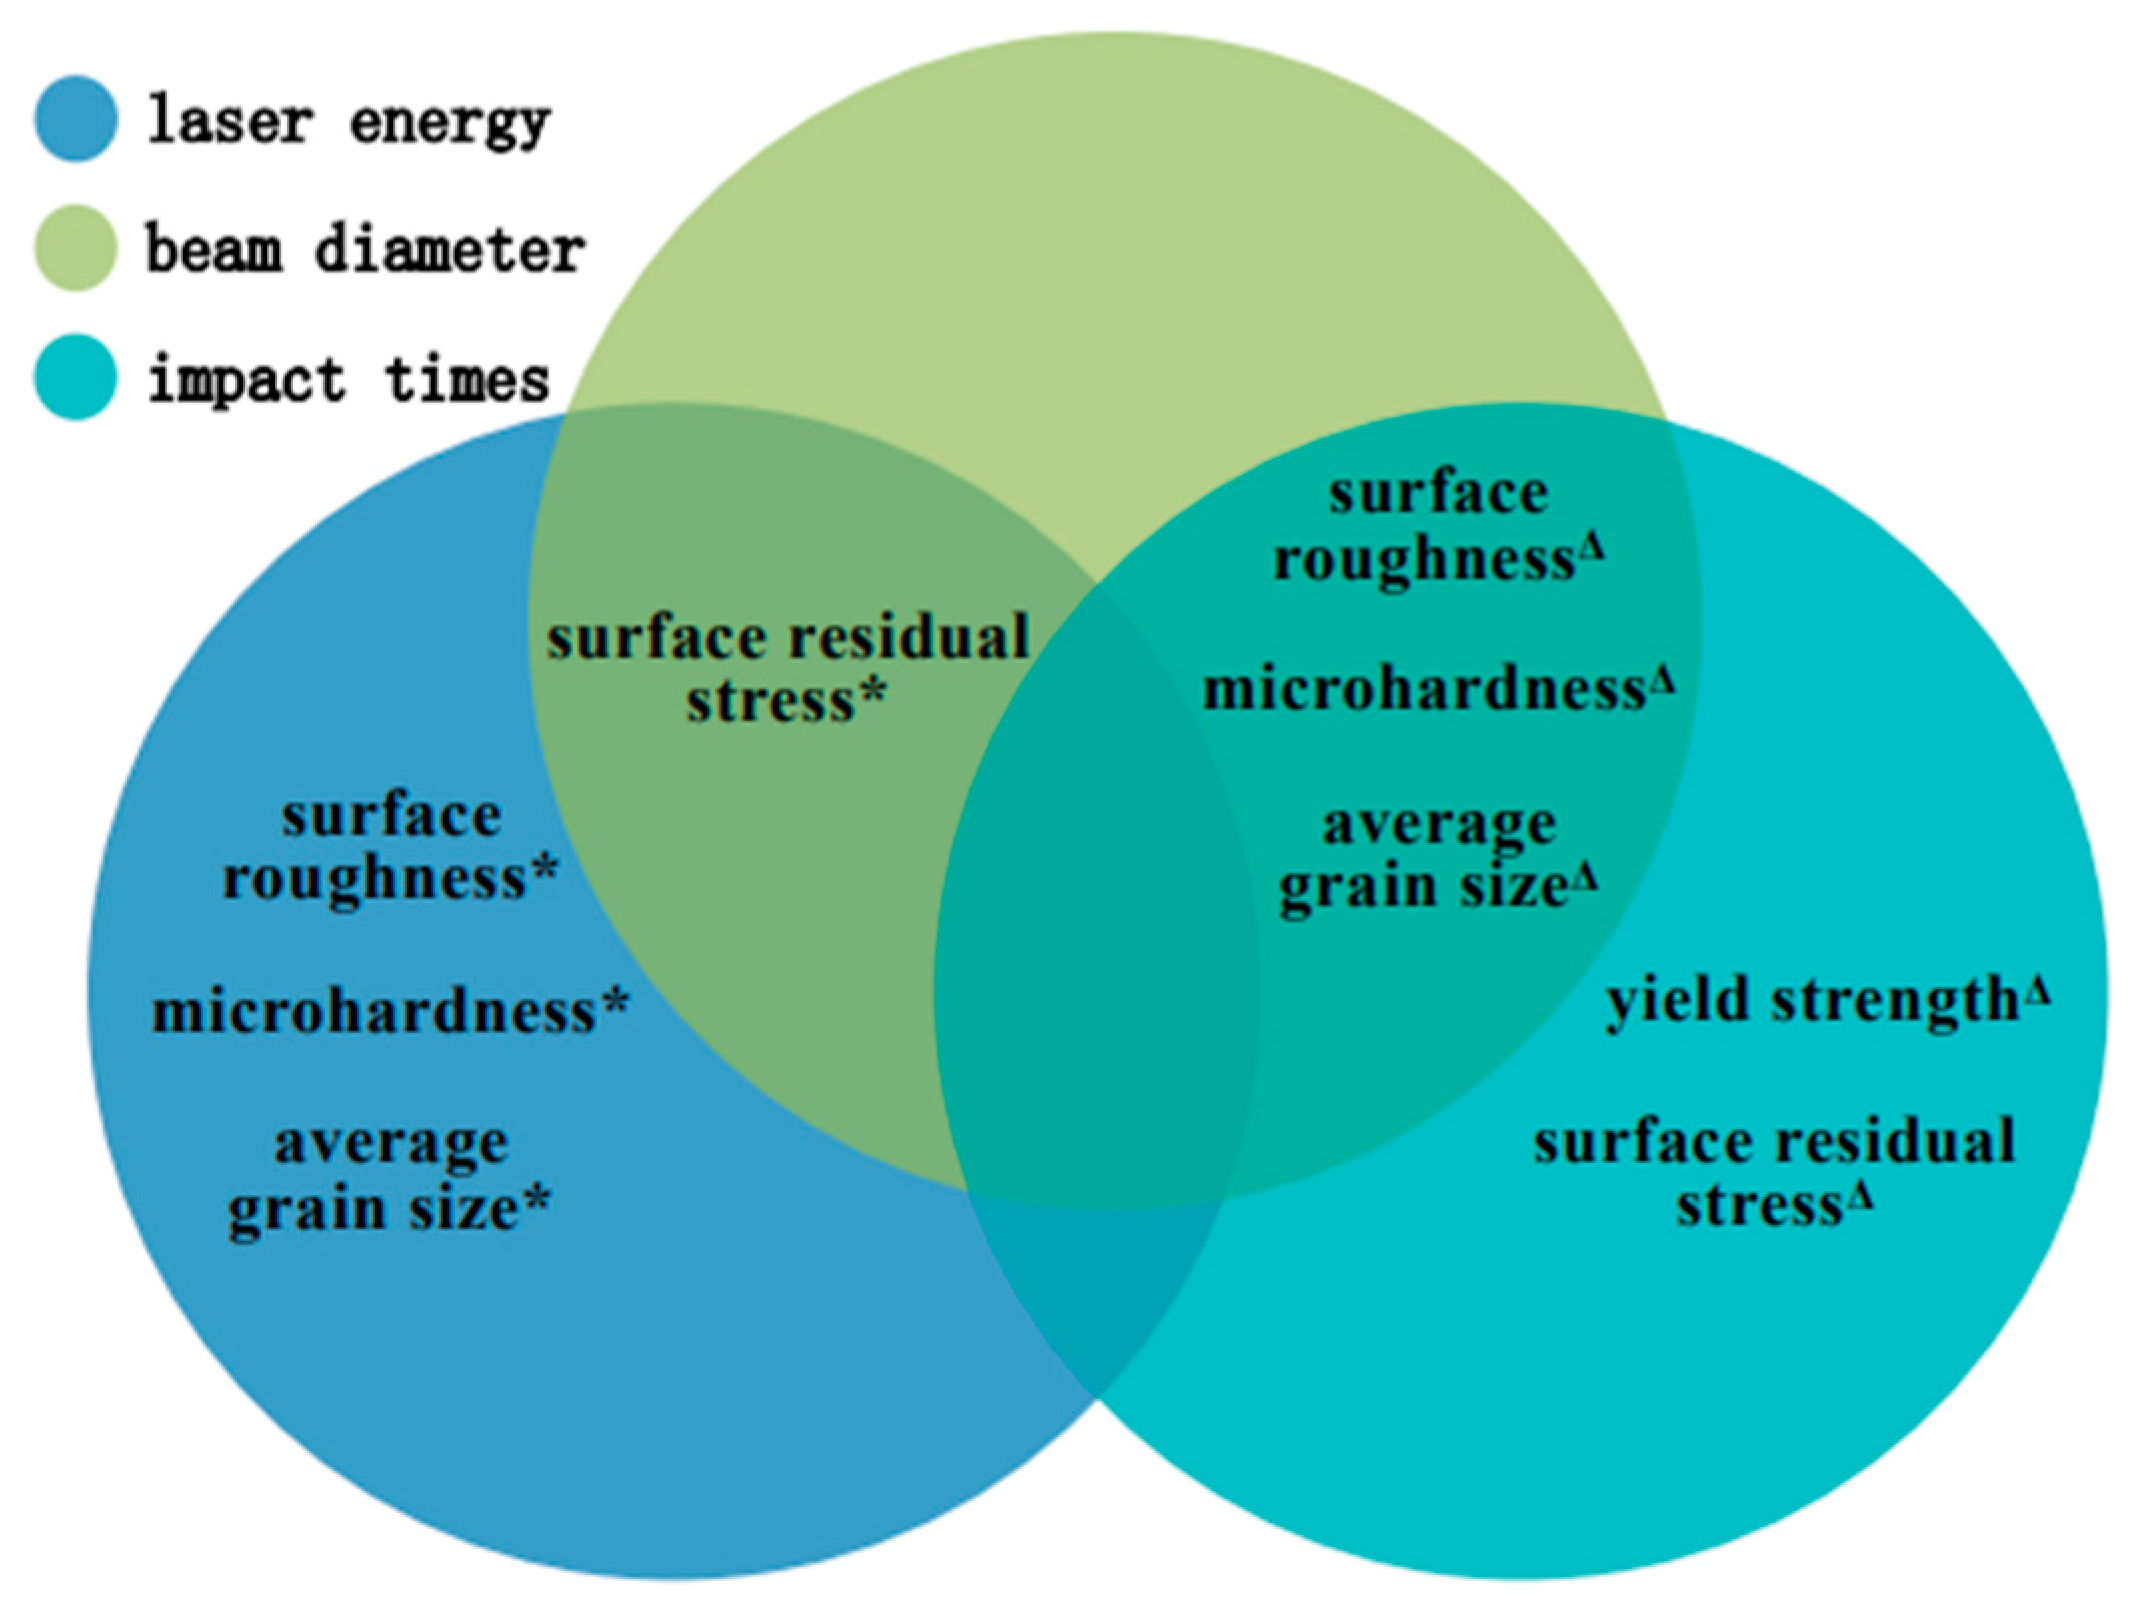
Figure 5.
The variation trends of different performance indicators for each factor. (a) The variation trend of surface residual stress; (b) the variation trend of microhardness; (c) the variation trend of yield strength; (d) the variation trend of average grain size.
Figure 5.
The variation trends of different performance indicators for each factor. (a) The variation trend of surface residual stress; (b) the variation trend of microhardness; (c) the variation trend of yield strength; (d) the variation trend of average grain size.
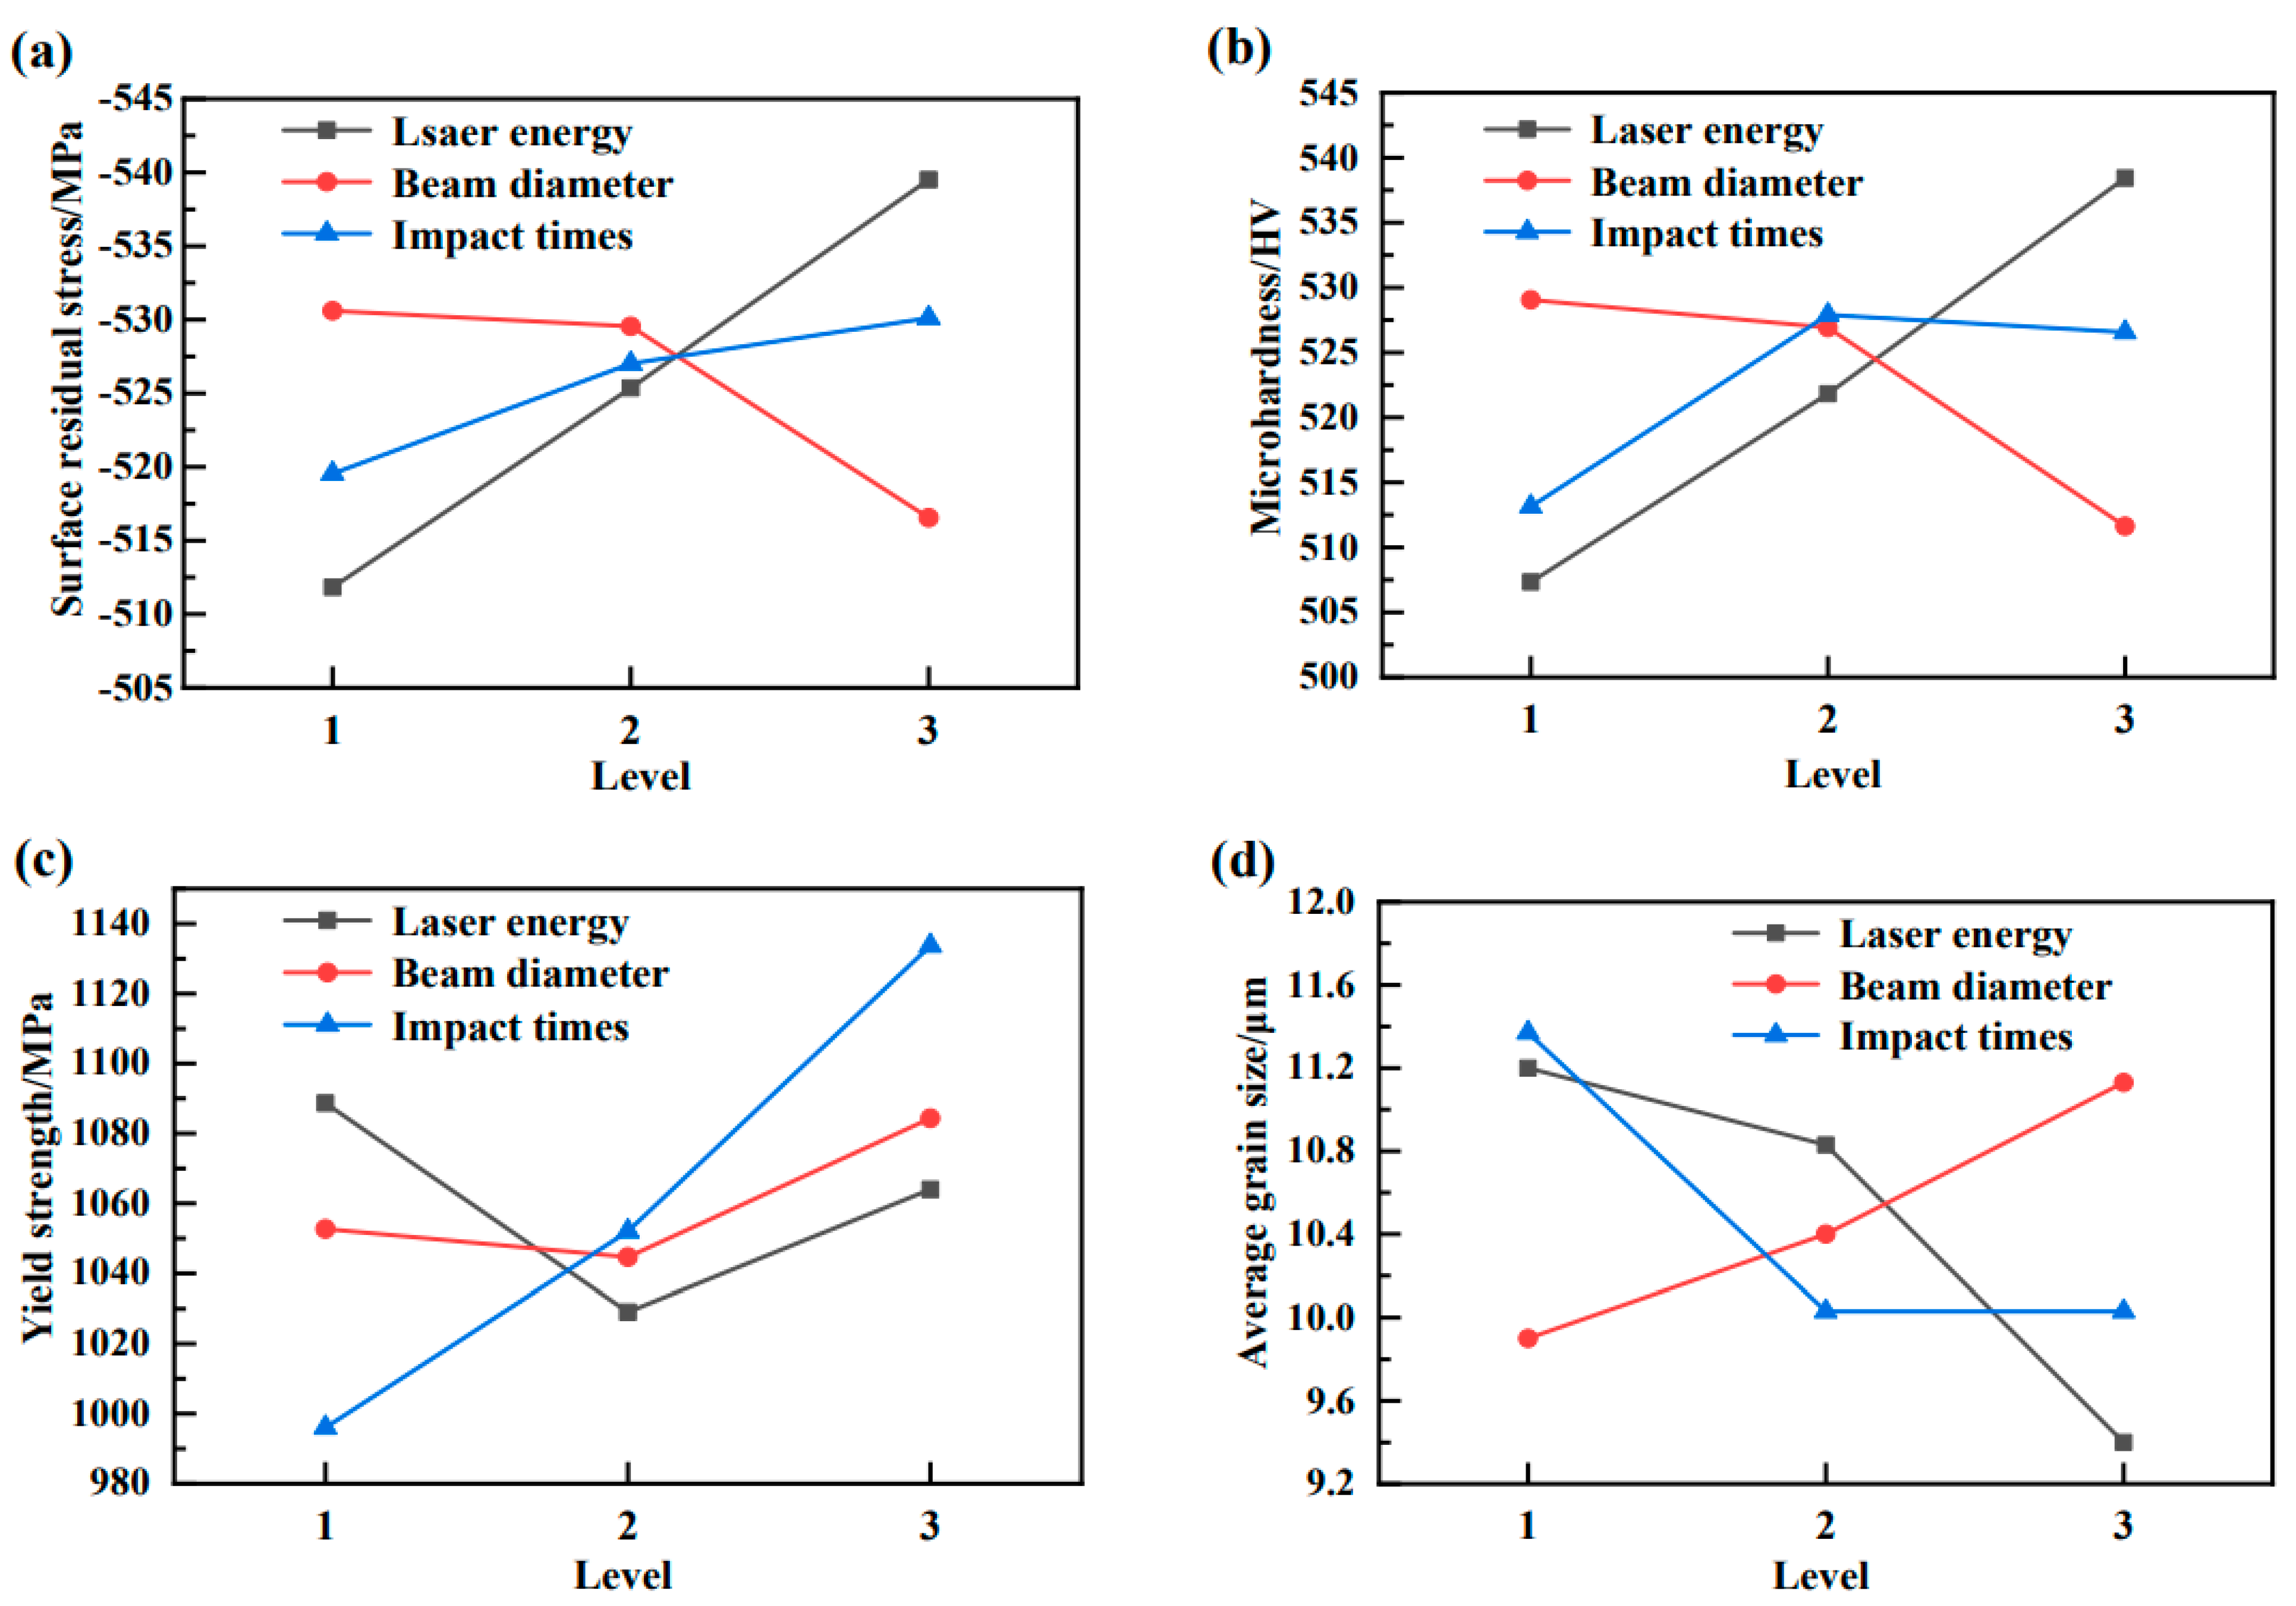
Figure 6.
Broken standard tensile samples (no. 1–10) and standard tensile sample without OLSP.

Figure 7.
The fracture morphology of the FGH95 standard tensile sample. (a) Fracture cut along 45°; (b) fracture characteristics; (c) fracture magnified 40 times; (d) fracture magnified 6000 times.
Figure 7.
The fracture morphology of the FGH95 standard tensile sample. (a) Fracture cut along 45°; (b) fracture characteristics; (c) fracture magnified 40 times; (d) fracture magnified 6000 times.

Figure 8.
The fracture microscopic morphology of the sample after 2000 times magnification. (a) Sample no. 1; (b) sample no. 2; (c) sample no. 3; (d) sample no. 4; (e) sample no. 5; (f) sample no. 6; (g) sample no. 7; (h) sample no. 8; (i) sample no. 9; (j) sample no. 10.
Figure 8.
The fracture microscopic morphology of the sample after 2000 times magnification. (a) Sample no. 1; (b) sample no. 2; (c) sample no. 3; (d) sample no. 4; (e) sample no. 5; (f) sample no. 6; (g) sample no. 7; (h) sample no. 8; (i) sample no. 9; (j) sample no. 10.


Table 1.
Chemical compositions of the FGH95 superalloy.
| Element | Mass Fraction/% | Element | Mass Fraction/% |
|---|---|---|---|
| Al | 3.400~3.500 | Mn | <0.100 |
| W | 3.350~3.450 | Zr | 0.040~0.070 |
| Nb | 3.300~3.500 | Ta | <0.050 |
| Mo | 3.300~3.480 | Si | 0.050~0.110 |
| Ti | 2.500~2.550 | P | <0.110 |
| Cr | 12.850~13.070 | S | 0.002~0.003 |
| Fe | 0.100~0.370 | C | 0.045~0.067 |
| Co | 7.950~8.020 | O | <0.005 |
| B | 0.011~0.014 | Ni | Margin |
Table 2.
Test factors and levels.
| Level/Factor | Laser Energy/J | Beam Diameter/mm | Number of Impacts/No. |
|---|---|---|---|
| 1 | 4 | 3 | 1 |
| 2 | 6 | 4 | 2 |
| 3 | 8 | 5 | 3 |
Table 3.
Orthogonal test schedule.
| Test Number/No. | Laser Energy/J | Beam Diameter/mm | Number of Impacts/No. |
|---|---|---|---|
| 1 | 4 | 3 | 1 |
| 2 | 4 | 4 | 2 |
| 3 | 4 | 5 | 3 |
| 4 | 6 | 3 | 2 |
| 5 | 6 | 4 | 3 |
| 6 | 6 | 5 | 1 |
| 7 | 8 | 3 | 3 |
| 8 | 8 | 4 | 1 |
| 9 | 8 | 5 | 2 |
| 10 | Control group (UnOLSP) | ||
Table 4.
The statistical table of test results.
| Test Number (No.) | Surface Residual Stress (MPa) | Surface Roughness (μm) | Micro Hardness (HV) | Tensile Strength (MPa) | Yield Strength (MPa) | Elongation (%) | Average Grain Size (μm) |
|---|---|---|---|---|---|---|---|
| 1 | −511.42 | 13.91 | 506.65 | 1677 | 1005 | 35.35 | 11.3 |
| 2 | −515.49 | 13.96 | 517.77 | 1694 | 1083 | 35.08 | 10.8 |
| 3 | −508.54 | 13.85 | 497.61 | 1675 | 1178 | 35.29 | 11.5 |
| 4 | −533.03 | 14.31 | 530.87 | 1706 | 1005 | 35.63 | 9.9 |
| 5 | −534.48 | 15.16 | 532.42 | 1714 | 1075 | 35.16 | 10.1 |
| 6 | −508.56 | 10.96 | 502.19 | 1705 | 1007 | 36.3 | 12.5 |
| 7 | −547.35 | 17.95 | 549.65 | 1816 | 1148 | 34.76 | 8.5 |
| 8 | −538.67 | 15.46 | 530.58 | 1745 | 976 | 36.41 | 10.3 |
| 9 | −532.52 | 15.64 | 535.05 | 1748 | 1068 | 35.38 | 9.4 |
| 10 | −465.97 | 9.94 | 441.26 | 1587 | 971 | 36.61 | 15 |
Table 5.
Variance analysis of different indicators.
| Factor | Value of Analysis | Surface Residual Stress | Surface Roughness | Micro Hardness | Tensile Strength | Yield Strength | Elongation | Average Grain Size |
|---|---|---|---|---|---|---|---|---|
| Laser energy | Mean square | 575.42 | 7.21 | 725.75 | 6070.33 | 2696.78 | 0.16 | 2.71 |
| F value | 79.22 * | 25.25 * | 36.44 * | 7.88 | 3.36 | 0.80 | 26.85 * | |
| Beam diameter | Mean square | 183.98 | 2.91 | 271.50 | 432.33 | 1320.11 | 0.14 | 1.15 |
| F value | 25.33 * | 10.18 Δ | 13.63 Δ | 0.56 | 1.64 | 0.69 | 11.42 Δ | |
| Number of impacts | Mean square | 88.58 | 3.67 | 199.82 | 543.00 | 14,378.78 | 0.71 | 1.78 |
| F value | 12.20 Δ | 12.86 Δ | 10.03 Δ | 0.70 | 17.90 Δ | 3.60 | 17.58 Δ |
Note: * indicates that factors have a great influence on the different indicators, which is significant within the 5% confidence level; Δ indicates that the factors have a certain influence on the different indicators, which is significant within the 10% confidence level.
Table 6.
Range analysis of different indicators.
| Indicator | Factor | |||||||
|---|---|---|---|---|---|---|---|---|
| Surface residual stress /MPa | Laser energy | −1535.45 | −1576.07 | −1618.54 | −511.82 | −525.36 | −539.51 | 27.69 |
| Beam diameter | −1591.80 | −1588.64 | −1549.62 | −530.60 | −529.55 | −516.54 | 14.06 | |
| Number of impacts | −1558.65 | −1581.04 | −1590.37 | −519.55 | −527.01 | −530.12 | 10.57 | |
| Surface roughness /μm | Laser energy | 41.72 | 40.43 | 49.05 | 13.91 | 13.48 | 16.35 | 2.87 |
| Beam diameter | 46.17 | 44.58 | 40.45 | 15.39 | 14.86 | 13.48 | 1.91 | |
| Number of impacts | 40.33 | 43.91 | 46.96 | 13.44 | 14.64 | 15.65 | 2.21 | |
| Micro hardness /HV | Laser energy | 1522.03 | 1565.48 | 1615.28 | 507.34 | 521.83 | 538.43 | 31.09 |
| Beam diameter | 1587.17 | 1580.77 | 1534.85 | 529.06 | 526.92 | 511.62 | 17.44 | |
| Number of impacts | 1539.42 | 1583.69 | 1579.68 | 513.14 | 527.90 | 526.56 | 14.76 | |
| Yield strength /MPa | Laser energy | 3266.00 | 3087.00 | 3192.00 | 1088.67 | 1029.00 | 1064.00 | 59.67 |
| Beam diameter | 3158.00 | 3134.00 | 3253.00 | 1052.67 | 1044.67 | 1084.33 | 39.66 | |
| Number of impacts | 2988.00 | 3156.00 | 3401.00 | 996.00 | 1052.00 | 1133.67 | 137.67 | |
| Average grain size /μm | Laser energy | 33.60 | 32.50 | 28.20 | 11.20 | 10.83 | 9.40 | 1.80 |
| Beam diameter | 29.70 | 31.20 | 33.40 | 9.90 | 10.40 | 11.13 | 1.23 | |
| Number of impacts | 34.10 | 30.10 | 30.10 | 11.37 | 10.03 | 10.03 | 1.33 |
Note: Ki is the sum of all test results for each factor at the i level (i = 1,2,3), is the arithmetic mean of test results for each factor at each level, and R is the difference between the maximum and minimum values for each factor . The greater the value R, the greater the influence of this factor on test results.
Publisher’s Note: MDPI stays neutral with regard to jurisdictional claims in published maps and institutional affiliations. |
© 2021 by the authors. Licensee MDPI, Basel, Switzerland. This article is an open access article distributed under the terms and conditions of the Creative Commons Attribution (CC BY) license (https://creativecommons.org/licenses/by/4.0/).
Share and Cite
MDPI and ACS Style
Lin, C.; Yu, L.; Zeng, J.; Wu, H.; Guo, X.; Liu, J.; Zhang, Y. Experimental Study on FGH95 Superalloy Turbine Disk Joint Material by Oblique Laser Shock Processing. Metals 2021, 11, 1770. https://doi.org/10.3390/met11111770
AMA Style
Lin C, Yu L, Zeng J, Wu H, Guo X, Liu J, Zhang Y. Experimental Study on FGH95 Superalloy Turbine Disk Joint Material by Oblique Laser Shock Processing. Metals. 2021; 11(11):1770. https://doi.org/10.3390/met11111770
Chicago/Turabian StyleLin, Chaohui, Longwei Yu, Jingling Zeng, Hebin Wu, Xiaojun Guo, Jianxin Liu, and Yongkang Zhang. 2021. "Experimental Study on FGH95 Superalloy Turbine Disk Joint Material by Oblique Laser Shock Processing" Metals 11, no. 11: 1770. https://doi.org/10.3390/met11111770
Note that from the first issue of 2016, this journal uses article numbers instead of page numbers. See further details here.