Article

Influence of Batch Mass on Formation of NiTi Shape Memory Alloy Produced by High-Energy Ball Milling

Institute of Materials Engineering, University of Silesia in Katowice, 75 Pułku Piechoty 1A, 41-500 Chorzów, Poland
*
Author to whom correspondence should be addressed.
Metals 2021, 11(12), 1908; https://doi.org/10.3390/met11121908
Submission received: 31 October 2021 / Revised: 23 November 2021 / Accepted: 23 November 2021 / Published: 26 November 2021

Abstract

:
A high-energy ball milling technique was used for production of the equiatomic NiTi alloy. The grinding batch was prepared in two quantities of 10 and 20 g. The alloy was produced using various grinding times. Scanning electron microscopy, X-ray diffraction, hardness measurement and differential scanning calorimetry were used for materials characterization at various milling stages. The produced alloy was studied by means of microstructure, chemical and phase composition, average grain and crystallite size, crystal lattice parameters and microstrains. Increasing the batch mass to 20 g and extending the grinding time to 140 h caused the increase in the average size of the agglomerates to 700 µm while the average crystallites size was reduced to a few nanometers. Microstrains were also reduced following elongation of milling time. Moreover, when the grinding time is extended, the amount of the monoclinic phase increases at the expense of the body-centered cubic one—precursors of crystalline, the B2 parent phase and the B19′ martensite. Crystallization takes place as a multistage process, however, at temperatures below 600 °C. After crystallization, the reversible martensitic transformation occurred with the highest enthalpy value—4 or 5 J/g after 120 and 140 h milling, respectively.

1. Introduction

Even though more than 60 years have passed since discovering the shape memory effect, NiTi alloy is still at the top of interest [1,2]. This is due to the relatively high value of the size of the shape memory effect compared to other shape memory alloys [3]. Moreover, the interest in this alloy is also due to the temperature range of the memory effects. Depending on the chemical composition, these effects may appear at temperatures between −120 °C and 140 °C [4]. Hence, the number of its practical applications is growing year by year in technology as well as in medicine and veterinary medicine. Hence, there is still the interest in changing its properties that enable control of shape memory phenomena for new applications [5]. The NiTi properties depend significantly on chemical composition and the structure formed during its manufacturing or processing. Apart from its chemical composition, the structure plays an essential role in the appearance of a reversible martensitic transformation and its course [6,7,8]. Moreover, reducing the grain size—towards nanocrystallization and/or amorphization of the alloy—opens new control possibilities [9,10].
Several unconventional technologies leading to amorphization and/or nanocrystallization were adopted for NiTi alloy production [11]. One is powder metallurgy, using various powder grinding/milling techniques [12,13]. The advantage of this method is the production of a solid-phase alloy without the need to enter the liquid phase region. Moreover, changing the grinding parameters using high-energy mills makes it possible to reduce the average size of crystallites from tens of micrometers to even several nanometers. Especially, parameters such as grinding time (GT), grinding speed (GS) or the ratio of the number of balls to the mass of the batch (BPR) influence the structure and course of the martensitic transformation. For example, results reported in [14], the GS of 250 rpm BPR with 10: 1 was used for NiTi alloy production. After milling for 32 h, powders were amorphous with the grain size reduced to 8 µm. Application of additional heat treatment by uniaxial hot die pressing at 1000 °C under 35 MPa allowed to obtain alloy, which underwent a reversible martensitic transformation. However, the enthalpy of this transformation was only 2.9 J/g. Increasing the GS to 300 rpm and GT to 60 h (with the BPR of 10: 1) resulted in reducing an average crystallite size to 24 nm [15].
On the other hand, Bozorg and Rabiezadeh [16] increased GS to 450 rpm when BPR was 15: 1. It was possible to obtain a nanocrystalline alloy structure after 25 h. However, the average crystallite size was 20–40 nm. Additional annealing at 1000 °C made it possible to obtain an alloy that, apart from the B2 parent phase, also contained the equilibrium phases: Ti2Ni and Ni3Ti. The results obtained in [17] show that increasing GS from 350 to 710 rpm reduces the grinding time to 8 h. However, the high GS value causes heating up of the mixed powders. Despite the protective atmosphere, titanium, as well as nickel, were oxidized. The formation of titanium oxide is a diffusion barrier through which nickel cannot diffuse [17].
The article’s main goal was to obtain the NiTi alloy in the amorphous/nanocrystalline form by increasing the batch weight to 20 g and reducing the grinding speed to 250 rpm. Respectively, the grinding time was extended up to 140 h and with BPR as 10:1. The influence of theses parameters on the structure, chemical and phase composition, crystallite size and course of the martensitic transformation were analyzed.

2. Materials and Methods

Commercially available powders of alloying elements (with a purity of 99.7%) were used to produce a NiTi alloy with a nominal composition containing 50 at.% of each element. The powders were ground in a high-energy ball mill Pulverisette 7 premium line (FRITSCH GmbH, Idar-Oberstein, Germany). Details of the procedure can be found in [18]. The studies were carried out in two batches. The first one—10 g was milled 100 h and the second one—20 g for 100, 120 and 140 h. Regardless of the sample weight, the ratio of the milling balls to the powder’s weight was maintained as 10:1.
The crystallization process and martensitic transformation were studied based on the thermograms measured using the differential scanning calorimetry (DSC) in a Mettler Toledo DSC 1 calorimeter. The thermograms, used to analyze the course of the crystallization process, were measured in the temperature range from room temperature (RT) to 600 °C at a rate of 20 deg/min. In order to study the course of the reversible martensitic transformation, thermograms were registered in a temperature range from −120 °C to 140 °C at a rate of 10 deg/min. All calorimetric measurements were done for samples weighing about 30 g. Argon was used as a protective atmosphere. The phase transition’s start and end temperatures were determined from the intersection of a slope tangent of a peak with the baseline.
Observation of the microstructure was carried out with a JEOL JSM 4680 (JEOL, Ltd., Tokyo, Japan) scanning electron microscope (SEM) equipped with an X-ray energy dispersive spectrometer (EDS) (IXRF, Austin, TX, USA ). The microscope was operating at 20 kV.
The phase analysis was performed using X-ray diffraction patterns measured using an X’Pert-PRO (Malvern Panalytical Ltd., Malvern, UK) diffractometer with copper radiation (CuKα1 and 2). The X-ray diffraction patterns were measured at room temperature in an angular 2θ range: 10–140°. The step-scan mode was applied with step 0.04° and time-adjusted to receive accurate counting statistics. The International Centre for Diffraction Data (ICDD) PDF-4+ database (ICDD, Newtown Square, PA, USA) was used for phase identification. The crystal lattice parameters were determined based on refinement of the diffractograms calculated from the crystal cell models to the measured ones. For this purpose, the Rietveld method was used, which enables such refinement by minimizing the differences using the least-squares method [19]. The refinement of measured diffractograms was done using the LHPM computer program (version 4.2. Lucas Heights Research Laboratories ANSTO, Sydney, Australia). Grinding progress and the influence of its conditions were estimated based on the analysis of average crystallite size and microstrain using the Williamson−Hall method. These parameters were calculated from the half-width measured at half of the height of the diffraction line (FWHM). After subtracting the influence of apparatus conditions, this width is divided into two components—derived from the influence of the crystallite size and microstrain. Contrary to the Scherrer method, this approach reflects the details prevailing in the structure of the ground material. The Scherrer method makes the FWHM parameter dependent only on the influence of the average size of the crystallites and ignores the influence of internal stresses. Mathematical details of the Williamson−Hall method can be found in [20].
The microhardness of the alloying element powders was measured using a micro hardness tester type 401/402 MVD (ITW Test and Measurement GmbH, Dusseldorf, Germany) with a Vickers scale from 10 g to 1 kg.

3. Results and Discussion

The first visible sign of the influence of the grinding conditions on the alloy formation is the change in grain size of the alloying element powders and grains of newly formed alloy. Figure 1a,b shows SEM images observed for the initial state of the alloying powders: nickel and titanium, respectively. The average grain size of the nickel powder was about 11 µm, while the titanium—34 µm. The effect of grinding time for a 10 g sample was previously discussed in [18]. It was shown that for a grinding time of 100 h, the average size of the agglomerates was about 75 µm. Increasing the weight to 20 g and mixing the powders for 100 h contributed to a slight increase in the average size of agglomerates to about 80 ± 52 µm (Figure 1c). The agglomerates had an oval shape. In general, increasing the grinding time for 20 g batch to 120 and 140 h increased their average size. Moreover, the grinding conditions contributed to the formation of two agglomerate fractions. The first one with a shape similar to powder from a 10 g portion was oval and averaging 105 ± 45 µm and 124 ± 58 µm in size, respectively. The second one is disc-shaped with an average thickness of about 285 ± 69 µm and an average length of 685 ± 65 µm (Figure 1d). The grinding time did not significantly affect the change in the size of this fraction. However, extending the grinding time to 140 h increased the amount of the second fraction. This shaping was the result of a collision between the forming agglomerates and balls as well as the container.
The effect of increased batch weight and extended grinding time was analyzed based on the measured diffractograms for powders in the state after direct grinding. The results are summarized in Figure 2. For a batch weighing 10 g, ground for 100 h, the X-ray diffraction patterns showed only two expanded peaks indicating the amorphous/nanocrystalline state of the powder. Increasing the amount of the charge to 20 g (mixed for 100 h) caused the formation of a similar powder mixture.
However, the presence of solid solutions, based on the alloying elements of nickel and titanium, did not wholly disappear. Even when the grinding time was increased to 140 h, these solutions were present in the powder mixture. Titanium and nickel-based solid solutions were essential constituents of the formed alloy. Thus, first, the possibility of their formation is discussed. Then, their residue in the powder mixtures will be analyzed. The conditions inside of the container provide a favorable environment during milling for the formation of solid solutions. Although nickel in titanium cannot dissolve too much, the higher temperature in the container leads to a broader range of solubility. Titanium solution in nickel has an increased concentration range. It creates a greater possibility of forming its solution—this is what the phase diagram shows [21]. As a result, the changes in lattice parameters were observed in comparison to pure alloying elements. It was confirmed by microscopic observations and the analysis of the chemical composition. An exemplary image for a 20 g sample milled for 100 h is shown in Figure 3. Measurement of the chemical composition showed that apart from the area characterized by the composition corresponding to the transformable phase (Figure 3—example was marked as area A), there were two others. The first one, formed from the titanium-based solid solution example, was marked as area B in Figure 3. Second, the nickel-based solid solution is marked as area C. Similar areas were observed in the 20 g batches milled by 120 and 140 h.
Extending the grinding time up to 140 h did not eliminate the presence of titanium and nickel-based solid solutions (Figure 2). Still, the presence of X-ray diffraction lines originating from both phases was identified. The Rietveld method [19] was used to determine their lattice parameters. The starting model for nickel and titanium was built on a base of the ICDD PDF-4 database—card no. 00-004-0850 and 00-044-1294, respectively. The nanocrystalline-amorphous phase was modeled using the body-centered cubic structure (BCC), which is the precursor to the B2 parent phase (card no 03-065-0917). The monoclinic lattice model (monoclinic) was modeled using crystallographic data of the B19’ martensite (card no 03-065-0365). An example of the refinement received for a batch 20 g milled 140 h was shown in Figure 4.
The results of lattice parameters calculations, mean crystallite size and macron-stresses are summarized in Figure 5. Regardless of the grinding time, the lattice parameter of the nickel-based solid solution was much higher than in the ICDD file (Figure 5a). It may be due to the degree of purity of the alloying element powder used. Moreover, it has been well known that the atomic radius of nickel is smaller concerning the radius of the titanium atom (Ti—1.4 Å, Ni—1.35 Å [22]); therefore, during the formation of titanium-based solid solution, an increase in the nickel lattice parameter can be expected. This effect was observed for the 20 g/100 h batch. Furthermore, the extension of the grinding time resulted in the decrease in lattice parameters calculated for the nickel-based solid solution. However, for all batches and the milling times, its value was higher by 0.01 Å in comparison to the pattern. This effect may be due to the titanium transition into the martensitic phase or the formation of an equilibrium Ti2Ni precursor phase. Moreover, extending the grinding time changes the size of the crystallites and the microstrain. These parameters were determined from the Williamson−Hall method [20] dependently on the production conditions and presented in Figure 5b. The calculations show that in the case of the nickel-based solid solution, the average crystallite size is relatively high, approximately 63 nm. The microstrain also shows the highest value—about 0.78% for a 20 g batch milled for 100 h. Further extension of the grinding time caused a decrease in the average crystallite size and the microstrain to 23 nm and 0.45%, respectively. The decrease in microstrain may be caused by the temperature increase resulting from the friction between the powder grains and the energy coming from the collision of the grinding balls. Changes in the parameters of the titanium lattice (a0 and c0) show a different character from those occurring in nickel. In the 20 g batch, after 100 h of grinding, the titanium parameter a0 was higher than in the ICDD standard, and c0 was correspondingly lower. The extension of the grinding time reduced the a0 value with a similar tendency as in the case of nickel. In contrast, the parameter c0, for the 120 and 140 h grinding times, increased its value above the one from the ICDD standard. At the same time, the average crystallite size of the titanium-based solid solution increased from 7 nm to 55 nm. The trend of microstrain dependence on grinding time determined for a titanium-based solid solution was similar to that previously discussed for the nickel one. The course of changes in both parameters may indicate the progressive formation of the nickel-based solid solution towards increasing solubility. The increase in temperature may be responsible for such a state, which takes a beneficial effect on increasing the range of solubility in the solid-state, resulting in the disappearance of microstrain and an increase in the size of the crystallites of the titanium-based solid solution. Temperature rise in the container is a known and frequently described phenomenon. For example, in extreme cases, such as in aluminum-based alloys, the temperature in the container may rise to almost 600 °C [23]. In the case of NiTi alloys, an increase in temperature to about 200 °C was found [24]. These are the conditions that favor the diffusion of alloying elements as well as the reduction in internal stresses and a change in the mean size of the crystallites.
The remains of solid solutions are an essential fact that influences the alloy formation. In Figure 2, one more significant diffractogram (marked as a “residue from container”) is summarized for a batch of 10 g mixed for 100 h. It was measured for the powder recovered from the inside walls of the container. It indicates the presence of nickel and titanium-based solid solutions. During grinding, especially at the beginning of the process, powders of alloying elements colliding with balls react with their surface, adhering to it and reacting with the walls of the container, to which they also adhere. This fact was proved by the phase composition identified for the powders recovered from the container walls. In addition to the amorphous/nanocrystalline phase, the powder also contains titanium-based solid solution (a small amount—the low intensity of diffraction lines) and a significant amount of nickel-based solid solution. The source of such a state can be found in the difference in the hardness of both alloying elements. Measurements of microhardness (µHV) show that for nickel, it equals 13, while for titanium, it was almost six times higher and equals 82. Literature data [25,26] show that nickel hardness is generally lower than that of titanium. Depending on the grain size, it can be 150–200 and 107–150 for titanium and nickel, respectively. Hence, nickel may show a greater tendency to deposition on walls of the container rather than on milling balls. The observations with the recorded maps of the element distribution done on the cross-sections of the milling ball revealed a presence of the layers deposited on their surface formed at the beginning of the grinding (Figure 6). Mainly, the grains of a titanium-based solid solution closely adhered to the surface of the steel balls. The nickel-based solid solution was present inside of the layer adhered to the surface of the milling ball. There are visible layers of reacted and alloying elements in which grains of a solid solution on a nickel matrix were embodied. During the extended grinding time, these grains detach from the walls of the container and mix with the rest of the powder; hence, their increased amount with extended grinding time was stated.
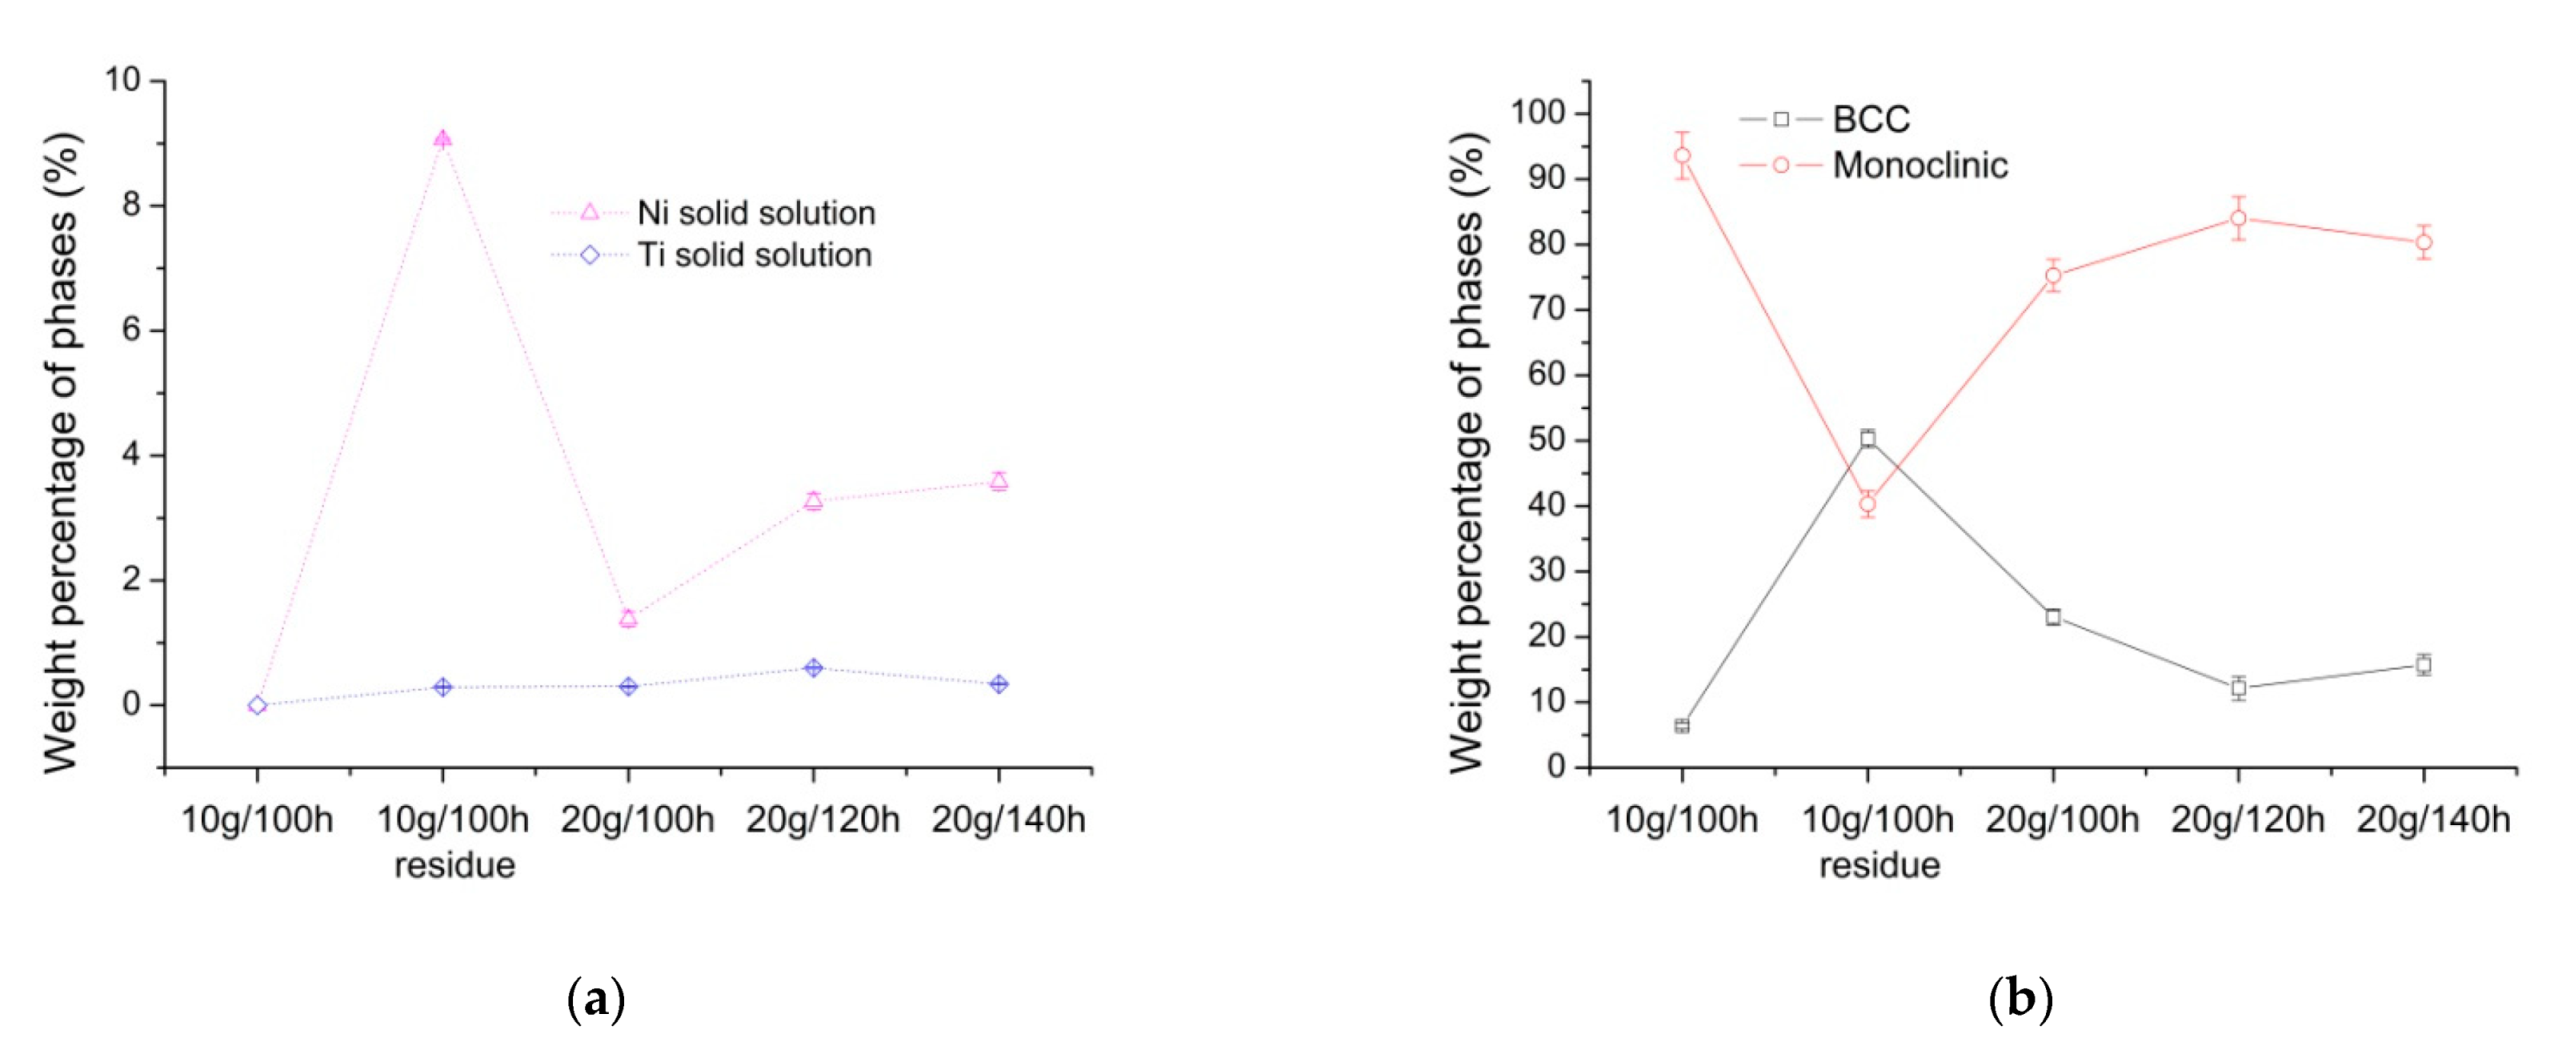
Figure 7 shows the weight percentage of phases calculated from the Rietveld refinement. The powder recovered from the container walls contained as much as 9 wg.% of nickel-based solid solution, whereas less than 0.5 g.% was found for titanium-based solid solution (Figure 7a). Moreover, the determined proportions of the precursor phases of the B2 parent phase and martensite indicate the effect of extending the grinding time on their weight fractions. The amount of the BCC phase decreases, whereas the monoclinic phase increases (Figure 7b).
It may be related to the energy supplied during the collision with balls and the internal walls of the container. Furthermore, it influenced the change in the dimensions of the nanocrystalline unit cells. The parameters of the crystal lattice of the BCC phase are comparable with those of the B2 parent phase (PDF-4 card no 03-065-0917; Figure 8a). A similar tendency is shown by the lattice parameters a0 and b0 determined for the monoclinic phase. They were convergent with the lattice parameters determined for the B19′ monoclinic martensite (PDF-4, card no 03-065-0365). However, the c0 and the γ monoclinic angle reduced their values relative to one determined for the standard. In particular, the monoclinic angle significantly lowers its value as the grinding time increases. Moreover, the mean crystallite size and the microstrain also changed their values (Figure 8b). Similar to the titanium-based solid solution, as the grinding time increases, the average crystallite size of the BCC and the monoclinic phase (for the 20 g batch) increased in comparison to 10 g batch. The microstrain decreased its value from about 1.5% to 1%. It proved that the supplied energy during the collision of the balls causes a more intense deformation of the crystal lattice of the BCC phase, leading to its monoclinic distortion. Hence, its loss at the expense of the monoclinic phase was observed for batch milled for 120 and 140 h.
The course of the crystallization process was investigated using DSC measurements. Samples were heated up from room temperature up to 600 °C with a 20 deg/min rate. Results of the measurements are shown in Figure 9. From DSC heating curves, the temperatures of the crystallization process (Ts—onset, Tp—peak and Te—end), as well as enthalpies, are determined and compared in Table 1.
The grinding conditions, such as grinding time, speed, the weight of the batch or ball-to-batch ratio, play an essential role and affect the microstructure of the mixture and the alloying elements themselves. Applied conditions for batch production (weight 10 g and 100 h milling) resulted in receiving completely amorphous/nanocrystalline alloy without solid solutions [18]. The crystallization appeared as a single-stage process. It begins at 517 °C, ends at 539 °C and is characterized by a relatively high enthalpy value—33 J/g. In contrast, the crystallization took place in several stages for an increased batch to 20 g. Moreover, it extended the temperature range of the crystallization process. Adjusting the grinding time to 100 h resulted in a temperature shift in the range of crystallization. It started at about 355 °C and ended at 467 °C. Extending the grinding time to 140 h requires more energy; hence, the crystallization started at 368 °C and ended at 591 °C. However, despite the higher temperature range, it turned out that extending the grinding time reduced the enthalpy of crystallization. For 140 h, the enthalpy was three times lower than for the 10 g batch milled for 100 h. Such a state may have been positively influenced by the previously described and discussed increase in the average size of crystallites as well as the reduction in microstrain caused by the extension of the grinding time.
However, the essential feature of the obtained alloys is the presence of a reversible martensitic transformation. This transformation takes place only in the crystalline state and must be reversible. Without this condition, shape memory phenomena do not exist. In order to investigate the presence of martensitic transformation and its reversible nature, thermograms were measured for the crystallized alloys in the temperature range from −120 °C to 140 °C at a rate of 10 deg/min (Figure 10a). Based on that, the characteristic parameters of the martensitic transformation were determined (Figure 10b). In general, the reversible martensitic transformation was found in all produced alloys. However, depending on the grinding conditions, the course of the transformation is different. In the case of a batch of 10 g/100 g, it is single-stage in the temperature range from −13 °C to 27 °C. A low enthalpy value characterizes the transformation, approximately 0.8 J/g. This value shows that there is a small amount of phase that can undergo martensitic transformation. Increasing the amount of batch to 20 g had a positive effect on an increase in enthalpy. It was increased twice in comparison to the batch 10 g. The two-stage transformation occurred in the range from −32 °C to 56 °C. Similarly, the three-stage/step course was shown for the batch milled 120 and 140 h. Multiple stages may originate in the heterogeneity of the martensitic phase’s chemical composition, which is undergoing the martensitic transformation. This fact is known even for alloys cast by traditional methods. The mechanism was previously described in the literature [27]. Characteristic temperatures of the martensitic transformation were shifted to the range of −7 °C to 77 °C and practically did not differ much from each other. However, for the grinding time extended to 120 and 140 h, the enthalpy value increased to 4 and 5 J/g, respectively. The obtained enthalpy values are twice as high, using only the crystallization at 600 °C, than in [14], without the need for additional annealing at 1000 °C. This fact proves the beneficial effect of increasing the batch weight and extending the grinding time on the course of the martensitic transformation.

4. Conclusions

The research carried out and the results obtained, including the effect of increasing the charge mass in high-energy ball milling on producing NiTi alloy, can be summarized by drawing the following conclusions:
  • Using a grinding speed of 250 rpm and increasing the batch weight to 20 g allows the production of NiTi alloy in the form of a powder with the size of agglomerates up to 700 µm but with reduced crystallites size to 2 nm.
  • Extending the grinding time reduces microstrains and increases the monoclinic phase’s amount at the expense of the BCC. Both phases are the precursors of one involved in the reversible martensitic transformation.
  • Regardless of the size of the batch weight and the grinding time, the produced NiTi alloy crystallizes at a temperature below 600 °C and undergoes a reversible martensitic transformation. However, in increased batch, it occurs as a multi-step process.
  • Increasing the batch weight to 20 g simultaneously with extending grinding time to 140 h increased the amount of the phase, which undergoes a martensitic transformation and increases its enthalpy to 5 J/g.

Author Contributions

Conceptualization, T.G.; methodology, T.G., P.S.; investigation, T.G., P.S.; writing—original draft preparation, T.G., P.S.; data analysis, T.G., P.S. All authors contributed to writing—review and editing. All authors have read and agreed to the published version of the manuscript.

Funding

This research received no external funding.

Institutional Review Board Statement

Not applicable.

Informed Consent Statement

Not applicable.

Data Availability Statement

The data were obtained from the measurements made by the authors. They are available at the Institute of Materials Science and Engineering of the University of Silesia in Katowice. They can be made available only with the authors’ agreement.

Acknowledgments

The authors express their thanks to Grzegorz Dercz (University of Silesia in Katowice, Institute of Materials Engineering), for his help during alloy production.

Conflicts of Interest

The authors declare no conflict of interest.

References

  1. Buehler, W.J.; Gilfrich, J.V.; Wiley, R.C. Effect of low-temperature phase changes on the mechanical properties of alloys near composition TiNi. J. App. Phys. 1963, 34, 1475–1477. [Google Scholar] [CrossRef]
  2. Wayman, C.M.; Harrison, J.D. The origins of the shape memory effect. JOM 1989, 41, 26–28. [Google Scholar] [CrossRef]
  3. Otsuka, K.; Wayman, C.M. Shape Memory Materials; Cambridge University Press: Cambridge, UK, 1998. [Google Scholar]
  4. Duerig, T.; Stoeckel, D.; Johnson, D. SMA: Smart materials for medical applications. In Proceedings of the SPIE 4763, European Workshop on Smart Structures in Engineering and Technology, Giens, France, 21–23 May 2002; pp. 7–15. [Google Scholar]
  5. Jani, J.M.; Leary, M.; Subic, A.; Gibson, M.A. A review of shape memory alloy research, applications and opportunities. Mater. Des. 2014, 56, 1078–1113. [Google Scholar] [CrossRef]
  6. Zhang, H.; Li, X.; Zhang, X. Grain-size-dependent martensitic transformation in bulk nanocrystalline TiNi under tensile deformation. J. Alloys Comp. 2012, 544, 19–23. [Google Scholar] [CrossRef]
  7. Gil, F.J.; Manero, J.M.; Planell, J.A. Effect of grain size on the martensitic transformation in NiTi alloy. J. Mater. Sci. 1995, 30, 2526–2530. [Google Scholar] [CrossRef]
  8. Li, B.; Shen, Y.; An, Q. Structural origin of reversible martensitic transformation and reversible twinning in NiTi shape memory alloy. Acta Mater. 2020, 199, 240–252. [Google Scholar] [CrossRef]
  9. Waitz, T.; Karnthaler, H.P. Martensitic transformation of NiTi nanocrystals embedded in an amorphous matrix. Acta Mater. 2004, 52, 5461–5469. [Google Scholar] [CrossRef]
  10. Shi, X.B.; Ma, Z.Y.; Zhang, J.S.; Ding, H.L.; Guo, F.M.; Liu, Y.; Cui, L.S. Grain size effect on the martensitic transformation temperatures of nanocrystalline NiTi alloy. Smart Mater. Struct. 2015, 24, 072001. [Google Scholar] [CrossRef]
  11. Neves, F.; Braz Fernandes, F.M.; Martins, I.; Correia, J.B.; Oliveira, M.; Gaffet, E.; Wang, T.Y.; Lattemann, M.; Suffner, J.; Hahn, H. Nonconventional production technologies for NiTi shape memory alloys. In Proceedings of the 8th European Symposium on Martensitic Transformations, Prague, Czech Republic, 7–11 September 2009; Šittner, P., Paidar, V., Heller, L., Seiner, H., Eds.; [Google Scholar]
  12. Chank, Y.; Berger, S.; Weiss Brook-Levinson, B.Z. Solid state amorphization by mechanical alloying–an atomistic model. Acta Mater. 1994, 42, 3679–3685. [Google Scholar]
  13. Igharo, M.; Wood, J.V. Compaction and sintering phenomena in titanium—nickel shape memory alloys. Powder Metall. 1985, 28, 131–139. [Google Scholar] [CrossRef]
  14. Maziarz, W.; Dutkiewicz, J.; Van Humbeeck, J.; Czeppe, T. Mechanically alloyed and hot pressed Ni–49.7Ti alloy showing martensitic transformation. Mater. Sci. Eng. A 2004, 375, 844–848. [Google Scholar] [CrossRef]
  15. Ghadimi, M.; Shokuhfar, A.; Rostami, H.R.; Ghaffari, M. Effects of milling and annealing on formation and structural characterization of nanocrystalline intermetallic compounds from Ni–Ti elemental powders. Mater. Lett. 2012, 80, 181–183. [Google Scholar] [CrossRef]
  16. Bozorg, S.F.K.; Rabiezadeh, A. Powder based on nano-crystalline NiTi produced using high energy ball milling and subsequent heat treatment. In Proceedings of the International conference on advancement of materials and nanotechnology, Langkawi, Malaysia, 29 May–1 June 2009; Volume 1217, pp. 452–456. [Google Scholar]
  17. Sadrnezhaad, S.K.; Selahi, A.R. Effect of mechanical alloying and sintering on Ni-Ti powders. Mater. Manuf. Proc. 2004, 19, 475–486. [Google Scholar] [CrossRef]
  18. Salwa, P.; Goryczka, T. Crystallization of mechanically alloyed Ni50Ti50 and Ti50Ni25Cu25 shape memory alloys. J. Materi. Eng. Perform. 2020, 29, 2848–2852. [Google Scholar] [CrossRef]
  19. Rietveld, H.M. Line profiles of neutron powder diffraction peaks for structure refinement. Acta Crystallogr. 1967, 22, 151–152. [Google Scholar] [CrossRef]
  20. Zak, A.K.; Majid, W.A.; Abrishami, M.E.; Yousefi, R. X-ray analysis of ZnO nanoparticles by Williamson-Hall and size-strain plot methods. Solid State Sci. 2011, 13, 251–256. [Google Scholar] [CrossRef]
  21. Massalski, B.; Okamoto, H.; Subramanian, P.R.; Kacprzak, L. Binary Alloy Phase Diagram; ASM International: Materials Park, OH, USA, 1992; p. 2874. [Google Scholar]
  22. Slater, J.C. Atomic radii in crystals. J. Chem. Phys. 1964, 41, 3199–3203. [Google Scholar] [CrossRef]
  23. Suryanarayana, C. Recent advances in the synthesis of alloy phases by mechanical alloying/milling. Met. Mater. 1996, 2, 195–209. [Google Scholar] [CrossRef]
  24. Hellstern, E.; Fecht, H.J.; Fu, Z.; Johnson, W.L. Stability of CsCl-type intermetallic compounds under ball milling. J. Mater. Res. 1989, 4, 1292–1295. [Google Scholar] [CrossRef]
  25. Vemula, A.M.; Reddy, G.C.M.; Hussain, M.M. Evaluation of texture, microstructure and microhardness of commercially pure titanium (grade 1/BT 1-00). Int. J. Mech. Eng. Technol. 2017, 8, 398–407. [Google Scholar]
  26. Yang, Z.; Welzel, U. Microstructure-microhardness relation of nanostructured Ni produced by high-pressure torsion. Mater. Lett. 2005, 59, 3406–3409. [Google Scholar] [CrossRef]
  27. Khalil-Allafi, J.; Eggeler, G.; Dlouhy, A.; Schmahl, W.W.; Somsena, C. On the influence of heterogeneous precipitation on martensitic transformations in a Ni-rich NiTi shape memory alloy. Mater. Sci. Eng. A 2004, 378, 148–151. [Google Scholar] [CrossRef]
Figure 1. SEM images observed for powders: Ni—initial state (a), Ti—initial state (b) and for batch 20 g after mixing for 100 h (c) and 140 h (d).
Metals 11 01908 g001
Figure 2. Set of thy X-ray diffraction patterns measured at room temperature for produced alloy.
Metals 11 01908 g002
Figure 3. SEM image of the agglomerate cross-sections observed for batch 20 g milled 100 h.
Metals 11 01908 g003
Figure 4. Result of the Rietveld refinement done for batch 20 g milled 140 h.
Metals 11 01908 g004
Figure 5. Lattice parameters (a) and crystallite size and microstrains (b) versus milling conditions determined for nickel and titanium-based solid solutions.
Metals 11 01908 g005
Figure 6. SEM image and distribution map of alloying element observed for the ball cross-section for sample 20 g milled 140 h.
Metals 11 01908 g006
Figure 7. Weight percentage of phases calculated from the Rietveld refinement for Ti and Ni-based solid solution (a) as well as BCC and monoclinic phases (b) versus milling conditions.
Metals 11 01908 g007
Figure 8. Lattice parameters (a) and crystallite size and microstrains (b) versus milling conditions determined for the BCC and the monoclinic phase.
Metals 11 01908 g008
Figure 9. DSC heating curves measured at rate of 20 deg/min for all mixed powders.
Metals 11 01908 g009
Figure 10. DSC heating curves measured for samples after crystallization at 600 °C (a) as well as characteristic parameters of the martensitic transformation (b).
Metals 11 01908 g010
Table 1. Parameters of the crystallization process determined from DSC measurements done for the NiTi sample series.
Mixing ConditionsTS
(°C)
Peak 1Peak 2Peak 3TE
(°C)
Htotal
(J/g)
Weight (g)Time (h)TP2
(°C)
HP1
(J/g)
TP2
(°C)
HP2
(J/g)
TP3
(°C)
HP2
(J/g)
10100517----53033.453933.4
2010035541216.845318.846922.446758.4
201203634175.14585.65526.858217.5
201403684164.04624.45525.459113.8
Publisher’s Note: MDPI stays neutral with regard to jurisdictional claims in published maps and institutional affiliations.

