Article

Evaluation of Fatigue Characteristics of Aluminum Alloys and Mechanical Components Using Extreme Value Statistics and C-Specimens

School of Mechanical Engineering, College of Engineering, Korea University, Seoul 02841, Korea
*
Author to whom correspondence should be addressed.
Metals 2021, 11(12), 1915; https://doi.org/10.3390/met11121915
Submission received: 22 October 2021 / Revised: 21 November 2021 / Accepted: 23 November 2021 / Published: 27 November 2021

Abstract

:
In this study, the fatigue characteristics of aluminum alloys and mechanical components were investigated. To evaluate the effect of forging, fatigue specimens with the same chemical compositions were prepared from billets and forged mechanical components. To evaluate the cleanliness of the aluminum alloys, the cross-sectional area of specimens was observed, and the maximum inclusion sizes were obtained using extreme value statistics. Rotary bending fatigue tests were performed, and the fracture surfaces of the specimens were analyzed. The results show that the forging process not only elevated the fatigue strength but also reduced the scatter of the fatigue life of aluminum alloys. The fatigue characteristics of C-specimens were obtained to develop finite-element method (FEM) models. With the intrinsic fatigue properties and strain–life approach, the FEM analysis results agreed well with the test results.

1. Introduction

Scroll compressors have been widely used in the automobile and air-conditioning industries. Recently, for weight reduction, scroll compressors using aluminum have been developed. However, problems in durability and reliability often occur because of aluminum material properties and processing properties. Owing to the complex shape of the scroll compressor, it is very challenging to simulate the behavior of the cracks that occur during use. In addition, in the case of aluminum, there is no fatigue limit, and inclusions or defects often cause fatigue damage. Therefore, it is very important to develop a reliability evaluation and analysis technique for such an aluminum scroll compressor.
From a material perspective, it is important to evaluate the fatigue properties of materials to ensure that the mechanical component endures the expected working life. The fatigue properties of a material are determined by various physical properties, such as the tensile properties, hardness, and microstructure of the material. The most relevant parameter is the ultimate tensile strength σu. However, intensive studies have shown that other parameters should also be considered [1,2,3,4,5]. Murakami et al. [6] proposed that the fatigue limit σw of a material is a function of its hardness and inclusion size,
σ w = 1.43 ( H V + 120 ) ( a r e a ) 1 / 6 ,
where HV is the Vickers hardness and area is the parameter that characterizes the size of inclusions. This approach provides meaningful results in that the inclusion of the material is often the origin of fatigue failure. In particular, for casting aluminum, porosity and other casting defects are detrimental to the fatigue [7,8,9]. The equation was modified for aluminum alloys [10,11,12].
σ w = 1.43 ( H V + 120 × E a l E s t ) ( a r e a ) 1 / 6 ,
σ w = 1.43 ( H V + 75 ) ( a r e a ) 1 / 6 ,
where Eal/Est is the ratio of the Young’s modulus of aluminum to that of steel. The fatigue characteristics of wrought aluminums have also been studied in many literatures [13,14,15,16,17]. McCullough et al. studied the small crack growth behaviors of 6061 aluminum under different heat treatment conditions [17]. However, the effects of material processing, which significantly affect the material properties, including fatigue, have not been extensively investigated.
In addition to fatigue tests, finite-element method (FEM) analyses have been widely applied for the structural reliability of mechanical components. For FEM analyses, the fatigue properties of the material should be determined. In general, the stress-life (S-N) approach is the basic concept underlying the fatigue life assessment where N is the life cycle, σ a is the amplitude stress, σ f is the fatigue strength coefficient, and b is the fatigue strength exponent (Equation (4)). This is useful when the crack initiation life is of interest. The fatigue damage accumulation can be calculated by the following equation using the Miner’s rule [18].
σ a = σ f × ( N ) b
n i N i = D
where ni and Ni is the number of life cycles and the fatigue life in cycles at a certain stress level, respectively, and D is the damage fraction. Another factor used to calculate the crack initiation cycle is the mean stress effect, which provides a counting method for correction of nonuniform loading conditions [18]. The Goodman and Gerber methods are the most frequently-used models based on the S-N approach. However, the S-N approach has limitations in plastic deformation [18].
Regarding the Bauschinger effect, the strain–life (ε-N) approach should be considered in some cases [18]. The ε-N approach can include the plastic deformation of the material between the loading and unloading regions. The method can be expressed by [18].
ε a 2 = σ f E × ( N ) b + ε f   ( N ) c ,
where ε a is the strain amplitude, σ f is the fatigue strength coefficient, N is the life cycle, E is the Young’s modulus, b is the fatigue strength exponent, ε f is the fatigue ductility coefficient, and c is the fatigue ductility exponent. There are two mean stress effect correction models, Morrow (Equation (7)) and Smith–Watson–Topper (SWT) (Equation (8)) models [13],
ε a 2 = σ f σ m E ( N ) b + ε f   ( σ f σ m σ f ) c b ( N ) c ,
σ m a x ε a = ( σ f ) 2 E ( N ) b + ε f   σ f   ( N ) b + c ,
where σ m a x is the maximum stress during the fatigue life. Ince et al. [19] indicated that the SWT model can apply changes in the load by calculating the energy multiplied by σ m a x . This method is flexible, particularly under high-loading conditions. They also applied the same methodology to predict fatigue characteristics using the SWT model to evaluate the multi-axial fatigue life [19].
Park et al. [20] studied the fatigue characteristics of a scroll compressor and proposed FEM models to assess the fatigue life. However, the effects of forging and inclusion size were not considered. In this study, rotary bending fatigue tests were conducted to obtain the intrinsic fatigue properties of forged and nonforged aluminum alloys. The specimens were analyzed using an optical microscope, MM400 from Nikkon (Tokyo, Japan), to assess the size of the inclusions.
The maximum size of the inclusion was evaluated using extreme value statistics. In addition, C-specimens, which were developed to evaluate the fatigue characteristics of scroll compressors [20], were used to estimate the fatigue life of scroll compressors. Bending fatigue tests were carried out using a servo hydraulic test machine, Model 810 from MTS (Eden Prairie, MN, USA), and the results were compared to the FEM analysis results.

2. Materials and Methods

Rotary bending fatigue tests were carried out for both forged (Al-F) and nonforged (Al-NF) aluminum 4000A-based alloys to evaluate the fatigue properties and the effects of forging. The chemical compositions of the modified aluminum 4000A alloys are shown in Table 1. Aluminum billets were prepared by continuous casting. Al-NF specimens were machined from nonforged billets, whereas the Al-F specimens were machined from forged mechanical components. Both specimens were prepared in an hourglass shape, as shown in Figure 1, and the surfaces were polished to minimize the scatter in the fatigue life.
A rotary bending fatigue tester, Model H-7 test machine from Shimadzu (Kyoto, Japan) was used. The stress ratio R (minimum over maximum stress in a cycle) and test frequency f were fixed at −1 and 50 Hz, respectively. Specimens that survived the fatigue life, Nf, over 107 cycles were marked as run-out. The mechanical properties of the specimens are listed in Table 2. The tensile properties were determined using a servo hydraulic test machine, Model 810 from MTS (Eden Prairie, MN, USA). The strain rate was 0.015 min−1. ASTM E8 specimens were used [21]. The Brinell hardness (HRB) was measured and converted to Vickers hardness (HV) based on the ASTM E140 standard [22].
The sizes of the interior defects of the aluminum alloy were analyzed using extreme value statistics [6,23,24]. Murakami et al. [6] proposed that the fatigue strength of metals can be estimated using the maximum inclusion size parameter √areamax. To measure the sizes of the inclusions, it is necessary to observe the interior of the specimens using an optical microscope. The specimens were cut in the radial direction, which was perpendicular to the principal stress direction. The cross-sectional surfaces were mirror-polished using sandpapers (grit size: 100–2400) and diamond paste (particle sizes: 6 µm and 1 µm).
To obtain flat, polished surfaces, the specimens were mounted using epoxy resin. The total inspection area S and corresponding inspection depth D0 were selected to include the location of the origin of fatigue failures (Figure 2 and Figure 3). Throughout the total inspection area S, every unit inspection area S0, which is the size of the observation area according to the magnification of microscope, was observed, and the corresponding maximum inclusion size √areamax,i was obtained. The total number of So is n. Using the following equations, extreme value plots can be obtained,
F i = i n + 1 × 100 ( % ) ,
y i = ln [ ln i n + 1 ] = ln [ ln T 1 T ]   where   T = S + S 0 S 0 ,
a r e a m a x = a y + b .
The cumulative distribution function Fi and return period T represent the confidence interval of the fatigue strength. By selecting an adequate Fi, √areamax can be determined properly. If the confidence interval is too wide, the fatigue strength becomes more conservative. In the opposite case, fatigue properties cannot be a reliable criterion.
A C-specimen was proposed to evaluate the fatigue properties of the scroll compressor. This is an intermediate form of the mechanical component and standard specimen. To directly obtain reliability, the mechanical component should be assessed; however, it is challenging to observe and understand the failure mechanisms of a product in real time. On the contrary, standard specimens are useful in the characterization of materials, but they do not contain information about the components. For these reasons, C-specimens were used to carry out fatigue tests during the design stage.
Figure 4 illustrates the C-specimen and fatigue test jigs. The scroll wrap is modified to eliminate redundant parts, so that the bending force can be applied to the region of interest. The jigs were designed to align the loading axis to the center of the load cell. C-specimens were fixed on the jigs with six M6 screws, and the assembly was mounted on a servo hydraulic test machine, Model 810 from MTS (Eden Prairie, MN, USA). Load-controlled fatigue loading was applied on the wrap surfaces. The test frequency was 10 Hz, while the force ratio Rf was 1/80 to prevent shock damage.
During the fatigue tests, the load and displacement of the jig tip were measured to characterize the fatigue behavior of the C-specimens. The displacement range at each cycle, Δd, can be used as the crack-initiation parameter. Figure 5 shows a typical displacement–cycle curve. In the early stage of the test, a plateau region is observed. After certain cycles, Nini, Δd increases because the crack initiation deteriorates the stiffness of the component. As the crack propagates, Δd continuously increases. At Nf, the crack reaches the end of the scroll wrap, and a rapid change in Δd can be observed. The crack then penetrates the bottom of the scroll. Using the Δd-N curve, the fatigue properties of the mechanical components can be easily assessed and categorized. In this study, we focused on the crack initiation in the C-specimen, and Nini was evaluated.
A commercial program, Optistruct 2021 from Altair (Troy, MI, USA) was used to obtain Nini using the FEM). Based on the Miner’s rule, if the fatigue damage fraction reaches 1, it implies crack initiation. The fatigue solver of Optistruct implements the linear analysis. Based on the results of one static step analysis, the FEM calculates the life using Miner rule. In this study, the ε-N approach was applied using the Morrow and SWT models. The S-N approach has been considered for similar materials and mechanical components [25]. The fatigue parameters used in Equation (5) are listed in Table 3. The fatigue strength coefficient σf and fatigue strength exponent b were obtained from the S-N curves generated in this study, while the remaining parameters were obtained from [18].
The size of the elements was 0.3 mm. In a previous study, it was verified that the FEM results agree well with the test results [20]. The boundary conditions were also determined to reproduce the experimental conditions [20]. Forces are applied to the nodes that contact the loading jig. The total force is the sum of the forces applied on each node. The red area in Figure 6 illustrates the constraint conditions in the FEM analyses. To demonstrate bolt fastening, the contact area with the jig was fixed, as shown in Figure 6. All nodes in the fixed contact area were constrained in all directions. The mean stress effects were considered during simulations using the Morrow and SWT models.

3. Results and Discussion

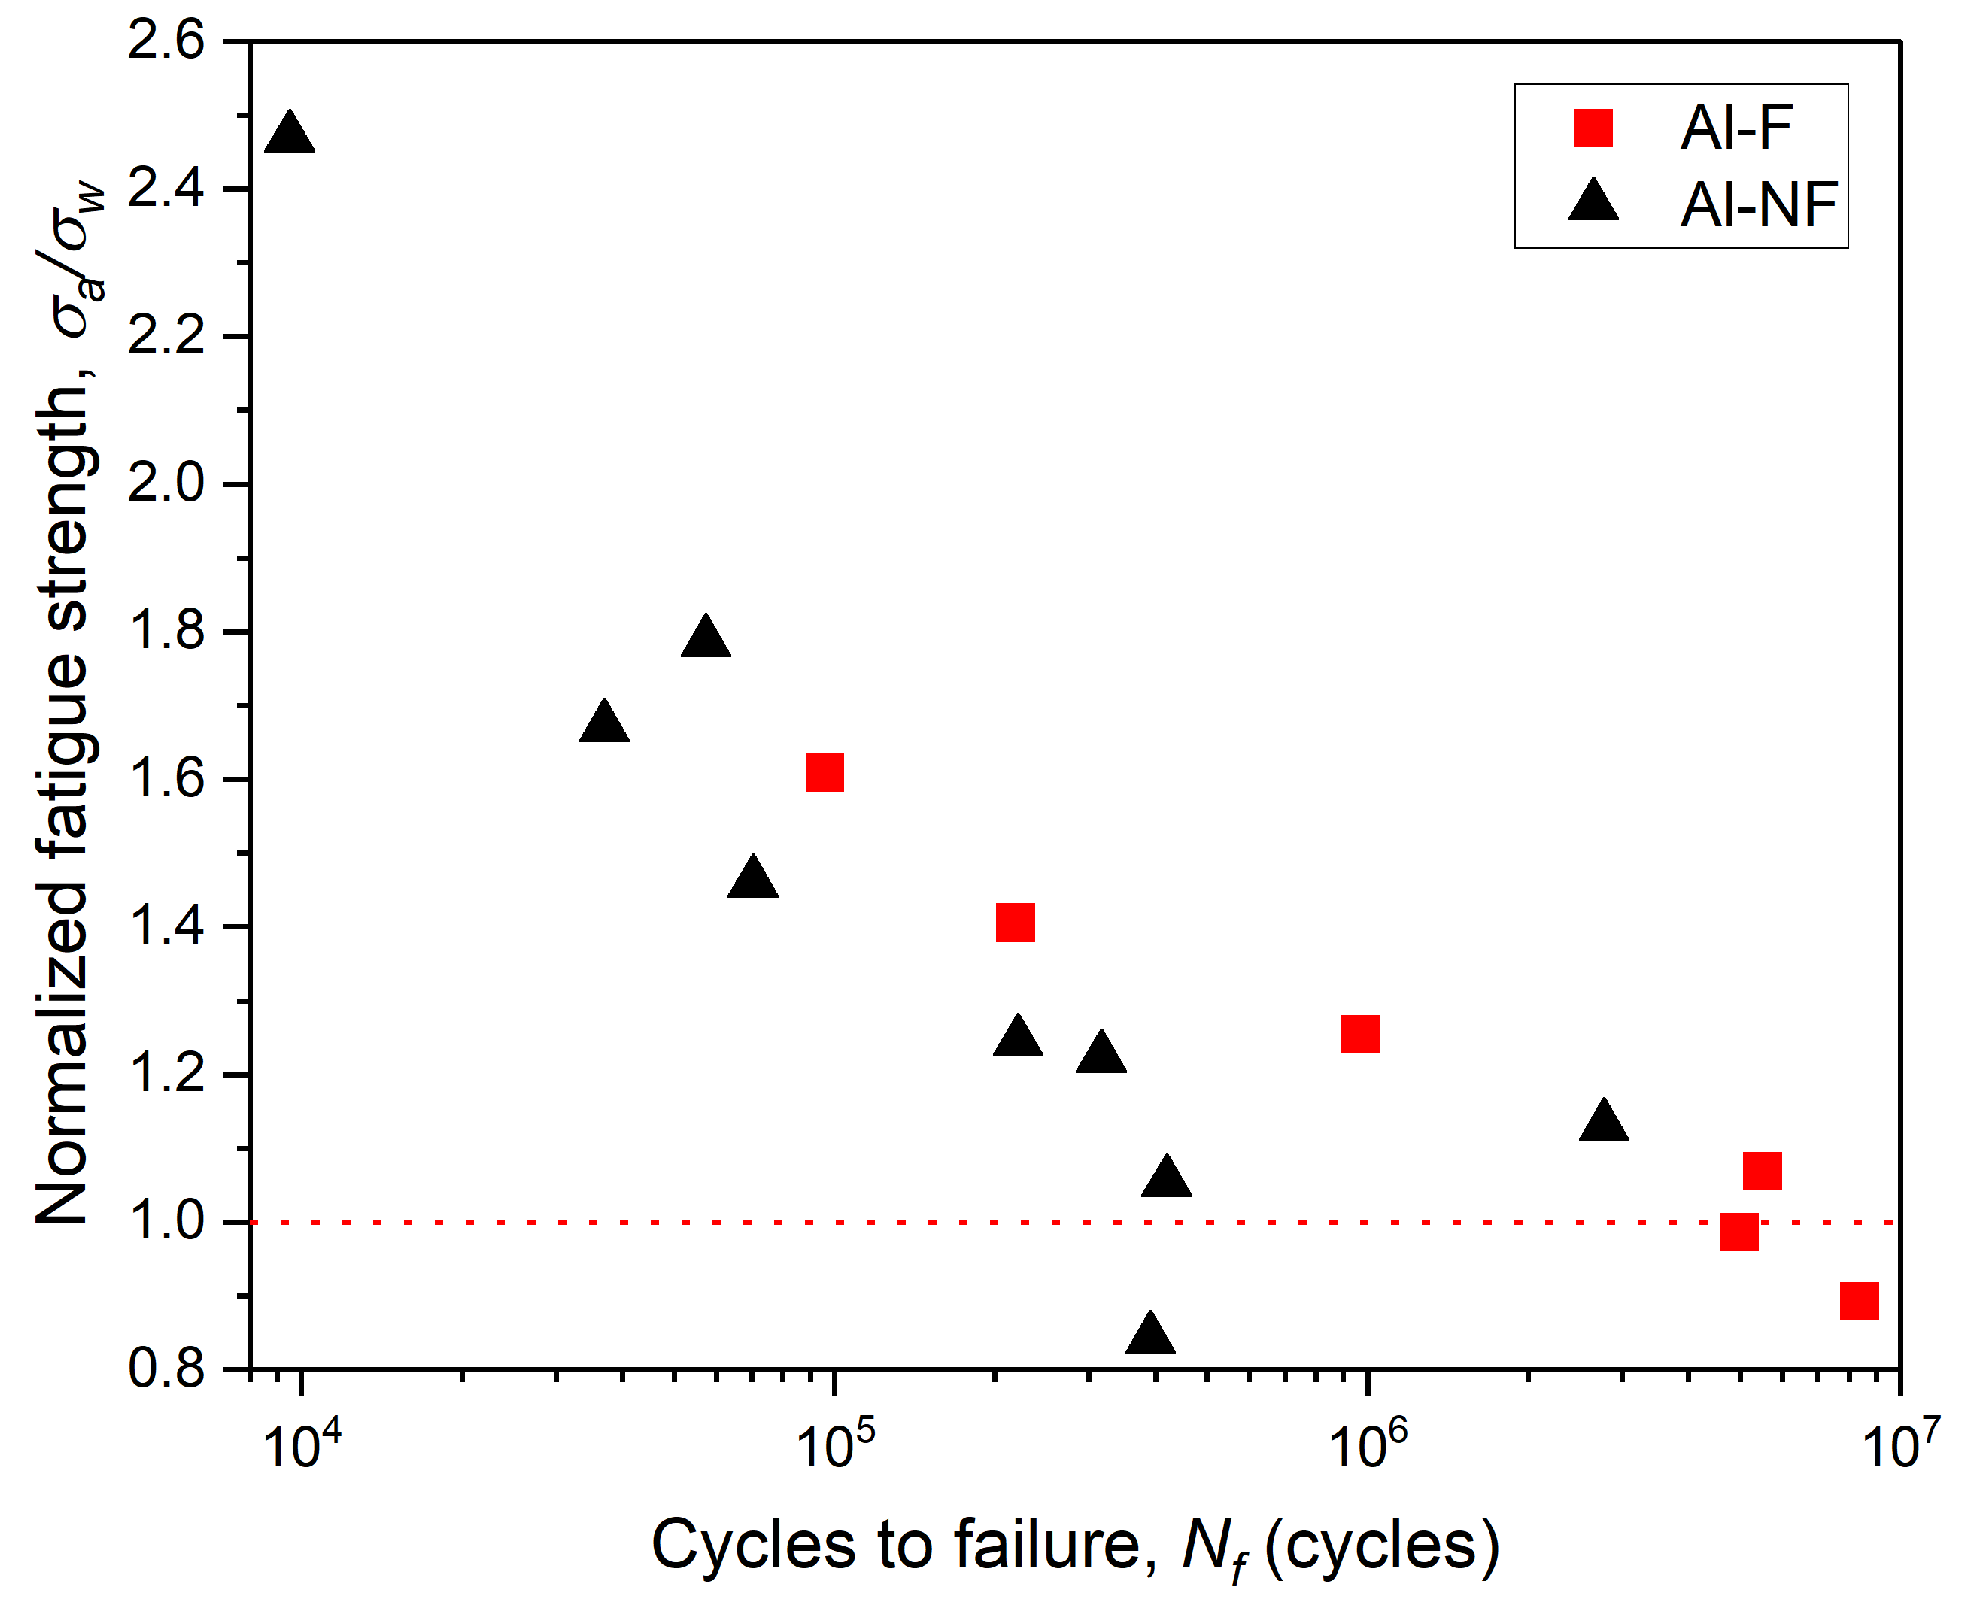
3.1. Rotary Bending Fatigue Tests

The fatigue test results of hourglass specimens are shown in Figure 7. The S-N curves show that Al-F has relatively longer and less scattered fatigue characteristics than those of Al-NF. In particular, the Al-NF specimens exhibited noticeable discrepancies when the stress amplitude was smaller than 200 MPa. Linear fitting curves were obtained from datasets that excluded run-out specimens.
σ a = 10 2.98 N f 0.087   for   Al F ,   R 2 = 0.98 ,
σ a = 10 2.84 N f 0.095   for   Al NF ,   R 2 = 0.68 .
Using the fitting curves, the apparent fatigue limit σf, which is the fatigue strength at Nf = 107 cycles, can be estimated as σf = 233 MPa for Al-F and 149 MPa for Al-NF. Considering that the yield strength and tensile strength of the materials vary by no more than 15 MPa, the forging can be considered a dominant factor determining the fatigue properties of the materials. Both alloys failed at the surface as well as from interior inclusions; however, Al-NF specimens were more likely to be affected by the inclusions. The Al-F alloy specimens show relatively consistent fatigue lifetime regardless of the failure mechanism, but when Al-NF alloy specimens failed from inclusions, Nf significantly decreased in the high cycle region.

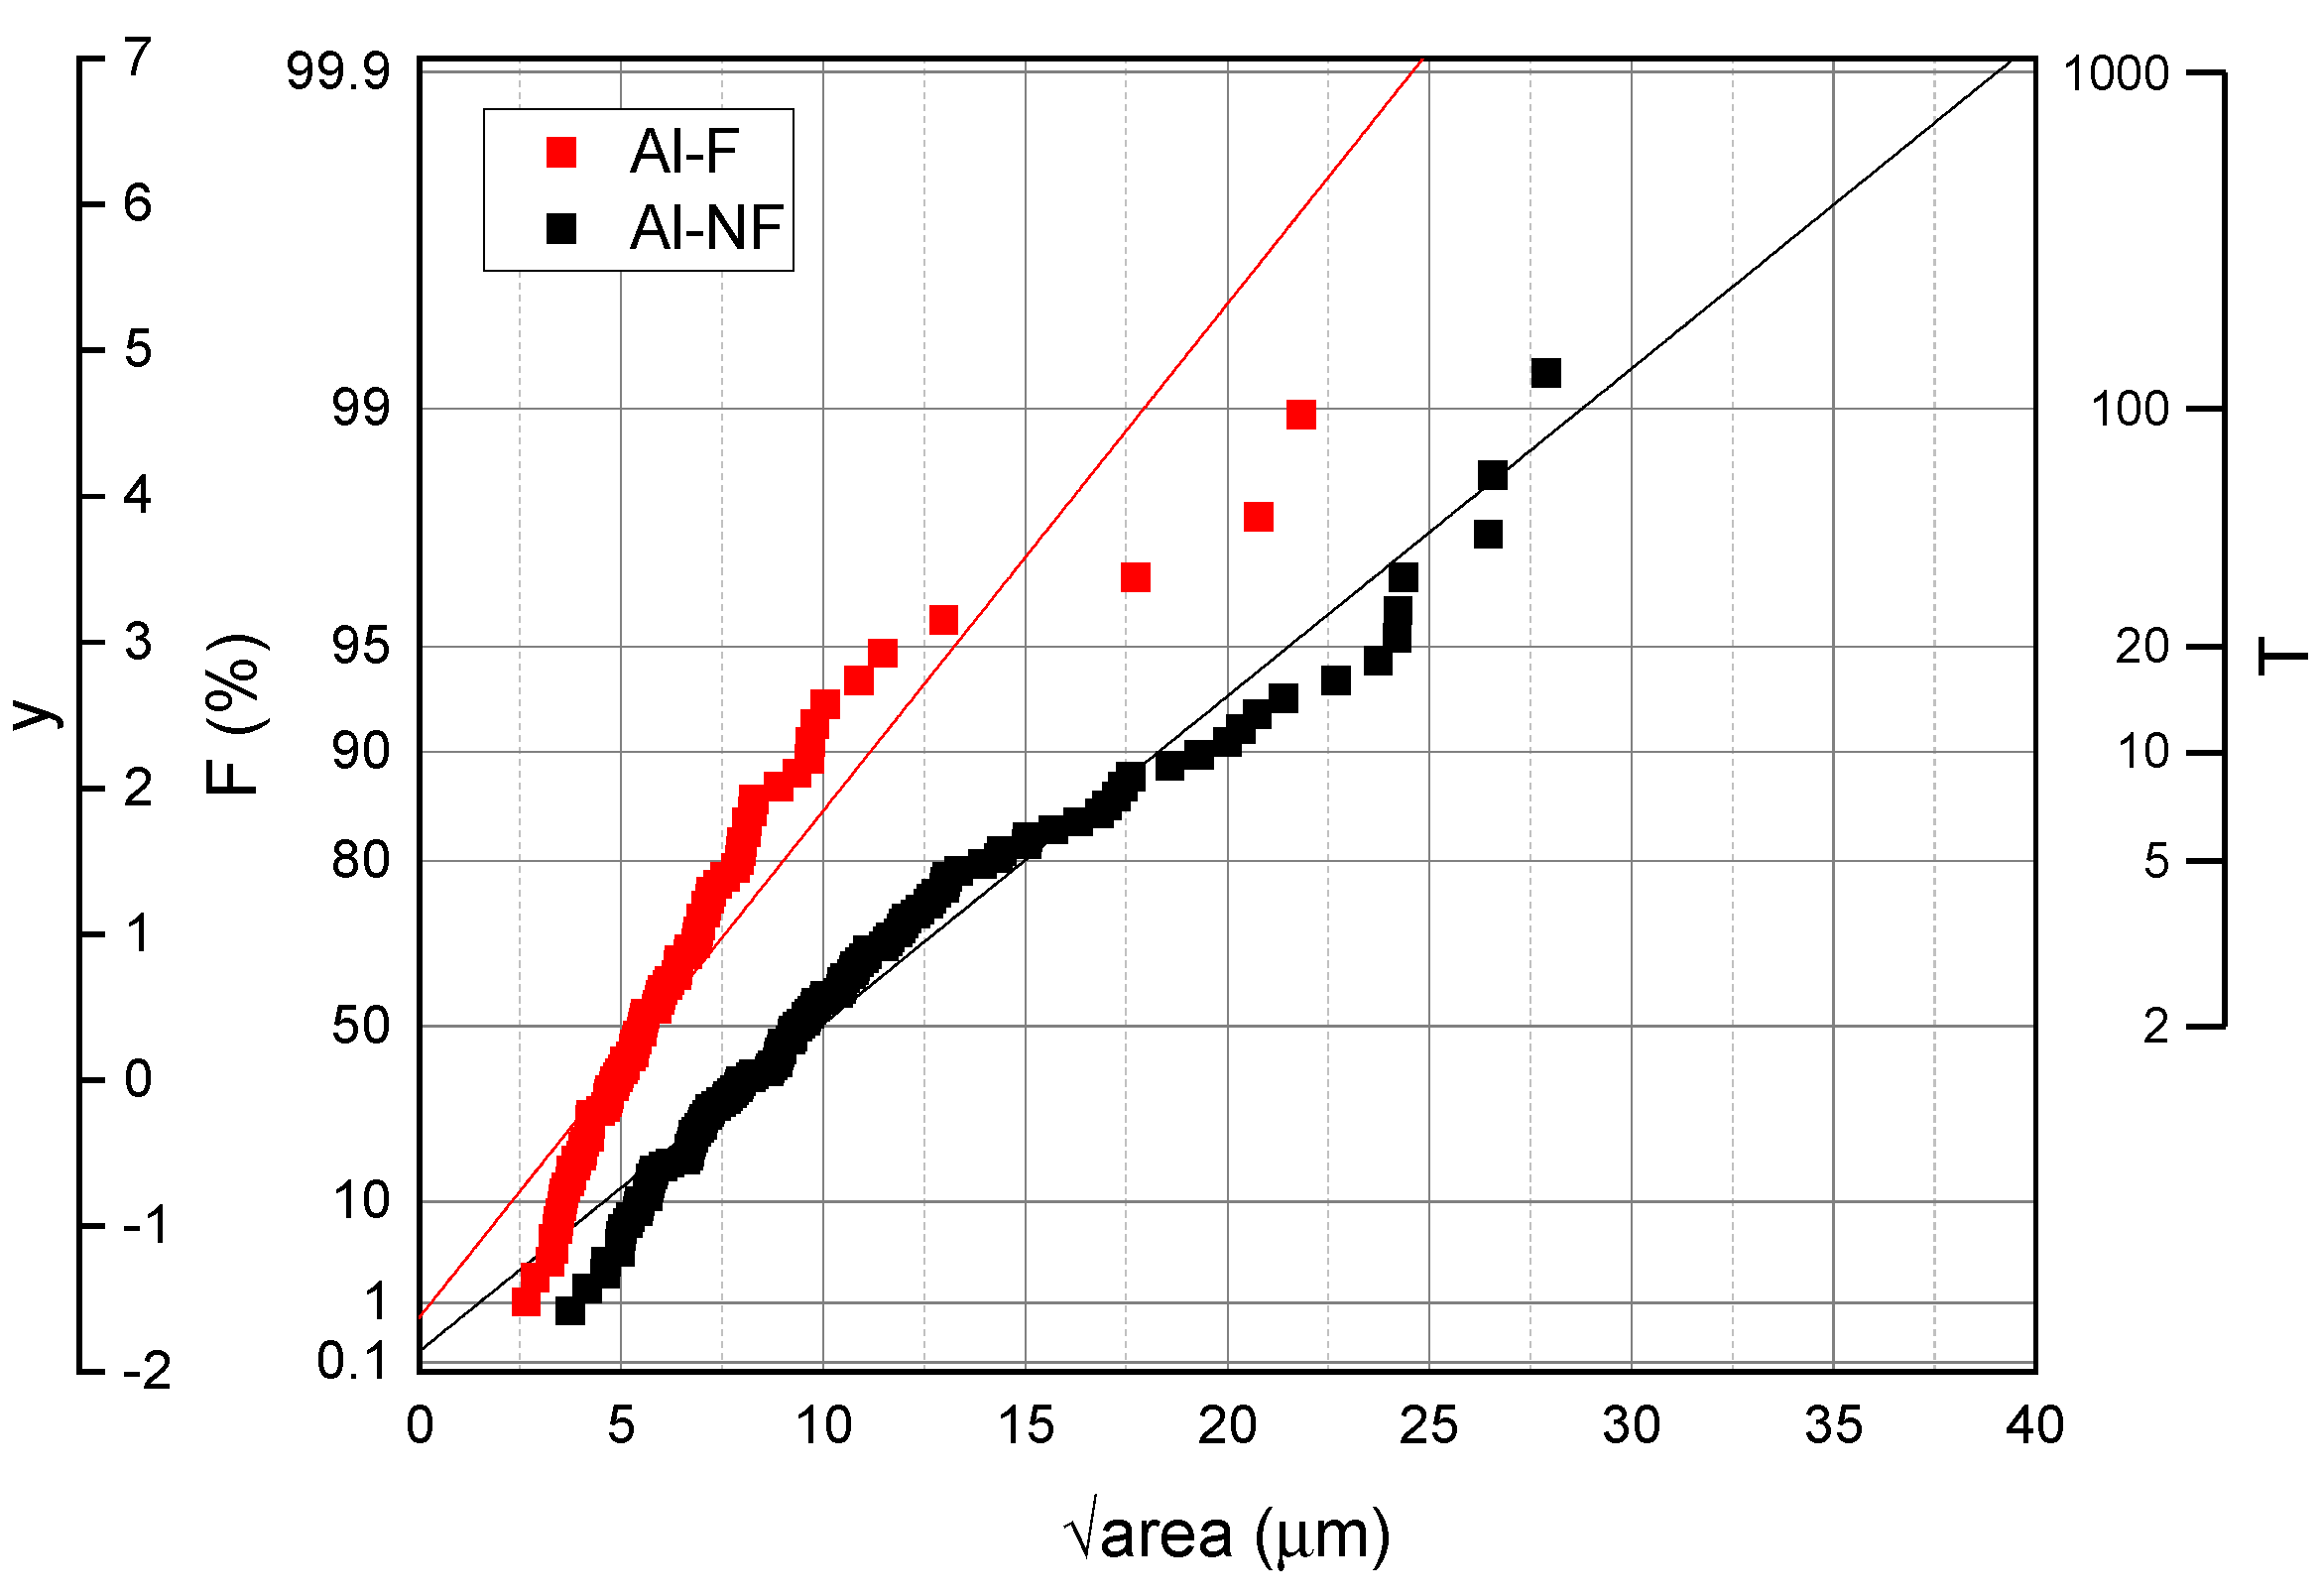
3.2. Inclusion Size Assessment and Fatigue Strength Estimation

Figure 8 shows the modified S-N curves of Al-F and Al-NF alloys. The normalized fatigue strength σa/σw was calculated using the equation proposed by Murakami et al. (Equation (1)). Specimens that failed from the interior inclusion were observed by OM, and their inclusion sizes were measured to estimate the corresponding fatigue limit. Then, the fatigue strength of each specimen was normalized by their expected fatigue limit, σw.
The normalized fatigue strengths indicate the discrepancy between the test stress amplitude and the hypothetical fatigue limit of the specimen. As shown in Figure 8, σa/σw is larger for a shorter fatigue life. The value converges to 1 when the fatigue cycles approached 107 cycles. The modified S-N curves of both Al-F show that the √area method is applicable for forged aluminum alloys. For the Al-NF alloy, the scatter in fatigue life and rapid deterioration in fatigue strength between 105–106 cycles is observed, and therefore the σa/σw value may be underestimated compared to that of the Al-F alloy.
The cumulative frequencies F of the inclusion sizes for Al-F and Al-NF are shown in Figure 9. It can be observed that √areamax of the Al-NF specimen is larger than that of the Al-F specimen for the same cumulative frequency. In other words, the Al-NF alloy is more vulnerable to fatigue failures that initiate from internal defects. When F = 95%, the √areamax was 13 μm for Al-F and 21 μm for Al-NF.

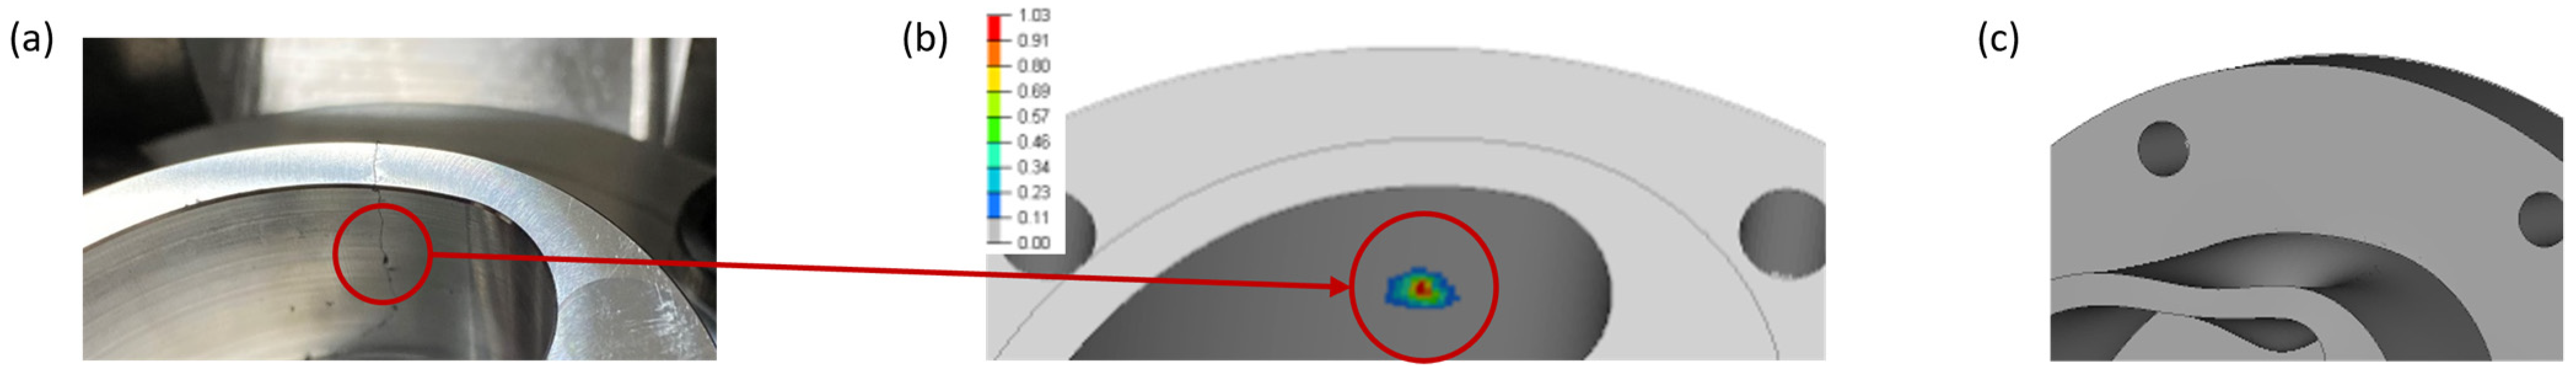
3.3. C-Specimen Fatigue Tests
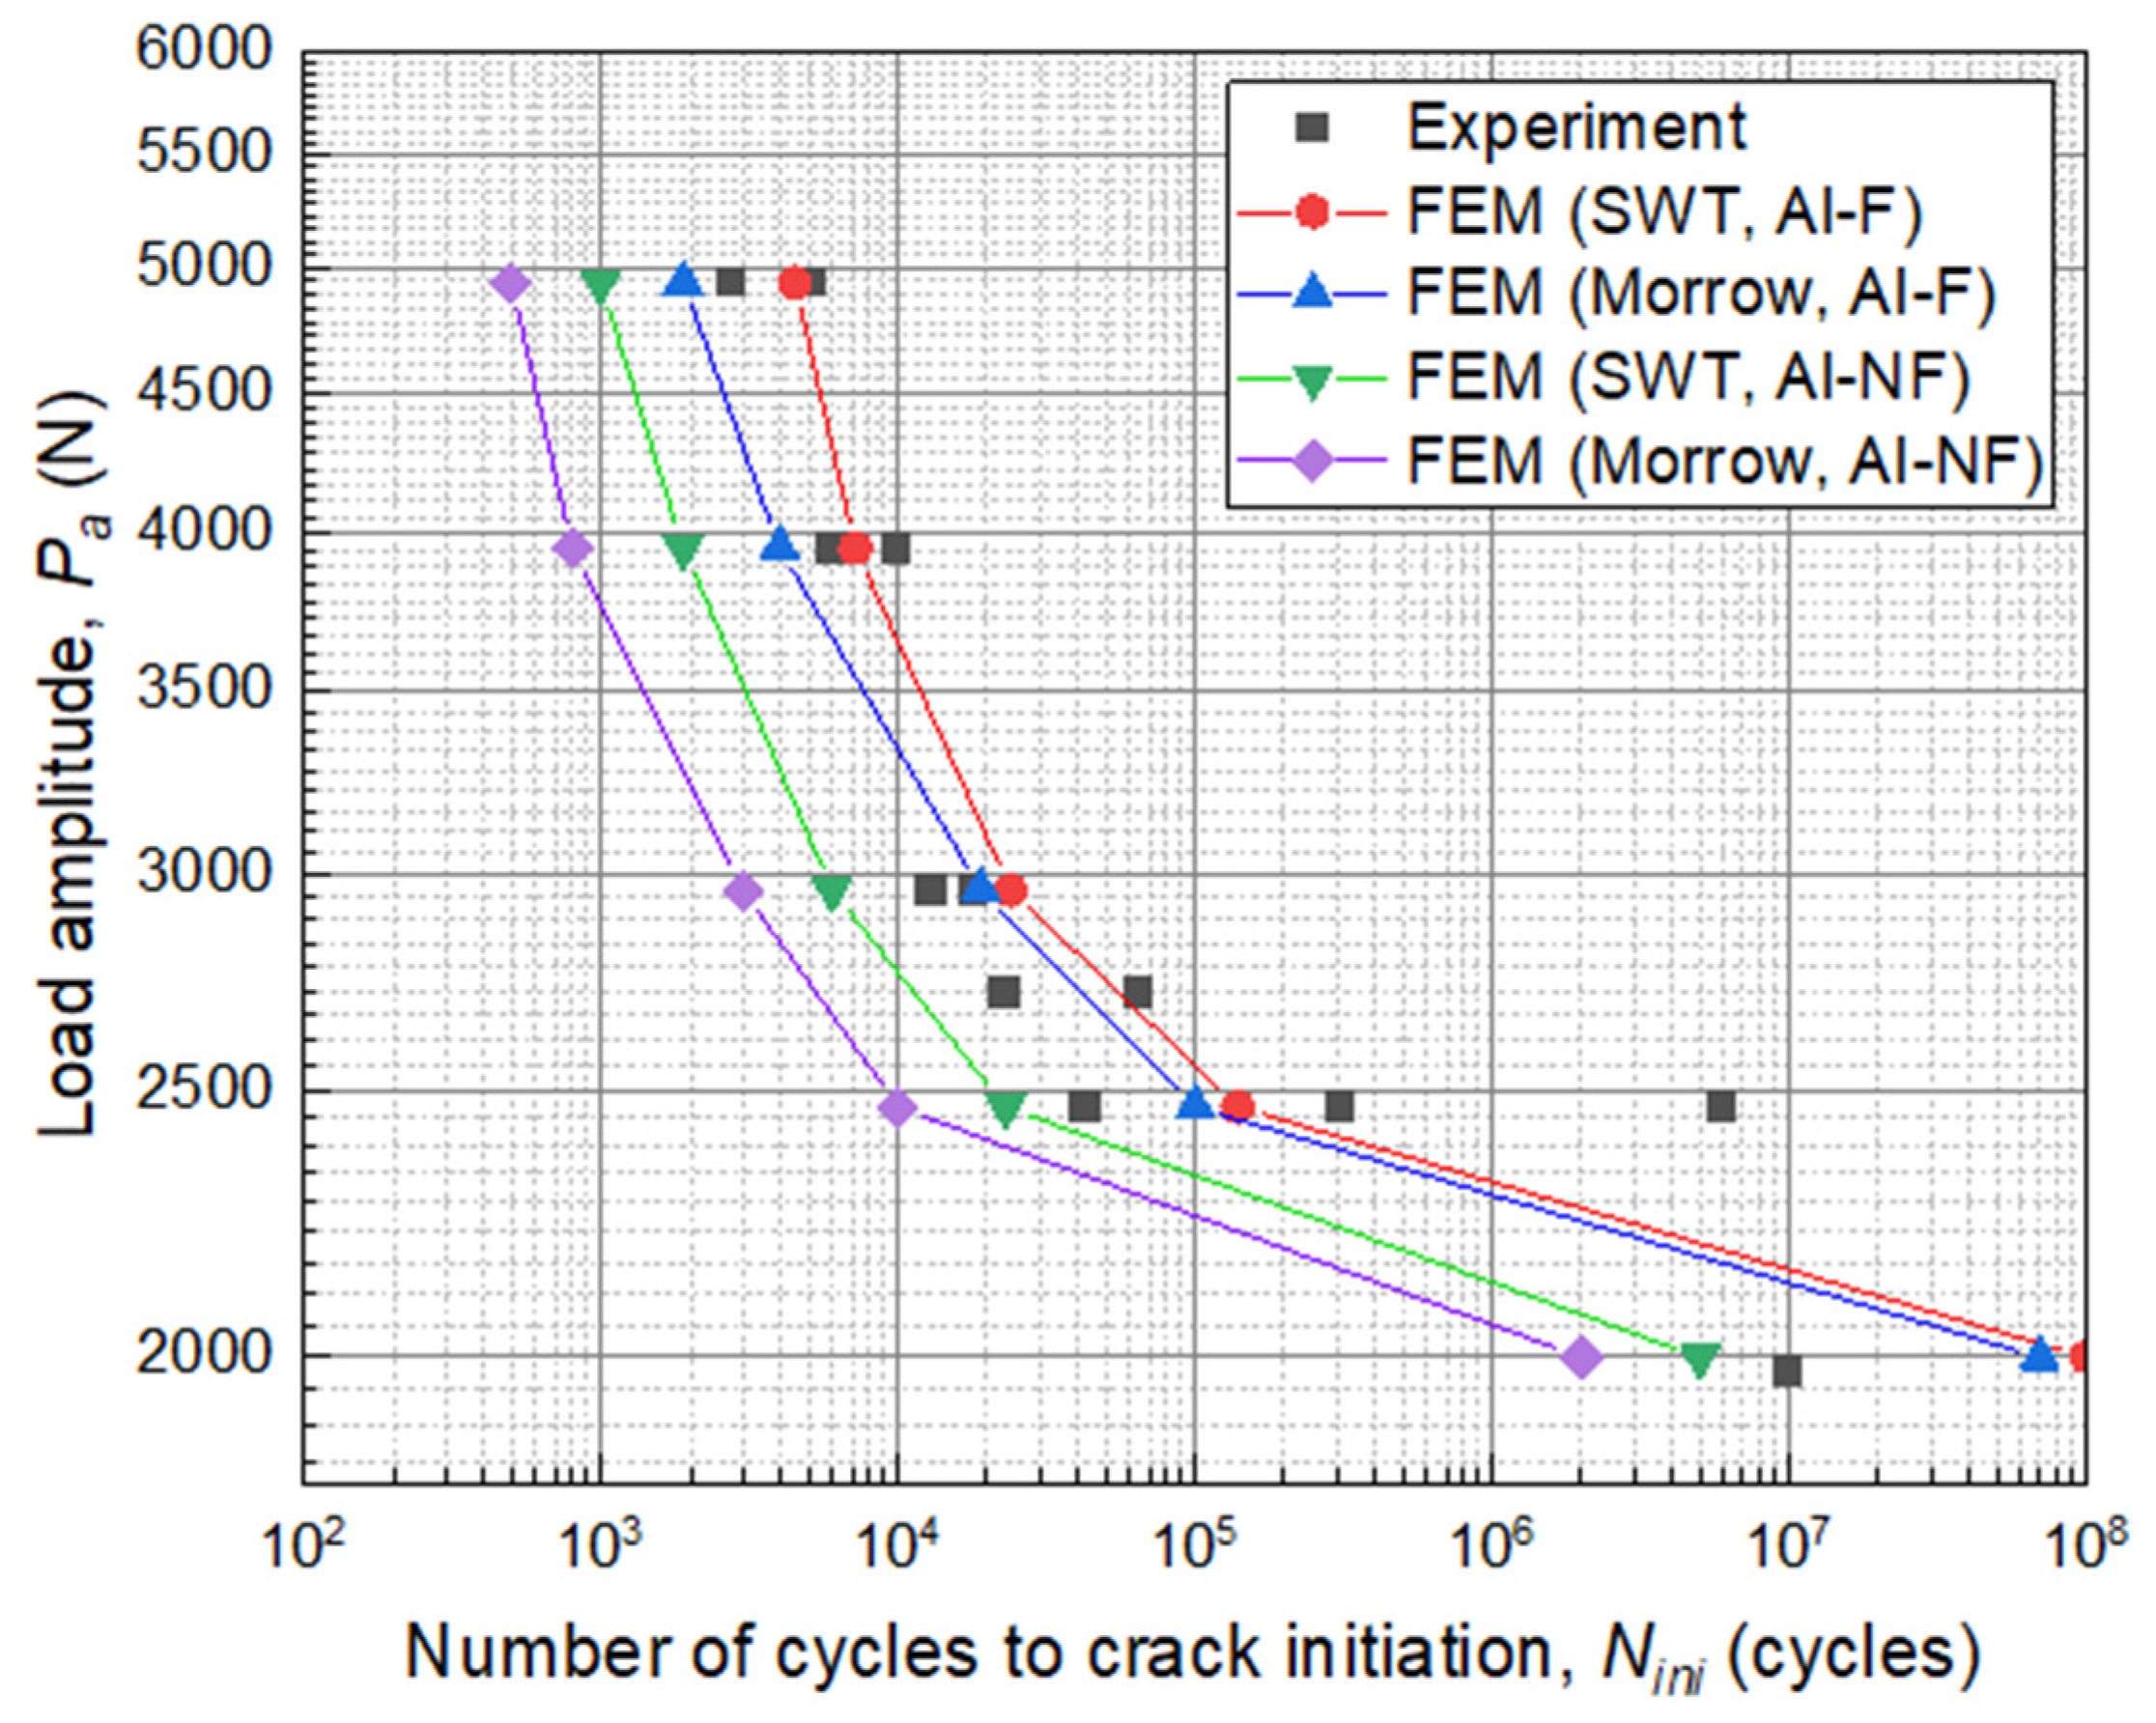
Using the C-specimens, the fatigue life of the mechanical components was evaluated at various load levels. As shown in Figure 10, the crack initiation cycle increased as the load amplitude decreased. At relatively high load amplitudes, for example, at Pa > 3000 N, the slope of the fatigue life curve was stiffer than those of the rest of the load amplitudes. The results show a gradual decrease in slope. The scatter in Nini increased as Pa decreased from 3000 to 2500 N. At Pa = 2000 N, no crack initiation was observed.
The fracture surfaces of the C-specimens were observed by the optical microscope, Model S-4300 from Hitachi (Tokyo, Japan). The crack initiation site was intensively observed, and the deterioration of inclusion was observed in certain specimens (Figure 11).

3.4. FEM Analyses

As shown in Figure 12, the fatigue crack initiated at the opposite side to the loading location. The load applied at the middle of the wrap resulted in a bending deformation during the analysis. The crack initiation location in the FEM was the same as that in the experiment. When the fatigue properties of Al-F were applied, the Nini estimated from the FEM was similar to those of the experiments.
In contrast, as shown in Figure 13, for the FEM results, based on the fatigue properties of Al-NF, the cycle for crack initiation was expected to be considerably smaller than that of the experiments. This implies that, if the products are forged, the fatigue properties should be evaluated using forged specimens. In other words, the reliability of the FEM results is strongly dependent on the manufacturing conditions, including the manufacturing method. Also shown In Figure 13, FEM results with the cumulative damage theory based on the SWT model show better prediction of experimental results.

4. Conclusions

In this study, the fatigue properties of aluminum alloys were evaluated by rotary bending fatigue tests. Both forged and nonforged aluminum alloy showed surface and inclusion-oriented fatigue failures; however, the deterioration in fatigue life was only observed in nonforged alloys. In particular, the fatigue failure in the high cycle fatigue region was caused mostly by internal inclusions or defects. Using the √area method, the expected fatigue limits were obtained, and the results showed good approximation for the Al-F alloy.
The fatigue properties of the scroll compressor were evaluated by C-specimens. Bending fatigue loading was applied on the scroll wrap, and the crack initiation life was observed. FEM analyses were performed to evaluate the fatigue characteristics of the mechanical components based on the results of the rotary bending and C-specimen fatigue tests. The results show that the SWT model and fatigue properties of Al-F alloy agreed well with the experiment results.
In addition, the crack initiation behaviors, including the deformation, were well described by the FEM analyses. Accordingly, even in the case of mechanical parts with complex shapes, such as scroll compressors, their fatigue characteristics can be predicted very accurately through FEM analyses if the cumulative damage theory based on the SWT model and distribution of inclusions and defects in the aluminum material are considered.

Author Contributions

Conceptualization, B.-H.C.; methodology, B.-H.C., J.L. and S.-Y.P.; software, S.-Y.P.; validation, J.L.; formal analysis, J.L.; investigation, J.L.; resources, J.L. and S.-Y.P.; data curation, J.L. and S.-Y.P.; writing—original draft preparation, J.L. and S.-Y.P.; writing—review and editing, B.-H.C., J.L. and S.-Y.P.; visualization, J.L. and S.-Y.P.; supervision, B.-H.C.; project administration, B.-H.C. All authors have read and agreed to the published version of the manuscript.

Funding

This work was supported by the Industrial Technology Innovation Program (No. 20013294) funded By the Ministry of Trade, industry & Energy (MI, Korea).

Data Availability Statement

The data presented in this study are available on request from the corresponding author.

Conflicts of Interest

The authors declare no conflict of interest.

Nomenclature

NfTotal fatigue life, cycles to failure
Nini, NpropCrack initiation cycle, Crack propagation cycle
R, RfStress ratio, Force ratio
fTest frequency
σa, εaStress amplitude, Strain amplitude
σmMean stress
σfApparent fatigue limit, fatigue strength at Nf = 107 cycles
area, areamaxNormalized inclusion size, Maximum inclusion size
D0Inspection depth
S, S0Total inspection area, Unit inspection area
FCumulative frequency
TReturn period
yReduced variate
σfFatigue strength coefficient
bFatigue strength exponent
CFatigue ductility exponent
εfFatigue ductility coefficient
K′Cyclic strength coefficient
n′Cyclic strain hardening exponent
EYoung’s modulus
SWTSmith–Watson–Topper model

References

  1. Kobayashi, H. A stress criterion for fatigue crack propagation in metals. In Proceedings of the 1st International Congress on Mechanical Behavior of Materials, Kyoto, Japan, 15–20 August 1971; pp. 109–126. [Google Scholar]
  2. Murakami, Y.; Endo, T. The effects of small defects on the fatigue strength of hard steels. In Proceedings of the Materials, Experimentation and Design in Fatigue ’81, Coventry, UK, 24–27 March 1981; pp. 431–440. [Google Scholar]
  3. Peterson, R. Analytical approach to stress concentration effects in aircraft materials. In WADC Symposium on the Fatigue of Metals; US Air Force: Dayton, OH, USA, 1959. [Google Scholar]
  4. Nordberg, H. The effect of notches and non-metallic inclusions on the fatigue properties of high-strength steel. In Swedish Symposium on Nonmetallic Inclusions in Steel; Swedish Institute for Metal Research: Sodertalje, Sweden, 1981; pp. 395–428. [Google Scholar]
  5. Kitagawa, H.; Takahashi, S. Applicability of fracture mechanics to very small cracks or the cracks in the early stage. In Proceedings of the Second International Conference on Mechanical Behavior of Materials, Boston, MA, USA, 16–20 August 1976; pp. 627–631. [Google Scholar]
  6. Murakami, Y.; Endo, M. Effects of Hardness and Crack Geometries on ΔKth of Small Cracks Emanating from Small Defects. J. Soc. Mater. Sci. 1986, 35, 911–917. [Google Scholar] [CrossRef] [Green Version]
  7. Wang, Q.G.; Apelian, D.; Lados, D.A. Fatigue behavior of A356-T6 aluminum cast alloys. Part I. Effect of casting defects. J. Light Met. 2001, 1, 73–84. [Google Scholar] [CrossRef]
  8. Wang, Q.G.; Jones, P.E. Prediction of Fatigue Performance in Aluminum Shape Castings Containing Defects. Met. Mater. Trans. A 2007, 38, 615–621. [Google Scholar] [CrossRef]
  9. Mu, P.; Nadot, Y.; Nadot-Martin, C.; Chabod, A.; Serrano-Munoz, I.; Verdu, C. Influence of casting defects on the fatigue behavior of cast aluminum AS7G06-T6. Int. J. Fatigue 2014, 63, 97–109. [Google Scholar] [CrossRef]
  10. Tajiri, A.; Nozaki, T.; Uematsu, Y.; Kakiuchi, T.; Nakajima, M.; Nakamura, Y.; Tanaka, H. Fatigue Limit Prediction of Large Scale Cast Aluminum Alloy A356. Procedia Mater. Sci. 2014, 3, 924–929. [Google Scholar] [CrossRef] [Green Version]
  11. Tebaldini, M.; Petrogalli, C.; Donzella, G.; La Vecchia, G. Estimation of Fatigue Limit of a A356-T6 Automotive Wheel in Presence of Defects. Procedia Struct. Integr. 2017, 7, 521–529. [Google Scholar] [CrossRef]
  12. Kobayashi, M.; Matsui, T. Prediction of Fatigue Strength of Aluminum Casting Alloys by the.Radtion Area Parameter Model. Trans. Jpn. Soc. Mech. Eng. Ser. A 1996, 62, 341–346. [Google Scholar] [CrossRef] [Green Version]
  13. Schwerdt, D.; Pyttel, B.; Berger, C. Fatigue strength and failure mechanisms of wrought aluminium alloys in the VHCF-region considering material and component relevant influencing factors. Int. J. Fatigue 2011, 33, 33–41. [Google Scholar] [CrossRef]
  14. May, A.; Belouchrani, M.A.; Taharboucht, S.; Boudras, A. Influence of heat treatment on the fatigue behaviour of two alu-minium alloys 2024 and 2024 plated. Procedia Eng. 2010, 2, 1795–1804. [Google Scholar] [CrossRef] [Green Version]
  15. Takahashi, Y.; Yoshitake, H.; Nakamichi, R.; Wada, T.; Takuma, M.; Shikama, T.; Noguchi, H. Fatigue limit investigation of 6061-T6 aluminum alloy in giga-cycle regime. Mater. Sci. Eng. A 2014, 614, 243–249. [Google Scholar] [CrossRef]
  16. Wanhill, R. Fatigue Crack Initiation in Aerospace Aluminium Alloys, Components and Structures; Report No. NLR-TP-2006-751; National Aerospace Laboratory: Amsterdam, The Netherlands, 2006. [Google Scholar]
  17. McCullough, R.R.; Jordon, J.B.; Allison, P.G.; Rushing, T.; Garcia, L. Fatigue crack nucleation and small crack growth in an extruded 6061 aluminum alloy. Int. J. Fatigue 2019, 119, 52–61. [Google Scholar] [CrossRef]
  18. Bannantine, J.; Comer, J.; Handrock, J. Fundamentals of Metal Fatigue Analysis. In Research Supported by the University of Illinois; Prentice Hall: Englewood Cliffs, NJ, USA, 1990; Volume 286. [Google Scholar]
  19. Ince, A.; Glinka, G. A generalized fatigue damage parameter for multiaxial fatigue life prediction under proportional and nonproportional loadings. Int. J. Fatigue 2014, 62, 34–41. [Google Scholar] [CrossRef]
  20. Park, S.-Y.; Lee, J.; Heo, J.-T.; Lee, G.B.; Kim, H.H.; Choi, B.-H. Assessment of fatigue lifetime and characterization of fatigue crack behavior of aluminium scroll compressor using C-specimen. Appl. Sci. 2020, 10, 3226. [Google Scholar] [CrossRef]
  21. ASTM E8/E8M-21. Standard Test Methods for Tension Testing of Metallic Materials; ASTM International: West Conshohocken, PA, USA, 2021. [Google Scholar]
  22. ASTM E140-12B(2019)e1. Standard Hardness Conversion Tables for Metals Relationship among Brinell Hardness, Vickers Hardness, Rockwell Hardness, Superficial Hardness, Knoop Hardness, Scleroscope Hardness, and Leeb Hardness; ASTM International: West Conshohocken, PA, USA, 2019. [Google Scholar]
  23. Murakami, Y.; Usuki, H. Quantitative Evaluation of Effects of Non-metallic Inclusions on Fatigue Strength of High Strength Steels. II: Fatigue Limit Evaluation based on Statistics for Extreme Values of Inclusion Size. Int. J. Fatigue. 1989, 11, 299–307. [Google Scholar] [CrossRef]
  24. Choi, B.-H.; Song, S.-H. Prediction of fatigue limit of induction surface hardened 1.05Cr–0.23Mo steel alloy using extreme value statistics. J. Mater. Sci. 2005, 40, 5427–5433. [Google Scholar] [CrossRef]
  25. Lukáš, P.; Kunz, L. Role of persistent slip bands in fatigue. Philos. Mag. 2004, 84, 317–330. [Google Scholar] [CrossRef]
Figure 1. Schematics of rotary bending specimens: (a) Al-NF, (b) Al-F. (c) Specimen mounted on the rotary bending test machine, Model H-7 test machine from Shimadzu (Kyoto, Japan).
Metals 11 01915 g001
Figure 2. Observed surfaces of rotary bending specimens. (a) Scanning electron microscopy; (b) optical microscopy, Model S-4300 from Hitachi (Tokyo, Japan); and (c) mirror-polished surface.
Metals 11 01915 g002
Figure 3. Schematics of inspection areas and assessment of the corresponding inclusion sizes.
Metals 11 01915 g003
Figure 4. Application of test equipment reprinted from [20]; (a) C-specimen and fatigue test jigs and (b) jig assembly mounted on the servo hydraulic test machine, Model 810 from MTS (Eden Prairie, MN, USA).
Metals 11 01915 g004
Figure 5. Displacement range Δd as a function of the number of cycles.
Metals 11 01915 g005
Figure 6. The constraint and loading conditions of the C-specimen FEM models.
Metals 11 01915 g006
Figure 7. S-N curves of aluminum alloys obtained from the rotary bending fatigue tests.
Metals 11 01915 g007
Figure 8. Modified S-N curves using Murakami equation of the Al-NF alloy.
Metals 11 01915 g008
Figure 9. The cumulative frequency of the extreme values of the inclusion size.
Metals 11 01915 g009
Figure 10. Load–cycle curve of the C-specimens with the Al-F material.
Metals 11 01915 g010
Figure 11. Fracture surface images of the C-specimens failed from the inclusion.
Metals 11 01915 g011
Figure 12. (a) Failed C-specimen after the fatigue test; (b) damage fraction contour of the FEM model; and (c) deformation of the FEM model.
Metals 11 01915 g012
Figure 13. Results of the load amplitude and life cycle for crack initiation of the scroll C-specimen.
Metals 11 01915 g013
Table 1. The chemical compositions of alloying elements in the Al-F and Al-NF aluminum alloys.
ElementAlFeCuMnMgZnTi
wt%Balance≤0.53.5–5.0≤0.10.3–1.0≤0.1≤0.2
Table 2. The mechanical properties of the Al-F and Al-NF aluminum alloys.
SpecimenYoung’s Modulus, E (GPa)Yield Strength, σy (MPa)Tensile Strength, σu
(MPa)
Hardness, HRB (HV 1)
Al-F75.3377.8426.581.1 (153 1)
Al-NF72.7391.4440.780.3 (151 1)
1 Vickers hardness is converted from Brinell hardness.
Table 3. ε-N curve parameters used in the FEM analyses.
Specimen σ f (MPa) ε f b CK′ (MPa)n′
Al-F7435.1−0.087−1.45210.06
Al-NF5124.1−0.089−1.45000.05
Publisher’s Note: MDPI stays neutral with regard to jurisdictional claims in published maps and institutional affiliations.

