Abstract
The wire laser additive manufacturing (WLAM) process is considered a direct-energy deposition method that aims at addressing the need to produce large components having relatively simple geometrics at an affordable cost. This additive manufacturing (AM) process uses wires as raw materials instead of powders and is capable of reaching a deposition rate of up to 3 kg/h, compared with only 0.1 kg/h with common powder bed fusion (PBF) processes. Despite the attractiveness of the WLAM process, there has been only limited research on this technique. In particular, the stress corrosion properties of components produced by this technology have not been the subject of much study. The current study aims at evaluating the effect of a slow strain rate on the stress corrosion resistance of 316L stainless steel produced by the WLAM process in comparison with its counterpart: AISI 316L alloy. Microstructure examination was carried out using optical microscopy, scanning electron microscopy (SEM) and X-ray diffraction analysis, while the mechanical properties were evaluated using tensile strength and hardness measurements. The general corrosion resistance was examined by potentiodynamic polarization and impedance spectroscopy analysis, while the stress corrosion performance was assessed by slow strain rate testing (SSRT) in a 3.5% NaCl solution at ambient temperature. The attained results highlight the inferior mechanical properties, corrosion resistance and stress corrosion performance, especially at a slow strain rate, of the WLAM samples compared with the regular AISI 316L alloy. The differences between the WLAM alloy and AISI 316L alloy were mainly attributed to their dissimilarities in terms of phase compositions, structural morphology and inherent defects.
1. Introduction
Additive manufacturing (AM) technologies developed in the last two decades have been aimed mainly at producing complex geometrics with minimal machining finishes using powder bed fusion (PBF) technologies, mostly selective laser melting (SLM) and electron beam melting (EBM) [1,2,3,4,5,6,7,8,9,10,11,12]. However, these relatively expensive PBF technologies do not adequately address the need to produce large components with less complicated geometrics at affordable production costs [13,14]. Therefore, alternative AM technologies such as direct energy deposition processes have been developed recently [15,16,17,18]. Some of these direct energy deposition processes use wires as raw materials instead of powders [19,20,21,22,23,24,25,26]. Apart from the significantly reduced cost of wire (compared with powder), wire additive manufacturing processes enable deposition rates of up to 3 kg/h to be reached, compared with only 0.1 kg/h by PBF processes [27,28]. A particularly suitable direct energy deposition method for the production of 3D components is the wire laser additive manufacturing (WLAM) process, in which a high-powered laser is also operated via computer numerical control (CNC) machines together with wire feeders. The deposition rates of the WLAM process can reach up to 3 kg/h, which enables the production of relatively large components [29]. Currently, most of the research activities involving WLAM have focused on optimizing the printing parameters related to the Ti-6Al-4V alloy [30,31]. A small body of research has also been conducted on the direct laser deposition process of austenitic stainless steel using jet nozzles and powder metal feeding techniques [32,33,34,35]. The present article describes the production of 316L stainless steel test samples using the WLAM process and the evaluation of the stress corrosion performance of WLAM316L at a slow strain rate compared with its counterpart: AISI 316L alloy.
2. Experimental Procedure
2.1. Preparation of WLAM 316L Samples
The test samples were machined from a rectangular shape with dimensions of 90 × 20 × 20 mm, which were produced by a WLAM process using a self-assembled WLAM facility, and 316L stainless steel was used as the feeding wire while pure argon (99.99%) served as a protective atmosphere. The pathway of the WLAM process was programmed and controlled using a CAD model. The power of the laser beam was 1.5 kW, the wire feeding rate was 8.3 mm/s, and the travel speed was 6.5 mm/s. The deposition rate was 250 g/h, and the diameter of the feeding wire was 1.2 mm. The thickness of the additive manufactured layer was 0.6 mm. The printing stage was heated to 250 °C during the printing process as well. As a reference material for the purpose of comparison, conventional AISI 316L specimens 6 mm thick were used. The test samples prepared by the WLAM process and the conventional AISI 316L specimens were machined to the required dimensions using an electrical discharge machine (EDM, ARTA 123 Pro EDM Russia).
2.2. Microstructure Analysis
Microstructural examinations were carried out using optical microscopy and a scanning electron microscope (SEM-JEOL 5600, JEOL Ltd. Tokyo, Japan) [36] with an energy dispersive spectroscopy (EDS) detector (Thermo Fisher Scientific, Waltham, MA, USA) for chemical composition analysis. The preparation procedure of the metallographic samples included grinding, polishing (up to 0.25 µm by using a colloidal silica suspension) and etching with a mixture of 5 ml HNO3 (70%), 9 ml HCl (32%) and 5 ml ethanol for 15 s. Phase identification was conducted by X-ray diffraction analysis using a RIGAKU-2100H X-ray diffractometer (Rigaku Corporation, Tokyo, Japan) equipped with a CuKα radiation source. The parameters for the diffraction analysis were 40 kV/30 mA, and the scanning rate was 2°/min.
2.3. Mechanical Properties
The tensile properties of the test samples were determined using an Instron 5982 (Instron, USA) tensile machine. The dimensions of the test specimens were the following: a gauge length of 16 mm and rectangular cross section of 16 mm2. Hardness testing was performed using a SM1016 Vickers hardness machine (TecQuipment Ltd., Nottingham, UK) scaled to HV10.
2.4. Corrosion Resistance and Electrochemical Analysis
The corrosion resistance of the steel samples was evaluated electrochemically. For the potentiodynamic polarization test and impedance spectroscopy, a Bio-Logic SP-200 potentiostat (Bio-Logic Science Instruments, Seyssinet-Pariset, France) equipped with EC-Lab software (version 10.18) was used [37]. The tests were performed using a standard three-electrode cell, with a saturated calomel electrode (SCE) as the reference electrode and a platinum electrode as an auxiliary electrode. The corrosive environment was provided by a 3.5% NaCl solution at room temperature (25 °C). The scanning rate for the potentiodynamic polarization analysis was 0.5 mV/s, and the impedance spectroscopy test was carried out between 10 kHz and 0.015 Hz at a 10-mV amplitude signal. All the samples for corrosion testing were polished with 1200-grit paper to equalize their roughness.
2.5. Stress Corrosion
The stress corrosion was evaluated by slow strain rate testing (SSRT) using a Cormet C-76 apparatus (Cormet Testing Systems, Vantaa, Finland) according to the ASTM G129-00 standard. The dimensions of the test samples were the following: a gauge length of 25.4 mm and rectangular cross-section of 7 mm2. The strain rates used for the SSRT tests were 2.5 * 10−7, 2.5 * 10−6 and 2.5 * 10−5 s−1, and they were tested 3 times. All the SSRT examinations were carried out in a 3.5% NaCl solution at ambient temperature (25 °C).
3. Results
3.1. Roughness Analysis
The general appearance and close-up views of a cross-section of the WLAM 316L samples in the as-printed conditions are shown in Figure 1. These pictures reveal a relatively rough external surface with a few defects at the interface between the additively manufactured layers. The mean surface roughness (Ra) of the WLAM samples was nearly three times higher than that of the counterpart AISI 316 alloy, as shown in Table 1 and in accord with the ISO 4287:1997 standard. The relatively high surface roughness of the WLAM samples may have been due to an excessive wire-feeding rate or insufficient heating during the printing process [29]. In addition, the absence of inherent fusion defects in the WLAM samples located at the melt pool boundaries was probably also the result of insufficient heating conditions [38].
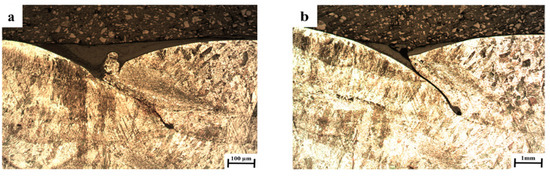
Figure 1.
Cross-section views of WLAM 316L samples) a) high magnification (×50) (b) low magnification (×5).

Table 1.
Surface roughness of WLAM 316L samples compared with the counterpart AISI 316L alloy.
3.2. Microstructure Analysis
The chemical compositions of the WLAM samples, the AISI 316L counterpart alloy and the welding wire used in the present study are shown in Table 2. These results show that the composition of the WLAM alloy was quite similar to that of the feeding wire, while the AISI counterpart alloy contained slightly reduced amounts of Cr, Ni and Mo. All the materials tested showed identical carbon contents. It should be noted that the chemical composition of the welding wire was determined and compared with the AWS: A5.9 standard for the AWS ER316L wires, while those of the WLAM samples were measured and compared with the ASTM F138 standard for bulk material.
Table 2.
Chemical compositions (wt.%) of the welding wire, WLAM 316L samples and counterpart AISI 316L alloy.
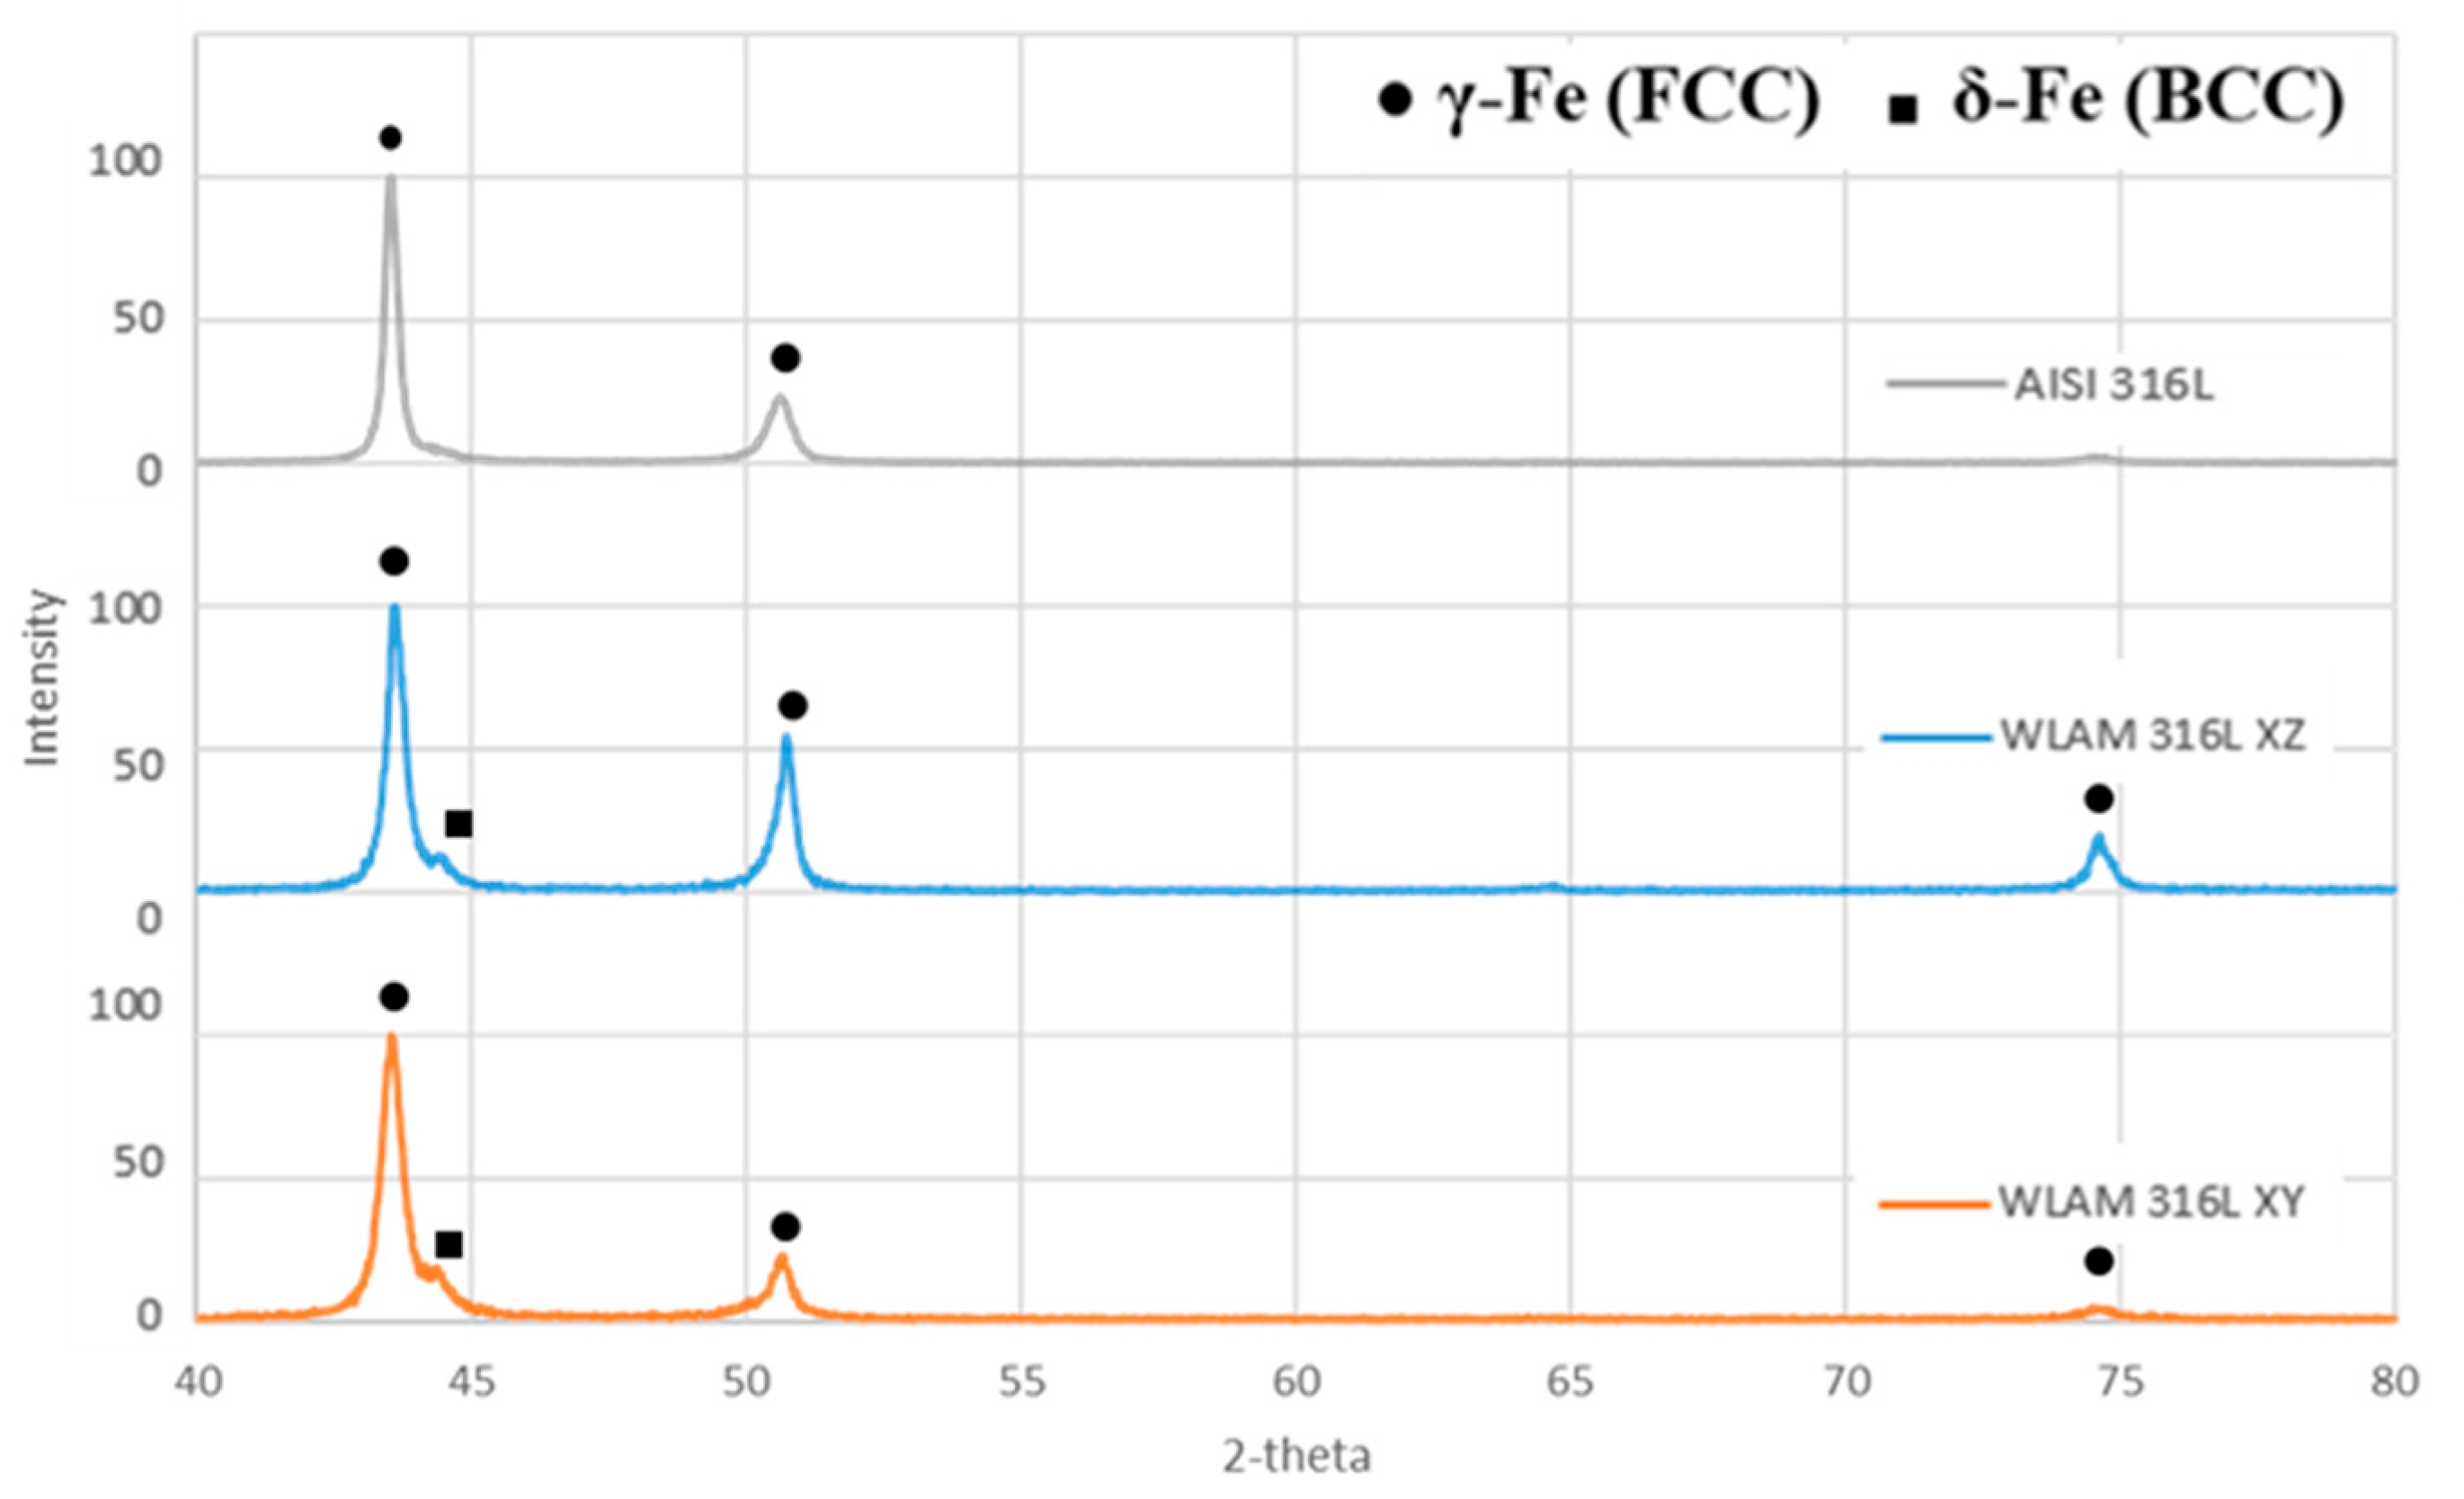
X-ray diffraction analysis revealed that the WLAM alloy was composed of two phases—δ-ferrite and γ-austenite—while its counterpart AISI alloy was composed only of an austenitic phase (Figure 2). This observation is in keeping with the results of Ron et al. [18] and Saeidi et al. [4], and this was, in fact, the expected result from the AM processes using 316L stainless steel as a feeding material. The different peak intensities found in the XZ and XY directions of the WLAM alloy were mainly due to the epitaxial solidification occurring in the AM process.

Figure 2.
X-ray diffraction analysis of the WLAM 316L sample (in XY and XZ planes) and the counterpart AISI 316L alloy.
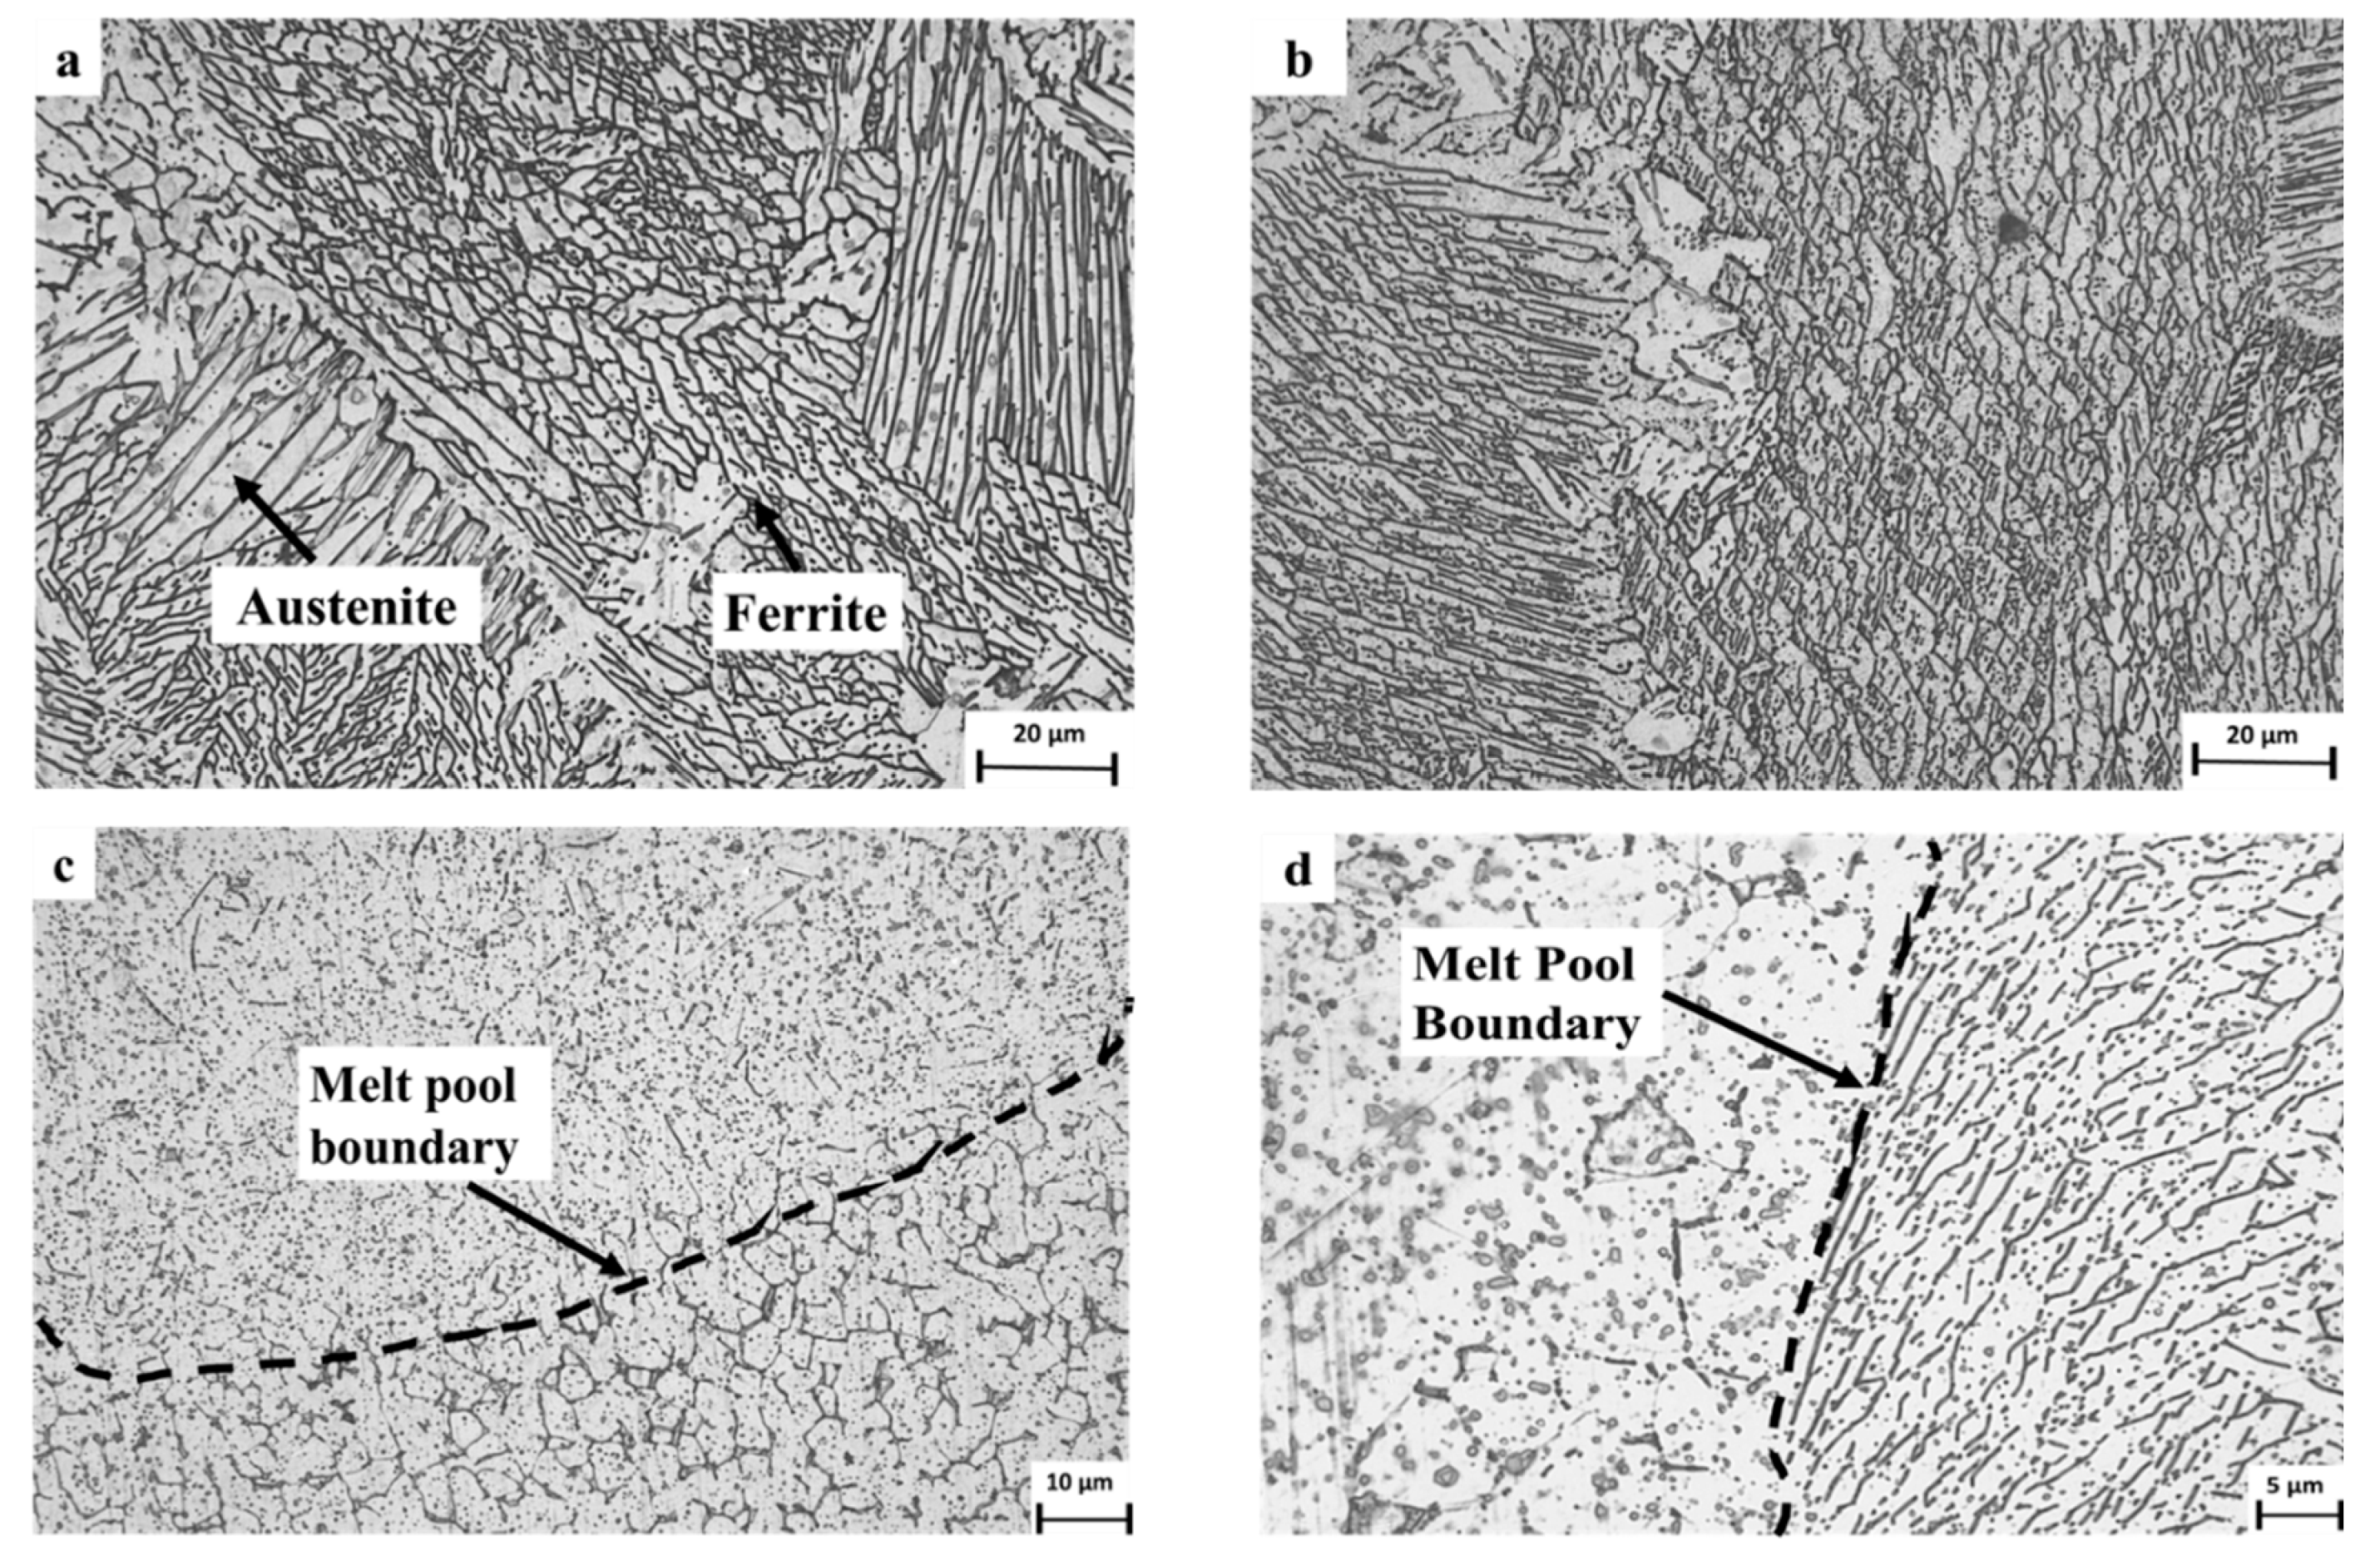
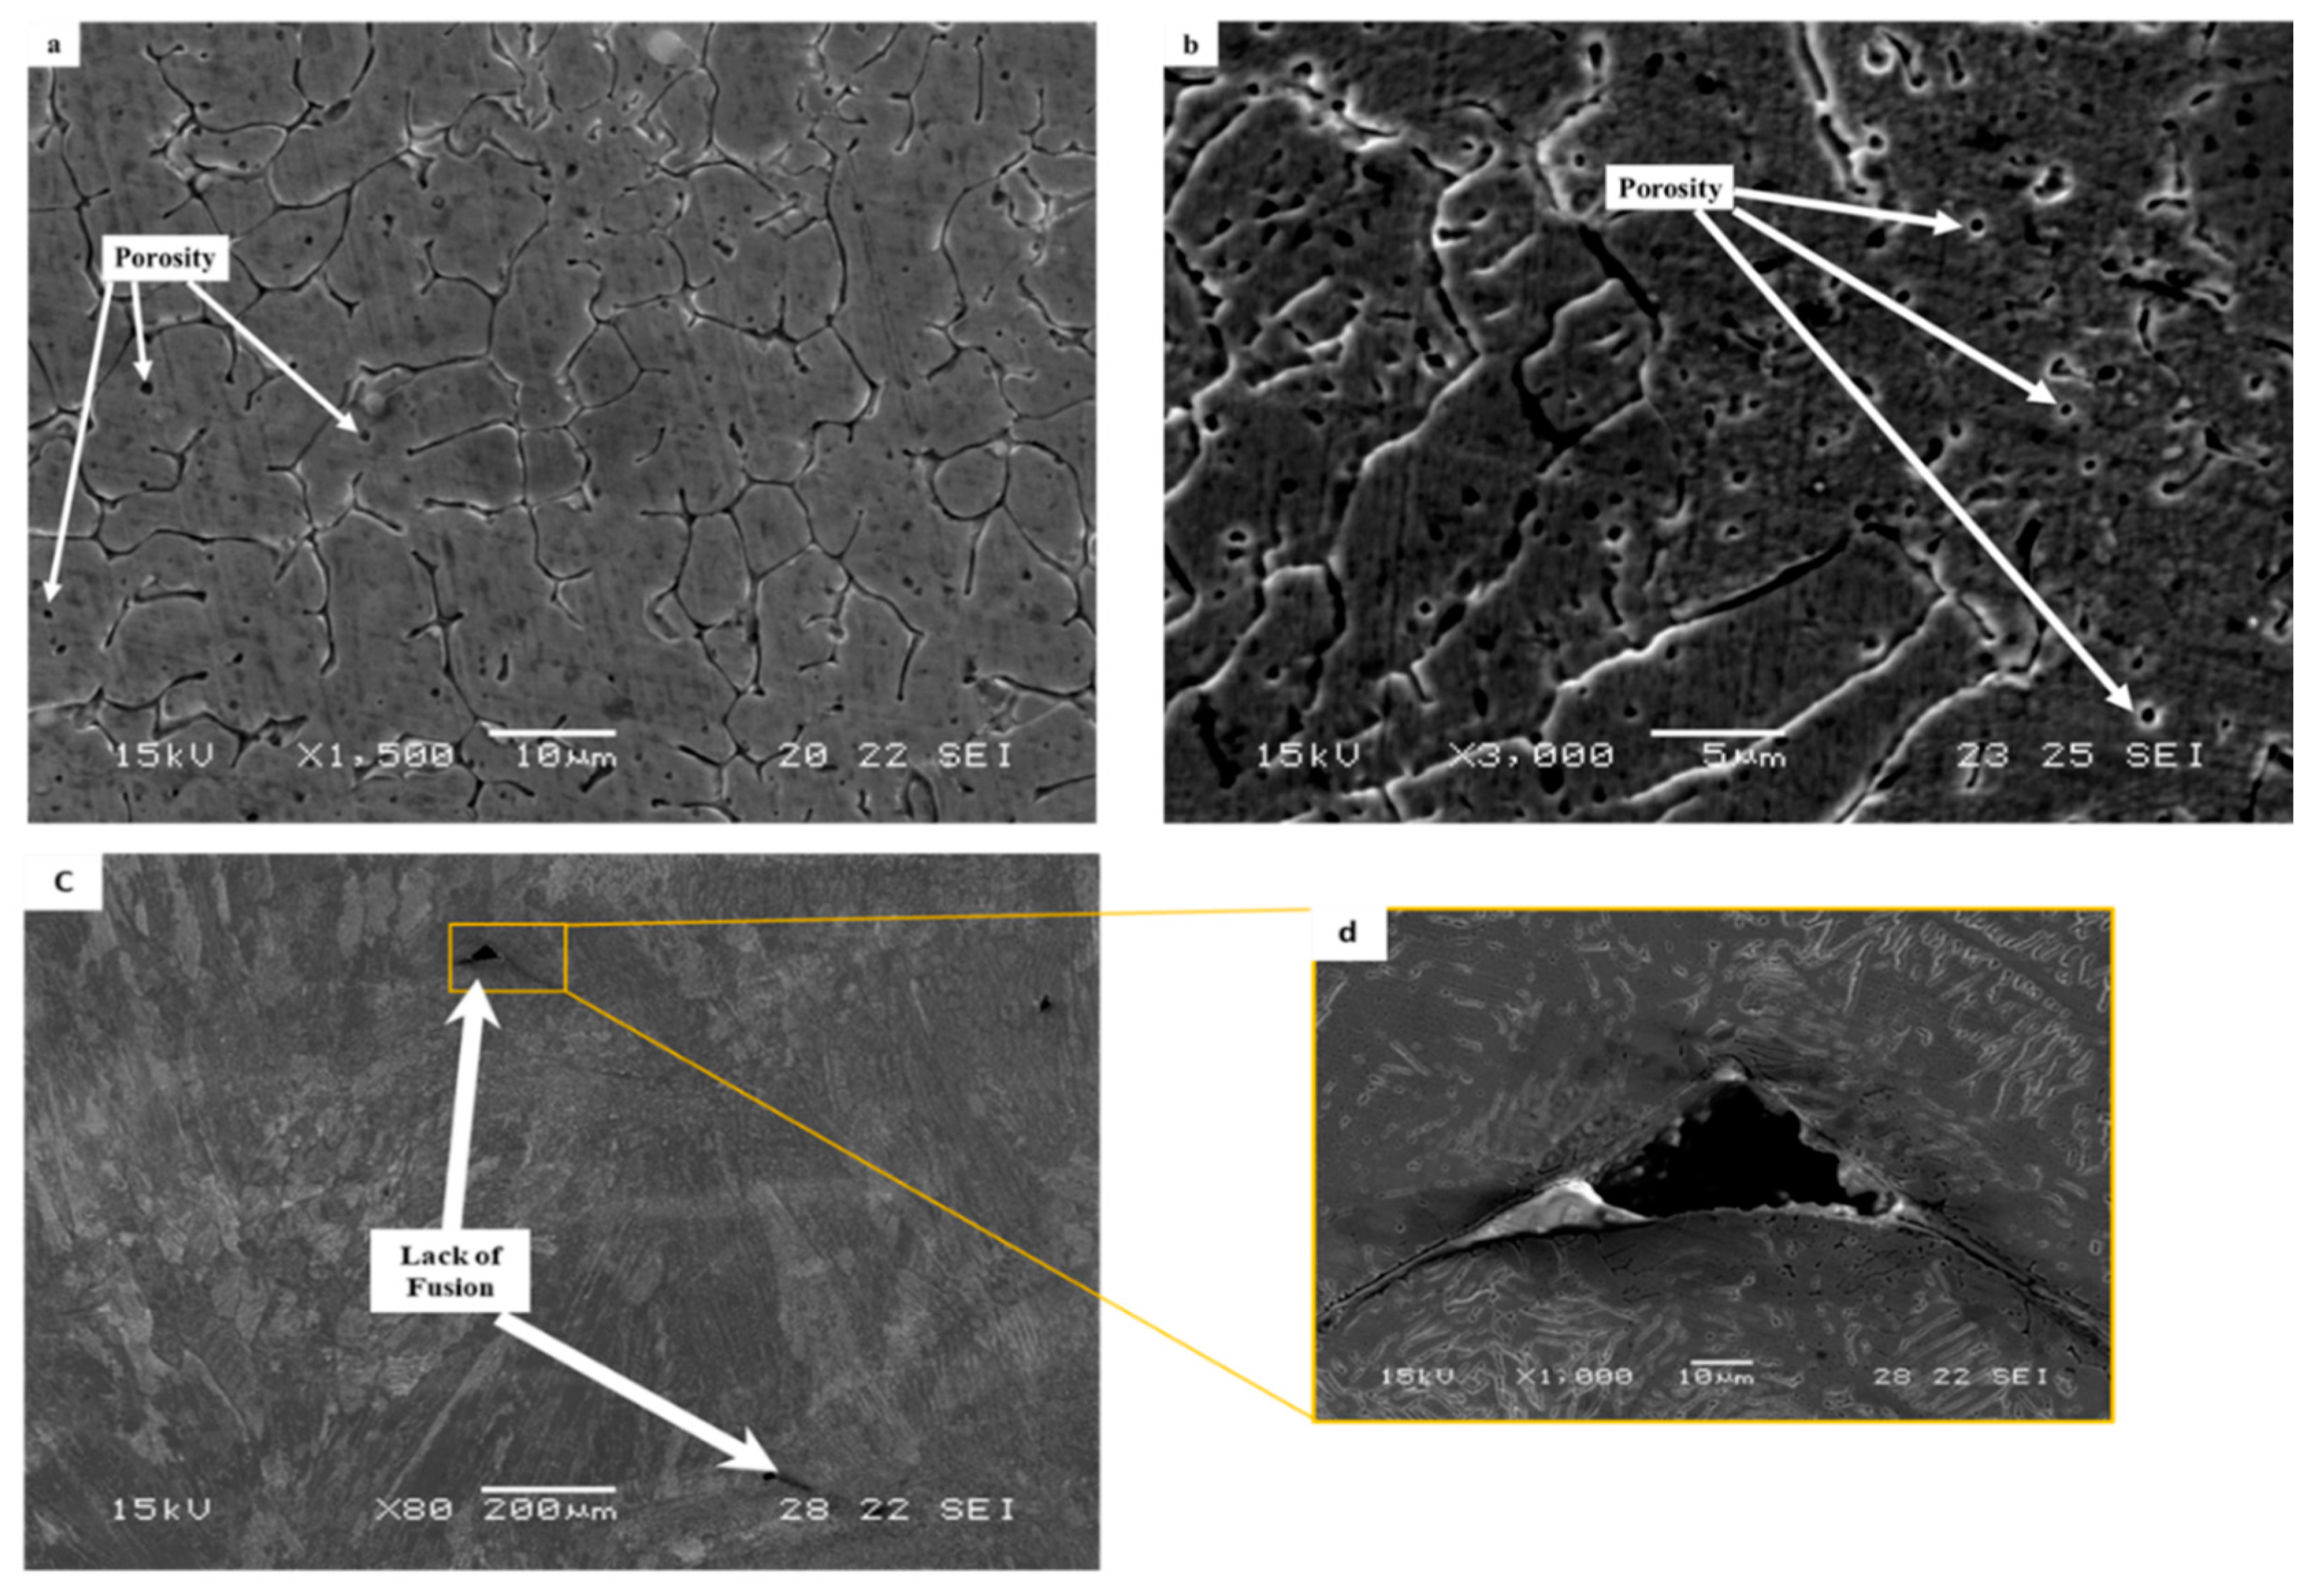
The typical microstructure obtained by optical microscopy for the WLAM alloy is shown in Figure 3. The micrographs revealed the presence of an austenitic matrix with a secondary ferritic phase having a dendrite structure concentrated at the grain boundaries. The microstructure of the XY plane had a relatively general uniform morphology, whereas the microstructure of the XZ plane showed an epitaxial solidification nature with clearly visible melt pool boundaries. The formation of the two-phase microstructure by the WLAM alloy can be explained in terms of a Schaeffler diagram [39], which is able to predict the kinds of phases generated in the weld deposits of stainless steel. Consequently, it is believed that the solidification conditions of the melt pool, in terms of temperature gradients, can create different concentrations of the alloying elements. Hence, it is believed that the increased amount of Cr at the edge of the melt pool could promote the formation of a ferritic phase, while the main bulk of the pool that was enriched with Ni maintained its austenitic structure. Scanning electron microscopy revealed microstructural imperfections in the form of porosity and a lack of fusion, as shown in Figure 4. While the porosity concentration was about 0.01 per µm2, the dimeter of the porosity was relatively small (about 1 µm) compared with, for example, about 15 µm, which was obtained through the laser powder bed fusion of steels [40]. In addition, while the porosity was mainly generated by the release of entrapped gas, the lack of fusion defects was due to insufficient heating, which prevented the printed layers from adequately fusing together. It should be noted that both defect types can act as areas of stress concentration that can promote premature mechanical failure [21,41].

Figure 3.
Typical microstructure of WLAM 316L samples: (a,b) XY plane and (c,d) XZ plane.
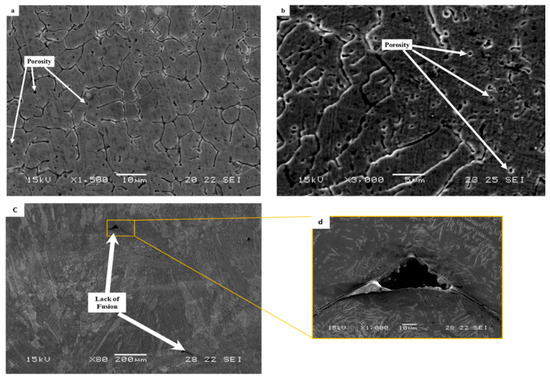
Figure 4.
Typical microstructural imperfections in WLAM 316L samples: (a,b) porosity in the XY plane and XZ plane, respectively, and (c,d) lack of fusion.
3.3. Mechanical Behavior
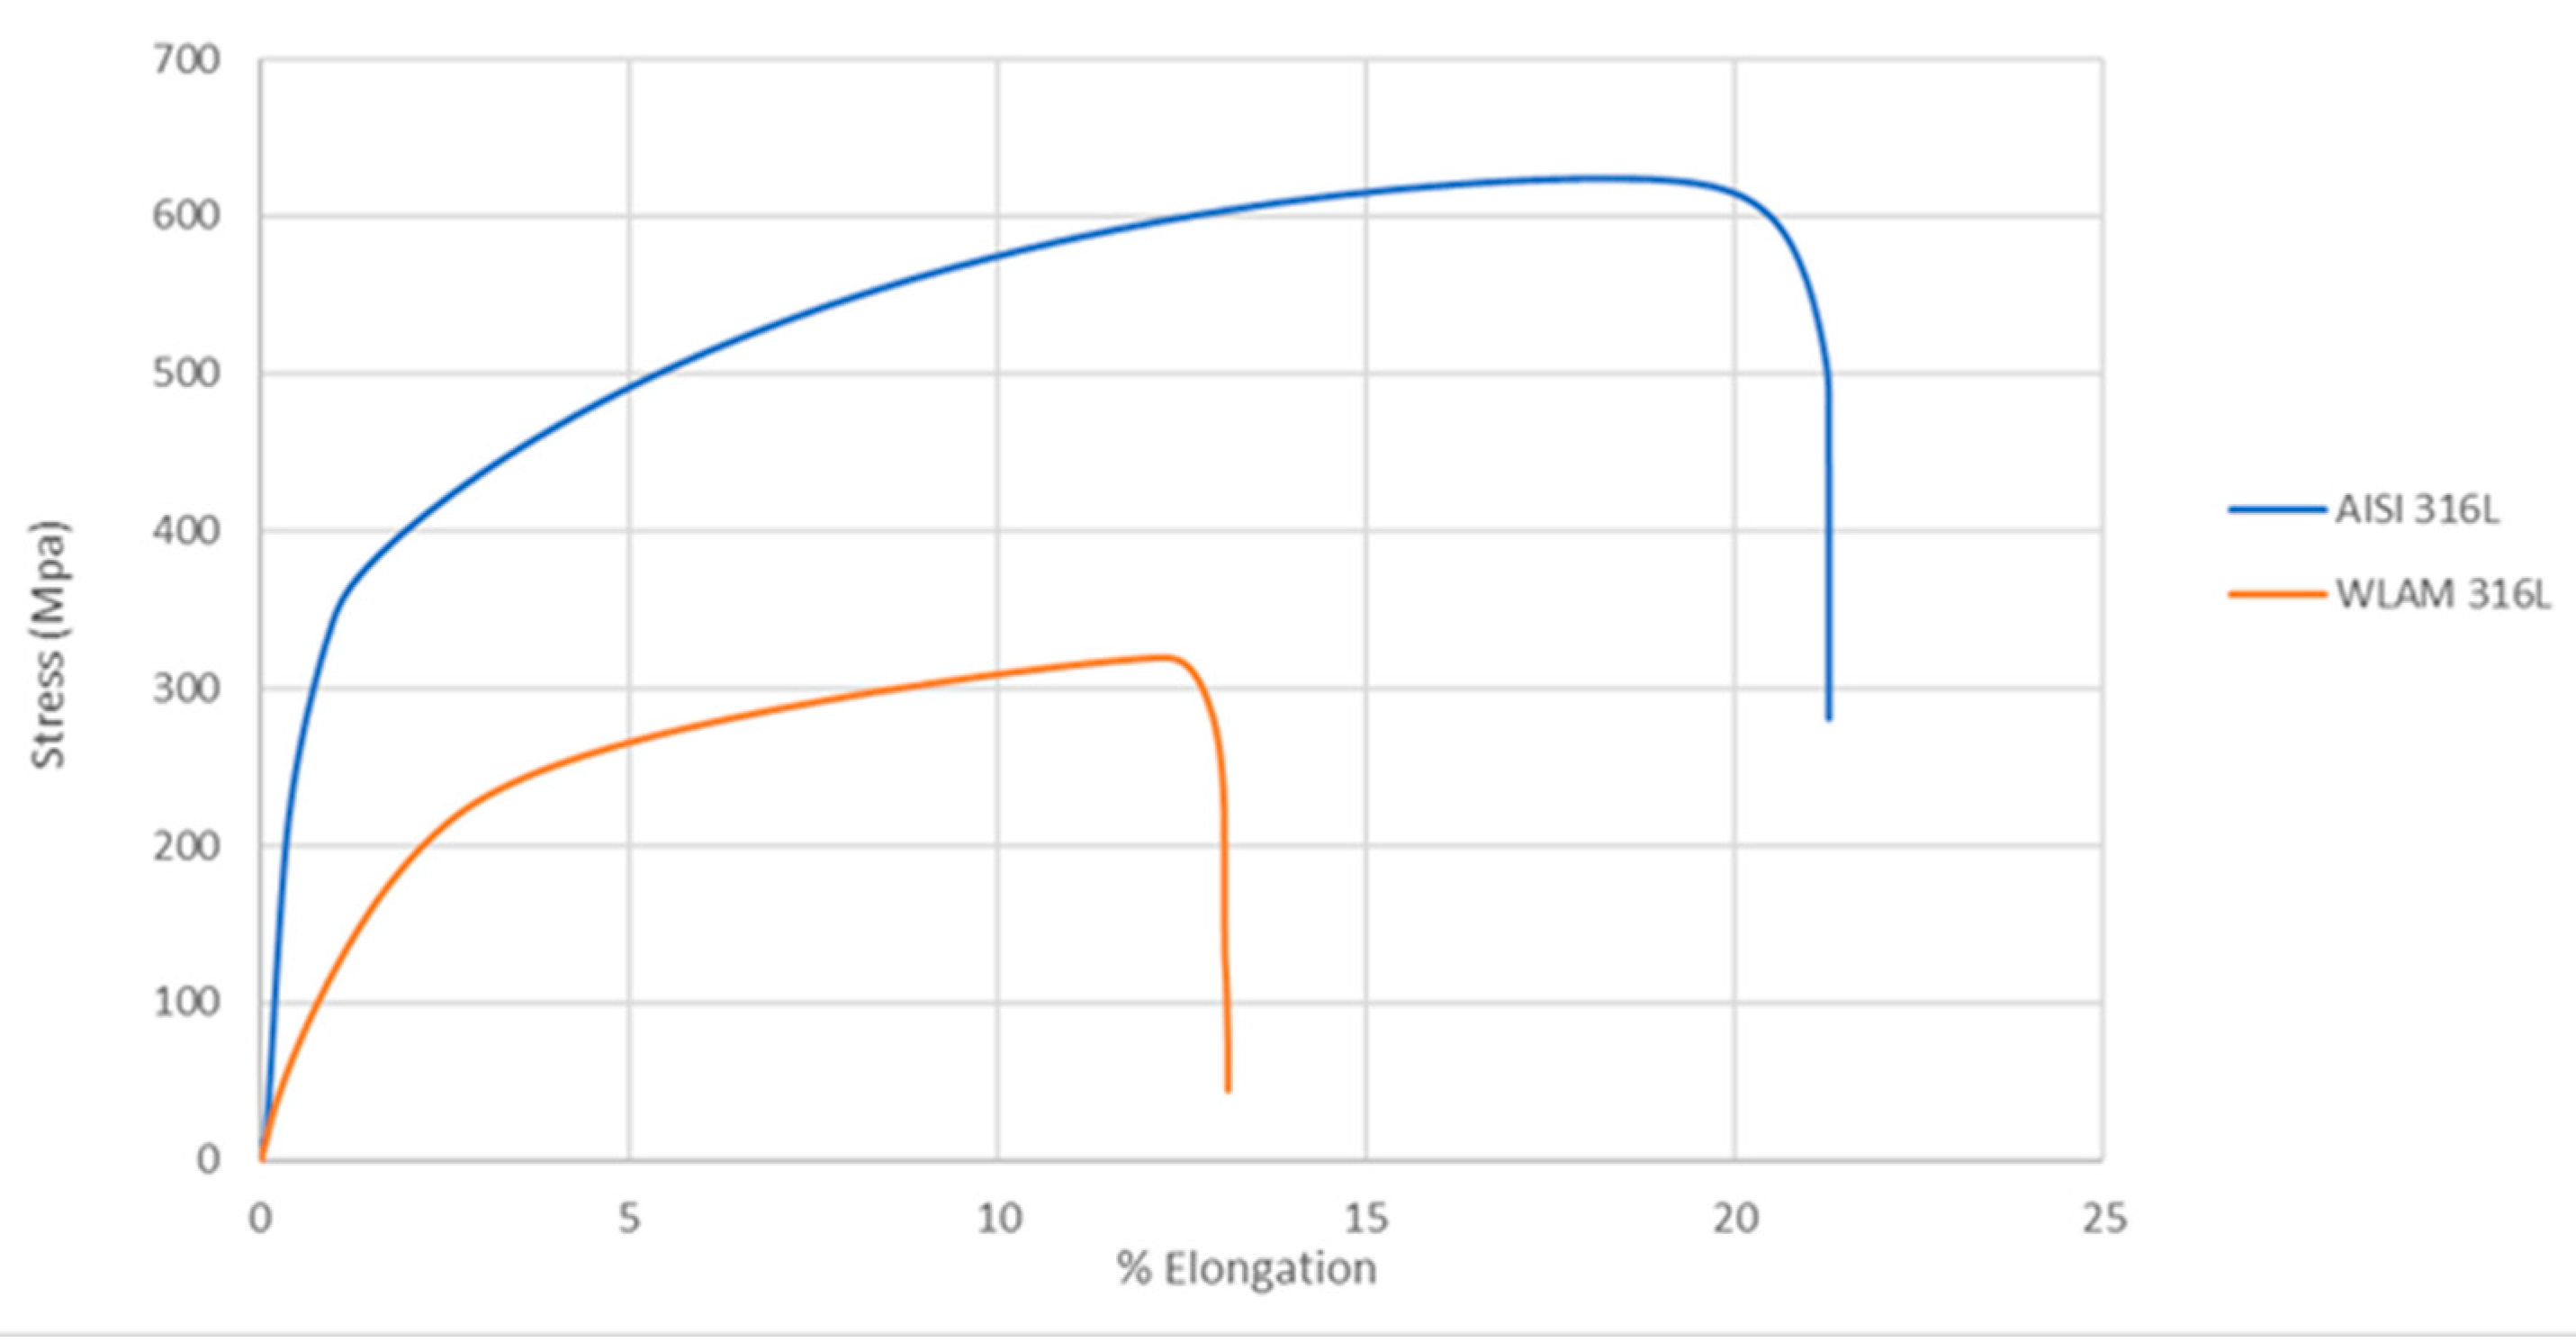
The mechanical properties of the WLAM samples and their counterpart AISI 316L alloy, as represented by their stress–strain curves, are shown in Figure 5. Detailed mechanical properties including the tensile strength, yield strength, percentage elongation and hardness are presented in Table 3. These data clearly show that the mechanical properties of the WLAM samples were inferior to those of the counterpart AISI 316L alloy. The relative inferiority of the mechanical properties of the WLAM alloy can be attributed to the presence of inherent microstructural imperfections, mainly in the form of porosity and a lack of fusion.
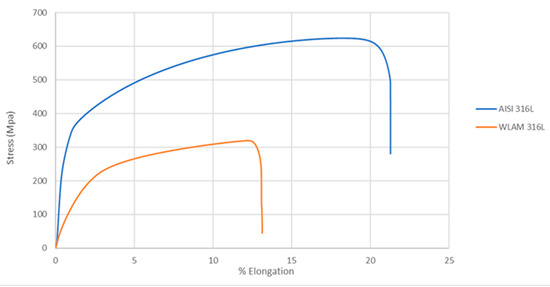
Figure 5.
Stress–strain curves of the WLAM samples and the counterpart AISI 316L alloy.
Table 3.
Mechanical properties of the WLAM samples and the counterpart AISI 316L alloy.
3.4. Corrosion Resistance
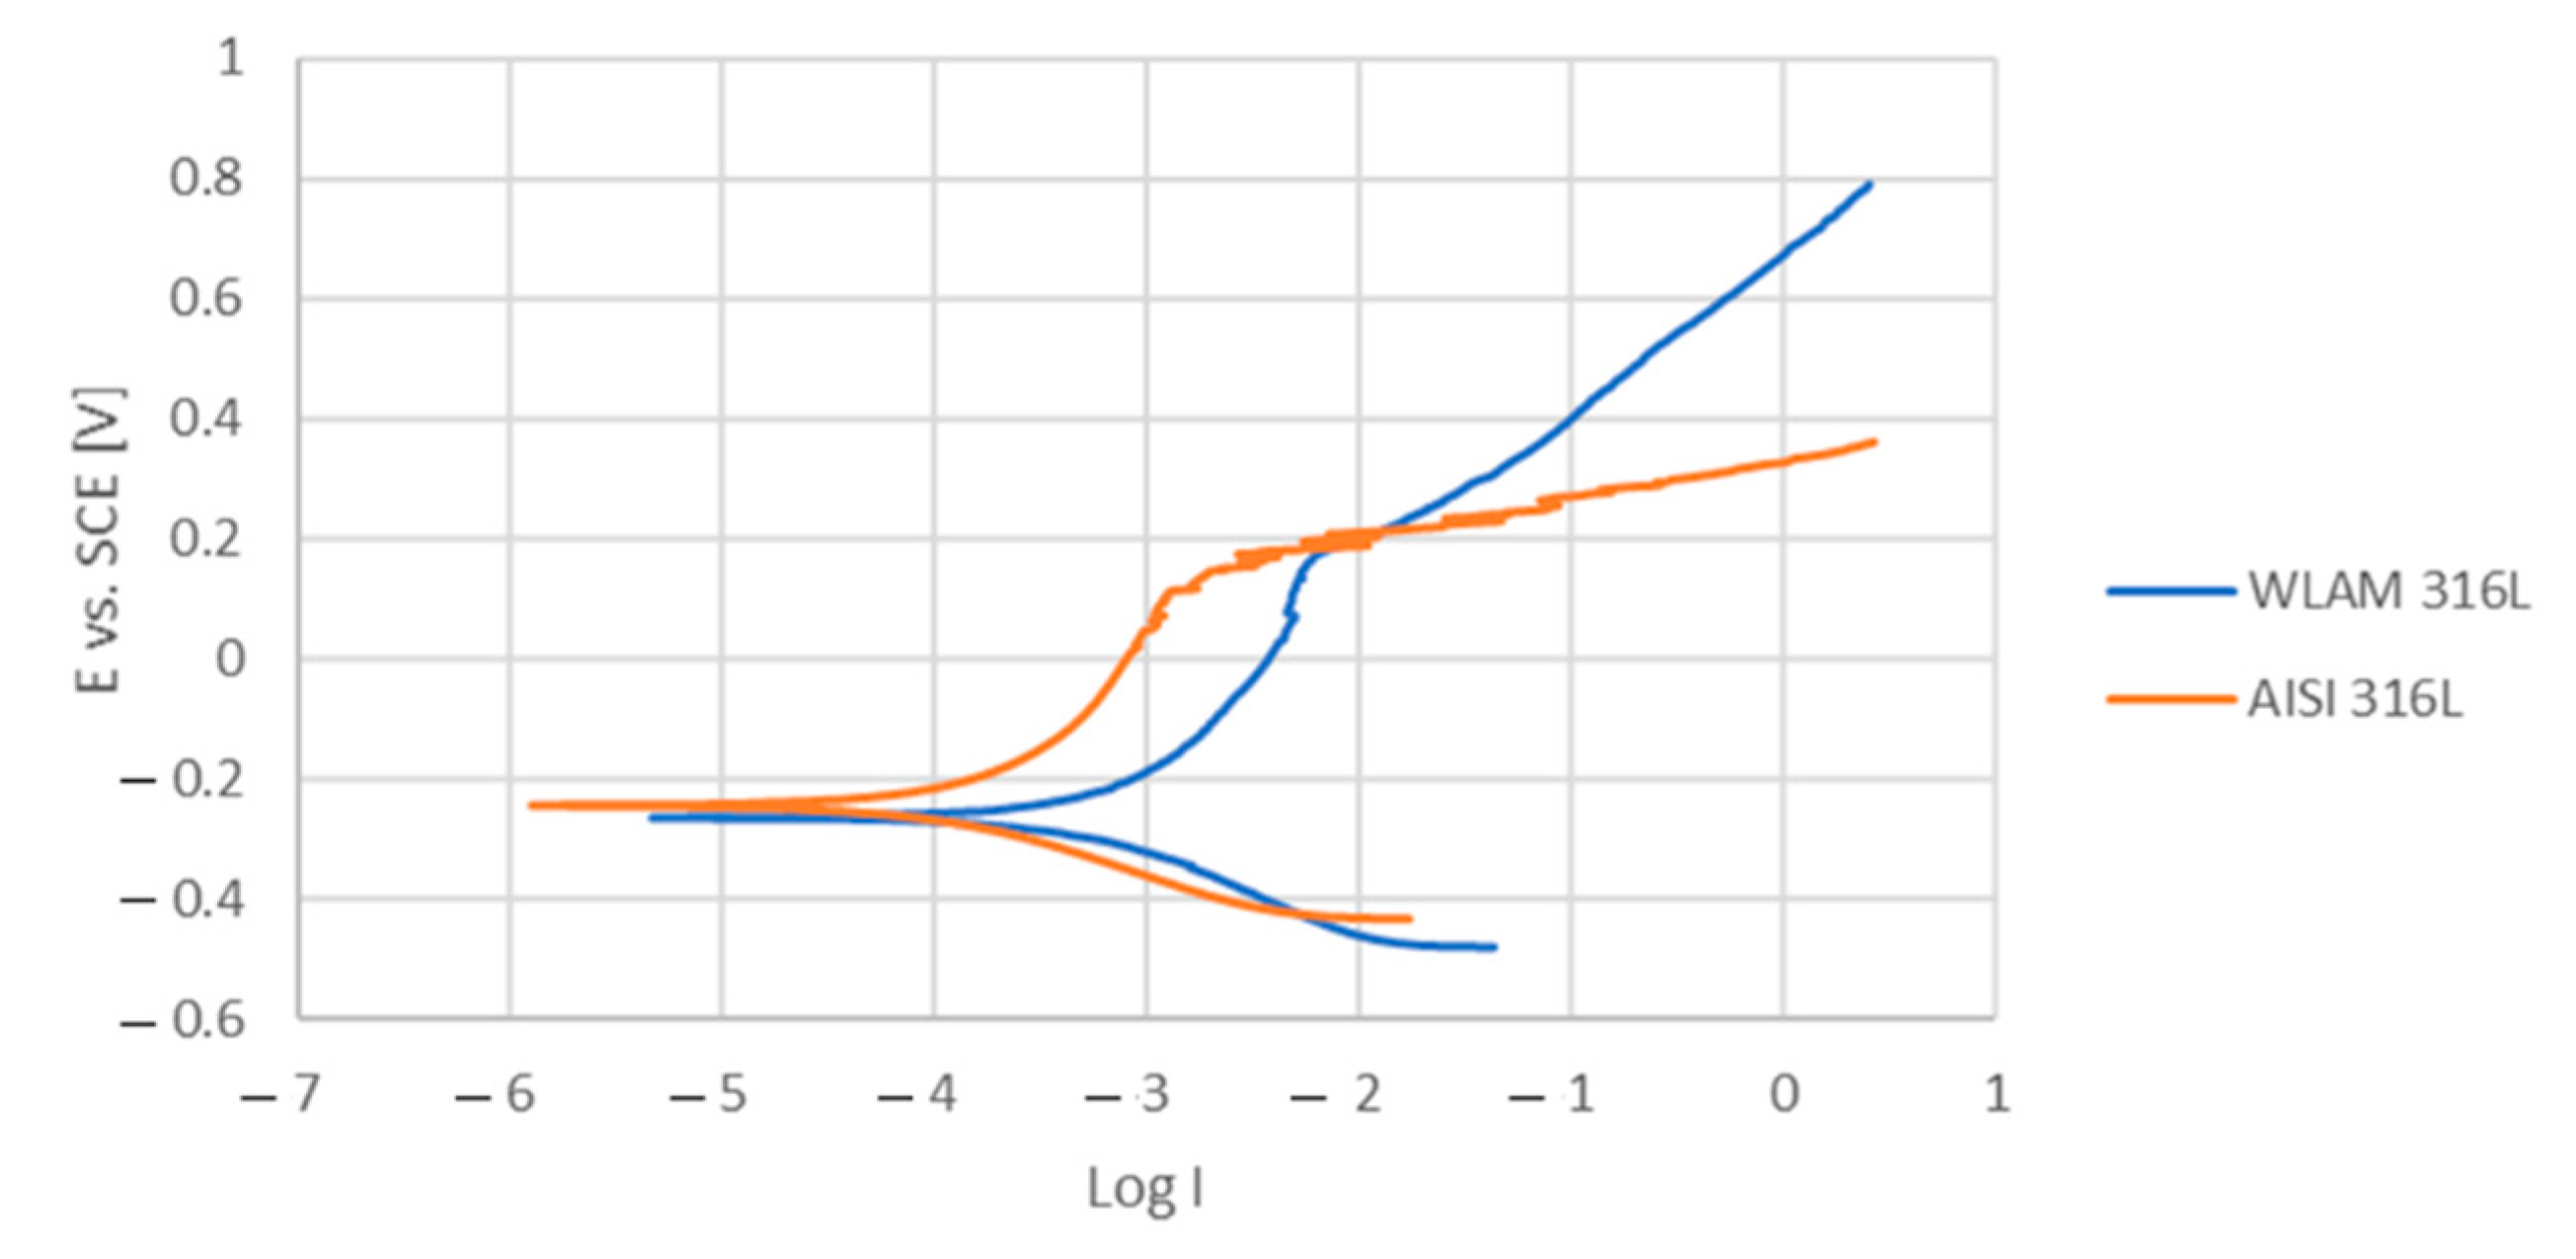
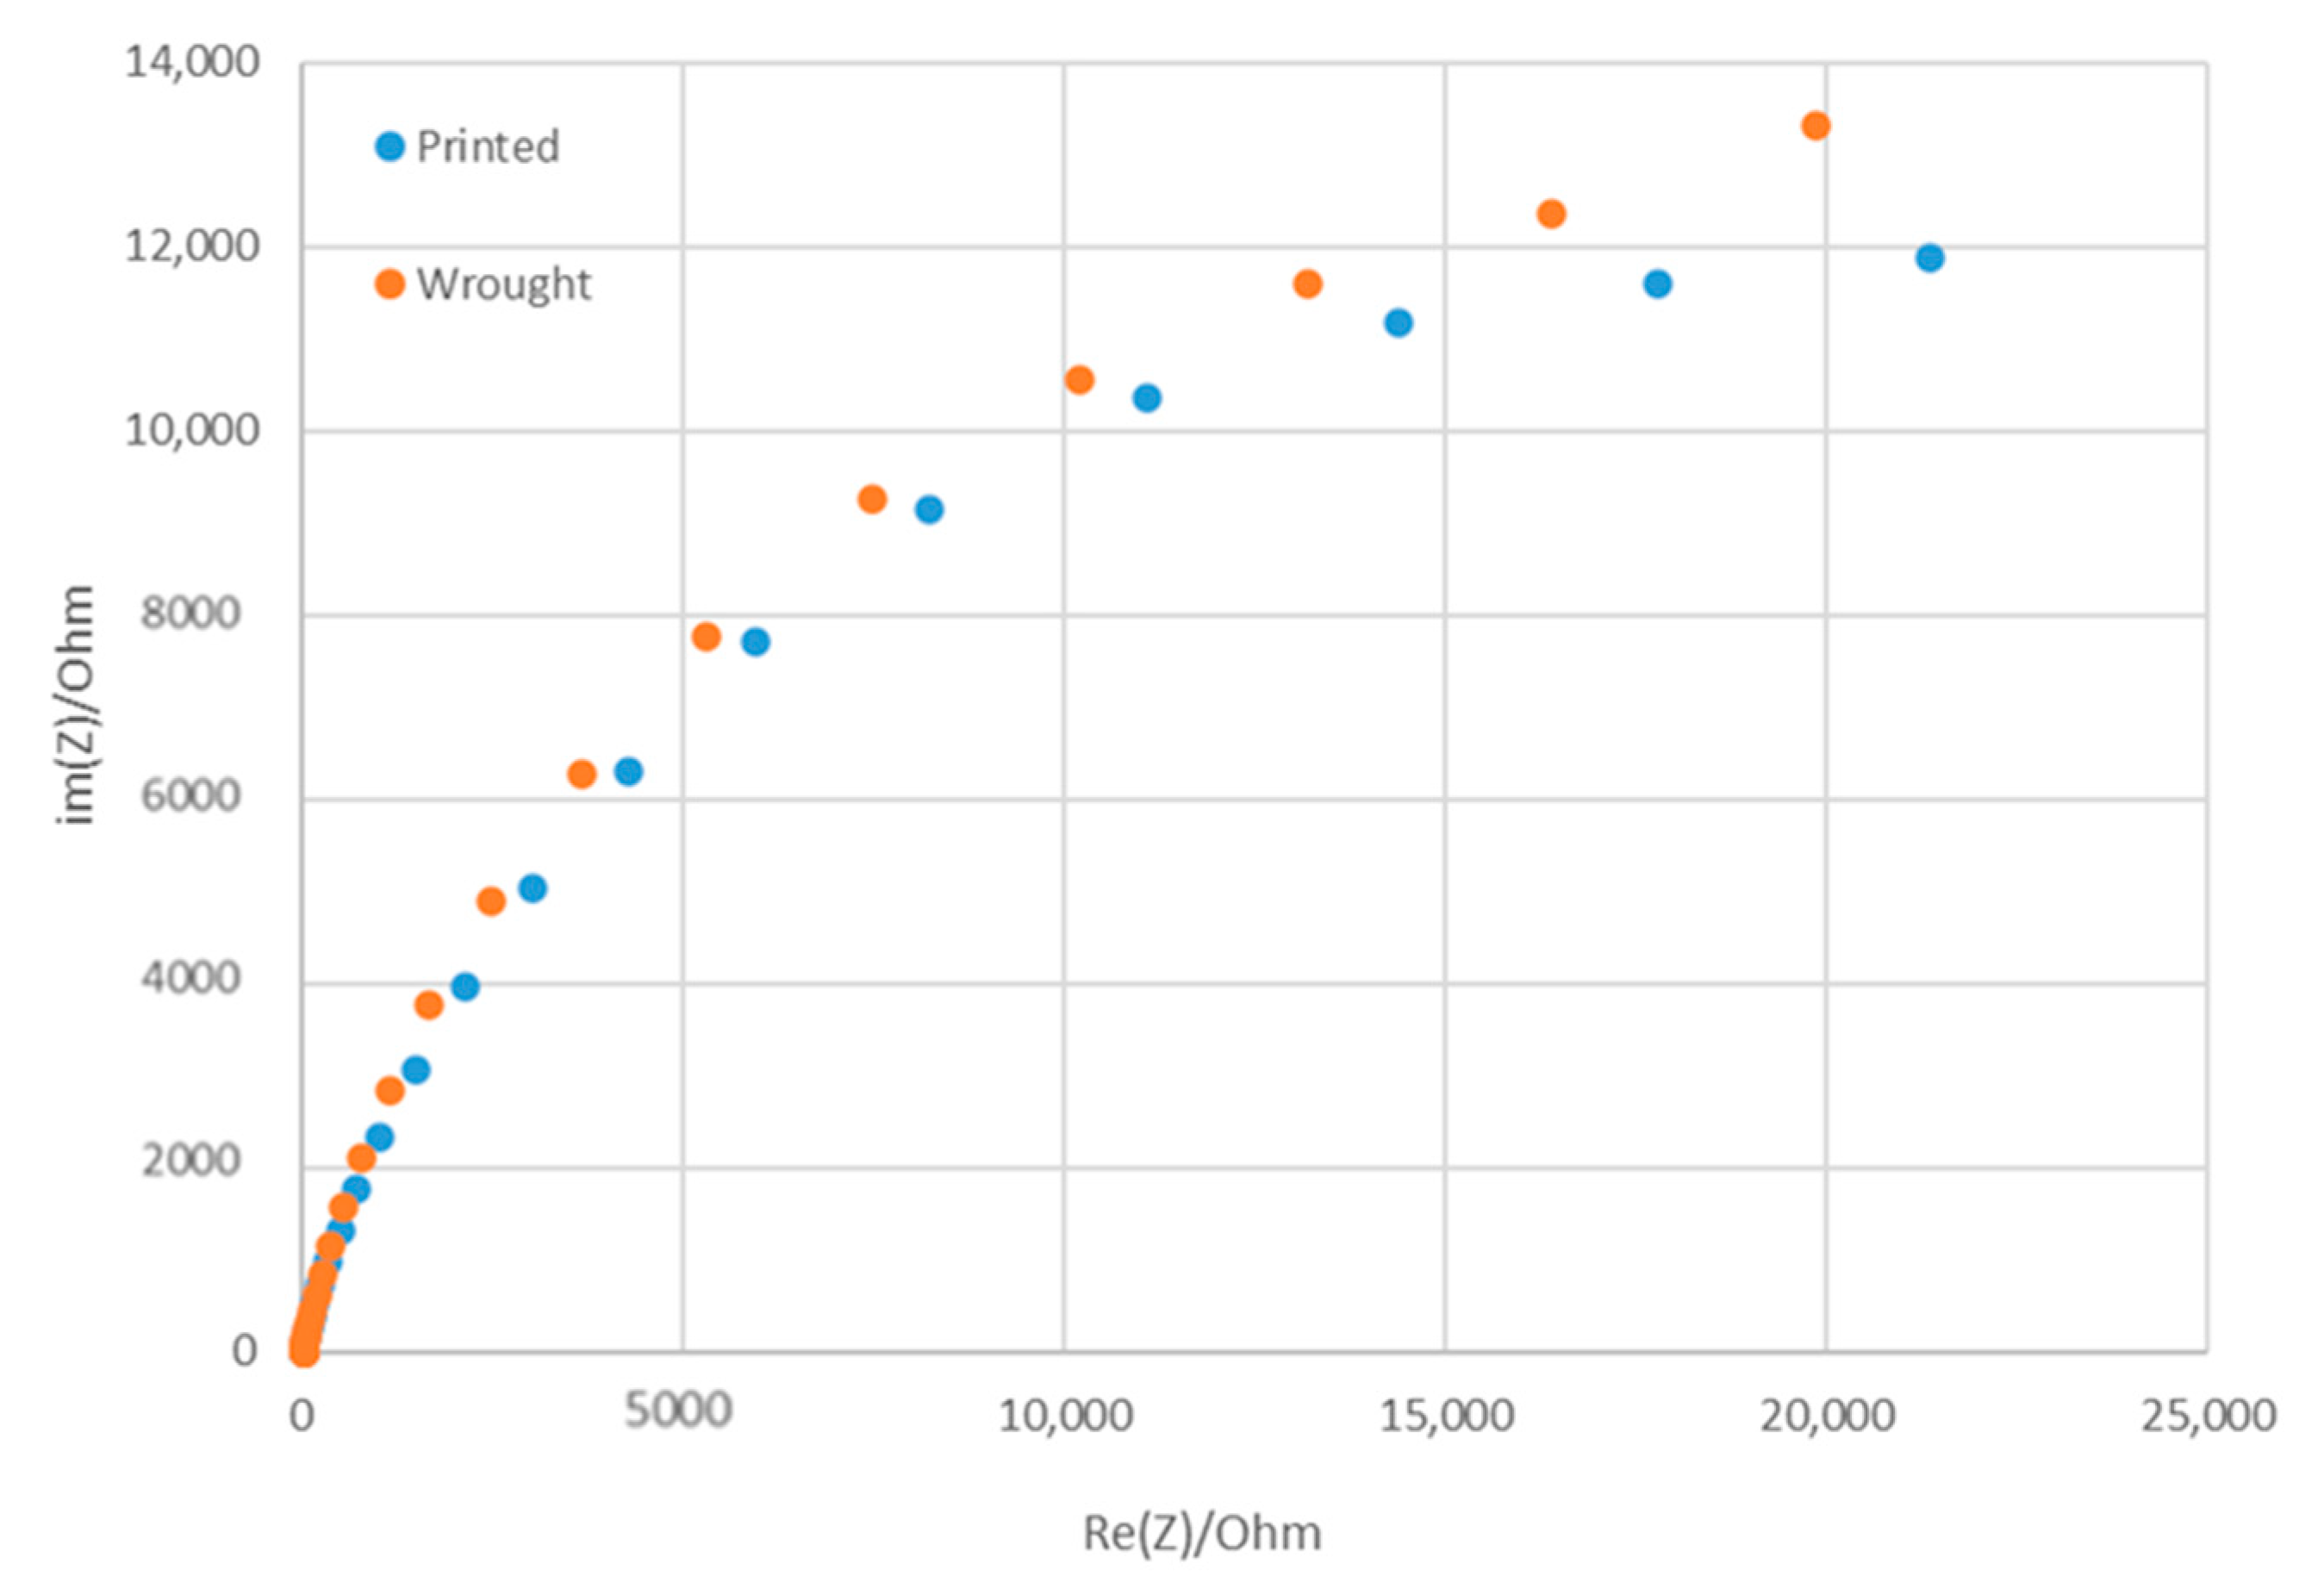
The corrosion performance of the WLAM samples and the counterpart AISI 316L alloy, as expressed in the potentiodynamic polarization analysis, are shown in Figure 6. The Tafel extrapolation measurements are presented in Table 4. Although both alloys demonstrated adequate corrosion resistance (less than 0.02 mmpy [42]), the corrosion current and passivation current of the WLAM alloy were relatively elevated, indicating a reduced passivity capability. Consequently, it appears that the resistance of the WLAM alloy to localized corrosion attacks was relatively reduced. This assumption is also supported by the results of the Nyquist diagram determined from electrochemical impedance spectroscopy (EIS) analysis, as shown in Figure 7 and Table 5. These measurements clearly show that the curve radius of the Nyquist diagram of the counterpart AISI 316L alloy was relatively higher than that of the WLAM alloy, which clearly indicates the existence of increased surface corrosion resistance.
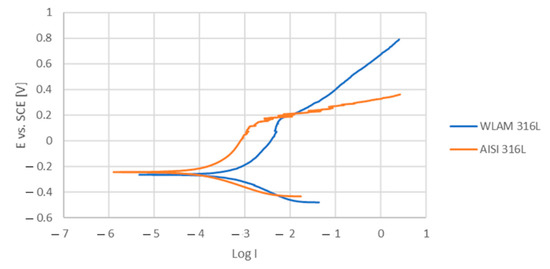
Figure 6.
Potentiodynamic polarization curves of a WLAM sample and its counterpart AISI 316L alloy.
Table 4.
Corrosion characteristics of the WLAM sample and its counterpart AISI 316L alloy, along with corrosion rate measurements obtained by Tafel extrapolation.
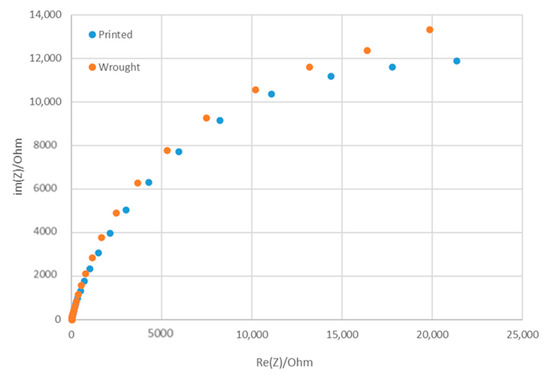
Figure 7.
Nyquist diagram for electrochemical impedance spectroscopy analysis of the WLAM sample and its counterpart AISI 316L alloy.
Table 5.
Parameters of EIS analysis presented in Figure 7.
3.5. Stress Corrosion Analysis
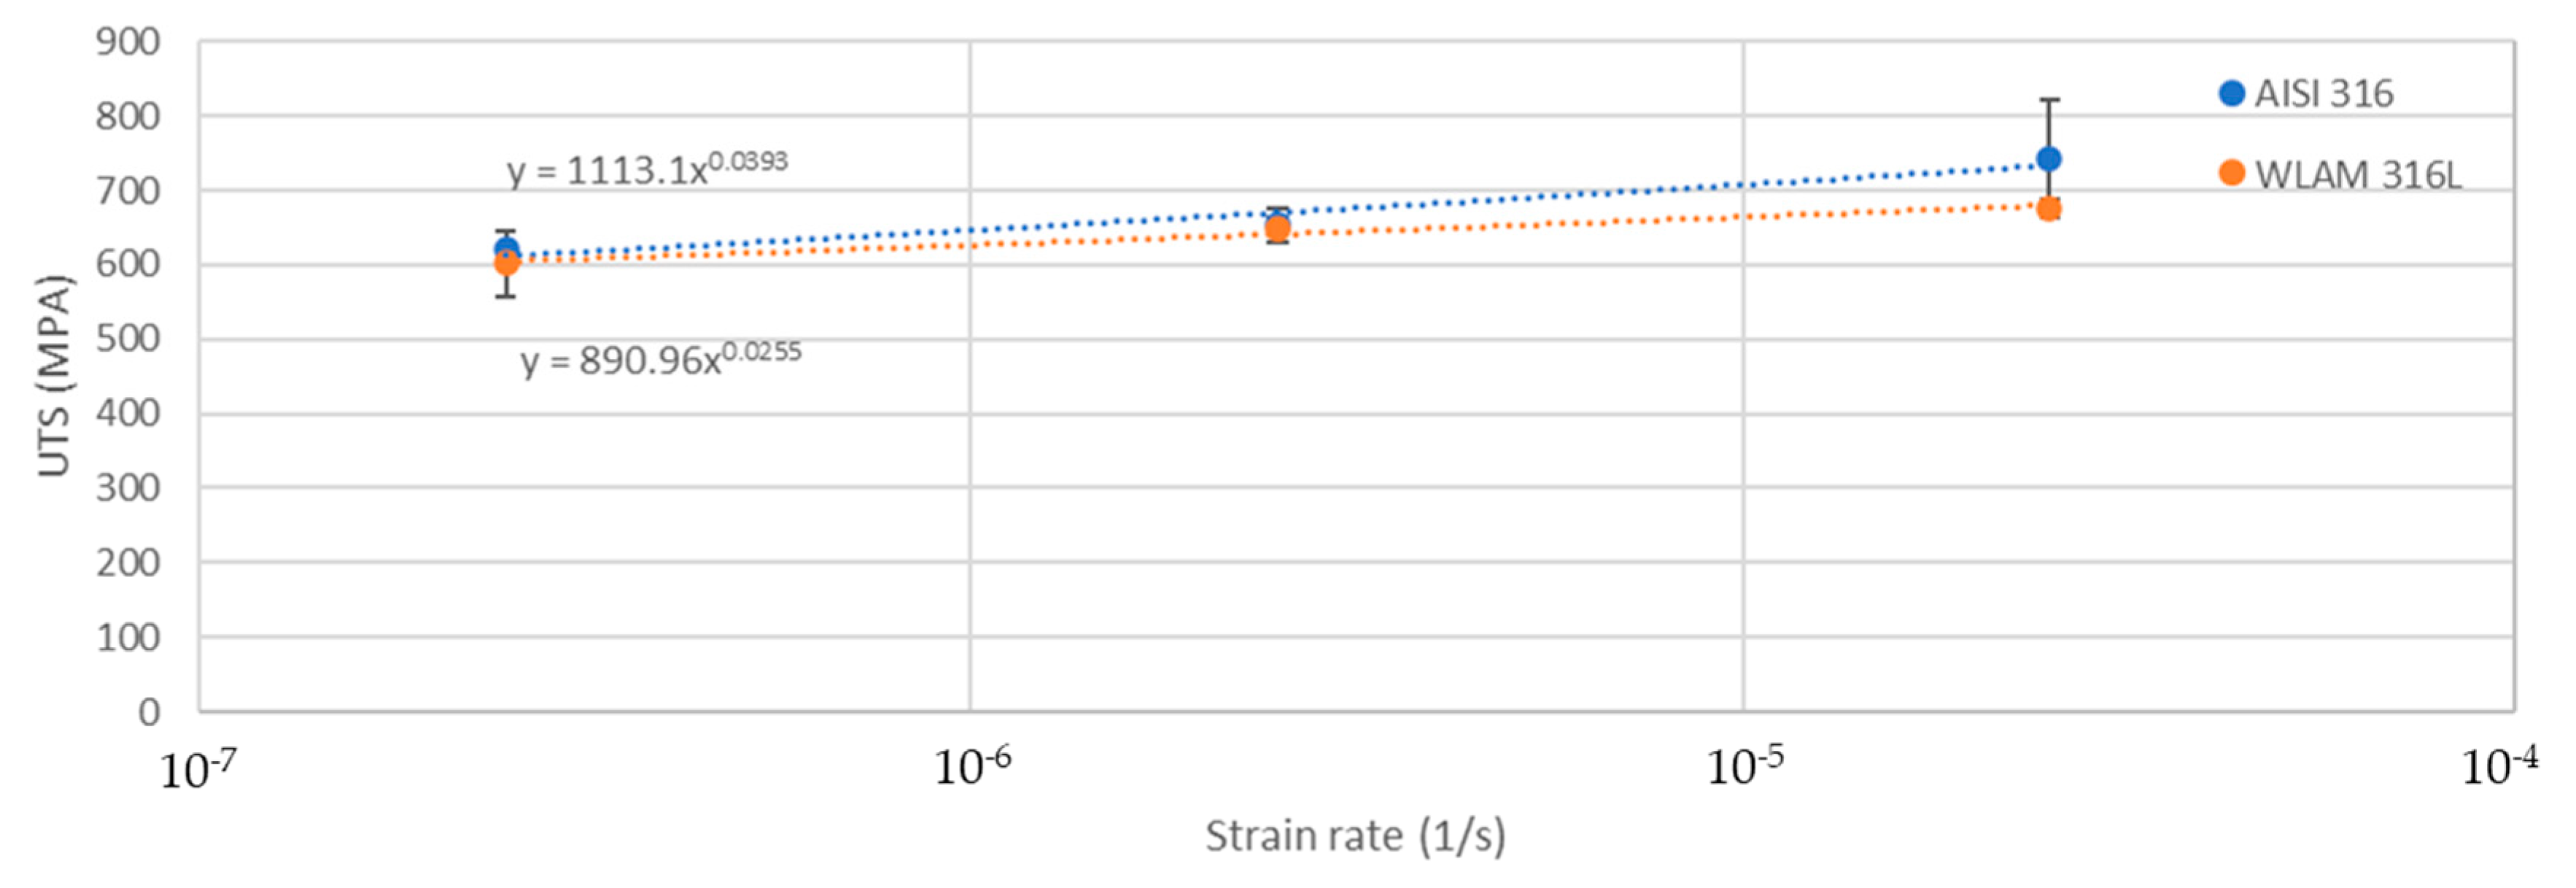
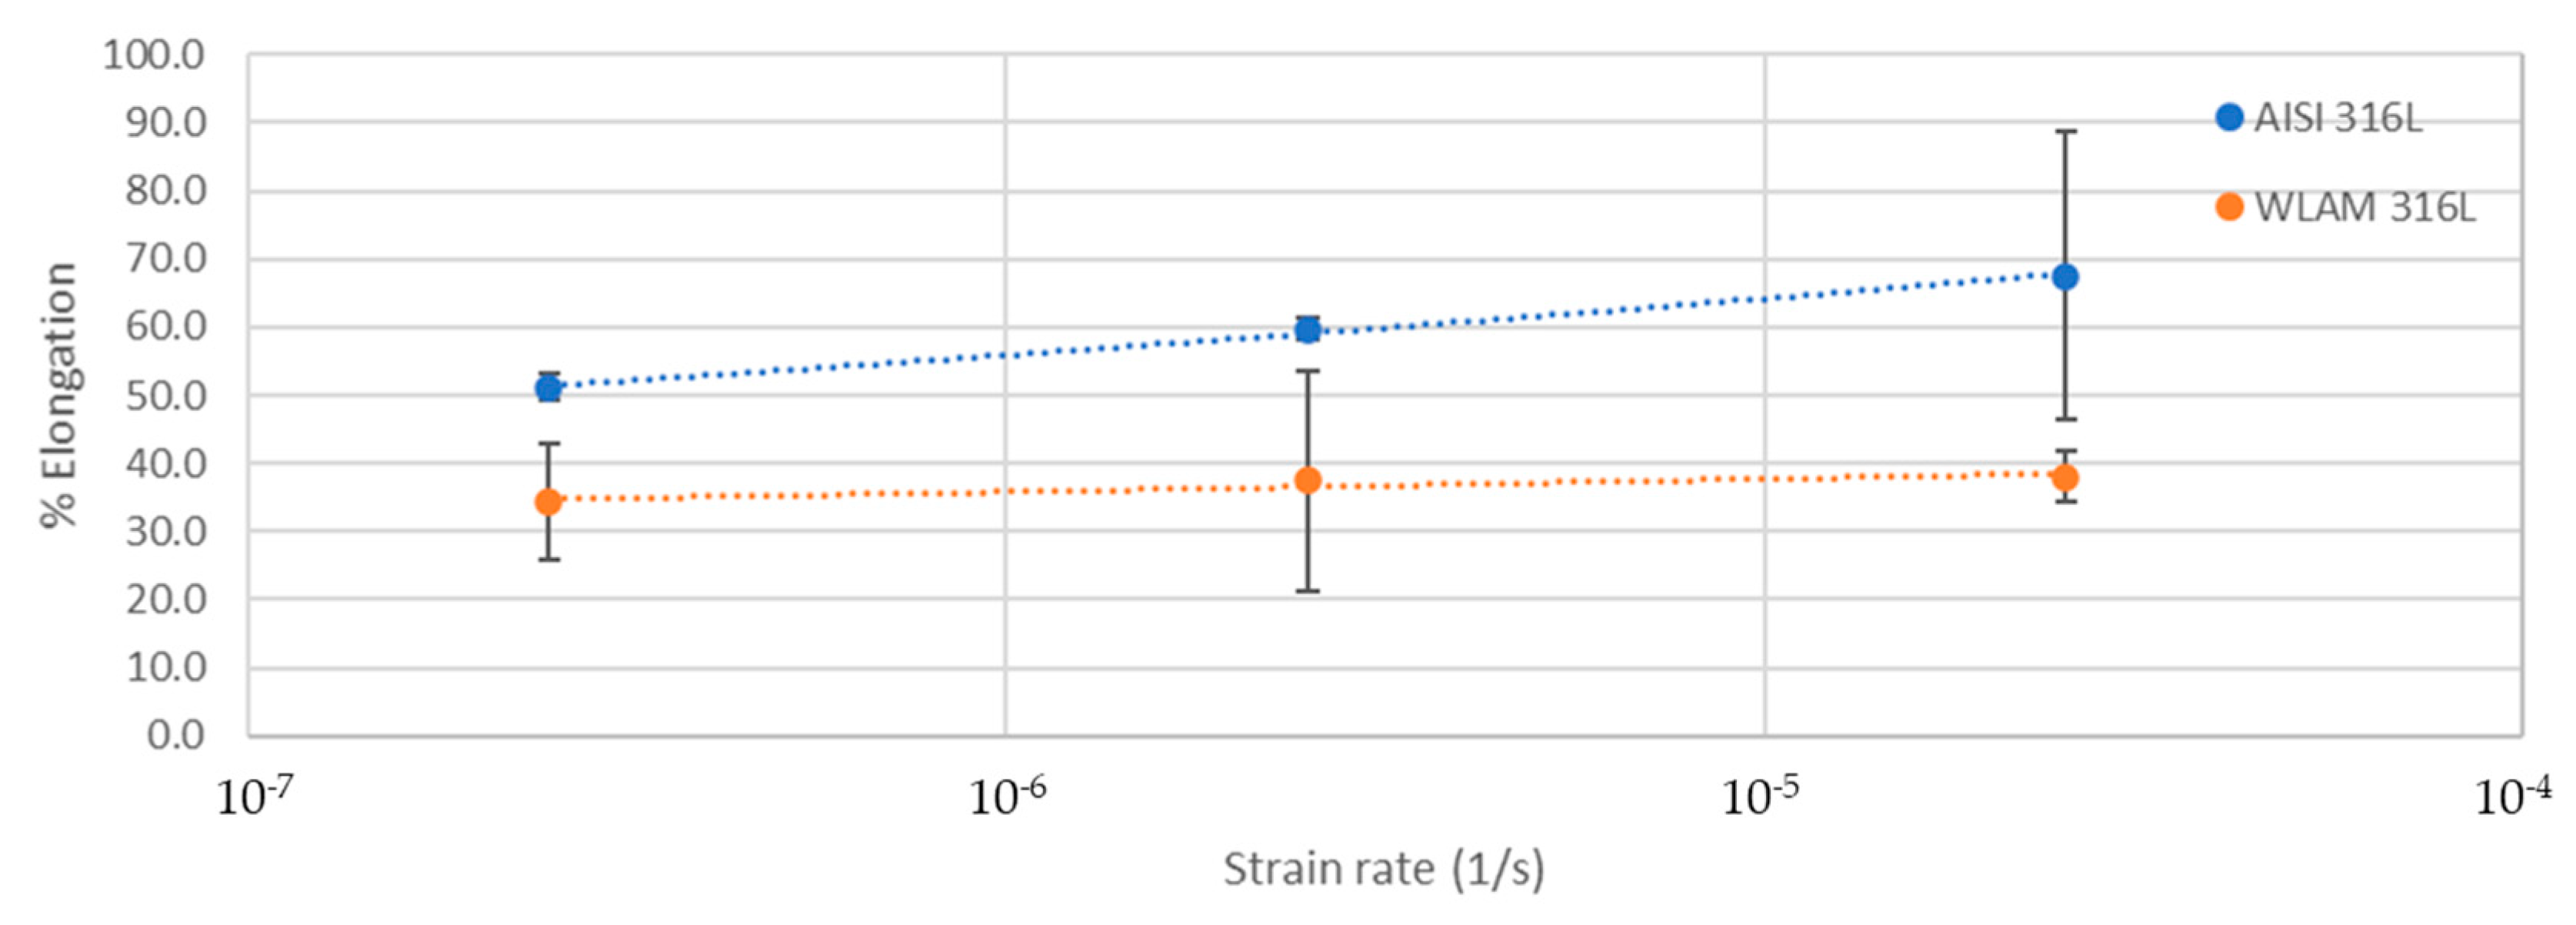
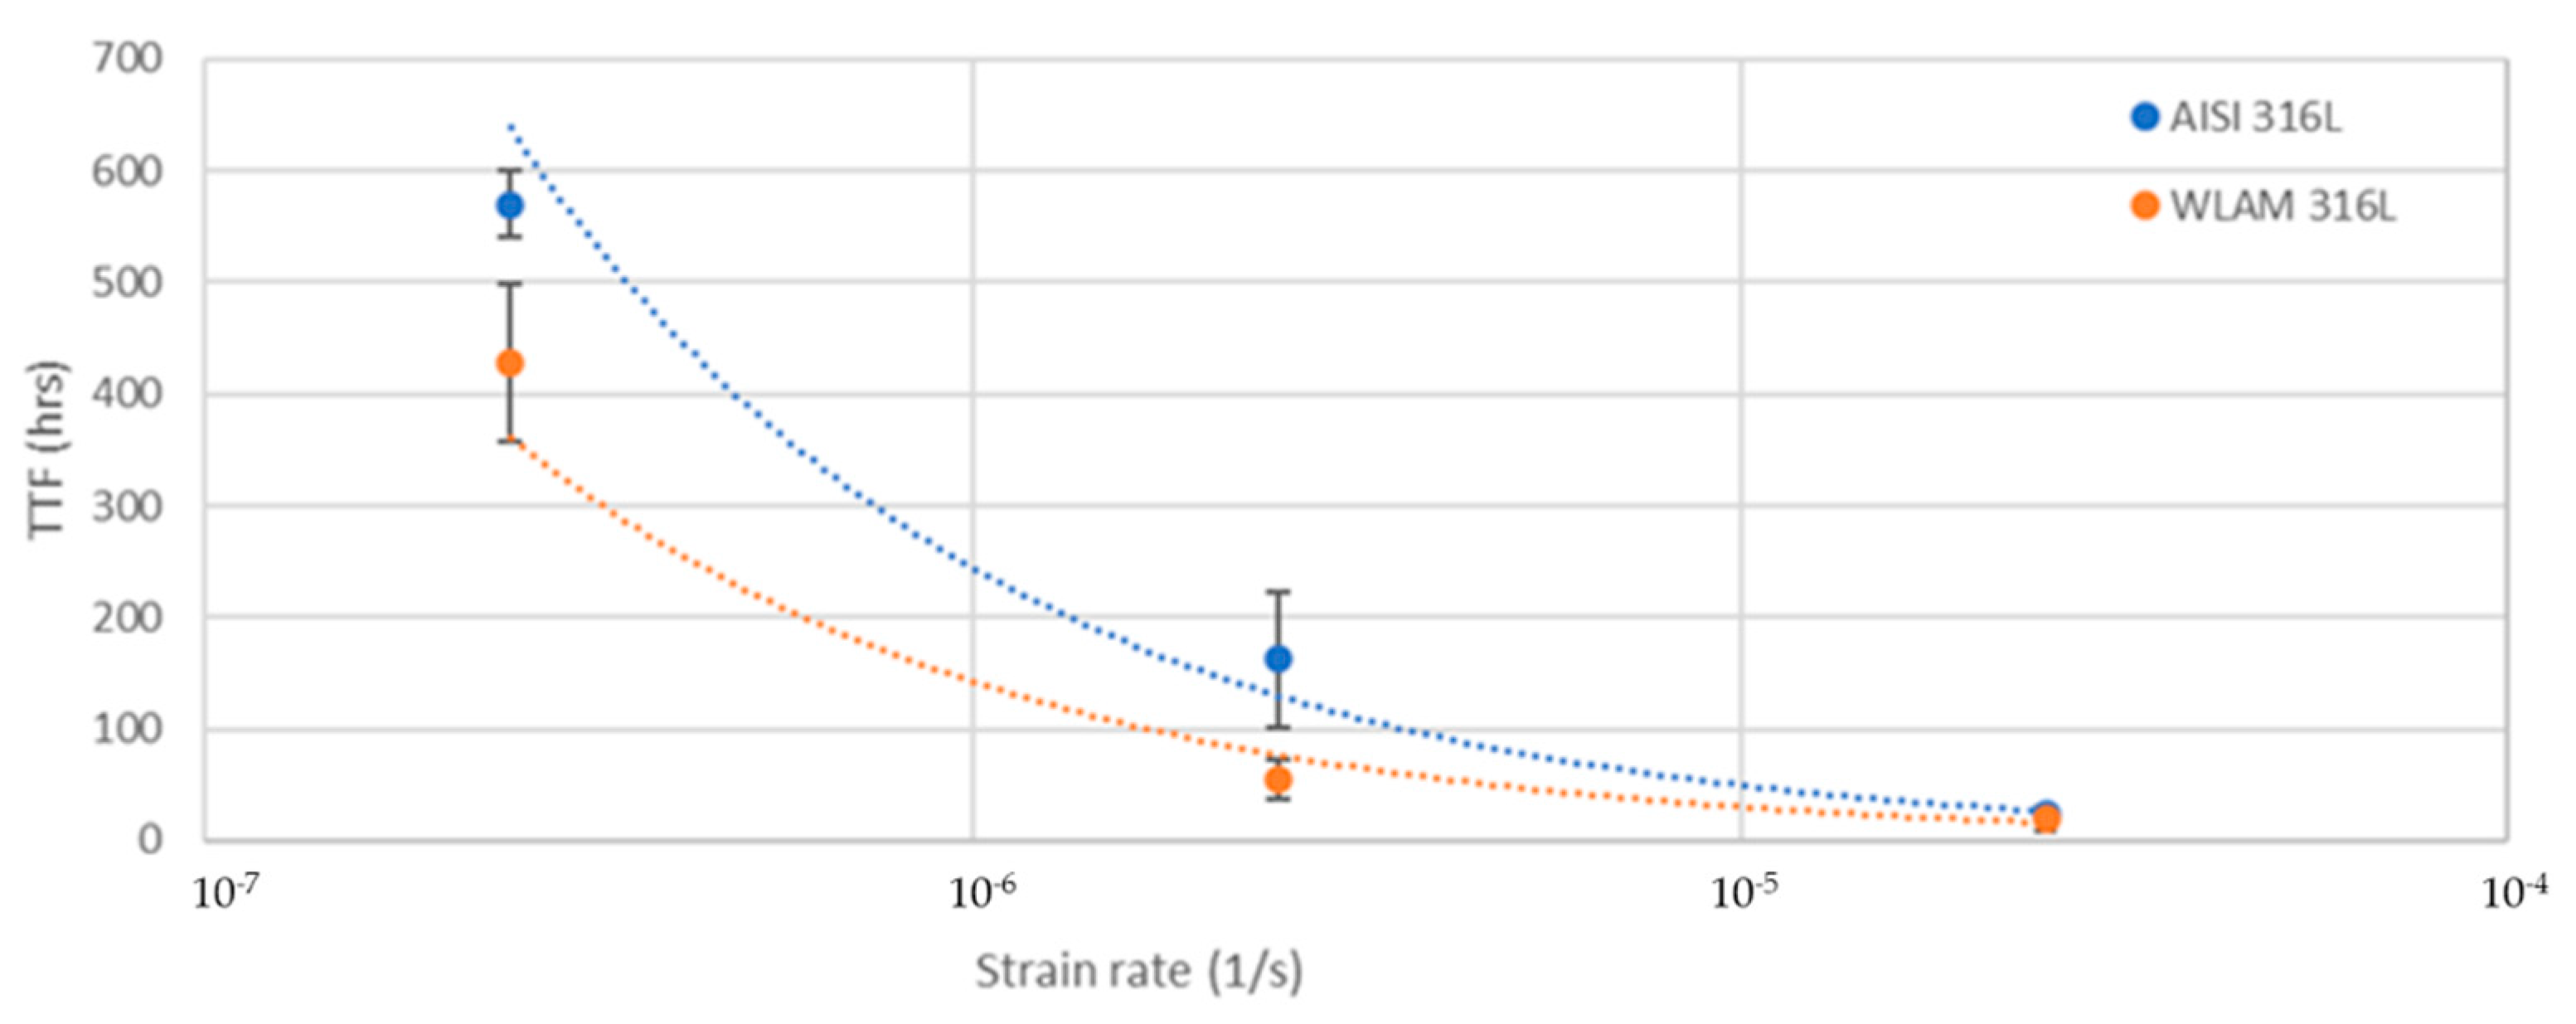
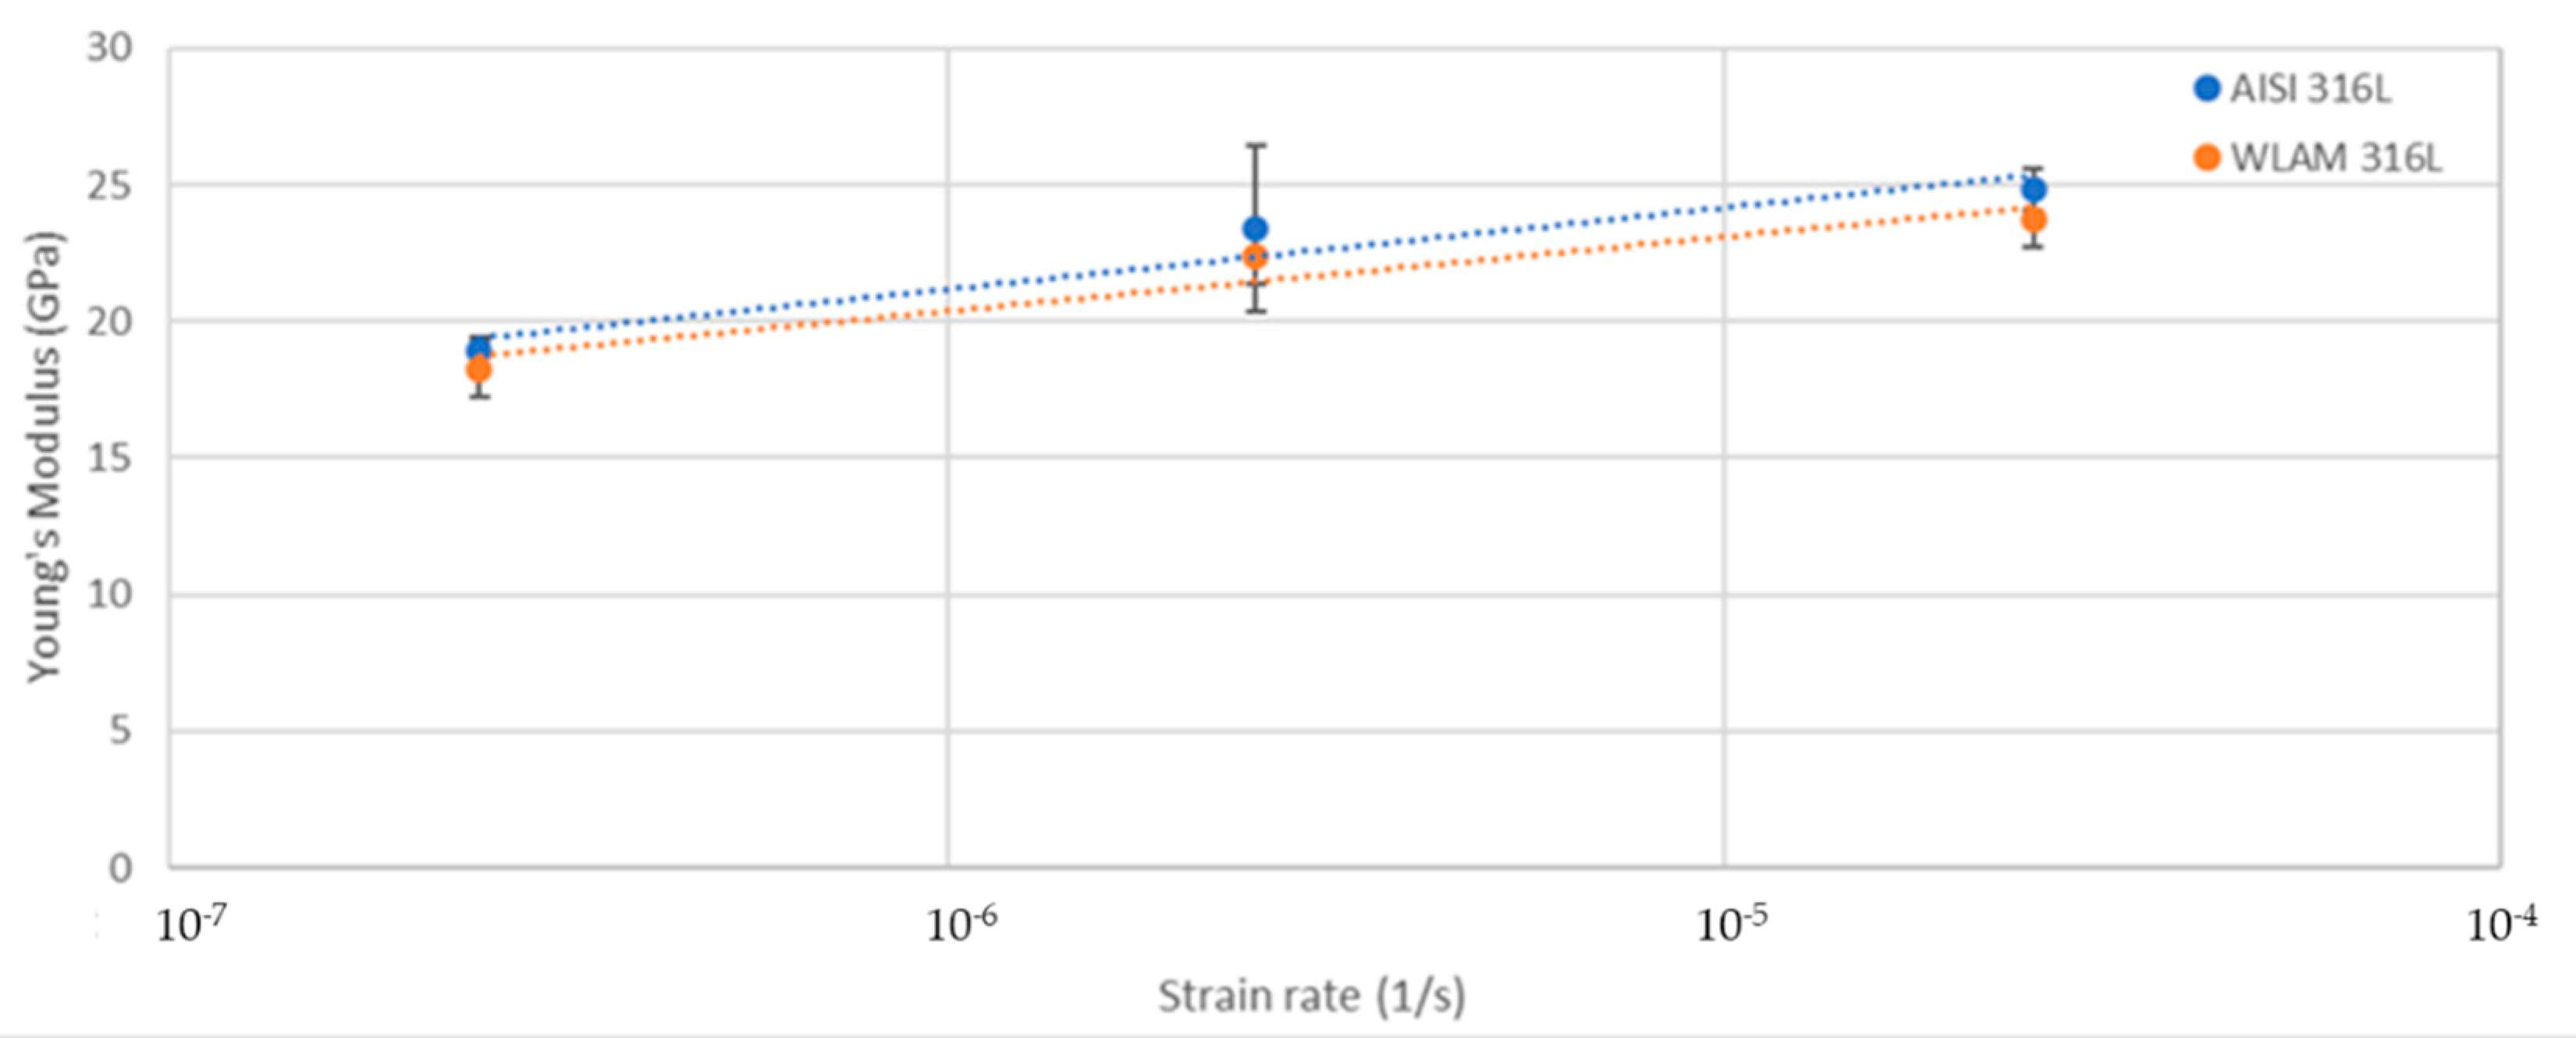
The stress corrosion behavior of the WLAM samples and the counterpart AISI 316L alloy was also investigated using slow strain rate testing (SSRT) in a 3.5% NaCl solution at different strain rates, as shown in Figure 8, Figure 9, Figure 10 and Figure 11. The ultimate tensile strength (UTS) vs. strain rate (Figure 8) of the two alloys were quite similar, including their sensitivity factor m (m is the parameter required to enable fitting of the equation (), where C is a fitting constant). In the results, m was 0.0255 and 0.0393 for the WLAM sample and counterpart alloy AISI 316L, respectively. The two alloys showed similar elongation vs. strain rate behaviors (Figure 10) while maintaining their inherent differences in elongation, as obtained by the stress–strain curve examinations in air. Both alloys showed similar Young’s modulus values as well (Figure 11), with increasing values with the increase in the strain rate. The main difference in SSRT behavior between the two alloys was obtained for their time to failure vs. strain rate curves shown in Figure 10. This difference was manifested especially at reduced strain rates (below 2.5 × 10⁻⁶ s−1), when the effect of the corrosive solution was significantly more dominant. Consequently, the time to failure of the WLAM sample and its counterpart AISI-wrought alloy at a strain rate of 2.5 × 10⁻⁷ was about 400 h and 600 h, respectively. This clearly indicates that the overall stress corrosion resistance of the WLAM alloy was relatively reduced compared with its counterpart AISI 316L alloy. The fractography analysis of the two alloys after the SSRT examination at a strain rate of 2.5 * 10−7 s−1 is shown in Figure 12. This analysis revealed that the source of failure of the counterpart AISI 316L alloy was its relatively greater ductility vs. that of the WLAM alloy. This was manifested by the increased depth of the dimples in the fracture surface of the counterpart AISI alloy, indicating increased ductility [43,44].
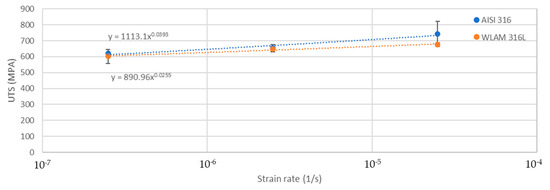
Figure 8.
Ultimate tensile strength vs. strain rate of the WLAM samples and the counterpart AISI 316L alloy.
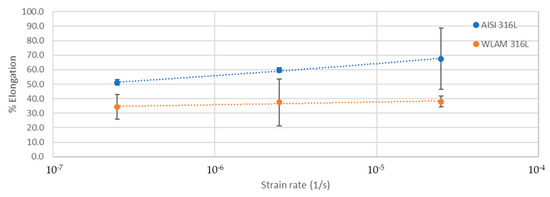
Figure 9.
Elongation vs. strain rate of the WLAM samples and the counterpart AISI 316L alloy.
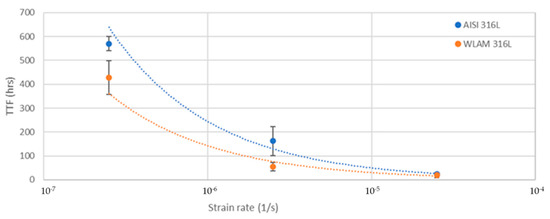
Figure 10.
Time to failure vs. strain rate of the WLAM samples and the counterpart AISI 316L alloy.
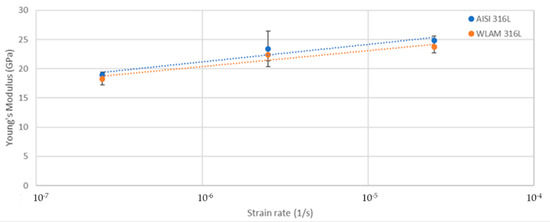
Figure 11.
Young’s modulus vs. strain rate of the WLAM samples and counterpart AISI 316L alloy.
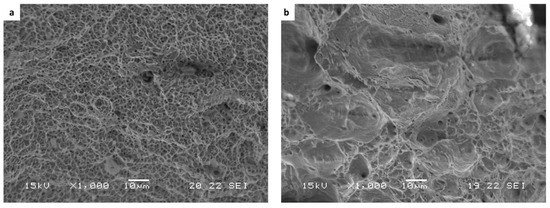
Figure 12.
Fracture surface analysis obtained after SSRT examination at a strain rate of 2.5 × 10⁻⁷ 1/s: (a) WLAM sample and (b) counterpart AISI 316L alloy.
4. Discussion
A major difference between the WLAM 316L alloy and its counterpart AISI 316L alloy lies in their microstructural dissimilarities, mainly the phase composition, structural morphology and inherent defects. With regard to the phase composition, the two-phase microstructure (γ-Fe and δ-Fe) obtained in the WLAM process using regular 316L alloy as a feeding wire can be explained in terms of a Schaeffler diagram. This kind of diagram can be used to predict the type of phases obtained in the weld deposits of stainless steel, depending on their alloying compositions. According to Guo et al. [45], the position of the 316L alloy in the Schaeffler diagram indicates that this alloy can accommodate up to about a 5% ferritic phase within an austenitic matrix. Hence, during the WLAM solidification process, the concentrations of the Ni equivalent and Cr equivalent are non-uniform throughout the melt pool, creating a Ni-rich matrix and Cr-rich regions as a secondary ferritic phase at the grain boundaries. Consequently, the Ni-rich regions produce an FCC-austenite phase, while the Cr-rich regions produce a BCC-ferritic phase [46]. In the case of the WLAM process, melt pool boundaries are formed due to the differences in the temperature gradients. Lower temperatures at the edge of the melt pool permit a slower solidification process, which leads to the formation of a more stable ferritic phase. In parallel, much higher temperature gradients (above 103 K) can create a meta-stable austenite phase at the core of the melt pool [46,47]. In parallel, the microstructure of the counterpart AISI 316L alloy was purely austenitic, as clearly indicated by the X-ray diffraction analysis. In this case, there was no evidence of significant temperature gradients within the bulk of the alloy during solidification that could create the formation of a separate ferritic phase as in the case of the WLAM alloy. With regard to the inherent defects, it was evident that the samples produced by WLAM included typical AM microstructural imperfections in the form of porosity and a lack of fusion, which could have a detrimental effect on the mechanical properties and corrosion resistance [48,49].
In addition, it was evident from the potentiodynamic polarization analysis that the corrosion and passivation currents of the WLAM alloy were relatively elevated compared with its counterpart AISI 316L alloy, clearly indicating that the WLAM samples were more susceptible to localized corrosion attacks [50,51]. This result was also supported by the electrochemical impedance spectroscopy analysis and the associated Nyquist diagram curve radius. The reduced stress corrosion resistance demonstrated by SSRT analysis of the WLAM samples compared with the AISI 316L alloy was manifested mainly in terms of the time to failure vs. strain rate. At a relatively slow strain rate of 2.5 × 10⁻⁷ s−1, the times to failure of the WLAM sample and its counterpart AISI-wrought alloy were about 400 h and 600 h, respectively. This finding clearly indicates that slower strain rates amplified the effect of corrosion attacks by increasing the exposure time to the corrosive medium, which consequently triggered corrosion processes, mainly at the inherent microstructural imperfections.
All the phenomena discussed in this paper—the inferior mechanical properties, corrosion resistance and stress corrosion endurance of the WLAM samples compared with the AISI 316L alloy—can be attributed to the differences in microstructures and inherent defects that are formed during the WLAM process. Hence, additional experimental work is required in order to optimize the processing parameters of the WLAM process, mainly with the aim to reduce the inherent defects in the form of the porosity and lack of fusion. In addition, post heat treatments should also be considered in order to upgrade the homogeneity of the WLAM alloy and reduce its internal stresses that affect the mechanical and corrosion resistance properties. Altogether, this study contributes an important experimental step toward the capability to produce simple geometrics at affordable costs using WLAM technology.
5. Conclusions
The mechanical properties, corrosion resistance and stress corrosion performance of the samples produced by the wire laser additive manufacturing (WLAM) process using 316L as a feeding wire were relatively inferior compared with its counterpart AISI 316L alloy. The difference in properties was attributed to dissimilarities in the microstructures and inherent defects in the form of the porosity and lack of fusion. In the case of the WLAM alloy, the microstructure was composed of two phases (δ-ferrite and γ-austenite), while its counterpart alloy had a full austenitic structure. The two-phase microstructure in the WLAM alloy was explained in terms of a Schaeffler diagram. Consequently, it is believed that the lower temperatures at the edge of the melt pool permit a slower solidification process, which leads to the formation of the ferritic phase. The sensitivity of the WLAM samples to premature stress corrosion failure as evaluated by SSRT analysis was significantly increased at slow strain rates (below 2.5 × 10⁻⁶ s−1) due to the dominant effect of the corrosive environment.
Author Contributions
Conceptualization and design of the experiments: E.A., A.S. and M.B.; Writing: M.B. and E.A.; performed the experiments: M.B.; assisted with the experiments: A.K., R.K., T.R. and A.L. All authors have read and agreed to the published version of the manuscript.
Funding
This research received no external funding.
Conflicts of Interest
The authors declare no conflict of interest.
References
- Herzog, D.; Seyda, V.; Wycisk, E.; Emmelmann, C. Additive manufacturing of metals. Acta Mater. 2016, 117, 371–392. [Google Scholar] [CrossRef]
- Khodabakhshi, F.; Farshidianfar, M.H.; Gerlich, A.P.; Nosko, M.; Trembošová, V.; Khajepour, A. Effects of laser additive manufacturing on microstructure and crystallographic texture of austenitic and martensitic stainless steels. Addit. Manuf. 2020, 31, 100915. [Google Scholar] [CrossRef]
- Haghdadi, N.; Laleh, M.; Moyle, M.; Primig, S. Additive manufacturing of steels: A review of achievements and challenges. J. Mater. Sci. 2020, 56, 64–107. [Google Scholar] [CrossRef]
- Saeidi, K.; Gao, X.; Lofaj, F.; Kvetková, L.; Shen, Z.J. Transformation of austenite to duplex austenite-ferrite assembly in annealed stainless steel 316L consolidated by laser melting. J. Alloy. Compd. 2015, 633, 463–469. [Google Scholar] [CrossRef]
- Eyers, D.R.; Potter, A.T. Industrial Additive Manufacturing: A manufacturing systems perspective. Comput. Ind. 2017, 92, 208–218. [Google Scholar] [CrossRef]
- Bhushan, B.; Caspers, M. An overview of additive manufacturing (3D printing) for microfabrication. Microsyst. Technol. 2017, 23, 1117–1124. [Google Scholar] [CrossRef]
- Tavlovich, B.; Katz, R. EBW and LBW of Additive Manufactured Ti6Al4V Products Mechanical and Physical Properties of Laser Bed Additive Manufacturing Alloys View project Tube Hydroforming View project. Artic. Weld. J. 2018, 97, 179–190. [Google Scholar] [CrossRef]
- Santa-Aho, S.; Kiviluoma, M.; Jokiaho, T.; Gundgire, T.; Honkanen, M.; Lindgren, M.; Vippola, M. Additive Manufactured 316L Stainless-Steel Samples: Microstructure, Residual Stress and Corrosion Characteristics after Post-Processing. Metals 2021, 11, 182. [Google Scholar] [CrossRef]
- Zhou, B.; Xu, P.; Li, W.; Liang, Y.; Liang, Y. Microstructure and Anisotropy of the Mechanical Properties of 316L Stainless Steel Fabricated by Selective Laser Melting. Metals 2021, 11, 775. [Google Scholar] [CrossRef]
- Vallejo, N.D.; Lucas, C.; Ayers, N.; Graydon, K.; Hyer, H.; Sohn, Y. Process Optimization and Microstructure Analysis to Understand Laser Powder Bed Fusion of 316L Stainless Steel. Metals 2021, 11, 832. [Google Scholar] [CrossRef]
- Galarraga, H.; Lados, D.A.; Dehoff, R.R.; Kirka, M.M.; Nandwana, P. Effects of the microstructure and porosity on properties of Ti-6Al-4V ELI alloy fabricated by electron beam melting (EBM). Addit. Manuf. 2016, 10, 47–57. [Google Scholar] [CrossRef] [Green Version]
- Khorasani, M.; Ghasemi, A.; Rolfe, B.; Gibson, I. Additive manufacturing a powerful tool for the aerospace industry. Rapid Prototyp. J. 2021. [Google Scholar] [CrossRef]
- Bekker, A.C.M.; Verlinden, J.C. Life cycle assessment of wire + arc additive manufacturing compared to green sand casting and CNC milling in stainless steel. J. Clean. Prod. 2018, 177, 438–447. [Google Scholar] [CrossRef] [Green Version]
- Cunningham, C.R.; Wikshåland, S.; Xu, F.; Kemakolam, N.; Shokrani, A.; Dhokia, V.; Newman, S.T. Cost Modelling and Sensitivity Analysis of Wire and Arc Additive Manufacturing. Procedia. Manuf. 2017, 11, 650–657. [Google Scholar] [CrossRef]
- Wilson, J.M.; Piya, C.; Shin, Y.C.; Zhao, F.; Ramani, K. Remanufacturing of turbine blades by laser direct deposition with its energy and environmental impact analysis. J. Clean. Prod. 2014, 80, 170–178. [Google Scholar] [CrossRef]
- Marya, M.; Singh, V.; Hascoet, J.-Y.; Marya, S. A Metallurgical Investigation of the Direct Energy Deposition Surface Repair of Ferrous Alloys. J. Mater. Eng. Perform. 2018, 27, 813–824. [Google Scholar] [CrossRef]
- Zhou, X.; Tian, Q.; Du, Y.; Zhang, Y.; Bai, X.; Zhang, Y.; Zhang, H.; Zhang, C.; Yuan, Y. Investigation of the effect of torch tilt and external magnetic field on arc during overlapping deposition of wire arc additive manufacturing. Rapid Prototyp. J. 2021, 27, 24–36. [Google Scholar] [CrossRef]
- Kulkarni, J.D.; Goka, S.B.; Parchuri, P.K.; Yamamoto, H.; Ito, K.; Simhambhatla, S. Microstructure evolution along build direction for thin-wall components fabricated with wire-direct energy deposition. Rapid Prototyp. J. 2021, 27, 1289–1301. [Google Scholar] [CrossRef]
- Rodrigues, T.A.; Duarte, V.; Miranda, R.M.; Santos, T.G.; Oliveira, J.P. Current Status and Perspectives on Wire and Arc Additive Manufacturing (WAAM). Materal 2019, 12, 1121. [Google Scholar] [CrossRef] [Green Version]
- Ron, T.; Dolev, O.; Leon, A.; Shirizly, A.; Aghion, E. Effect of phase transformation on stress corrosion behavior of additively manufactured austenitic stainless steel produced by directed energy deposition. Materials 2021, 14, 55. [Google Scholar] [CrossRef]
- Trelewicz, J.R.; Halada, G.P.; Donaldson, O.K.; Manogharan, G. Microstructure and Corrosion Resistance of Laser Additively Manufactured 316L Stainless Steel. Jom 2016, 68, 850–859. [Google Scholar] [CrossRef]
- Rodrigues, T.A.; Duarte, V.; Avila, J.A.; Santos, T.G.; Miranda, R.M.; Oliveira, J.P. Wire and arc additive manufacturing of HSLA steel: Effect of thermal cycles on microstructure and mechanical properties. Addit. Manuf. 2019, 27, 440–450. [Google Scholar] [CrossRef]
- Ding, D.; Pan, Z.; Cuiuri, D.; Li, H. Wire-feed additive manufacturing of metal components: Technologies, developments and future interests. Int. J. Adv. Manuf. Technol. 2014, 81, 465–481. [Google Scholar] [CrossRef]
- Ding, D.; Pan, Z.; Cuiuri, D.; Li, H. A multi-bead overlapping model for robotic wire and arc additive manufacturing (WAAM). Robot. Comput. Integr. Manuf. 2015, 31, 101–110. [Google Scholar] [CrossRef] [Green Version]
- Fang, X.; Ren, C.; Zhang, L.; Wang, C.; Huang, K.; Lu, B. A model of bead size based on the dynamic response of CMT-based wire and arc additive manufacturing process parameters. Rapid Prototyp. J. 2021, 27, 741–753. [Google Scholar] [CrossRef]
- Tang, S.; Wang, G.; Song, H.; Li, R.; Zhang, H. A novel method of bead modeling and control for wire and arc additive manufacturing. Rapid Prototyp. J. 2021, 27, 311–320. [Google Scholar] [CrossRef]
- Busachi, A.; Erkoyuncu, J.; Colegrove, P.; Martina, F.; Watts, C.; Drake, R. A review of Additive Manufacturing technology and Cost Estimation techniques for the defence sector. CIRP J. Manuf. Sci. Technol. 2017, 19, 117–128. [Google Scholar] [CrossRef] [Green Version]
- Gisario, A.; Kazarian, M.; Martina, F.; Mehrpouya, M. Metal additive manufacturing in the commercial aviation industry: A review. J. Manuf. Syst. 2019, 53, 124–149. [Google Scholar] [CrossRef]
- Ahn, D.G. Directed Energy Deposition (DED) Process: State of the Art. Korean Soc. Precis. Eng. 2021, 8, 1–40. [Google Scholar] [CrossRef]
- Brandl, E.; Baufeld, B.; Leyens, C.; Gault, R. Additive manufactured Ti-6A1-4V using welding wire: Comparison of laser and arc beam deposition and evaluation with respect to aerospace material specifications. Phys. Procedia 2010, 5, 595–606. [Google Scholar] [CrossRef] [Green Version]
- Mok, S.H.; Bi, G.; Folkes, J.; Pashby, I.; Segal, J. Deposition of Ti-6Al-4V using a high power diode laser and wire, Part II: Investigation on the mechanical properties. Surf. Coatings Technol. 2008, 202, 4613–4619. [Google Scholar] [CrossRef]
- Vildanov, A.; Babkin, K.; Mendagaliyev, R.; Arkhipov, A.; Turichin, G. Using a Trial Sample on Stainless Steel 316L in a Direct Laser Deposition Process. Metals 2021, 11, 1550. [Google Scholar] [CrossRef]
- Yadollahi, A.; Shamsaei, N.; Thompson, S.M.; Seely, D.W. Effects of process time interval and heat treatment on the mechanical and microstructural properties of direct laser deposited 316L stainless steel. Mater. Sci. Eng. A 2015, 644, 171–183. [Google Scholar] [CrossRef]
- Zhang, K.; Wang, S.; Liu, W.; Shang, X. Characterization of stainless steel parts by Laser Metal Deposition Shaping. Mater. Des. 2014, 55, 104–119. [Google Scholar] [CrossRef]
- Oh, W.J.; Lee, W.J.; Kim, M.S.; Jeon, J.B.; Shim, D.S. Repairing additive-manufactured 316L stainless steel using direct energy deposition. Opt. Laser Technol. 2019, 117, 6–17. [Google Scholar] [CrossRef]
- Kaya, A.A.; Uzan, P.; Eliezer, D.; Aghion, E. Electron microscopical investigation of as cast AZ91D alloy. Mater. Sci. Technol. 2013, 16, 1001–1006. [Google Scholar] [CrossRef]
- Levy, G.K.; Leon, A.; Kafri, A.; Ventura, Y.; Drelich, J.W.; Goldman, J.; Vago, R.; Aghion, E. Evaluation of biodegradable Zn-1%Mg and Zn-1%Mg-0.5%Ca alloys for biomedical applications. J. Mater. Sci. Mater. Med. 2017, 28, 1–11. [Google Scholar] [CrossRef]
- Svetlizky, D.; Das, M.; Zheng, B.; Vyatskikh, A.L.; Bose, S.; Bandyopadhyay, A.; Schoenung, J.M.; Lavernia, E.J.; Eliaz, N. Directed energy deposition (DED) additive manufacturing: Physical characteristics, defects, challenges and applications. Mater. Today 2021. [Google Scholar] [CrossRef]
- SCHAEFFLER, A.L. Constitution Diagram for Stainless Steel Weld Metal. Met. Prog. 1949, 56, 680. Available online: https://ci.nii.ac.jp/naid/10026309068 (accessed on 27 October 2021).
- Otto, M.; Pilz, S.; Gebert, A.; Kühn, U.; Hufenbach, J. Effect of build orientation on the microstructure, mechanical and corrosion properties of a biodegradable high Manganese steel processed by laser powder bed fusion. Metals 2021, 11, 944. [Google Scholar] [CrossRef]
- Dass, A.; Moridi, A. State of the art in directed energy deposition: From additive manufacturing to materials design. Coatings 2019, 9, 418. [Google Scholar] [CrossRef] [Green Version]
- Olabisi, O.; Khuraibut, Y.; Jarragh, A.; Mathew, A. Identifying Key Performance Indicators for Corrosion in Oilfield Water Handling Systems. In Proceedings of the CORROSION 2014, San Antonio, TA, USA, 9–13 March 2014. [Google Scholar]
- Kumar, P.; Jayaraj, R.; Suryawanshi, J.; Satwik, U.R.; McKinnell, J.; Ramamurty, U. Fatigue strength of additively manufactured 316L austenitic stainless steel. Acta. Mater. 2020, 199, 225–239. [Google Scholar] [CrossRef]
- Kubík, P.; Šebek, F.; Petruška, J.; Hůlka, J.; Park, N.; Huh, H. Comparative investigation of ductile fracture with 316L austenitic stainless steel in small punch tests: Experiments and simulations. Theor. Appl. Fract. Mech. 2018, 98, 186–198. [Google Scholar] [CrossRef]
- Guo, P.; Zou, B.; Huang, C.; Gao, H. Study on microstructure, mechanical properties and machinability of efficiently additive manufactured AISI 316L stainless steel by high-power direct laser deposition. J. Mater. Process. Technol. 2017, 240, 12–22. [Google Scholar] [CrossRef]
- Lodhi, M.J.K.; Deen, K.M.; Greenlee-Wacker, M.C.; Haider, W. Additively manufactured 316L stainless steel with improved corrosion resistance and biological response for biomedical applications. Addit. Manuf. 2019, 27, 8–19. [Google Scholar] [CrossRef]
- Elmer, J.W.; Vaja, J.; Carpenter, J.S.; Coughlin, D.R.; Dvornak, M.J.; Hochanadel, P.; Gurung, A.; Johnson, G. Wire-Based Additive Manufacturing of Stainless Steel Components. Weld. J. 2020, 99, 8s–24s. [Google Scholar] [CrossRef]
- Ron, T.; Levy, G.K.; Dolev, O.; Leon, A.; Shirizly, A.; Aghion, E. The Effect of Microstructural Imperfections on Corrosion Fatigue of Additively Manufactured ER70S-6 Alloy Produced by Wire Arc Deposition. Metals 2020, 10, 98. [Google Scholar] [CrossRef] [Green Version]
- Ettefagh, A.H.; Guo, S.; Raush, J. Corrosion performance of additively manufactured stainless steel parts: A review. Addit. Manuf. 2021, 37, 101689. [Google Scholar] [CrossRef]
- Itzhak, D.; Aghion, E. An anodic behaviour study of an analogical sintered system of austenitic stainless steel in H2SO4 solution. Corros. Sci. 1984, 24, 145–149. [Google Scholar] [CrossRef]
- Al Saadi, S.; Yi, Y.; Cho, P.; Jang, C.; Beeley, P. Passivity breakdown of 316L stainless steel during potentiodynamic polarization in NaCl solution. Corros. Sci. 2016, 111, 720–727. [Google Scholar] [CrossRef]


Publisher’s Note: MDPI stays neutral with regard to jurisdictional claims in published maps and institutional affiliations. |
© 2021 by the authors. Licensee MDPI, Basel, Switzerland. This article is an open access article distributed under the terms and conditions of the Creative Commons Attribution (CC BY) license (https://creativecommons.org/licenses/by/4.0/).