Abstract
A major factor slowing down the establishment of additive manufacturing processes as production processes is insufficient reproducibility and productivity. Therefore, this work investigates the influence of ring-shaped beam profiles on process stability and productivity in laser-based powder bed fusion of AISI 316L. For this purpose, the weld track geometries of single tracks and multi-track segments with varying laser power, scan speed, hatch distance, and beam profile (Gaussian profile and three different ring-shaped profiles) are analyzed. To evaluate the process robustness, process windows are identified by classifying the generated single tracks into different process categories. The influence of the beam profiles on productivity is studied by analyzing the molten cross-sectional areas and volumes per time. When using ring-shaped beam profiles, the process windows are significantly larger (up to a laser power of 1050 W and a scanning speed of 1700 mm/s) than those of Gaussian beams (laser power up to 450 W and scanning speed up to 1100 mm/s), which suggests a higher process robustness and stability. With ring-shaped beam profiles, larger volumes can be stably melted per track and time. The weld tracks created with ring-shaped profiles are significantly wider than those generated with Gaussian profiles (up to factor 2 within the process window), allowing enlargement of the hatch distances. Due to the higher scanning speeds and the enlarged hatch distances for ring-shaped beam profiles, the process can be accelerated by a factor of approximately 2 in the parameter range investigated.
1. Introduction
Currently, continuous wave, vector-based exposure using Gaussian spots with spot diameters in the range from 40 to 120 µm represents the standard approach to laser-based powder bed fusion of metals (PBF-LB/M) [1]. The selected spot size is a compromise between achievable resolution and productivity. By enlarging the spot size and the scanning speed, productivity can be increased. The potential for increased productivity resulting from increases in laser power and scanning speed has been studied for several years [2]. To obtain sufficient melting and bonding of the individual melt tracks, the laser power must be increased to match the scanning speed. However, the two parameters cannot be increased ad infinitum because of various physical phenomena in the melt pool. The use of small Gaussian laser spots results in high intensities and temperature gradients when using PBF-LB/M, which cause different effects such as overheating or distinct Marangoni flows. Such effects can result in process defects such as keyholing and balling. The range of process parameters in which the process operates stably (no process defects such as keyholing or balling) and non-porous parts are generated can be termed the process window. With larger process windows, more process parameter combinations over a larger range result in a stable process. This reduces the probability of process defects occurring. Thus, the process becomes more stable and robust.
Investigations by Yadroitsev et al. [2] have shown that for high laser powers and scanning speeds, process defects such as overheating of the melt pool, powder denudation, and balling occur. Overheating occurs due to the Gaussian energy input into the center of the melt pool and causes spatter [3]. When using Gaussian beam profiles, powder denudation is primarily caused by the Bernoulli effect induced by material vaporization in the melt tracks center [4]. Balling effects are described in the literature by Marangoni flows and the Plateau–Rayleigh capillary instability of a liquid cylinder, which represents the melt pool [5]. Balling occurs at a critical length to diameter ratio of the melt pool [6]. In addition to reducing the scanning speed or laser power and thus shortening the melt pool, the width can also be increased to lower the ratio. This can be implemented by increasing the power and enlarging the spot. However, centric overheating remains if the Gaussian shape of the intensity distribution is maintained. Modern methods of beam shaping make it possible to use not only Gaussian and top-hat (also known as flat top) profiles but also other beam shapes. The advantages of alternative (non-Gaussian) beam profiles have been discussed in the literature in respect to welding and additive manufacturing. In the literature, the beam shapes have been achieved using diffractive optical elements (DOEs) [7,8] and lenses [9] among others. Until now, knowledge in respect of the influence of alternative beam profiles on PBF-LB/M remains limited.
Rasch et al. [7] achieve a wider process window and reduced surface roughness when using a ring profile instead of a Gaussian profile (similar diameters) for the heat conduction welding of aluminum–copper alloys. Ayoola et al. [10] show that top-hat profiles produce flatter weld geometries in comparison with Gaussian profiles of the same diameters. However, the intensity distribution has no significant influence on the width of the weld track [10]. Studies on the influence of different beam profiles on PBF-LB/M have been carried out at Moscow State University of Technology (STANKIN). Zhirnov et al. [11], Metel et al. [12], and Okunkova et al. [13,14] generated weld tracks using a Gaussian profile, a top-hat profile, and a donut profile, varying laser power and varying scanning speed. They conducted their experiments with CoCrMo powder. Zhirnov et al. [11] achieve significantly larger process windows by using alternative beam profiles (top-hat and ring profile) instead of a Gaussian beam profile. Based on this, Metel et al. [12] show that the process can be extended with other beam shapes. For the top-hat profile used, power and speed can be increased by 14% with similar geometric parameters of the melt tracks, and, by using a donut profile, power and speed can be increased by 43% [12]. Okunkova et al. [13,14] show experimentally that the use of top-hat and donut-shaped profiles can reduce spatter formation and the width of the denudation zone. Wischeropp et al. [8] investigate the stability and productivity of PBF-LB of AlSi10Mg with a ring-shaped beam profile. They achieve larger melt pools, fewer defects (cracks, balling, and porosity) and thus a better process robustness due to the donut-shaped beam profile [8]. Schleifenbaum et al. [15] and Loh et al. [16] show the potential of increased build rates by using a top-hat profile. When processing steel, Schleifenbaum et al. [15] achieve build rates of 5 mm3/s with powder layer thicknesses of 100 µm and build rates of 20 mm3/s with powder layer thicknesses of 400 µm and relative densities of more than 99%.
In laser deep-penetration welding, the use of ring-shaped beam profiles in combination with centric top-hat or Gaussian profiles to increase process stabilization and reduce spatter formation is already established and commercially available [17,18,19].
All the presented prior research shows the existing potential of ring-shaped beam profiles in powder bed fusion. The alternative beam shapes usually have a larger spot size and produce larger melt pools, resulting in reduced resolution [15]. New programmable laser systems are now available that can be switched on the fly between Gaussian and ring-shaped beam profiles with different intensity distributions [20]. Thus, potential high resolutions can be combined with high productivities in the PBF-LB/M process. Systematic investigations with the possible beam profiles have not yet been published. Therefore, this paper presents a study of the potential of three alternative ring-shaped beam profiles to increase the process robustness and productivity in PBF-LB/M of AISI 316L compared to a state-of-the-art Gaussian beam profile.
2. Materials and Methods
2.1. Feedstock Material
AISI 316L substrates are used for the experiments. This alloy is well-established in additive manufacturing using stainless steel. The substrate plates (see Figure 1) are laser cut from a cold-rolled sheet. To ensure reproducible surface properties, the substrates are sandblasted with corundum, resulting in a matte, rough surface (Sa ≈ 3 µm, Sz ≈ 42 µm).
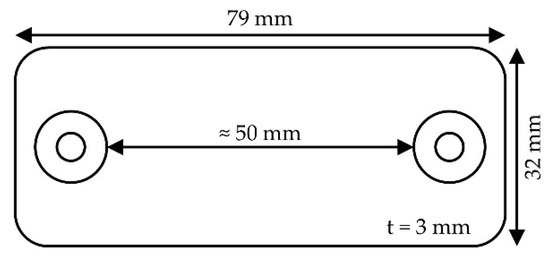
Figure 1.
Schematic substrate plates laser cut from cold-rolled 3 mm sheet.
The experiments are carried out without powder. He et al. [21] show that experiments without powder are transferable to PBF-LB/M. Adding powder leads to a small shift of the process window due to a slightly more pronounced balling tendency [21].
2.2. Job Design
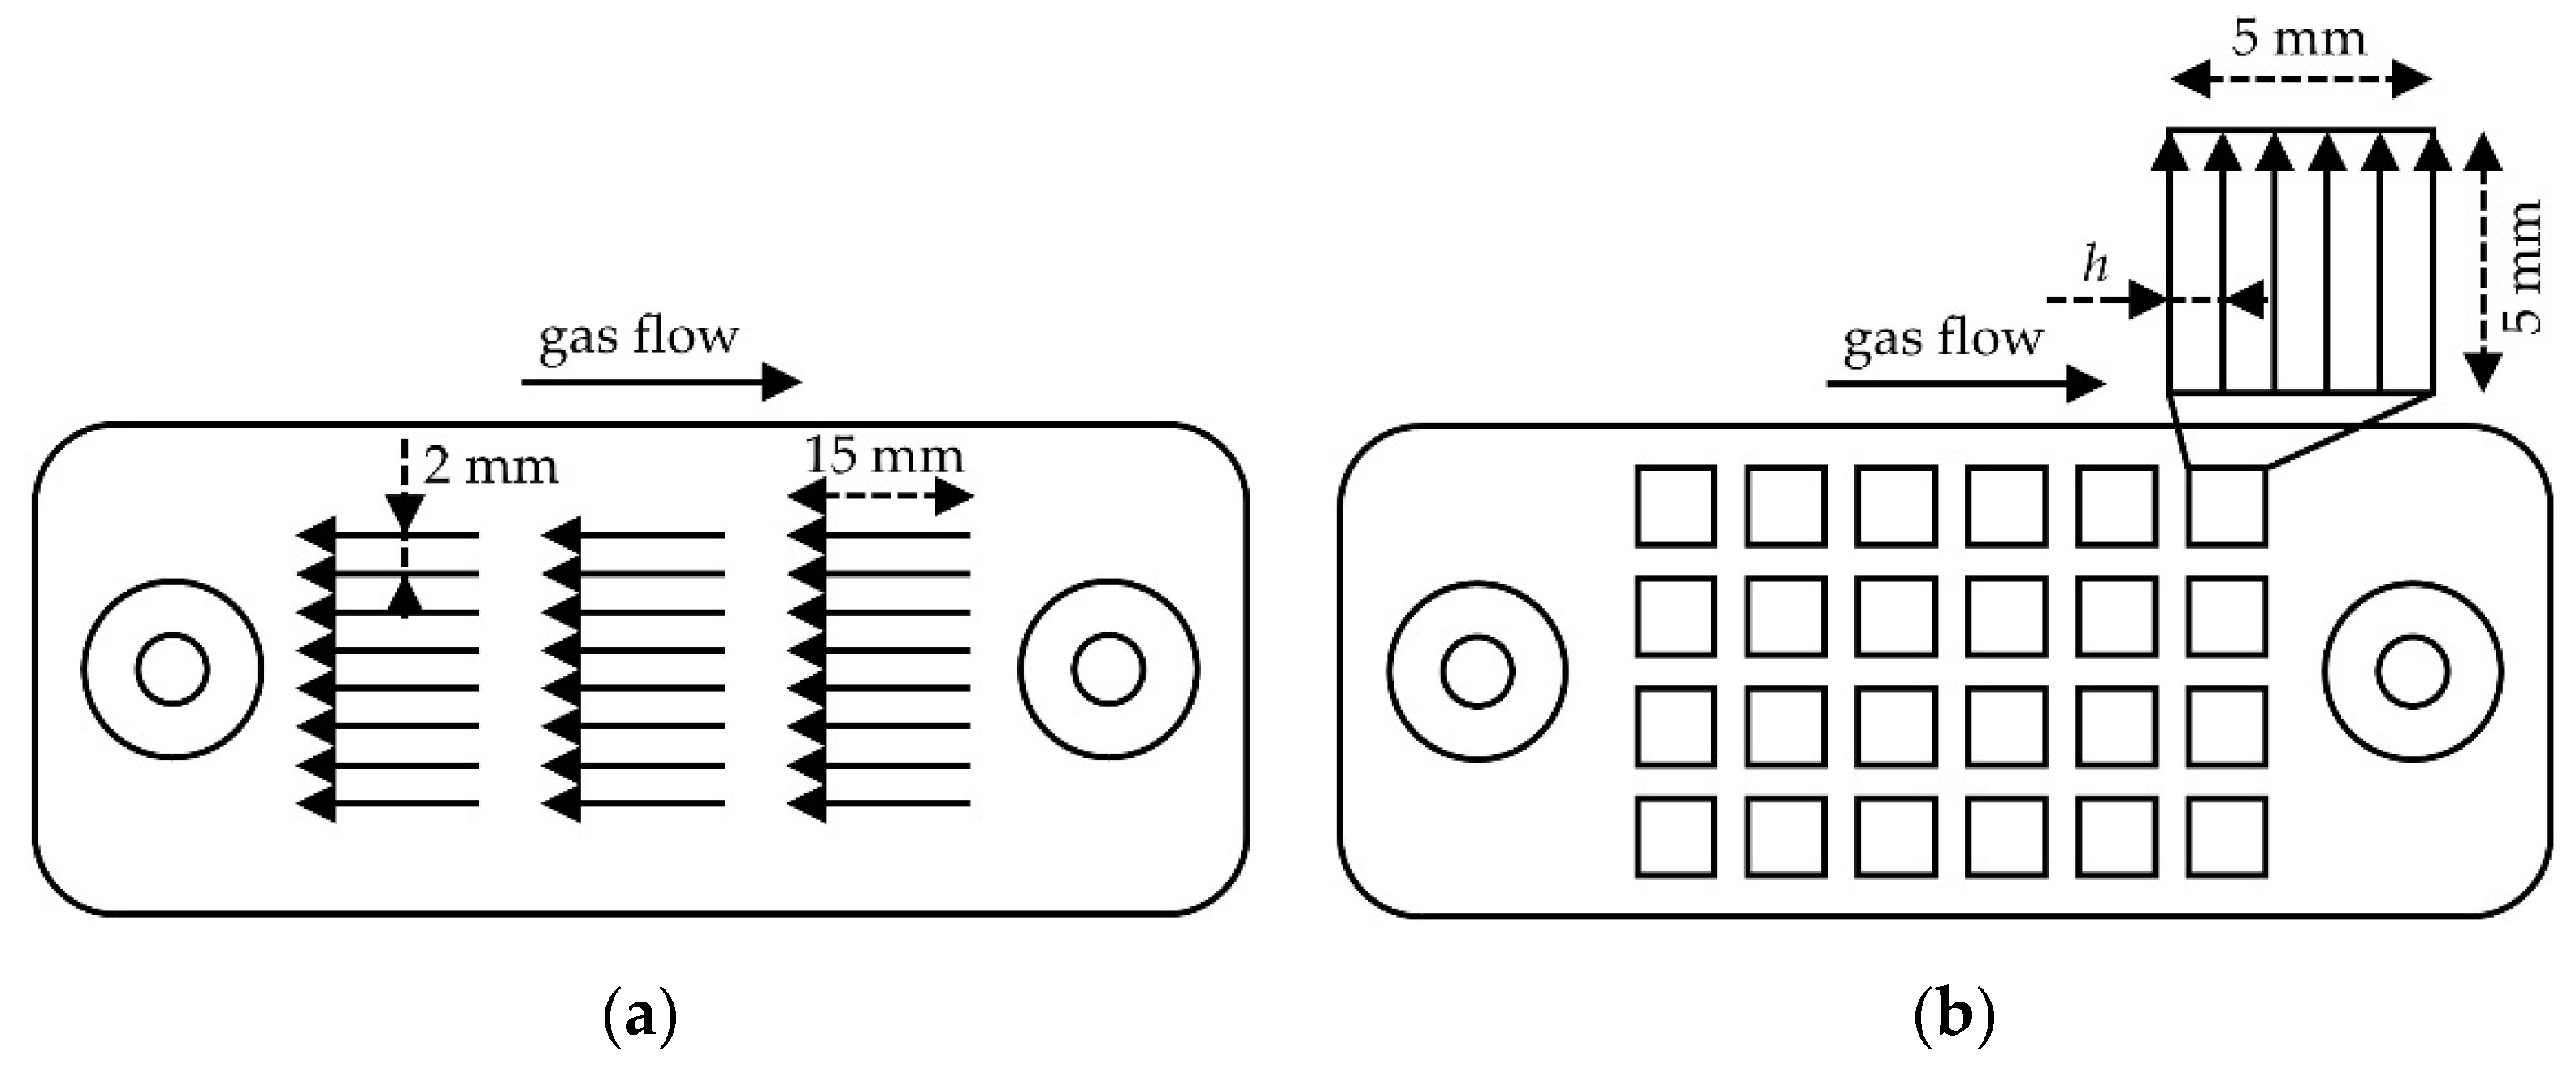
Single tracks and multi-track segments are exposed to analyze the shape and dimensions of the weld tracks with different parameter sets. The design and orientation of the tracks and segments on the substrate are shown in Figure 2. The single tracks had a length of 15 mm. The segments were manufactured with an edge length of 5 mm and different hatch distances h. To avoid the interaction of laser radiation with process emissions, the single tracks are exposed in the opposite direction to the shielding gas flow. When exposing the multi-track segments, the tracks are scanned perpendicularly to the shielding gas flow and one after the other in the opposite direction to the shielding gas flow.
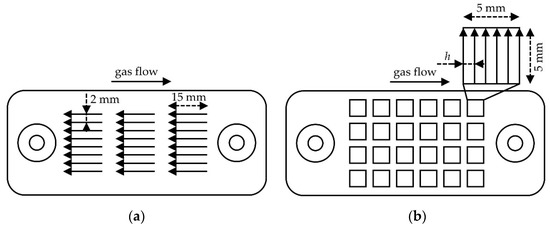
Figure 2.
Schematic design of single tracks (a) and multi-track segments (b).
2.3. Experimental System
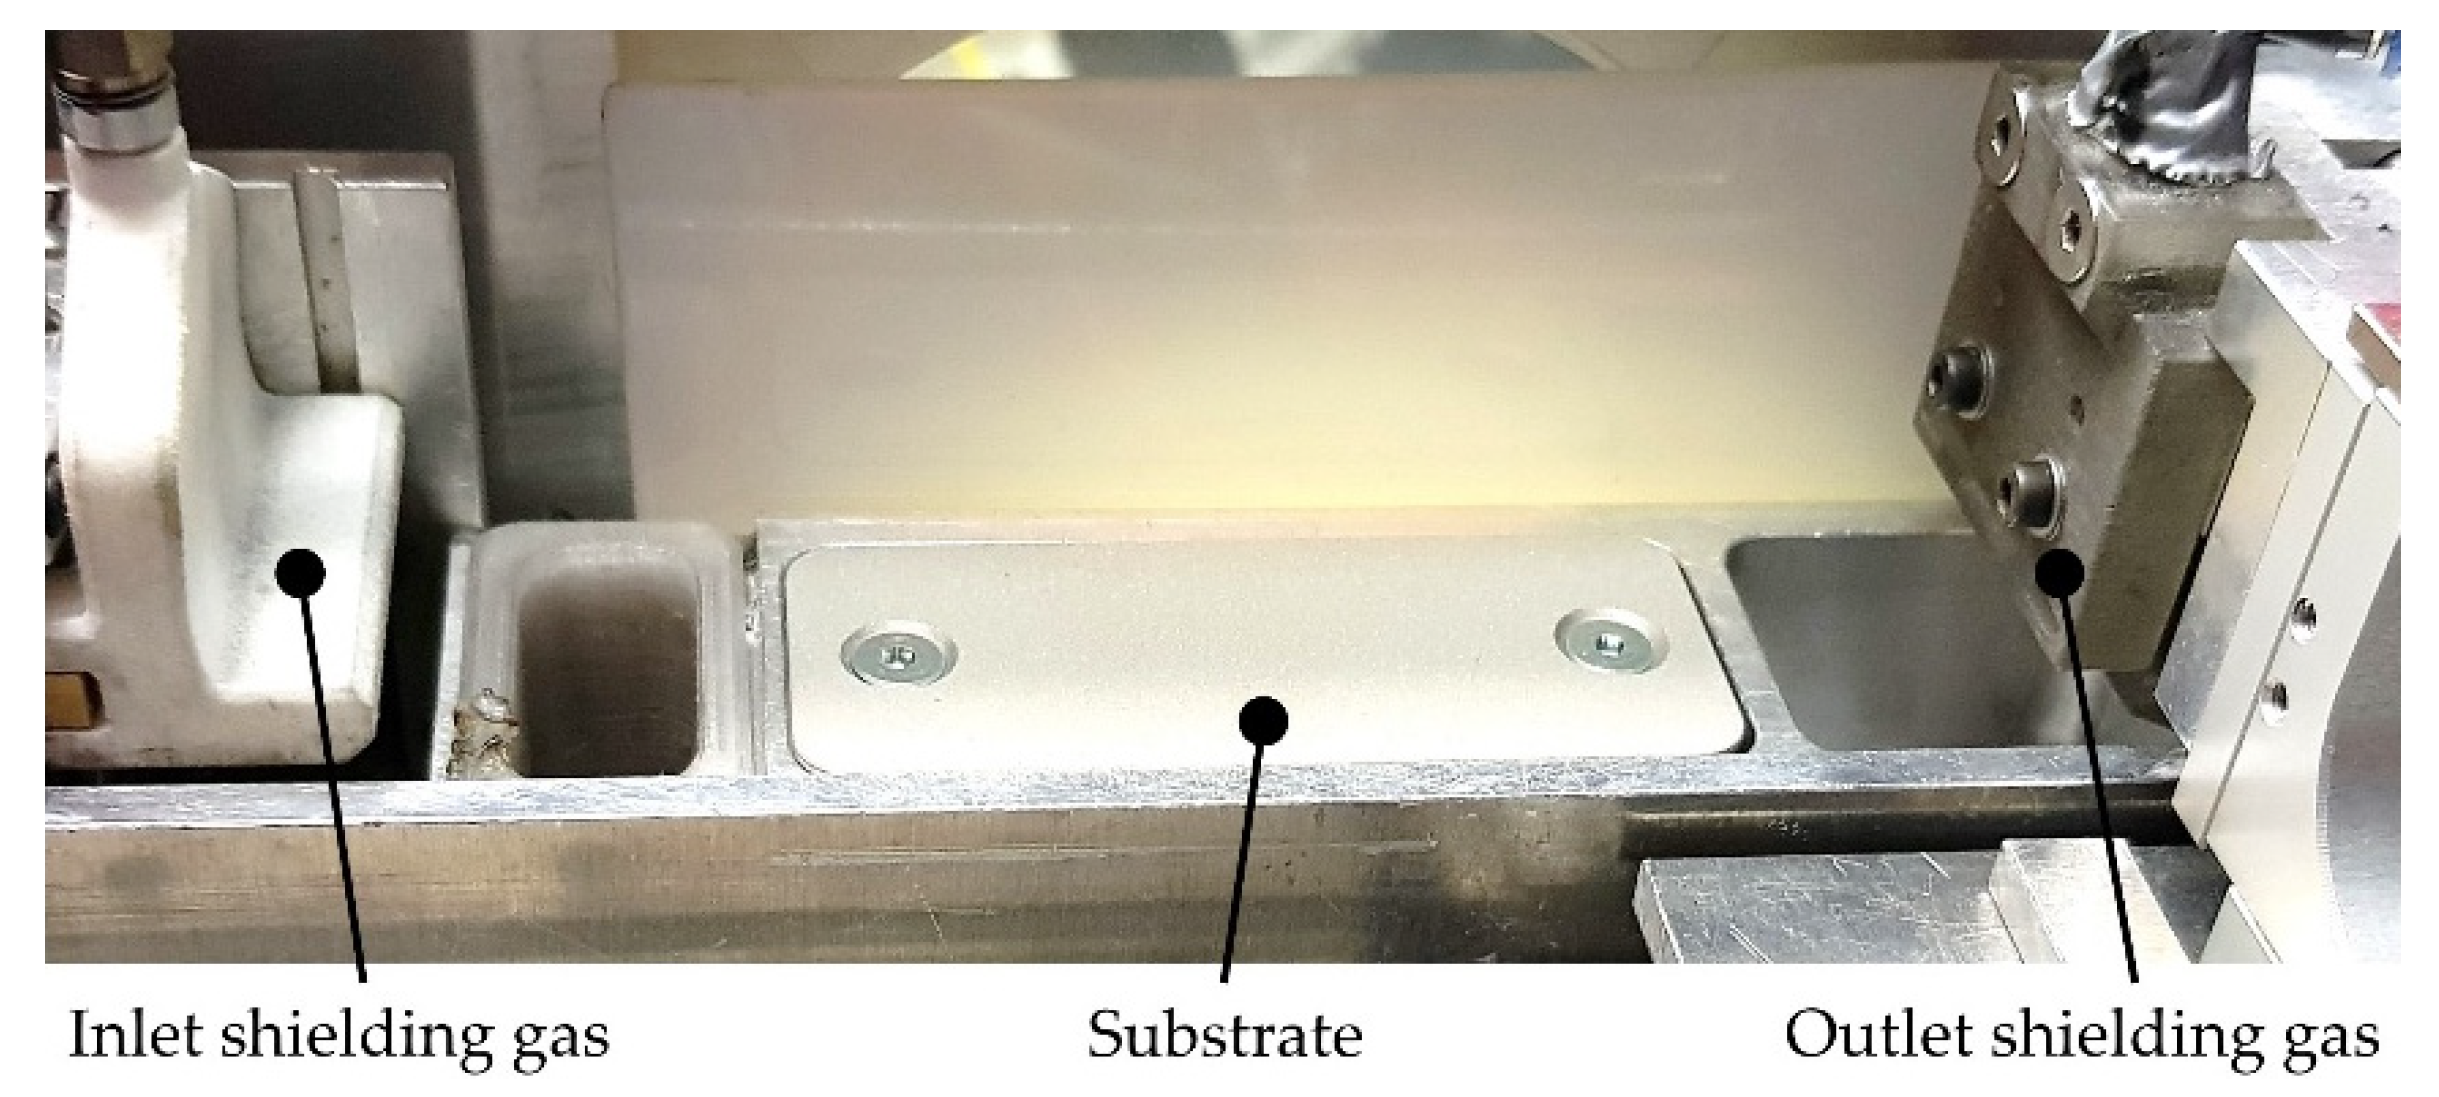
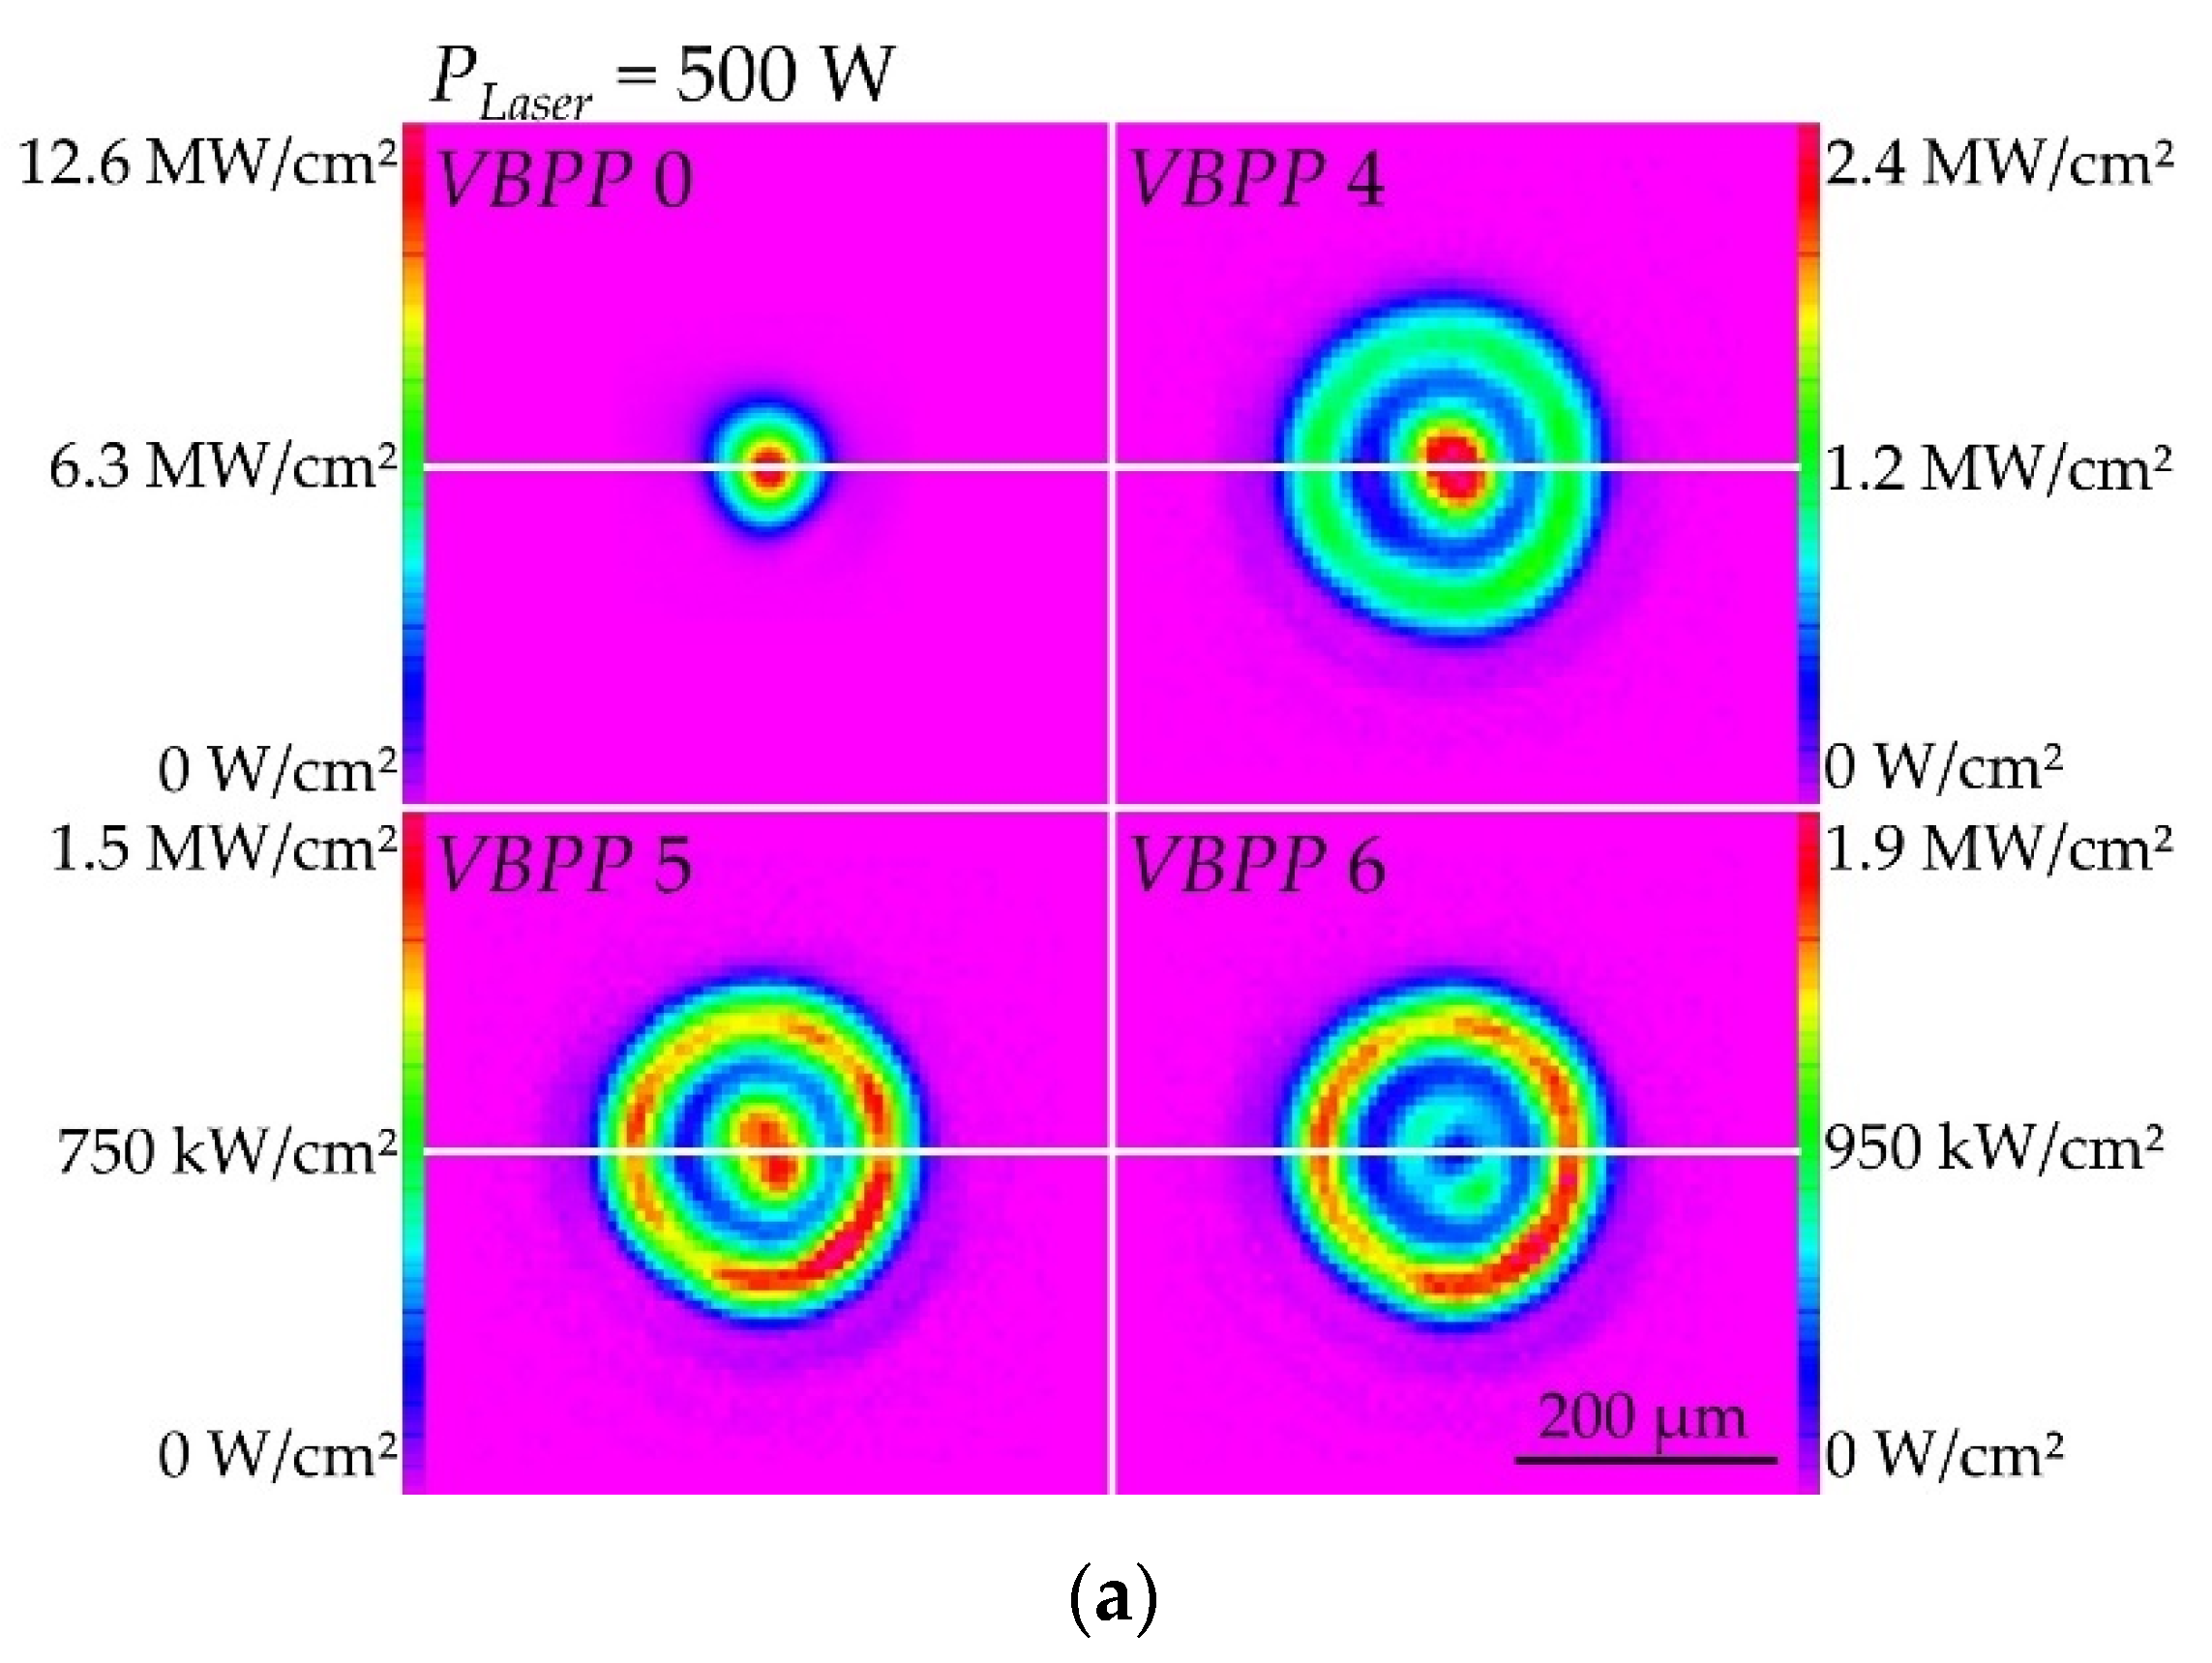
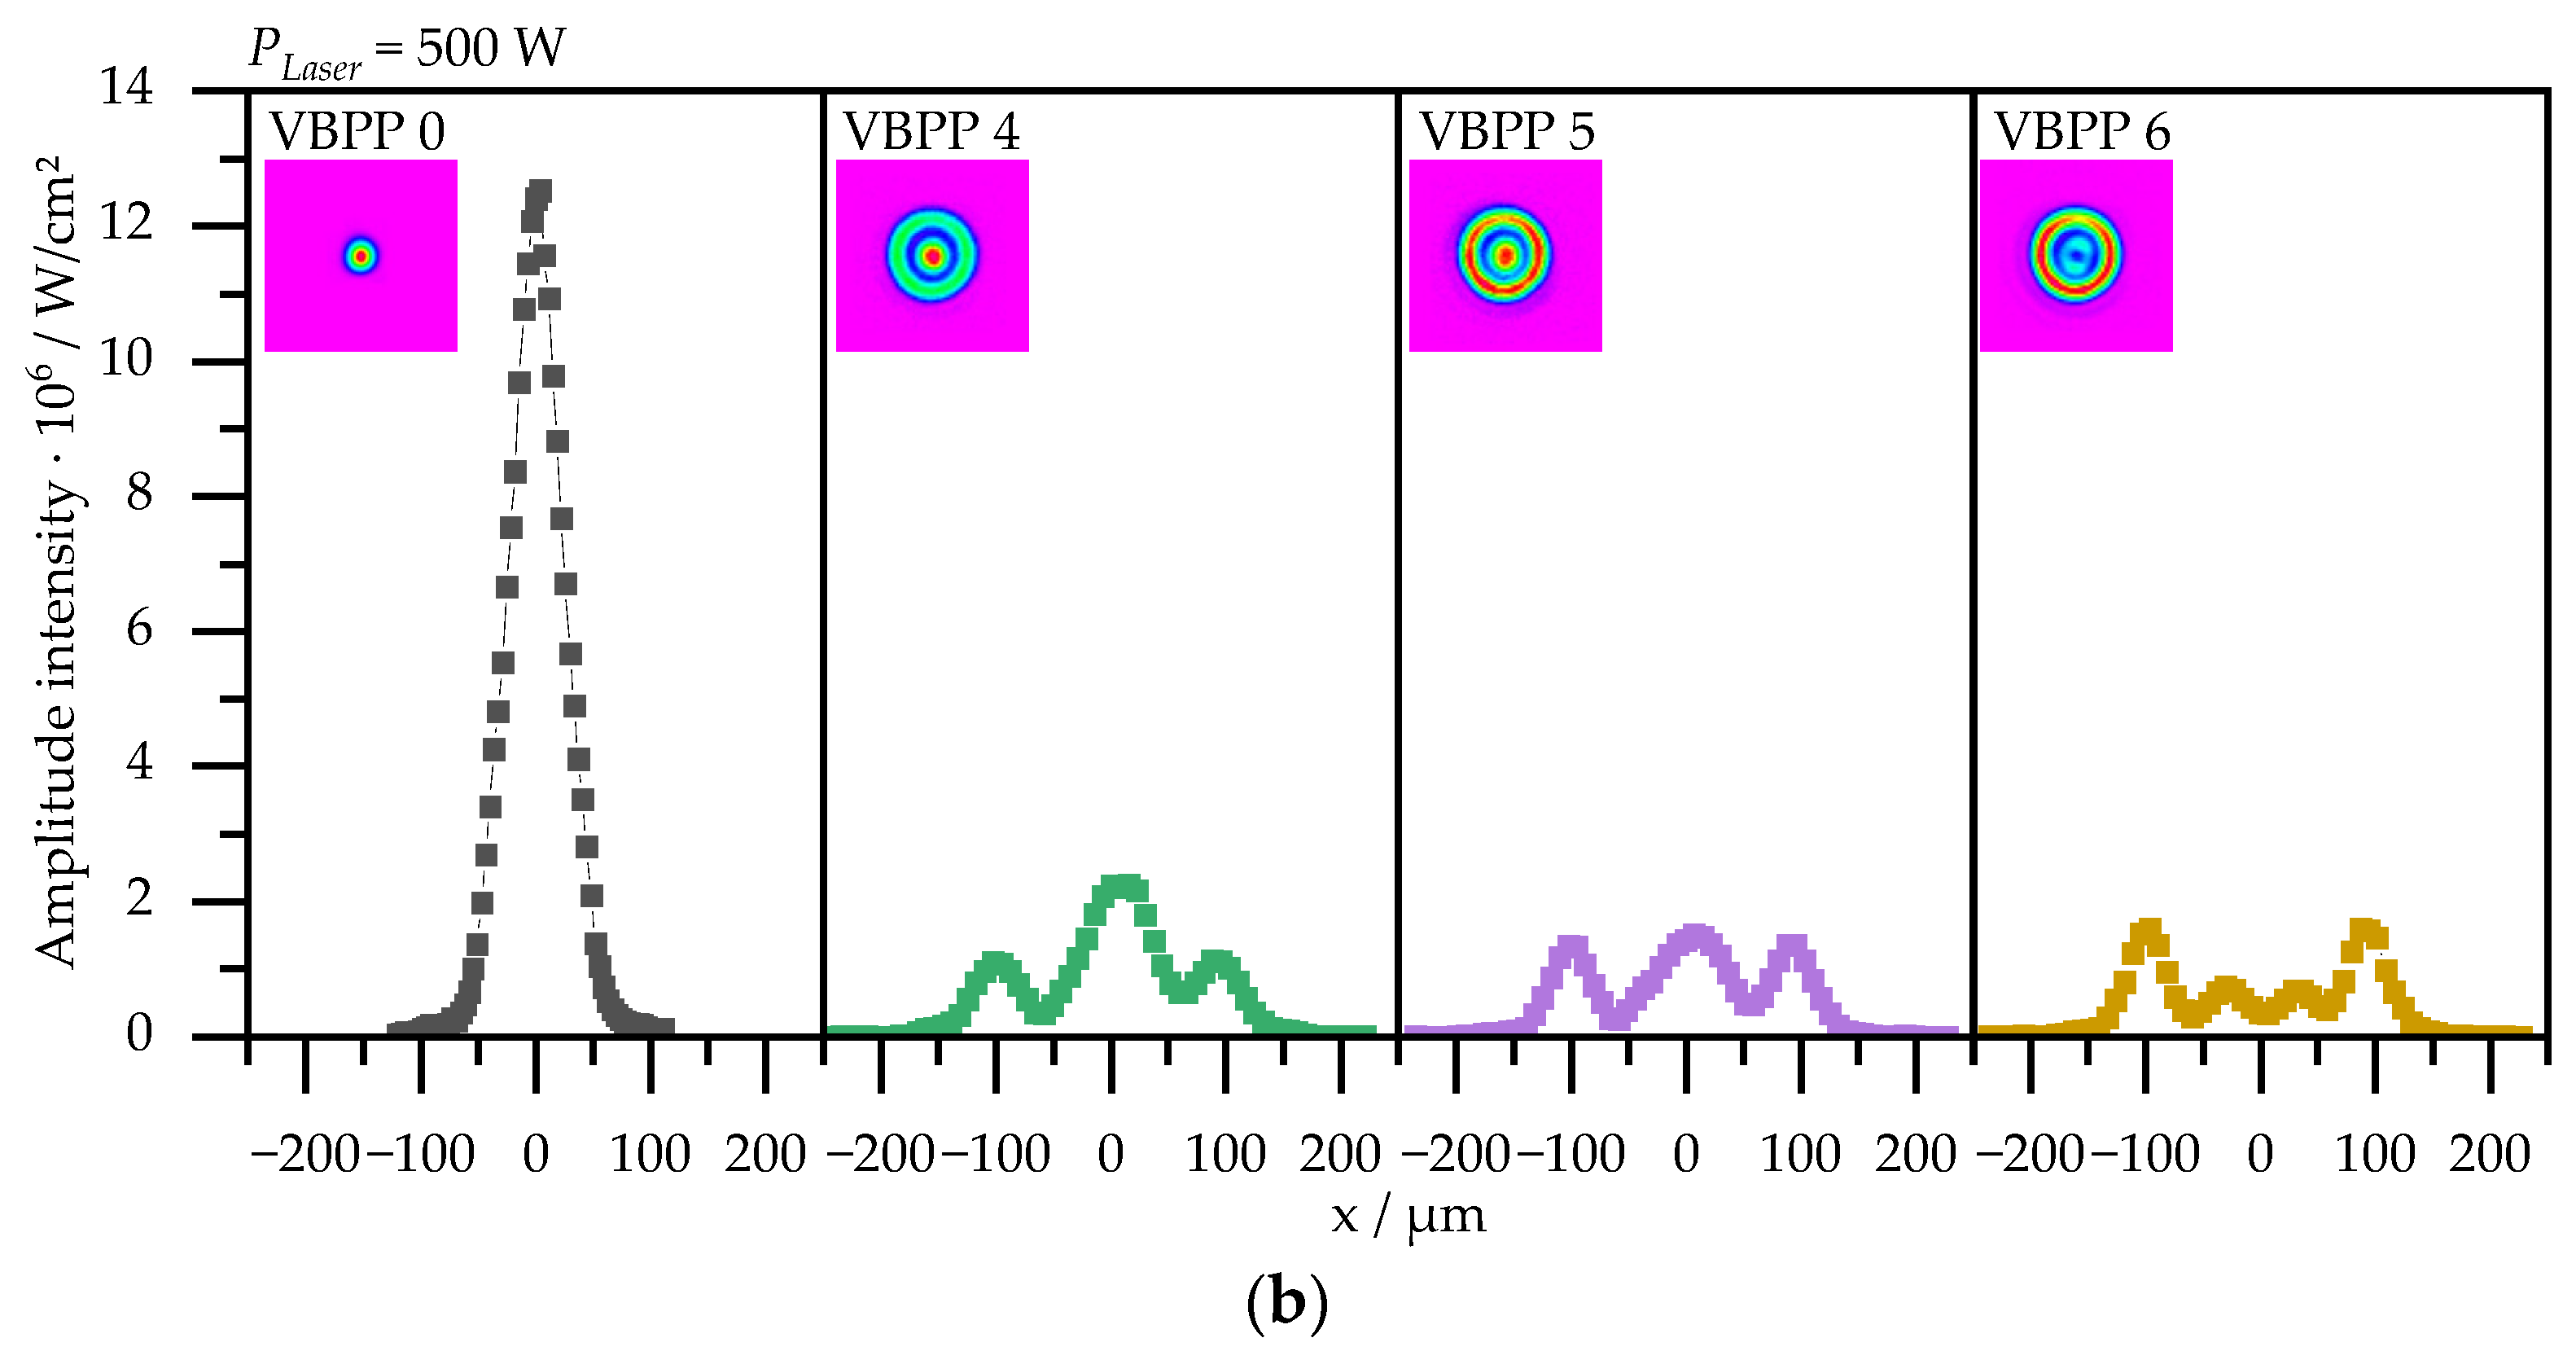
The experiments are carried out on an in-house developed test rig and process chamber (shown in Figure 3). The chamber was flooded with argon to a residual oxygen content of 0.2%. Argon flows over the substrate plate at a volume flow rate of 18 l/min. An AFX-1000 (nLIGHT Inc., Vancouver WA, USA) with seven switchable beam profiles is utilized as the beam source. The switchable beam profiles are termed as “Variable Beam Parameter Product (VBPP)”. The applied beam profiles are shown in Figure 4 as 2D distributions in (a) and as cross-sections in (b). As shown in Figure 4, the ring-shaped beam profiles differ in power ratio between the central peak and the surrounding ring. Collimation is performed using a 60 mm collimator with an aperture (nLIGHT Inc., Vancouver WA, USA). The beam deflection was realized with an Elephant 50 (ARGES GmbH, Wackersdorf, Germany) scan system. The resulting beam diameters and power ratios of the central peak and surrounded ring of the used beam profiles are listed in Table 1.

Figure 3.
Photo of the process zone inside the process chamber.


Figure 4.
Intensity distributions of the beam profiles used at PLaser = 500 W as 2D distributions (a) and cross-sections (b).

Table 1.
Power distribution according to manufacturer adapted from [22] and beam diameter at PLaser = 500 W calculated using the 2nd moment method according to [23] for used beam profiles.
2.4. Process Parameters
The process parameter sets for the single-track and multi-track experiments with the different beam profiles are summarized in Table 2 and Table 3. An overview of all used parameters, symbols and abbreviations is listed in Appendix A. The laser power PLaser, the scanning speed vscan, and the hatch distance h are varied for the different beam profiles. A delay time of 2 s between the single tracks and 1 min between the various multi-track segments is implemented to avoid beam-fume interactions. The individual tracks of a segment are manufactured one immediately after the other to create realistic process environments.
Table 2.
Summarized process parameter sets of the single tracks.
Table 3.
Summarized process parameter sets of the multi-track segments.
The single-track experiments (Table 2) are carried out to detect suitable process windows and hatch distances for the multi-track segments. A total of 120 parameter sets are studied. Only one track per parameter set is generated and analyzed in two cross-sections of the track. For this reason, no standard deviations are listed in the evaluations of the single-track experiments. The mean values shown result from the evaluated cross-sections of one track. The multi-track segments (Table 3) are statistically validated. For each parameter set, three segments are exposed with 5 weld tracks analyzed in the center of each segment. The mean value and standard deviation are calculated from the 15 tracks analyzed per parameter set. In total, 192 parameter sets are tested with 3 repetitions each.
2.5. Component Properties
In order to investigate the influence of the various parameters on the welding result, the cross-sectional geometries of the generated weld tracks are analyzed. In addition, the roughness of the multi-track segments is evaluated.
2.5.1. Cross-Sectional Geometries
To enable the analysis of the weld track geometries, cross-sectional micrographs are prepared. For this purpose, the specimens are cut centrally and embedded in a transparent epoxy. Afterwards, the specimens are wet ground in three stages using silicon carbide paper (grit 180, 360 and 1200) and polished in two stages using polishing pastes (3 µm and 1 µm). Finally, the specimens are etched with an Adler etchant. The cross-sections of the weld tracks are documented using an optical microscope. Based on the microscope images, the weld width ww, welding penetration depth δw, and the molten cross-sectional area Am are determined. A schematic illustration of the process and the resulting measured values is shown in Figure 5. In addition, it is qualitatively determined whether balling effects occur. Depending on the weld track geometries, the specimens are classified into one or more of the following categories adapted from [8,21] (see Figure 6):
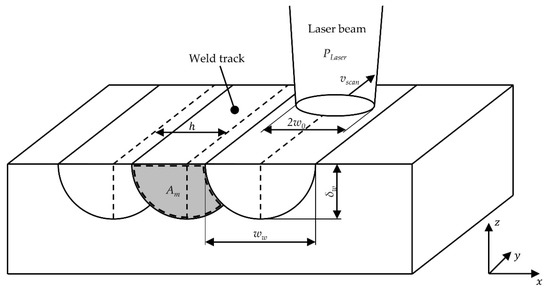
Figure 5.
Schematic illustration of the process and the resulting measured values.
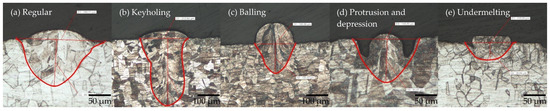
Figure 6.
Typical microscopy images and their classification into the different categories: (a) Regular, (b) Keyholing, (c) Balling, (d) Protusion and depression, and (e) Undermelting.
- Regular: The weld track topology is homogenous and smooth.
- Keyholing → A = δw/ww > 0.8: The aspect ratio of the welding penetration depth to width of the weld track is greater than 0.8 [24]. Increased energy input can cause a vapor capillary (“keyhole”) to form in the melt pool, which causes the high aspect ratios.
- Balling: The weld track is characterized by an irregular shaped weld track, with single melt “balls” along the track [25,26]. Plateau–Rayleigh instability causes very long melt pools to break up and individual melt spheres to form [26,27].
- Protrusion and depression: The topology of the corresponding weld tracks is characterized by protrusions in the center and depressions on the sides of the weld tracks. This weld track shape is created by long melt pools with increased backward flow of the molten material due to the Marangoni effect and recoil pressure [28]. Plateau–Rayleigh instability [25,27] causes the melt pool to form a protrusion that solidifies before it can break into individual melt balls.
- Undermelting → δw < 40 µm: The welding penetration depth is less than the powder layer thickness (40 μm in this study). In such weld tracks, the energy applied is usually too low.
2.5.2. Roughness Measurement
A 3D profilometer (Keyence VR-3100, Ōsaka, Japan) is used to measure the roughness of the multi-track segments via fringe projection. The optical measurement enables a local description of the whole topography and thus the evaluation of the associated roughness values Si [29]. In this study, the areal arithmetic average roughness Sa (according to DIN EN ISO 25178-2 [30]) is used for roughness determination.
3. Results and Discussion
3.1. Influence of Laser Power and Scanning Speed on Melt Pool Geometry for Single Tracks
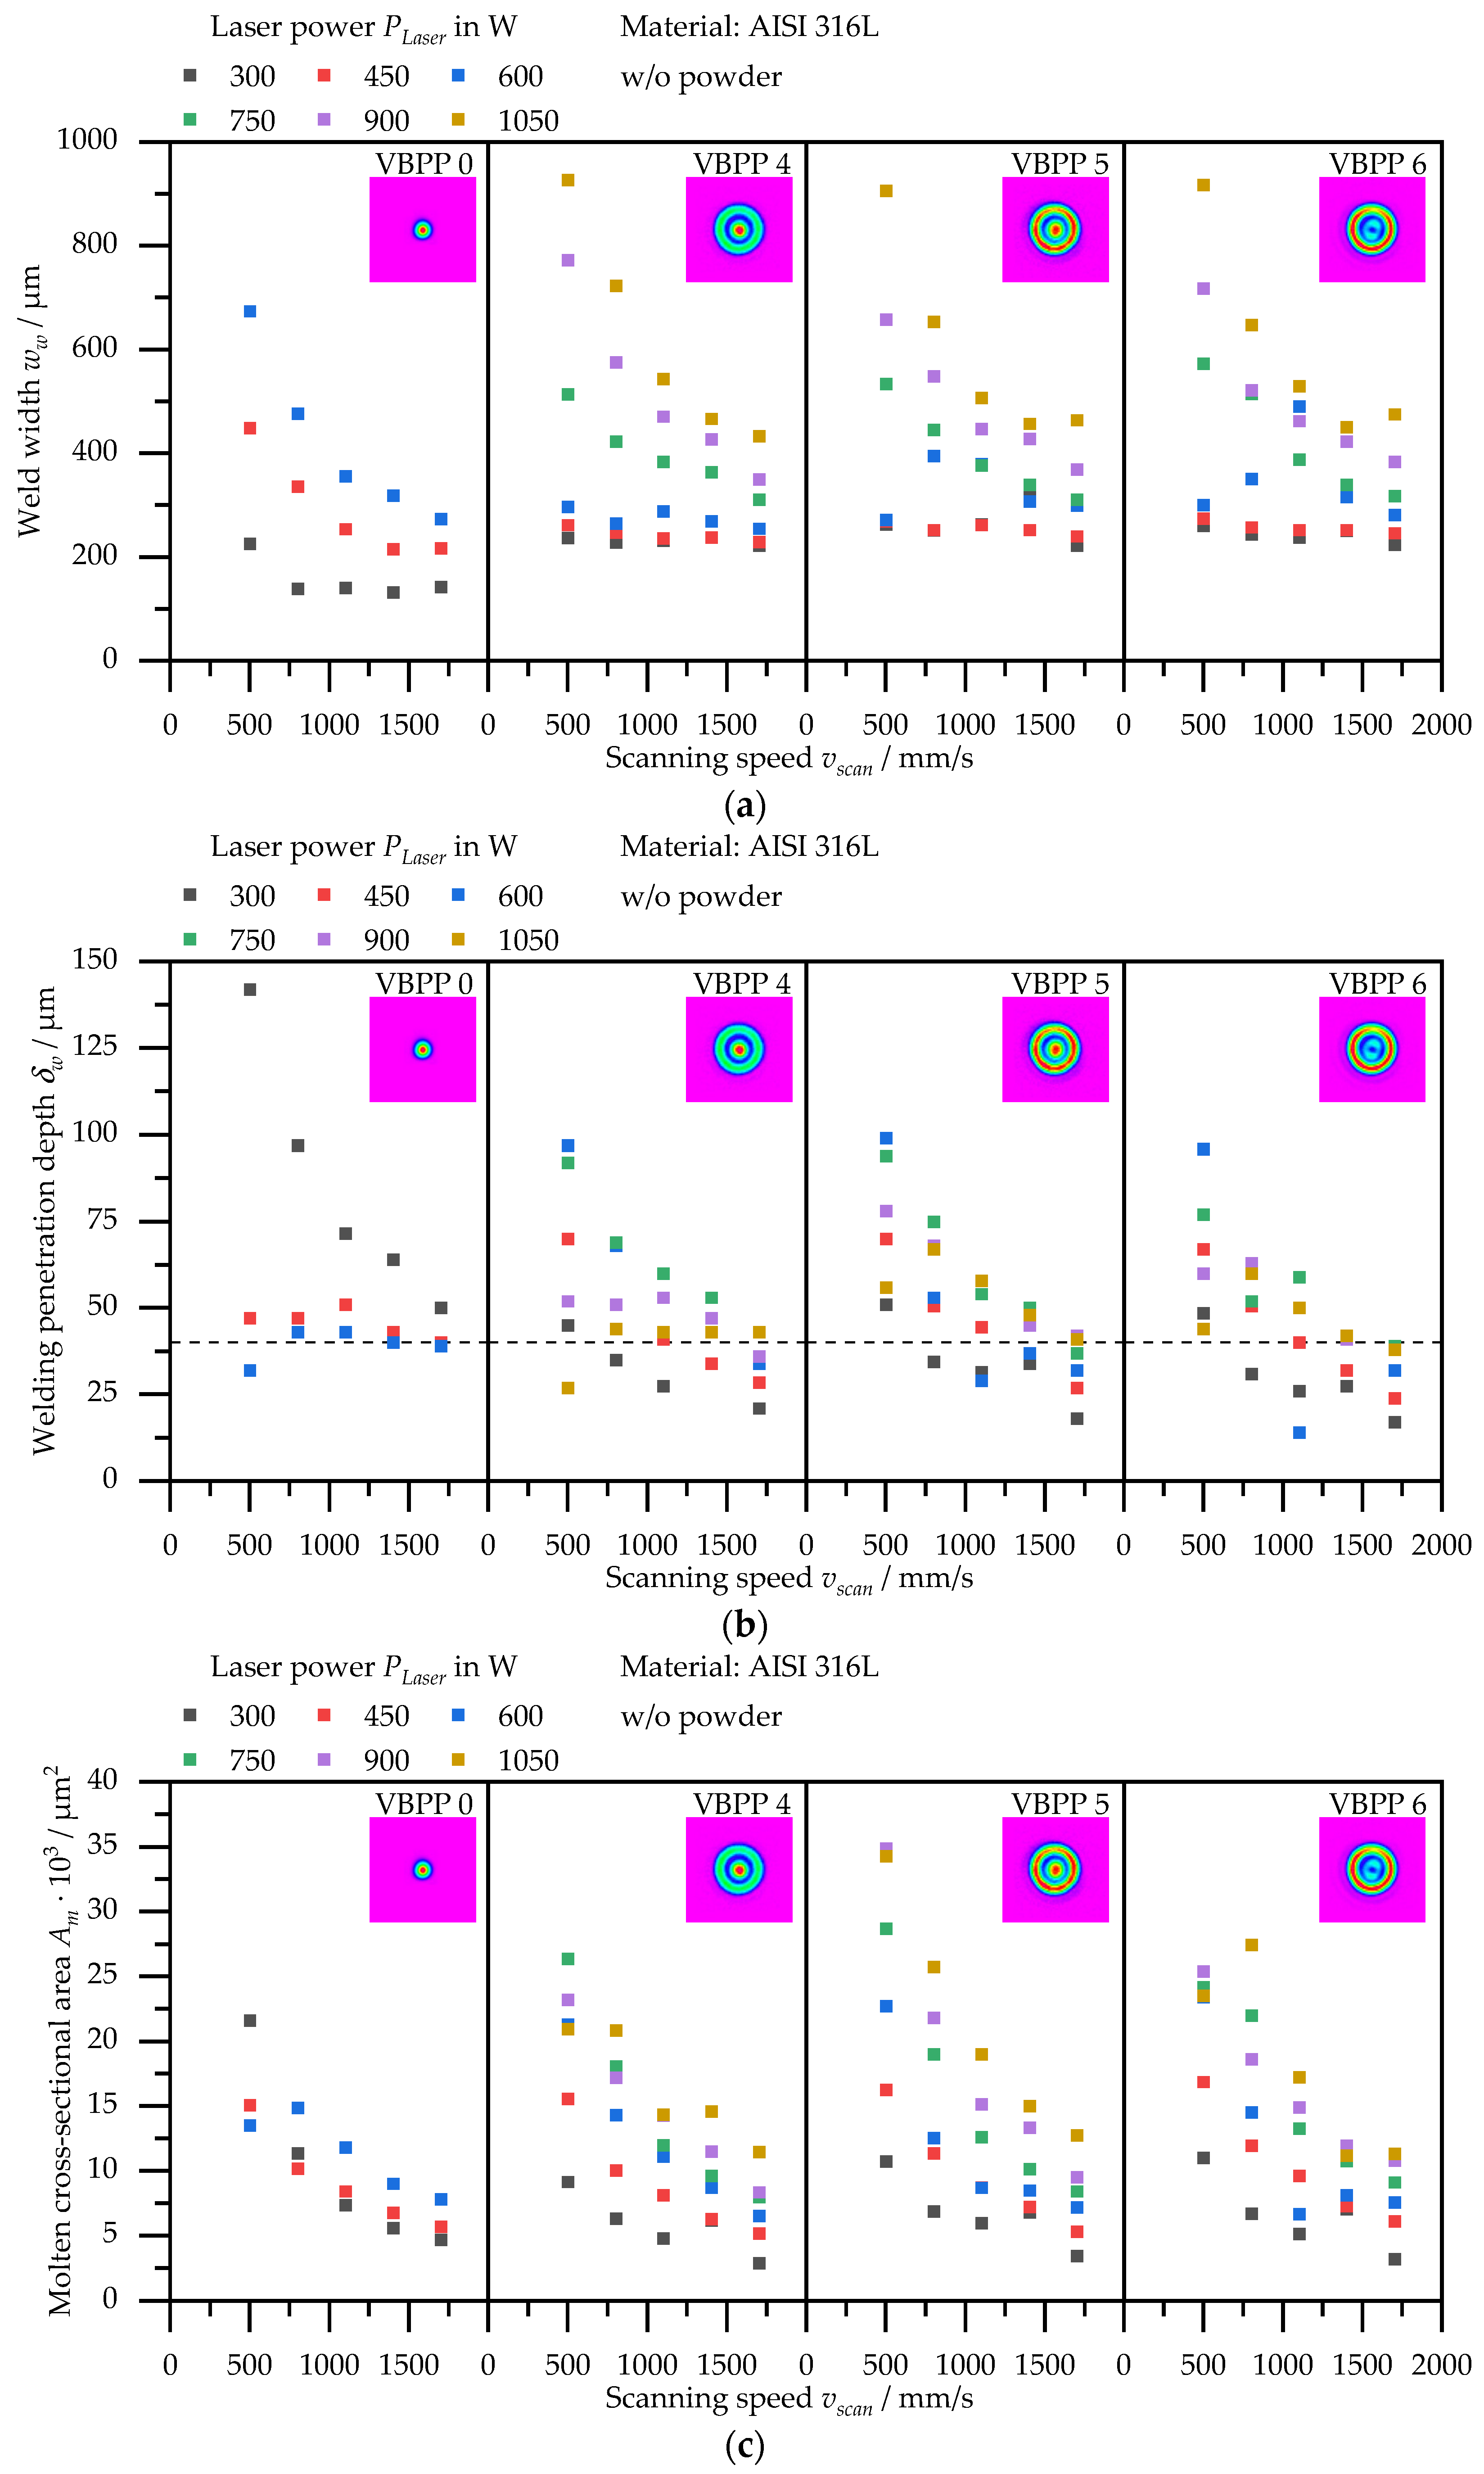
The single-track experiments aim at detecting process windows for the different beam profiles. This is based on the categorization of the weld tracks described in Section 2.4. The categories “Regular” and “Protrusion and depression” are considered as functional processes, because continuous weld tracks with suitable weld penetration depths are produced. “Protrusion and depression” does not necessarily tend to an unstable process and thus to component defects such as porosity. However, if the protrusion and depression are very distinct, weld tracks in this category can also lead to non-qualification of the corresponding parameter set in subsequent investigations. In addition to the detection of the process windows, values for suitable hatch distances of the multi-track segments are detected via the weld width of the single tracks, and the degree of laser energy coupling for the different beam profiles is compared. Figure 7 shows the weld widths ww in (a), welding penetration depths δw in (b), and molten cross-sectional area Am in (c) measured on the cross-sections of the welds. To prevent the graphs from becoming overly complicated, only the power levels at 300, 450, and 600 W are shown for beam profile VBPP 0.
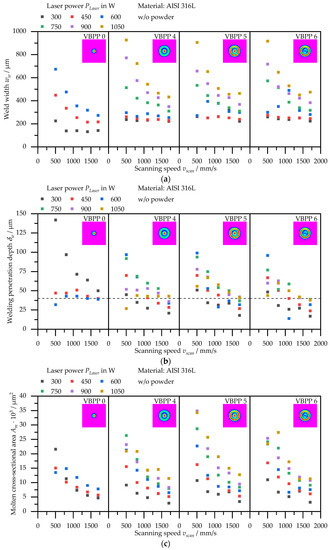
Figure 7.
Weld width ww (a), welding penetration depth δw (b), and molten cross-sectional area Am (c) of single tracks as a function of scanning speed vscan and laser power PLaser.
For all the investigated beam profiles, the weld width ww tends to decrease for increasing scanning speeds vscan and decreasing laser powers PLaser (see Figure 7a). By using a Gaussian beam profile (VBPP 0), the welding penetration depths δw decrease for increasing scanning speeds vscan and laser powers PLaser (Figure 7b). Due to the exposure with beam profiles VBPP 4, 5, and 6, the welding penetration depths δw decrease for increasing scan speeds vscan. For the laser power variances, the welding penetration depths δw increase up to around 600–750 W. With further increasing laser powers PLaser, the welding penetration depths δw tend to decrease. Likewise, molten cross-sectional areas Am tend to the weld width ww (see Figure 7c). With increasing scan speeds vscan and decreasing laser powers PLaser, the molten cross-sectional areas Am of the single tracks become smaller. At low scanning speeds (500 mm/s), the molten cross-sectional areas Am decrease for the very high laser powers (600 W at VBPP 0 and 1050 W at VBPP 4, 5, 6). The tendencies of the weld widths ww and the molten cross-sectional areas Am can be explained by the energy input of the laser, which can be estimated via the line energy El. The line energy is calculated from the laser power PLaser and the scanning speed vscan according to
Lower scanning speeds and/or higher laser powers result in higher line energies. In theory, the resulting higher energy input results in a larger melt pool, which can be expressed in larger weld widths ww, welding penetration depths δw, and larger molten cross-sectional areas Am. Where the weld widths ww and molten cross-sectional areas Am are concerned, this reasoning explains the measured values. However, the assumption could not be confirmed for the welding penetration depths. Up to a certain power/energy, the penetration depths increase. For laser powers higher than 300 W for the Gaussian beam profile and 750 W for the ring-shaped profiles, the penetration depth is reduced. Reasons for the low welding penetration depths could be laser–fume interactions. Interaction of the laser with the outflowing process emissions can widen the laser beam [31]. This results in an enlargement of the spot, which on the one hand creates wider melt pools and on the other hand leads to shallower welding penetration depth due to the reduced intensity. Another possible reason is thermal lensing. With thermal lenses, the focal length of the system changes as a function of laser power because the refractive index changes due to temperature gradients in the optical material [32]. In this way, at high laser powers, the focus usually shifts toward the scanning system. However, the focus position was found to be independent of power via burn-in tests. This rules out the thermal lens as a cause, and hence, the theory of laser–fume interactions as the cause of the reduced welding penetration depths seems most probable. As the measured values are not statistically validated, no valid statement can be made.
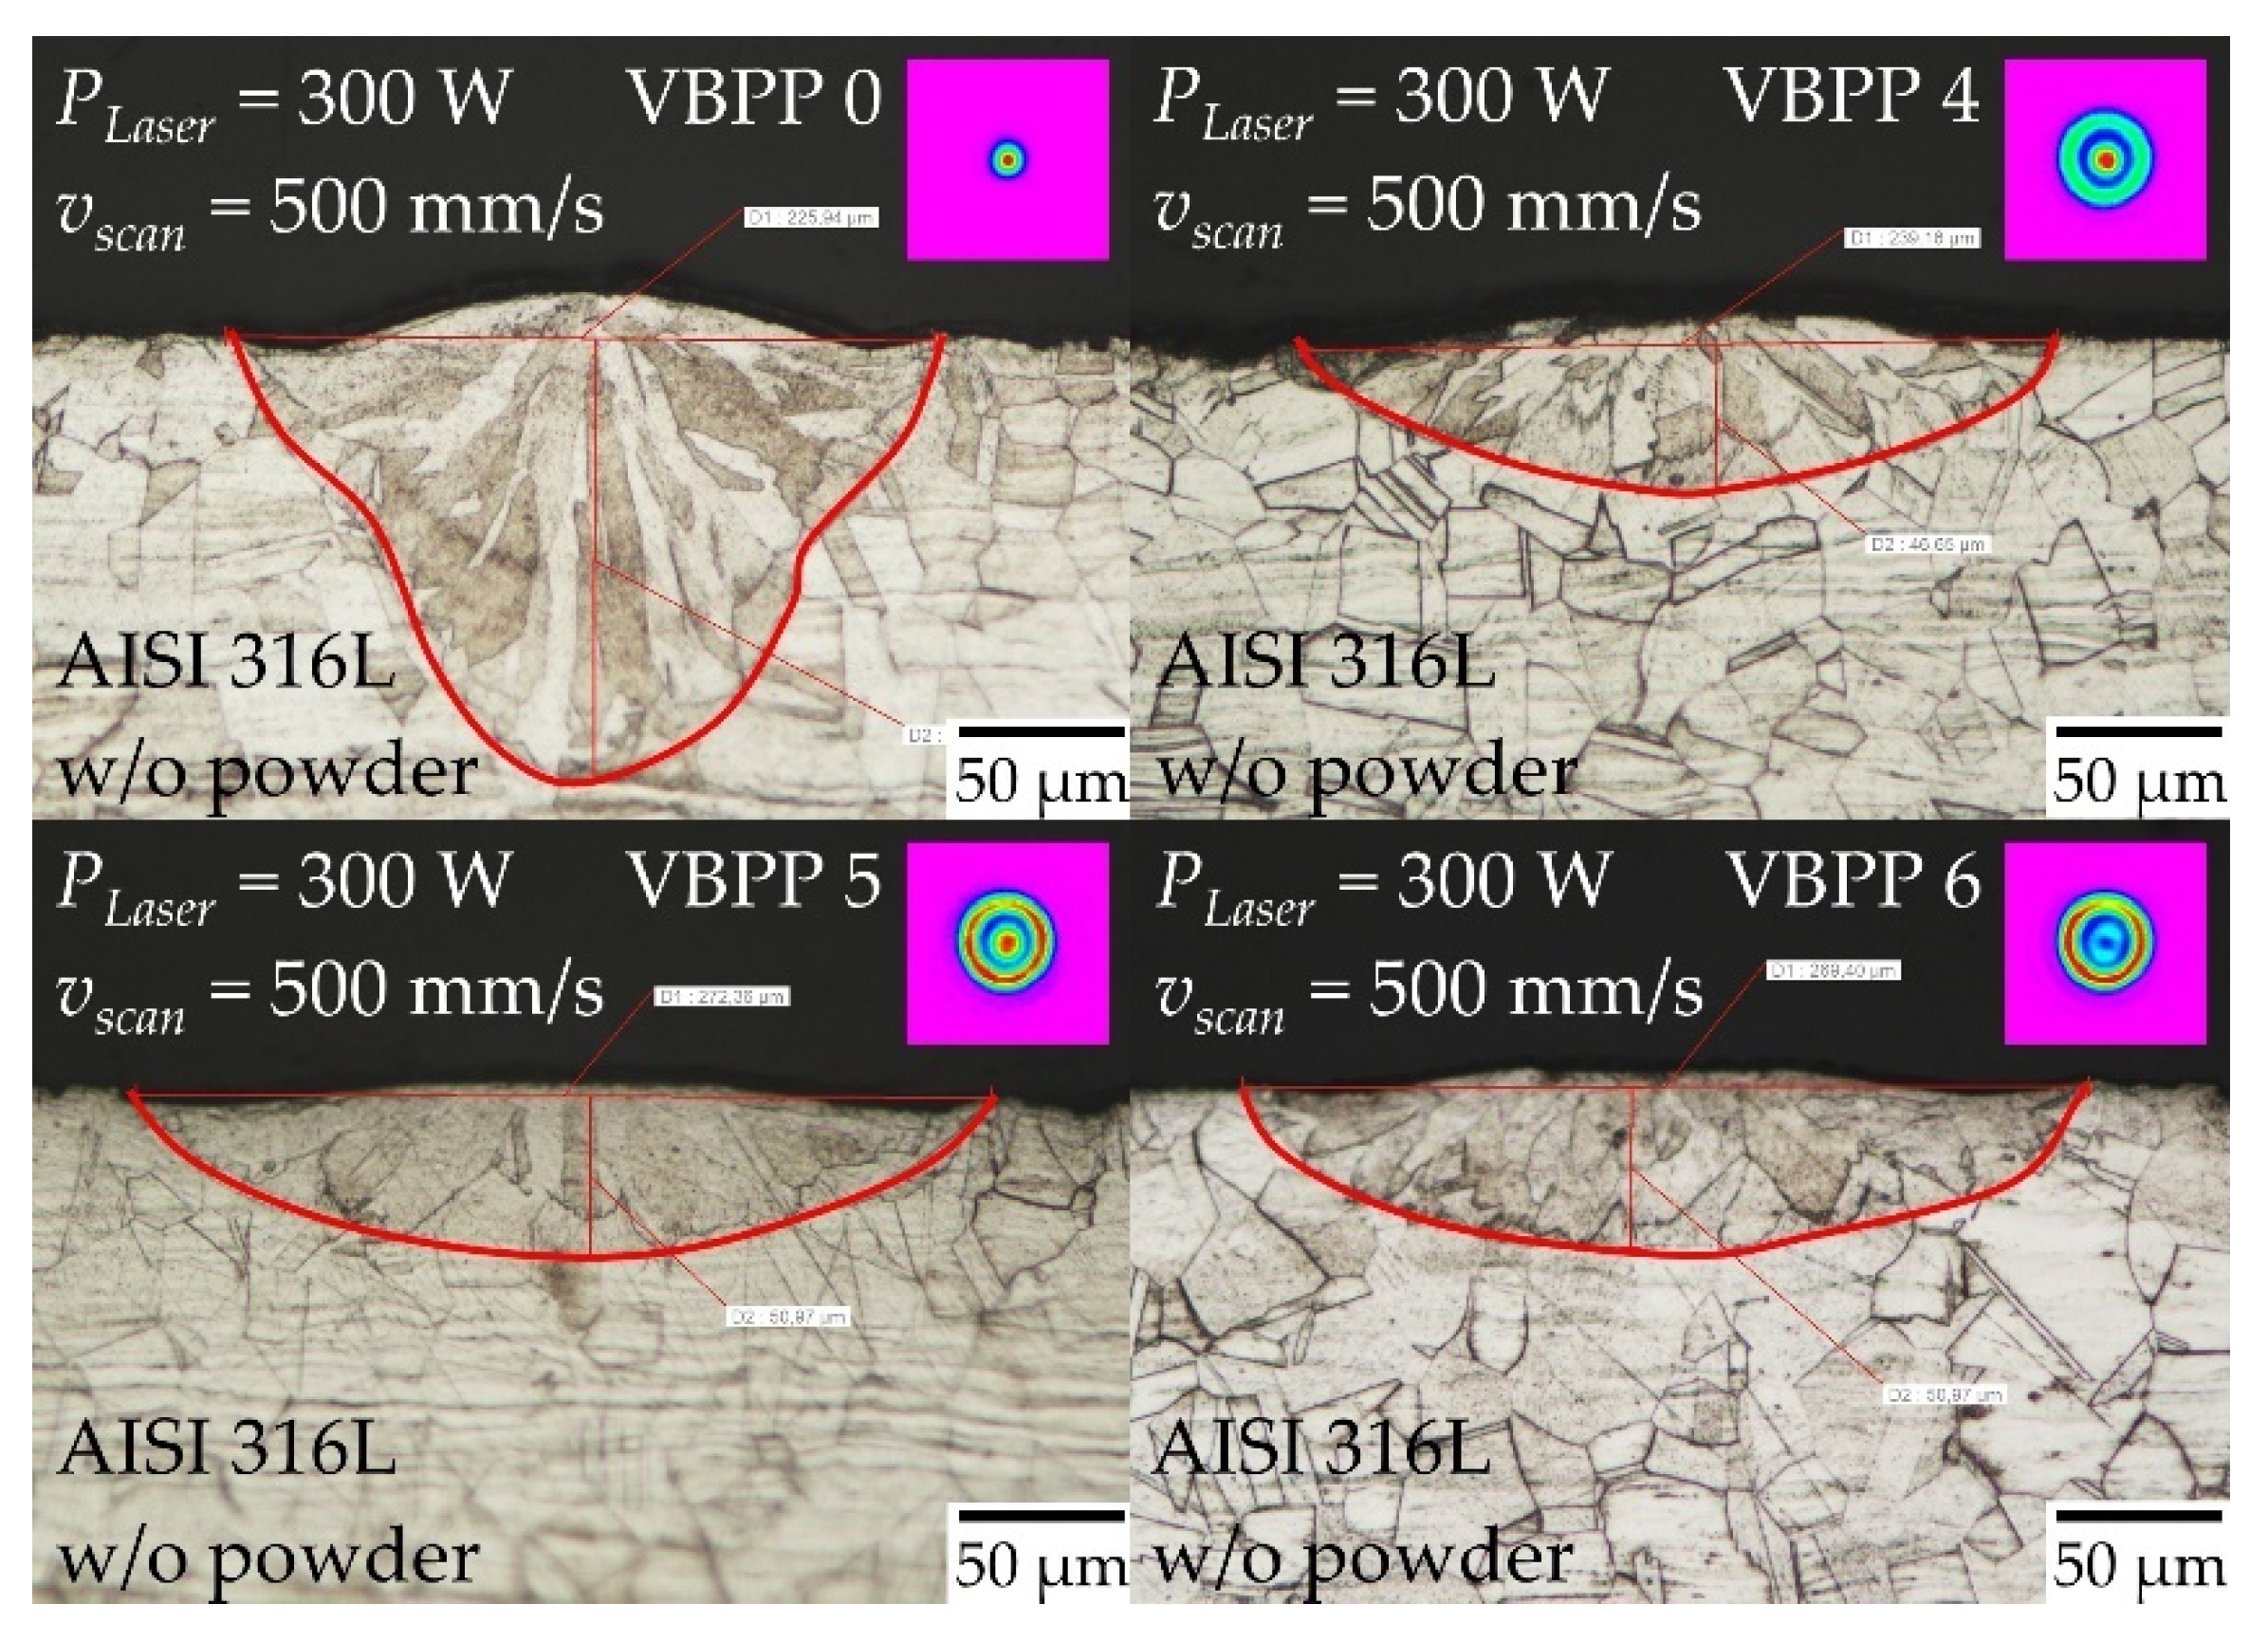
According to Wischeropp et al. [33], statements about the degree of energy coupling of the laser beam can be made by analyzing the molten cross-sectional areas of the weld tracks. The larger the cross-sectional area for a constant line energy, the higher the energy coupling [33]. Figure 8 shows the molten cross-sectional area Am as a function of the line energy. Since the cross-sectional areas are similar for all beam profiles, any influence of the beam shape on the energy coupling cannot be identified. Although the molten cross-sectional areas are in similar ranges at similar line energies, the weld track geometries can be quite diverse between the Gaussian and the ring-shaped beam profiles (see Figure 9).
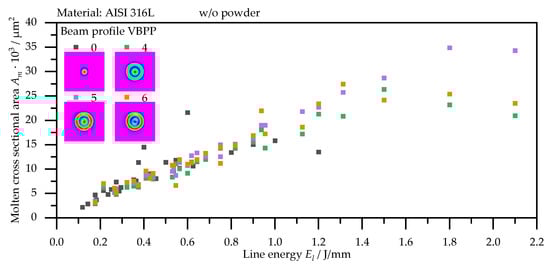
Figure 8.
Molten cross-sectional area Am of single tracks as a function of line energy El.
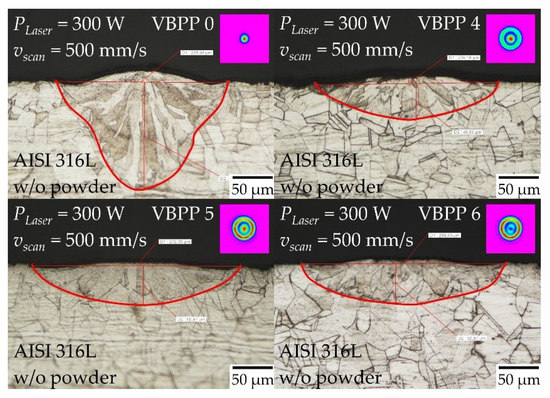
Figure 9.
Direct comparison of the weld track geometries at constant process parameters laser power PLaser = 300 W and scanning speed vscan = 500 mm/s with different beam profiles.
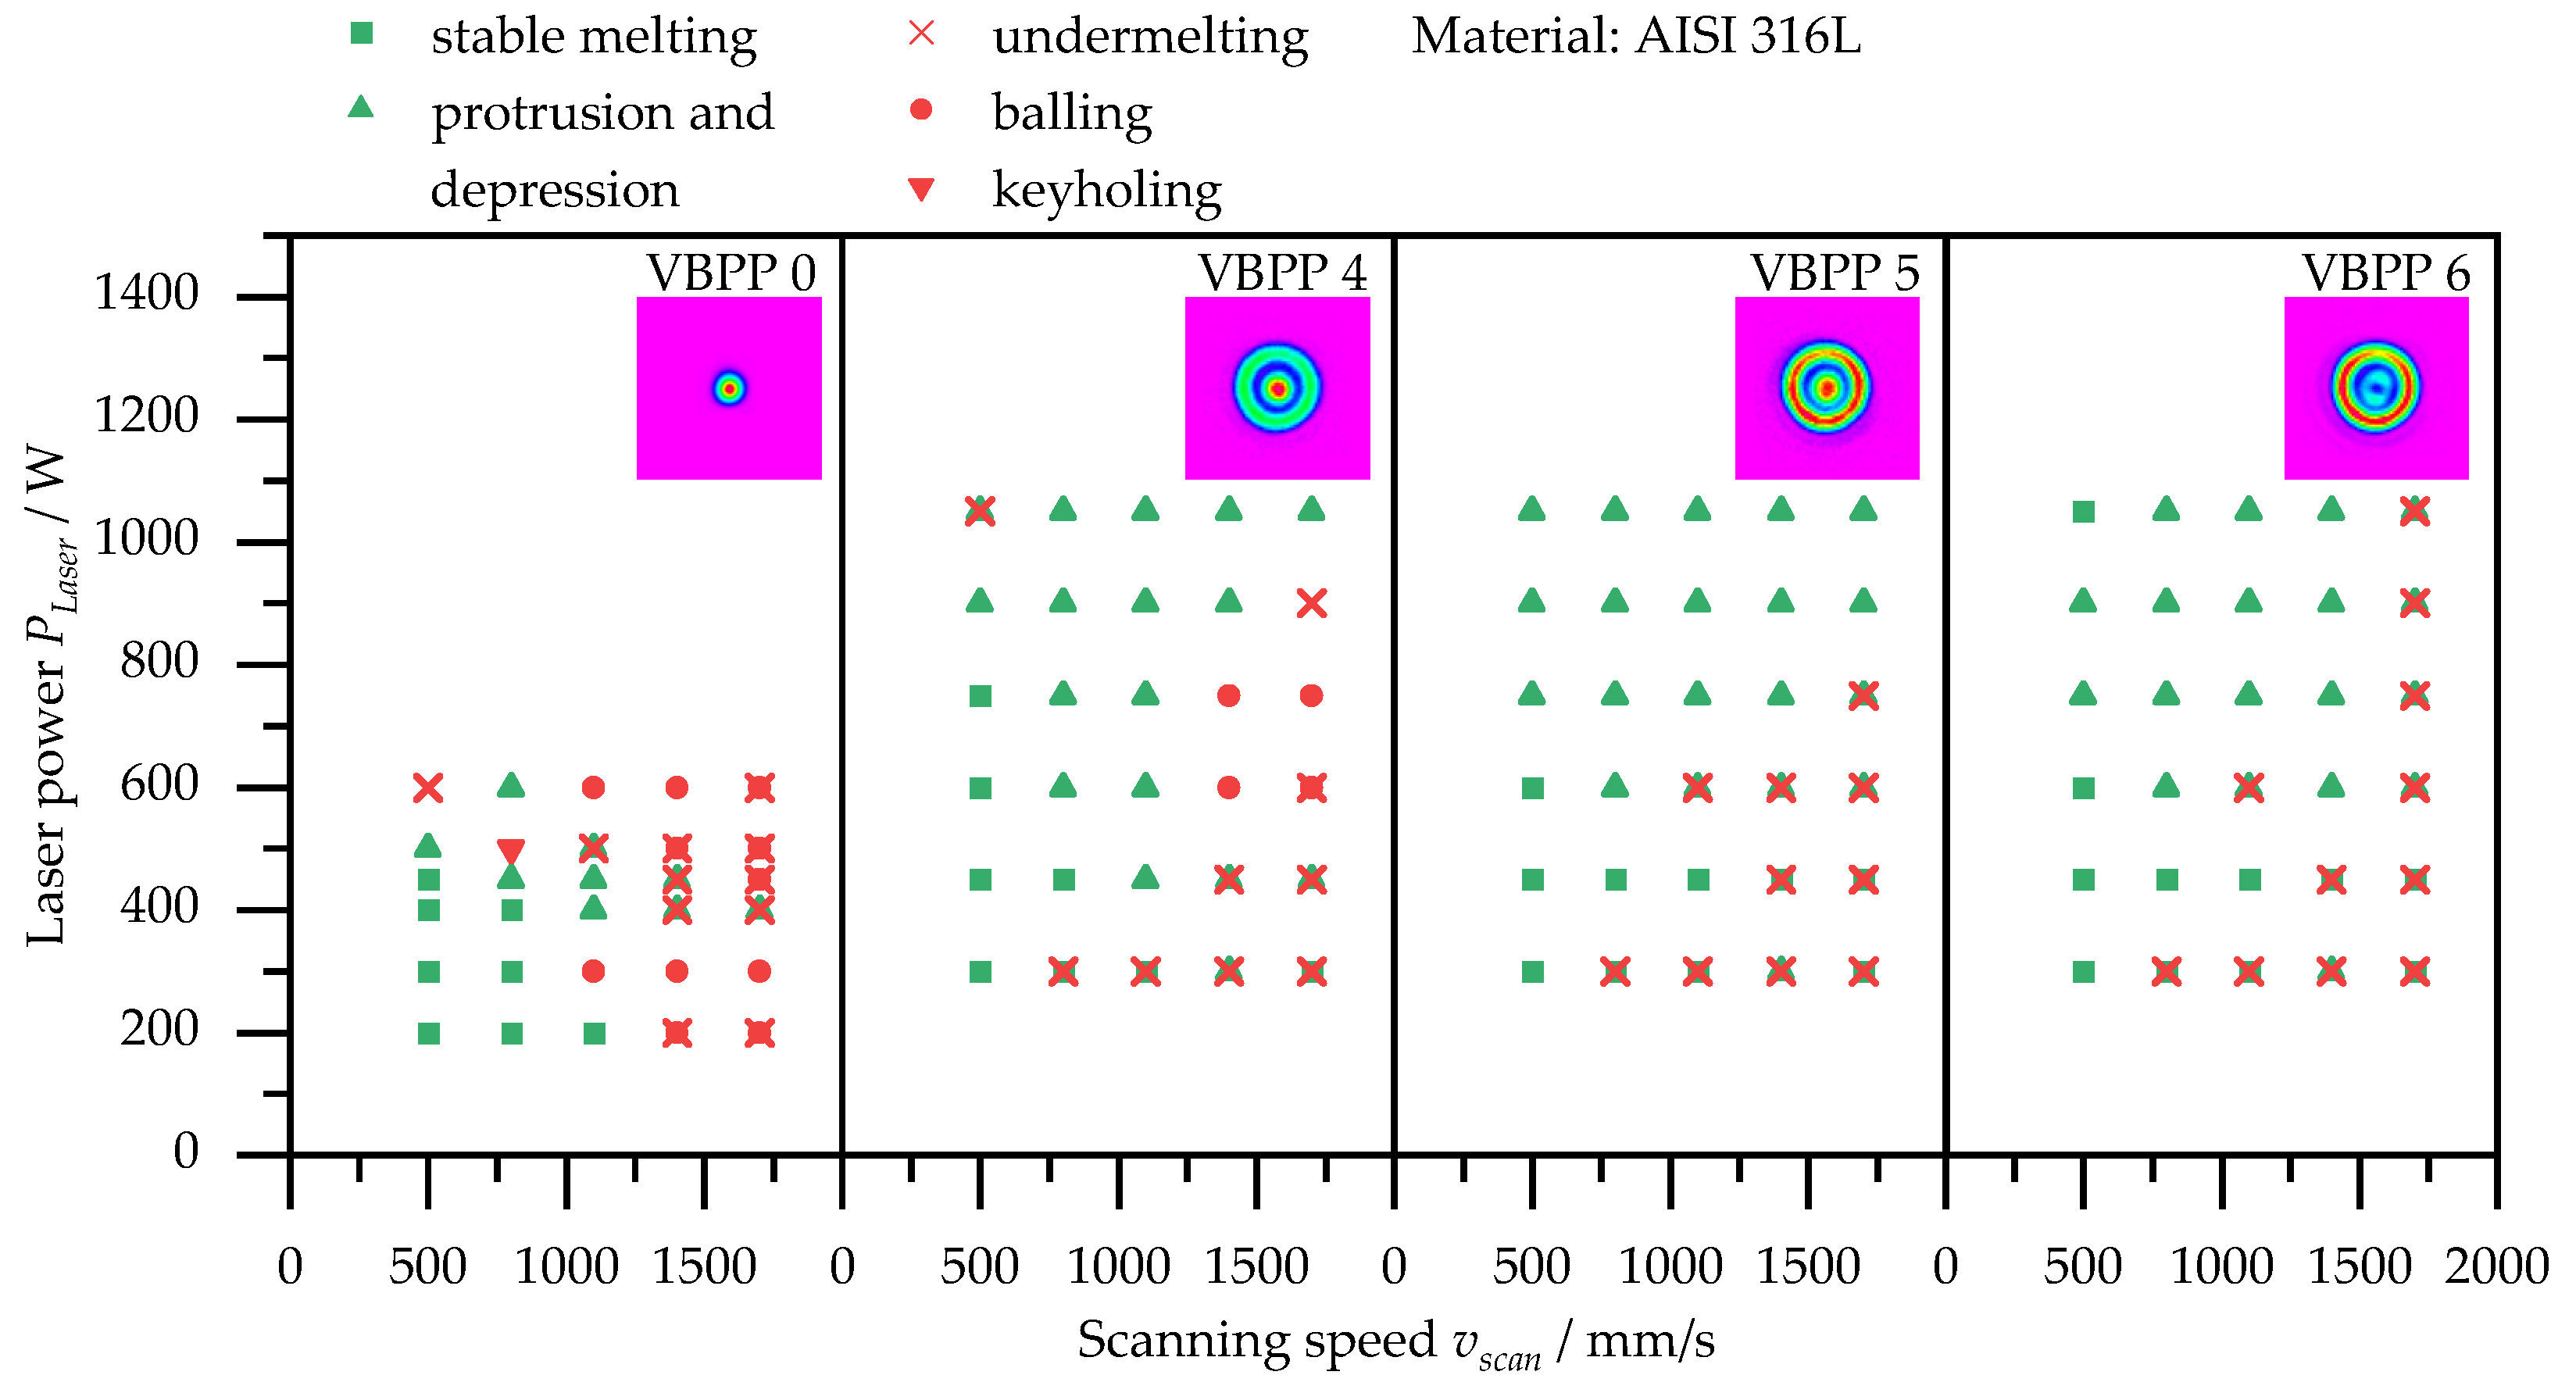
Figure 10 summarizes the classification of all investigated parameter sets. As “Protrusion and depression” or “Balling” and “Undermelting” partly take place simultaneously, some points on the PLaser-vscan process map overlap. As can be seen in Figure 10, the process windows between the Gaussian beam profile VBPP 0 and the ring-shaped beam profiles VBPP 4, 5, 6 differ significantly. It is not possible to run a stable process with the Gaussian beam profile in these investigations if laser powers PLaser are 500 W or greater, or scanning speeds vscan greater than 1100 mm/s are used. The ring-shaped beam profiles significantly enlarge the process windows. At very high laser powers of 1050 W, single tracks without keyholing and balling effects can be generated with these profiles. However, the protrusion and depression tendency at very high laser powers and scanning speeds lead to significant protrusions in these single tracks. One reason for the significantly larger process windows when using the ring-shaped profiles is the larger area of the spots. This reduces the intensities compared to the Gaussian profile at the same laser powers (see Figure 4b), which avoids process defects such as keyholing. However, these reduced intensities also result in insufficient welding penetration depth being produced at low powers PLaser below 750 W and high scan speeds vscan above 1400 mm/s (see Figure 7b).
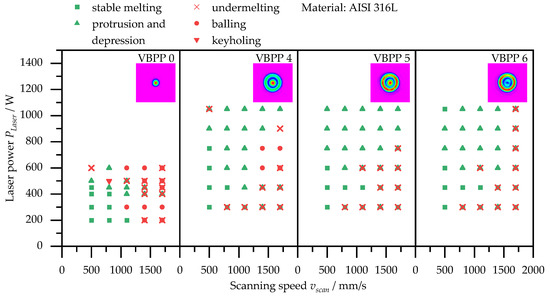
Figure 10.
PLaser-vscan process map of single-track experiments with AISI 316L.
The enlarged process windows of the ring-shaped beam profiles confirm the findings of Rasch et al. [7], Wischeropp et al. [8], Zhirnov et al. [11], and Metel et al. [12], who also showed significantly larger process windows and a reduction of balling and keyholing when using ring-shaped beam profiles. In the referred previous research, beam profiles of similar diameters are used in the interaction zone. Contrary to this, this investigation was performed with different spot sizes between the Gaussian and the ring-shaped profiles (see Table 1). Compared to the Gaussian beam profile, the diameters of the ring-shaped beam profiles extend by approximately 250%. Due to the different spot sizes, the direct comparability of the beam profiles is limited due to the different peak intensities at the same powers (see Figure 6b). However, the potential of combining the beam profiles becomes visible. In the long term, the Gaussian beam profile can be used for area with high required resolution, and the ring-shaped profiles can be used to fill in the hatch areas, which often represent a majority of the areas to be exposed. Whether defocusing or widening a Gaussian beam profile achieves similar results was not investigated in this study, as the potential of enlarging the process window for similar beam diameters has already been demonstrated in [7,8,11,12].
Due to the process behavior mentioned, a significant potential for increasing productivity while maintaining a stable process is indicated. With the ring-shaped beam profiles, the speed can be increased by a factor of approximately 1.3 at more than double the laser power. The weld widths increase on average by a factor of about 1.5 with stable process behavior. By increasing the hatch distance, this can be used to increase productivity. Based on these data, productivity can be increased by a factor of about 2 when combining the two options.
3.2. Influence of Laser Power, Scanning Speed, and Hatch Distance on Relative Overlap, Molten Cross-Sectional Area, and Molten Volume per Time
Based on the results of the single tracks, the multi-track segment experiments are carried out with the parameter sets from Table 3. The boundary areas of the process window are still investigated. Compared to the single tracks, the following adjustments are made. For the Gaussian profile VBPP 0, the maximum and intermediate power levels at 600 W and 450 W are not considered further. As a result of the very high protrusions at the maximum power levels at 1050 W and the insufficient welding penetration depth of the lowest power levels 300 W for the ring-shaped profiles, these levels are not investigated further. The speed levels at 1700 mm/s are not considered for the three lower power levels of all beam profiles because of the insufficient welding penetration depths. For the maximum power levels, the scan speeds are shifted, the 500 mm/s speed is not investigated and is replaced by the 1700 mm/s speed.
Due to the hatch of several weld tracks with hatch distances h less than the weld width ww, an overlap occurs in the multi-track segments. As a result of the missing reference edge, the welding penetration depth can no longer be measured. The weld width ww is determined from twice the distance from the center of the weld track to the weld track edge (twice half the width of the weld track). From this dimension, the relative overlap of the tracks Or is determined with the hatch distance h according to
According to Di et al. [34], an overlap of 30% is ideal for a productive and stable processing of AISI 316L using PBF-LB/M. Dong et al. [35] indicate an optimum overlap at 54% for the highest possible densities of AISI 316L components. Since the ring-shaped beam profiles result in much wider, shallower weld tracks, it may be possible that even a smaller overlap is sufficient to provide a stable process for a specimen with a high density.
The molten volume per time Vm is determined, a characteristic productivity value, and this can be calculated as a product of the molten cross-sectional area Am and the scanning speed vscan according to
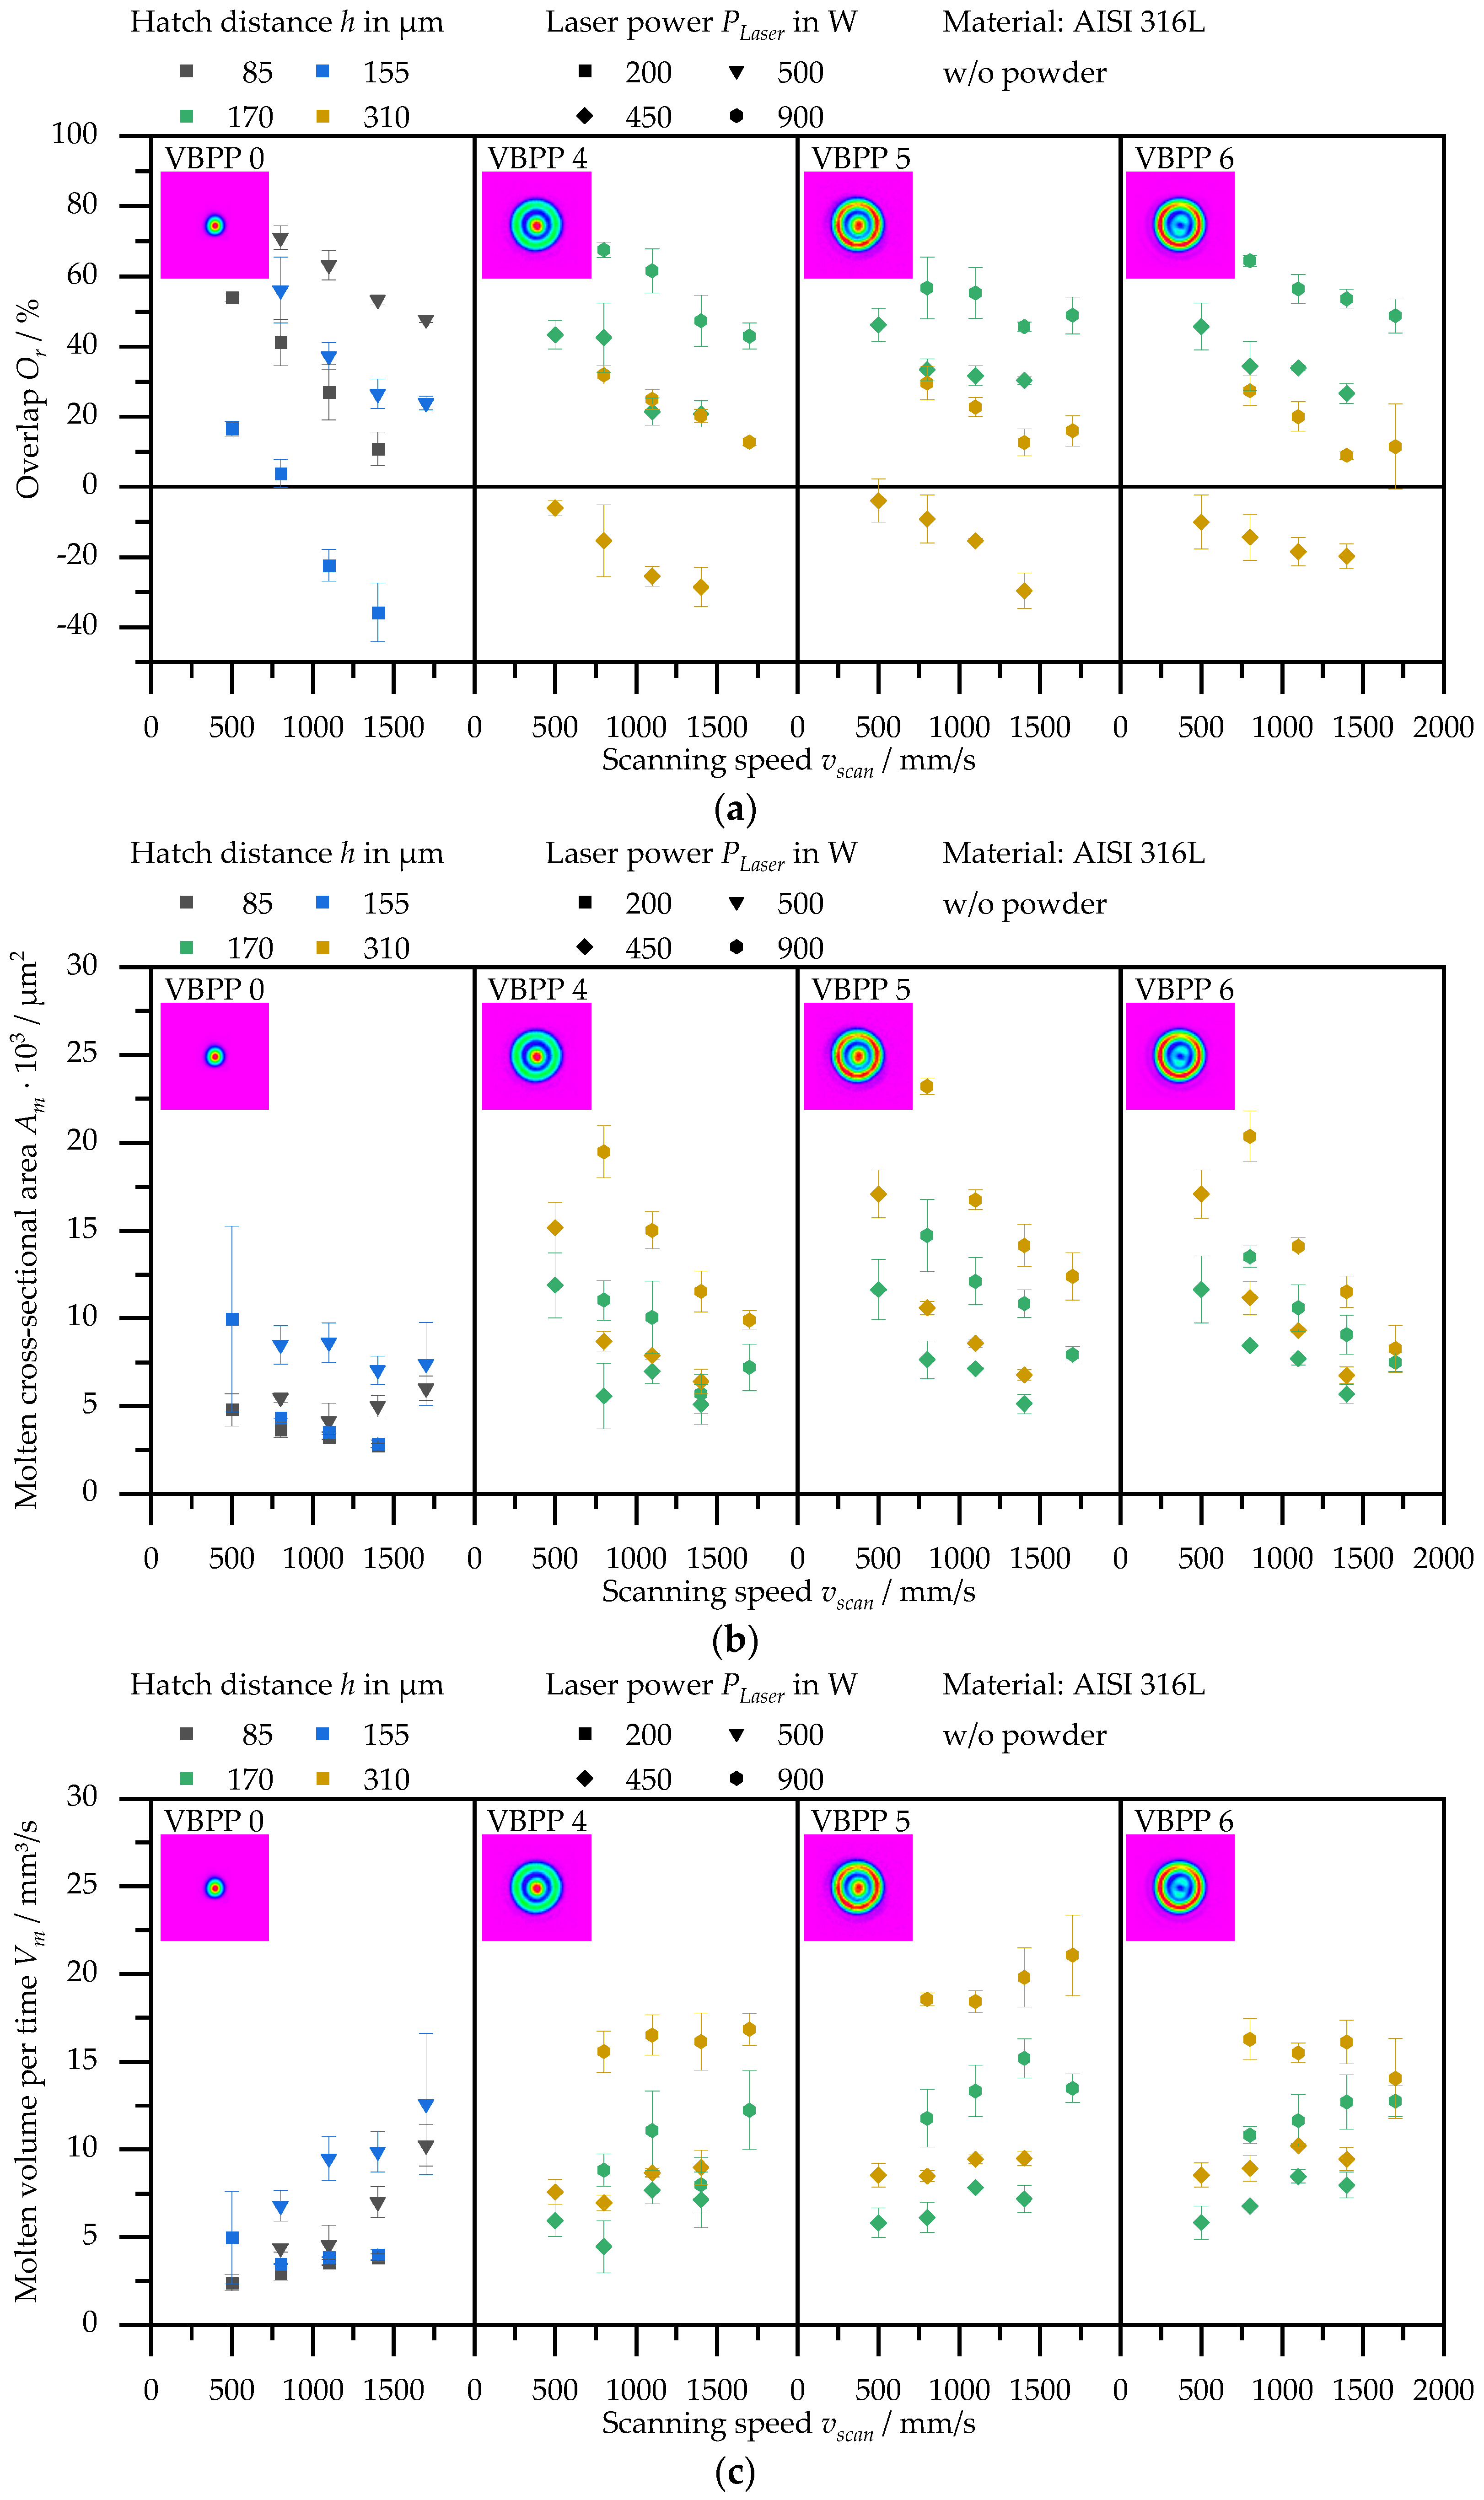
By measuring the visible cross-sectional area per track at the multi-track segments, the influence of the hatch distance is also considered (see Figure 5). Figure 11a shows the relative overlap Or, (b) shows the molten cross-sectional area Am, and (c) shows the molten volume per time Vm of the multi-track segments as a function of scanning speed vscan, laser power PLaser, and hatch distance h. To clarify the graphs, only two power levels and two levels of hatch distance per beam profile are shown in Figure 11. All parameter sets are shown in Figure 12. The relative overlap Or decreases for higher scanning speeds vscan, lower laser powers PLaser, and higher hatch distances h. A negative overlap Or means that the weld tracks do not overlap but are spaced apart. If the hatch distance h is varied at constant laser powers and scanning speeds, the overlap also decreases at higher hatch distances. This behavior can be explained by the smaller melt pools and thus weld widths at higher scan speeds and lower laser powers. With constant hatch distances, narrower welds result in lower relative overlaps according to Equation (2). At constant laser powers and scanning speeds, similar weld widths are produced. The decrease in relative overlap at larger hatch distances h is expected in accordance with Equation (2). The molten cross-sectional area of the multi-track segments exhibits a similar tendency to that of the single tracks for constant hatch distances. With increasing scan speeds and decreasing laser powers, the molten cross-sectional area of a track decreases. If these parameters are kept constant and the hatch distance is varied, the molten cross-sectional areas become larger for larger hatch distances. The cross-sectional areas are measured excluding the section of the track that is remelted by the following track. This means that the larger the overlap or the smaller the hatch distance, the smaller the molten cross-sectional area per track because a larger part of the track is remelted.
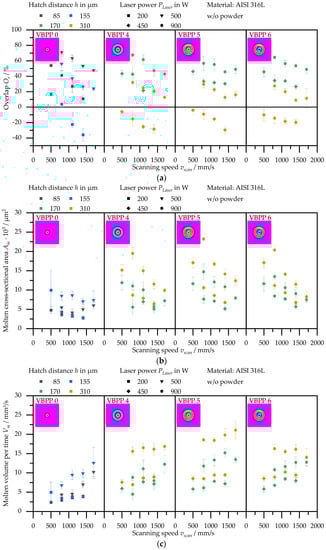
Figure 11.
Overlap Or (a), molten cross-sectional area Am (b), and molten volume per time Vm (c) of multi-track segments as a function of scanning speed vscan, laser power PLaser, and hatch distance h.
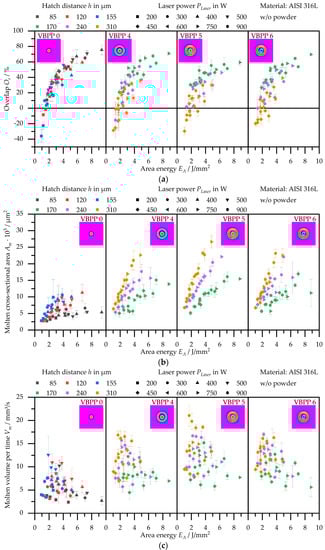
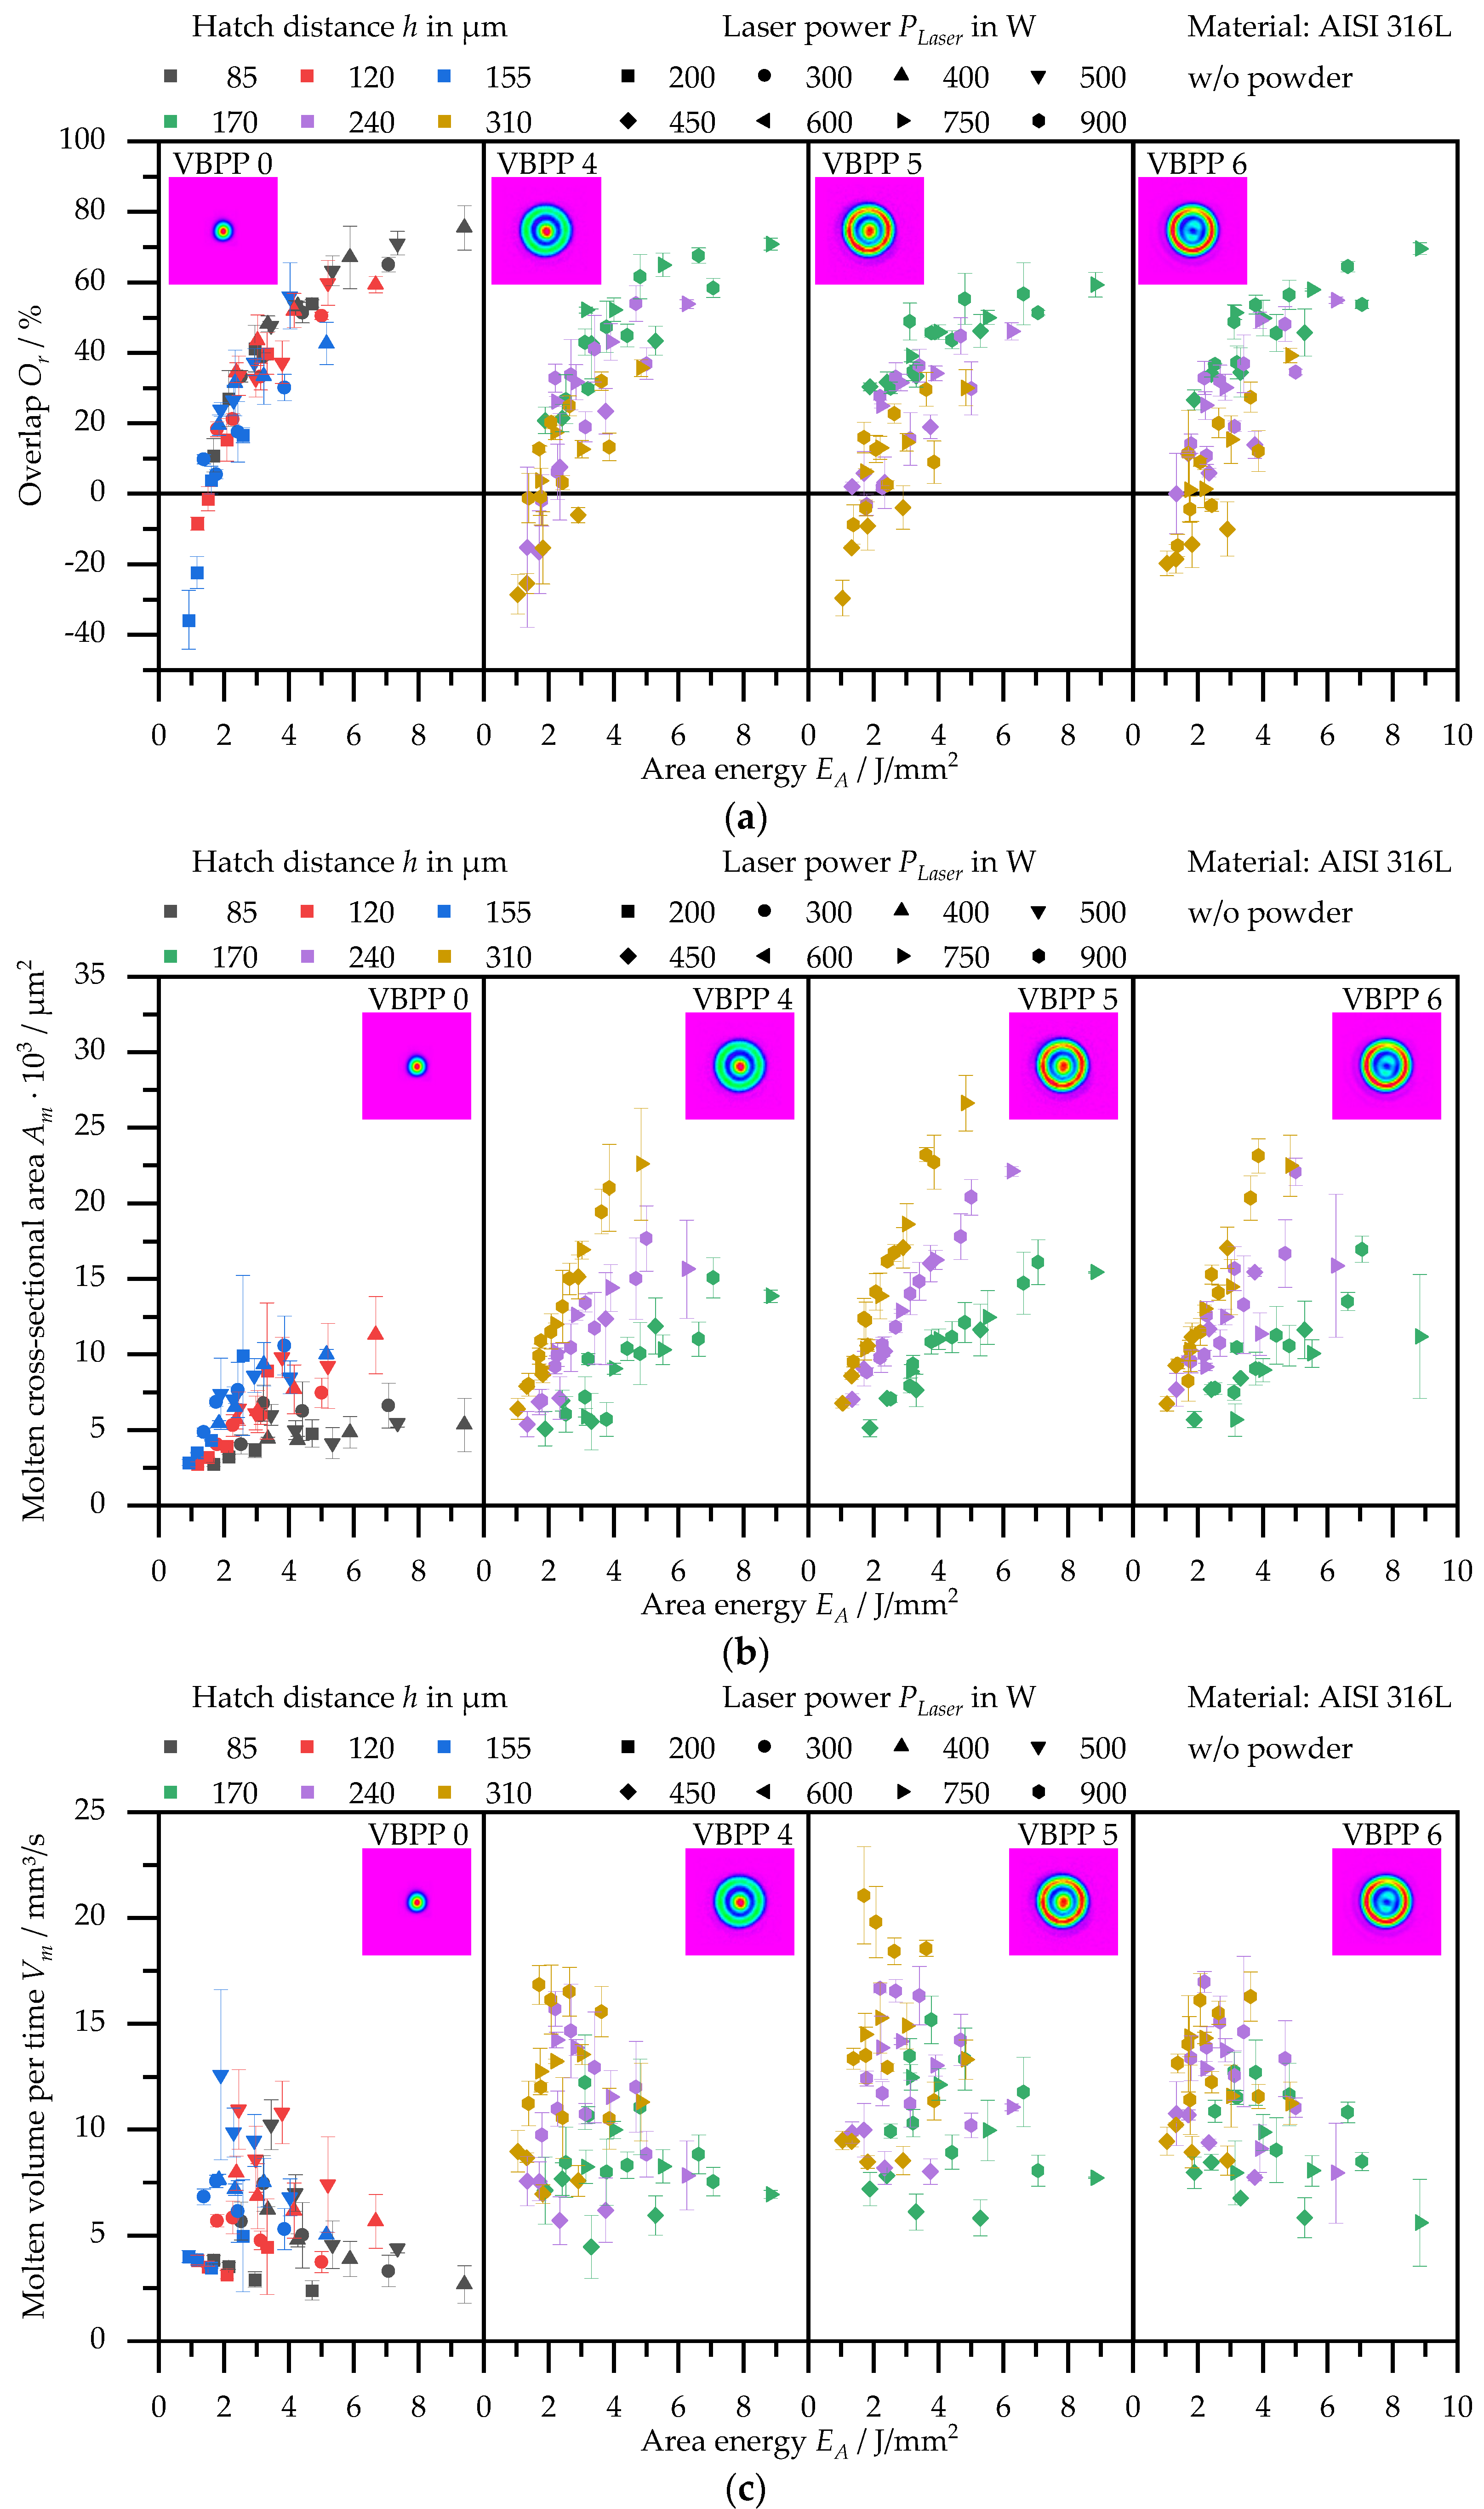
Figure 12.
Overlap Or (a), molten cross-sectional area Am (b), and molten volume per time Vm (c) of multi-track segments as a function of area energy EA, laser power PLaser, and hatch distance h.
Figure 11c combines the molten cross-sectional area Am and the scan speed vscan to form the molten volume per time Vm in accordance with Equation (3). Analogously to the molten cross-sectional area Am, the molten volume per time Vm increases for increased hatch distances and laser powers. It is noticeable that this characteristic value for the productivity tends to increase with scanning speed for constant powers and hatch distances. Firstly, this results from the reduced melt pool size and thus reduced relative overlap for increasing scanning speeds. However, the trend is also present for parameter sets that have negative relative overlap, i.e., where a change in this parameter results in no change in the molten cross-sectional area due to overlap. Secondly, this means that a change in the scanning speed influences the melting process itself. Higher scanning speeds tend to result in a higher molten volume per unit of time. One reason for this may be a change in laser energy coupling due to the shorter laser–material interaction at higher scanning speeds. According to this theory, relatively more energy would be absorbed in a shorter time, resulting in a larger molten volume per time. Another reason may be lower overheating of the melt pool due to shortened laser–material interaction at higher speeds. This means that less energy is used to superheat the material, and proportionately more is used for phase transformation. This results in a more “efficient” use of energy.
The process parameters laser power PLaser, scanning speed vscan, and hatch distance h can be combined to form the area energy EA according to
Figure 12a shows the relative overlap Or, (b) shows the molten cross-sectional area Am, and (c) shows the molten volume per time Vm of the multi-track segments as a function of the area energy EA. The colors and symbols are the same as in Figure 11.
For increasing applied area energies EA, the relative overlap Or becomes larger. For constant area energies, the overlap increases for greater laser powers and reduced hatch distances (see Figure 12a). As described above, the reasons for this are the larger melt pools and thus weld widths at higher laser powers and smaller hatch distances. The comparison of Figure 11a and Figure 12a indicates that it is not the variation of individual process parameters but rather their combination to form the area energy EA that influences the overlap. If a suitable overlap is assumed based on Di et al. [34] and Dong et al. [35], a range of Or between 30% and 54% is suitable. This range is reached for many of the parameter sets with area energies EA between 2 and 4 J/mm3.
The molten cross-sectional area Am increases approximately linearly with increasing area energy EA for constant hatch distances h (see Figure 12b). This indicates a dependency of the molten cross-sectional area Am per track on the hatch distance h and the quotient of laser power PLaser and scan speed vscan (line energy El according to Equation (1)). For constant area energies, the molten cross-sectional areas increase in size with greater hatch distances. Reasons for this are the dependencies between hatch distance and relative overlap discussed above.
Figure 12c illustrates that the molten volume per time does not reach a maximum at high area energy. Rather, the molten volumes per time reach their maxima in a range of area energies EA between 2 and 4 J/mm3 for all four beam profiles. One reason for this is the impact of the scan velocity and hatch distance on the molten volume per time, while also forming the divisor in the calculation of the area energy. Figure 12c also shows that the molten volume per time reaches a maximum at constant area energy with high powers and hatch distances. Accordingly, the scanning speed must be selected in such a way that suitable area energies and overlaps result, depending on the power and hatching. Compared to Gaussian beam profiles, significantly higher volumes can be molten per time with suitable overlaps when using ring-shaped profiles (VBPP 4, 5, 6) at equal area energies (EA ≈ 2 … 4 J/mm3). This indicates that there is a significant potential for increasing productivity. It should be noted that the power levels and hatch distances used with the Gaussian beam profile were significantly lower than the parameters of the ring-shaped profiles. Higher values for laser power and hatch distances are not considered for the Gaussian profile due to the lack of process stability and the reduced weld widths ww.
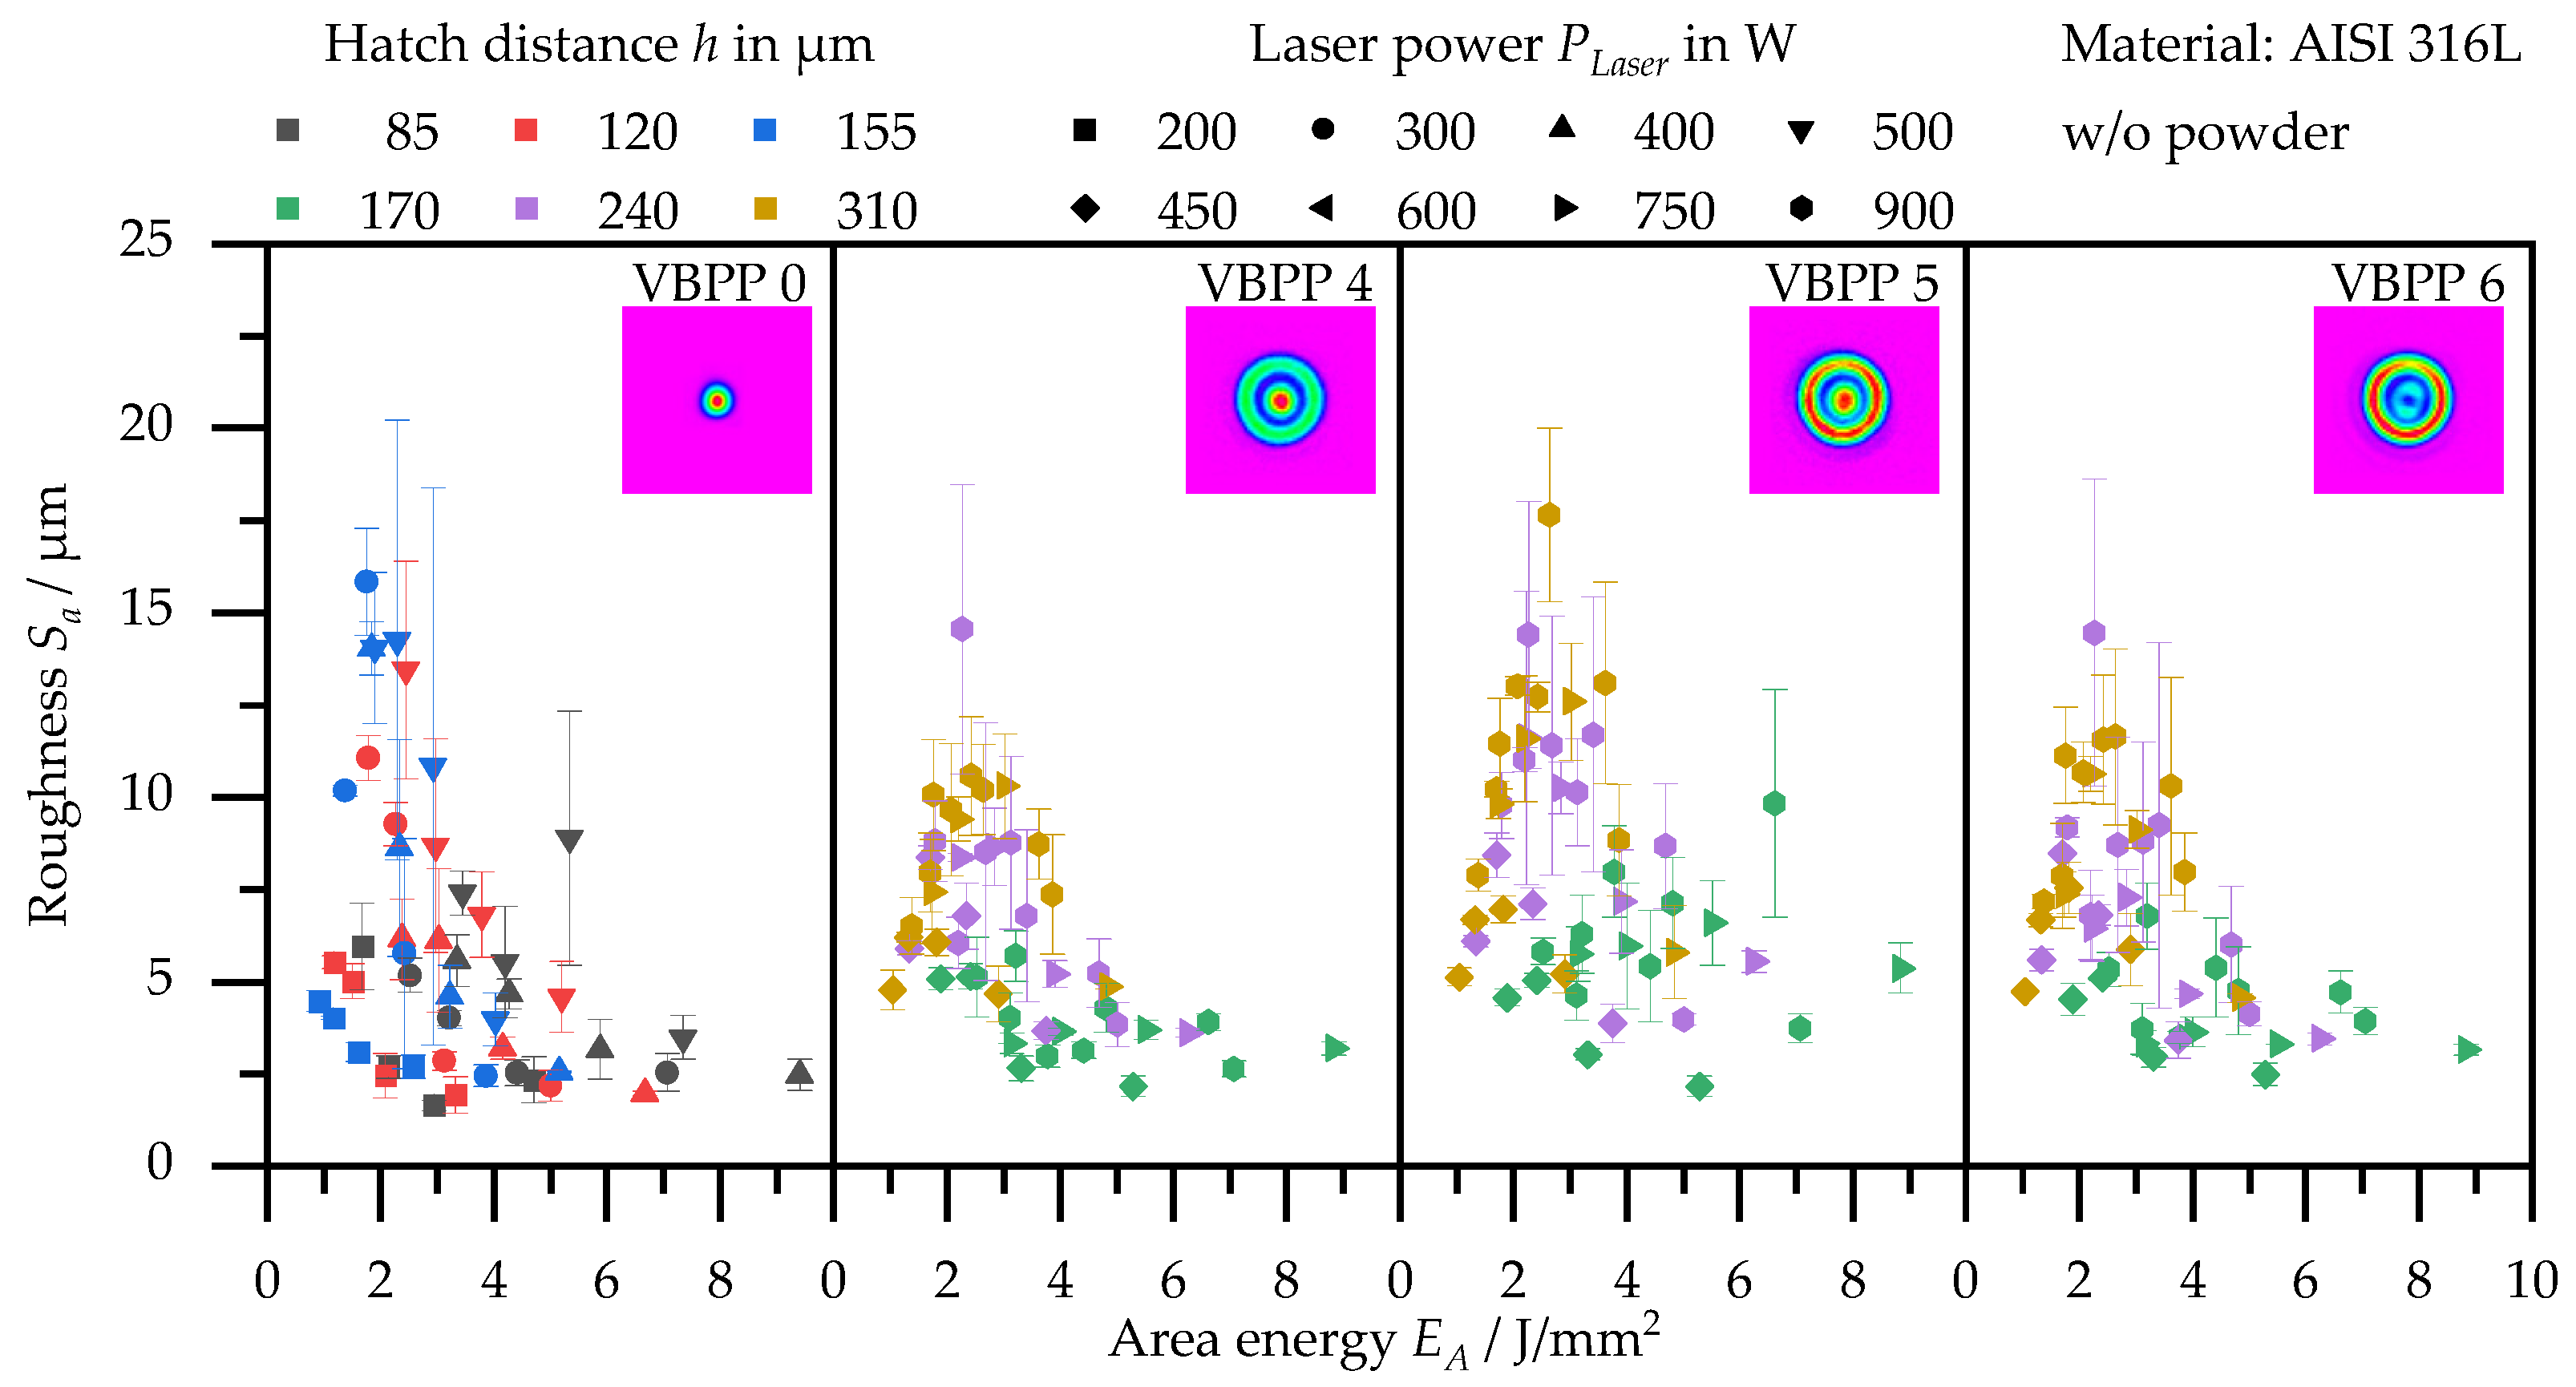
Figure 13 shows the roughness Sa as a function of the area energy EA. Similarly to the molten volume per time, the roughness reaches a maximum in the range of the area energy EA ≈ 2 … 4 J/mm3. It is likely that parameter sets with high hatch distances and laser powers in particular will reach high roughness values. Despite the lower values for power and hatch distance for the Gaussian beam profile (VBPP 0), the roughnesses are at a slightly higher level than the roughnesses when using ring-shaped beam profiles. One reason for this could be the significantly larger weld widths and relatively lower protrusions of the weld tracks produced with ring-shaped beam profiles.
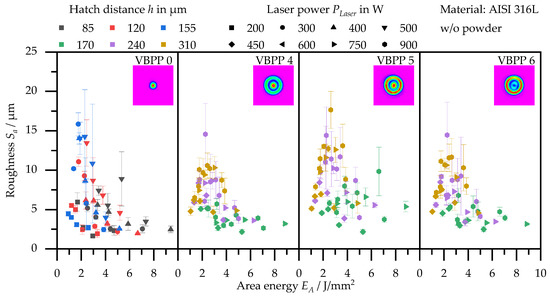
Figure 13.
Roughness Sa of multi-track segments as a function of area energy EA, laser power PLaser, and hatch distance h.
In summary, a majority of the parameter sets with area energies EA between 2 and 4 J/mm3 generate sufficient overlaps. In this area energy range, the highest values of molten volumes per time are achieved for high laser powers and hatch distances, which indicates high process productivity. By applying ring-shaped beam profiles, the molten volumes per time Vm can be improved up to 20 mm3/s compared to the conventional Gaussian beam profiles (less than 12 mm3/s). The roughness Sa is slightly reduced when using ring-shaped beam profiles than when using a Gaussian beam.
Similar values for the molten volume per time Vm are achieved by Schleifenbaum et al. [15] when processing steel and using a top-hat profile. However, the increase in productivity in [15] is at the expense of roughness and resolution. Gusarov et al. [3] and Loh et al. [16] have already described the potential of using alternative intensity distributions with larger beam diameters to increase build rates without decreasing part quality. The potential described can be confirmed by the shown increases in molten volume per time Vm with similar roughness values Sa of the multi-track segments.
4. Conclusions
This study investigated the influence of ring-shaped beam profiles on process stability and productivity in laser-based powder bed fusion of AISI 316L. The results of experiments with different parameter sets of Gaussian and ring-shaped beam profiles have been compared. Based on the classification of single tracks into different process categories, process windows were identified, whose size allows a deduction of the process stability and robustness. Furthermore, the influences of different beam shapes on productivity were investigated on the basis of multi-track segments. The data and relationships shown and discussed allow some generalized conclusions to be reached about the potential of the used ring-shaped beam shapes during processing AISI 316L in PBF-LB/M:
- The PBF-LB/M process itself can be stabilized at high laser powers and scanning speeds using ring-shaped beam profiles. Due to the reduction of process-limiting phenomena such as keyholing and balling, the process window for ring-shaped beam profiles increases significantly
- The process windows shift to higher laser powers when using ring-shaped profiles due to the larger beam diameters and thus decreasing intensities.
- An influence of the beam profiles on the degree of coupling of the laser energy is not found. For equal line energies, comparable cross-sectional areas are melted irrespective of the beam profile.
- When manufacturing multi-track segments, optimum area energies between 2 and 4 J/mm3 are identified for processing AISI 316L, independent of the beam profile used.
- In the experiments, the molten volume per time can be increased from less than 12 mm3/s (for Gaussian beams) to 20 mm3/s (for ring-shaped profiles) with slightly reduced roughness Sa.
Thus, the use of ring-shaped beam profiles in PBF-LB/M offers enormous potential for stabilizing the process while simultaneously accelerating it. To be able to assess the potential of the alternative beam shapes in more detail, the maximum size of a stable melt pool has still to be investigated, because this limit has not yet been reached with the ring-shaped beam profiles shown. With even larger melt pools, productivity could potentially be increased even further. Additionally, further experiments should investigate how the alternative beam profiles influence the properties in resulting components (e.g., microstructure) due to the changed energy input.
Author Contributions
Conceptualization, J.G.; methodology, J.G.; validation, J.G. and F.G.; formal analysis, J.G.; investigation, J.G., F.G. and M.S.; resources, M.S. and K.W.; data curation, J.G. and F.G.; writing—original draft preparation, J.G.; writing—review and editing, J.G. and K.W.; visualization, J.G.; supervision, J.G., M.S. and K.W.; project administration, J.G.; funding acquisition, no external funding. All authors have read and agreed to the published version of the manuscript.
Funding
This research received no external funding.
Data Availability Statement
The data presented in this study are available in the article.
Acknowledgments
The authors want to thank ARGES, nLIGHT and Optoprim for the great support regarding the nLIGHT AFX-1000 and the ARGES Elephant 50.
Conflicts of Interest
The authors declare no conflict of interest.
Appendix A
| Symbol | Explanation | Unit |
| A | Aspect ratio | - |
| Am | Molten cross-sectional area | µm² |
| El | Line energy | J/mm |
| EA | Area energy | J/mm² |
| h | Hatch distance | µm |
| Or | Relative overlap | % |
| PLaser | Laser power | W |
| Sa | Roughness: Arithmetical mean height | µm |
| Sz | Roughness: Maximum height | µm |
| Vm | Molten volume per time | µm3/s |
| vscan | Scanning speed | mm/s |
| ww | Width of the weld track | µm |
| w0 | Spot radius | µm |
| δw | Welding penetration depth | µm |
| Abbreviation | Explanation | |
| PBF-LB/M | Laser-based powder bed fusion of metals | |
| VBPP | Variable Beam Parameter Product | |
References
- Khorasani, A.; Gibson, I.; Veetil, J.K.; Ghasemi, A.H. A review of technological improvements in laser-based powder bed fusion of metal printers. Int. J. Adv. Manuf. Technol. 2020, 108, 191–209. [Google Scholar] [CrossRef]
- Yadroitsev, I.; Smurov, I. Selective laser melting technology: From the single laser melted track stability to 3D parts of complex shape. Phys. Procedia 2010, 5, 551–560. [Google Scholar] [CrossRef] [Green Version]
- Gusarov, A.V.; Grigoriev, S.N.; Volosova, M.A.; Melnik, Y.A.; Laskin, A.; Kotoban, D.V.; Okunkova, A.A. On productivity of laser additive manufacturing. J. Mater. Process. Technol. 2018, 261, 213–232. [Google Scholar] [CrossRef]
- Matthews, M.J.; Guss, G.; Khairallah, S.A.; Rubenchik, A.M.; Depond, P.J.; King, W.E. Denudation of metal powder layers in laser powder bed fusion processes. Acta Mater. 2016, 114, 33–42. [Google Scholar] [CrossRef] [Green Version]
- Gusarov, A.V.; Yadroitsev, I.; Bertrand, P.; Smurov, I. Heat transfer modelling and stability analysis of selective laser melting. Appl. Surf. Sci. 2007, 254, 975–979. [Google Scholar] [CrossRef]
- Kruth, J.P.; Froyen, L.; van Vaerenbergh, J.; Mercelis, P.; Rombouts, M.; Lauwers, B. Selective laser melting of iron-based powder. J. Mater. Process. Technol. 2004, 149, 616–622. [Google Scholar] [CrossRef]
- Rasch, M.; Roider, C.; Kohl, S.; Strauß, J.; Maurer, N.; Nagulin, K.Y.; Schmidt, M. Shaped laser beam profiles for heat conduction welding of aluminium-copper alloys. Opt. Lasers Eng. 2019, 115, 179–189. [Google Scholar] [CrossRef]
- Wischeropp, T.M.; Tarhini, H.; Emmelmann, C. Influence of laser beam profile on the selective laser melting process of AlSi10Mg. J. Laser Appl. 2020, 32, 22059. [Google Scholar] [CrossRef]
- Roehling, T.T.; Shi, R.; Khairallah, S.A.; Roehling, J.D.; Guss, G.M.; McKeown, J.T.; Matthews, M.J. Controlling grain nucleation and morphology by laser beam shaping in metal additive manufacturing. Mater. Des. 2020, 195, 109071. [Google Scholar] [CrossRef]
- Ayoola, W.A.; Suder, W.J.; Williams, S.W. Effect of beam shape and spatial energy distribution on weld bead geometry in conduction welding. Opt. Laser Technol. 2019, 117, 280–287. [Google Scholar] [CrossRef]
- Zhirnov, I.V.; Podrabinnik, P.A.; Okunkova, A.A.; Gusarov, A.V. Laser beam profiling: Experimental study of its influence on single-track formation by selective laser melting. Mech. Ind. 2015, 16, 709. [Google Scholar] [CrossRef] [Green Version]
- Metel, A.; Stebulyanin, M.; Fedorov, S.; Okunkova, A. Power density distribution for laser additive manufacturing (SLM): Potential, fundamentals and advanced applications. Technologies 2019, 7, 5. [Google Scholar] [CrossRef] [Green Version]
- Okunkova, A.; Volosova, M.; Peretyagin, P.; Vladimirov, Y.; Zhirnov, I.; Gusarov, A.V. Experimental approbation of selective laser melting of powders by the use of non-gaussian power density distributions. Phys. Procedia 2014, 56, 48–57. [Google Scholar] [CrossRef] [Green Version]
- Okunkova, A.A.; Peretyagin, P.; Podrabinnik, P.A.; Zhirnov, I.V.; Gusarov, A.V. Development of laser beam modulation assets for the process productivity improvement of selective laser melting. Procedia IUTAM 2017, 23, 177–186. [Google Scholar] [CrossRef]
- Schleifenbaum, H.; Meiners, W.; Wissenbach, K.; Hinke, C. High power selective laser melting: A new approach for individualized series production. In International Congress on Applications of Lasers & Electro-Optics, Proceedings of the ICALEO® 2009: 28th International Congress on Laser Materials Processing, Laser Microprocessing and Nanomanufacturing, Orlando, FL, USA, 2–5 November 2009; Laser Institute of America: Orlando, FL, USA, 2009; pp. 385–394. ISBN 978-0-912035-59-8. [Google Scholar]
- Loh, L.E.; Liu, Z.H.; Zhang, D.Q.; Mapar, M.; Sing, S.L.; Chua, C.K.; Yeong, W.Y. Selective laser melting of aluminium alloy using a uniform beam profile. Virtual Phys. Prototyp. 2014, 9, 11–16. [Google Scholar] [CrossRef]
- Wang, L.; Mohammadpour, M.; Gao, X.; Lavoie, J.-P.; Kleine, K.; Kong, F.; Kovacevic, R. Adjustable Ring Mode (ARM) laser welding of stainless steels. Opt. Lasers Eng. 2021, 137, 106360. [Google Scholar] [CrossRef]
- Havrilla, D.L.; Feuchtenbeiner, S.; Speker, N.; Haug, P.; Hesse, T. BrightLine weld-spatter reduced high speed welding with disk lasers. In High-Power Laser Materials Processing: Applications, Diagnostics, and Systems VII; Kaierle, S., Heinemann, S.W., Eds.; SPIE: Bellingham, WA, USA, 2018; p. 11. ISBN 9781510615359. [Google Scholar]
- Maina, M.R.; Okamoto, Y.; Okada, A.; Närhi, M.; Kangastupa, J.; Vihinen, J. High surface quality welding of aluminum using adjustable ring-mode fiber laser. J. Mater. Process. Technol. 2018, 258, 180–188. [Google Scholar] [CrossRef]
- Mohammadpour, M.; Wang, L.; Kong, F.; Kovacevic, R. Adjustable ring mode and single beam fiber lasers: A performance comparison. Manuf. Lett. 2020, 25, 50–55. [Google Scholar] [CrossRef]
- He, Y.; Zhong, M.; Beuth, J.; Webler, B. A study of microstructure and cracking behavior of H13 tool steel produced by laser powder bed fusion using single-tracks, multi-track pads, and 3D cubes. J. Mater. Process. Technol. 2020, 286, 116802. [Google Scholar] [CrossRef]
- nLIGHT, Inc. AFX-1000: Programmable Fiber Lasers for Additive Manufacturing. 2018. Available online: https://www.optoprim.de/PDF/nLIGHT/nLIGHT_AFX-1000_datasheet.pdf (accessed on 1 December 2021).
- DIN German Institute for Standardization. DIN EN ISO 11146-1:2005-04, Lasers and Laser-Related Equipment—Test Methods for Laser Beam Widths, Divergence Angles and Beam Propagation Ratios—Part 1: Stigmatic and Simple Astigmatic Beams (ISO 11146-1:2005); German version EN ISO 11146-1:2005; Beuth Verlag GmbH: Berlin, Germany, 2005. [Google Scholar]
- Tenbrock, C.; Fischer, F.G.; Wissenbach, K.; Schleifenbaum, J.H.; Wagenblast, P.; Meiners, W.; Wagner, J. Influence of keyhole and conduction mode melting for top-hat shaped beam profiles in laser powder bed fusion. J. Mater. Process. Technol. 2020, 278, 116514. [Google Scholar] [CrossRef]
- Brandt, M. Laser Additive Manufacturing: Materials, Design, Technologies, and Applications; Woodhead Publishing: Shaxton, UK, 2016. [Google Scholar]
- Markl, M.; Körner, C. Multiscale modeling of powder bed–based additive manufacturing. Annu. Rev. Mater. Res. 2016, 46, 93–123. [Google Scholar] [CrossRef]
- Khairallah, S.A.; Anderson, A. Mesoscopic simulation model of selective laser melting of stainless steel powder. J. Mater. Process. Technol. 2014, 214, 2627–2636. [Google Scholar] [CrossRef]
- Zhang, T.; Li, H.; Liu, S.; Shen, S.; Xie, H.; Shi, W.; Zhang, G.; Shen, B.; Chen, L.; Xiao, B.; et al. Evolution of molten pool during selective laser melting of Ti–6Al–4V. J. Phys. D Appl. Phys. 2019, 52, 55302. [Google Scholar] [CrossRef]
- Heinl, M.; Greiner, S.; Wudy, K.; Pobel, C.; Rasch, M.; Huber, F.; Papke, T.; Merklein, M.; Schmidt, M.; Körner, C.; et al. Measuring procedures for surface evaluation of additively manufactured powder bed-based polymer and metal parts. Meas. Sci. Technol. 2020, 31, 95202. [Google Scholar] [CrossRef]
- DIN German Institute for Standardization. DIN EN ISO 25178-2:2012-09, Geometrische Produktspezifikation (GPS)—Oberflächenbeschaffenheit: Flächenhaft—Teil_2: Begriffe und Oberflächen-Kenngrößen (ISO 25178-2:2012); Deutsche Fassung EN_ISO_25178-2:2012; Beuth Verlag GmbH: Berlin, Germany, 2012. [Google Scholar]
- Grünberger, T.; Domröse, R. Direct Metal Laser Sintering. Laser Tech. J. 2015, 12, 45–48. [Google Scholar] [CrossRef]
- Paschotta, R. Thermal Lensing. RP Photonics Encyclopedia. Available online: https://www.rp-photonics.com/thermal_lensing.html (accessed on 1 December 2021).
- Wischeropp, T.M.; Salazar, R.; Herzog, D.; Emmelmann, C. Simulation of the effect of different laser beam intensity profiles on heat distribution in selective laser melting. In Lasers in Manufacturing Conference, June 22–25; WLT: Munich, Germany, 2015. [Google Scholar]
- Di, W.; Yongqiang, Y.; Xubin, S.; Yonghua, C. Study on energy input and its influences on single-track, multi-track, and multi-layer in SLM. Int. J. Adv. Manuf. Technol. 2012, 58, 1189–1199. [Google Scholar] [CrossRef]
- Dong, Z.; Liu, Y.; Wen, W.; Ge, J.; Liang, J. Effect of Hatch Spacing on Melt Pool and As-built Quality During Selective Laser Melting of Stainless Steel: Modeling and Experimental Approaches. Materials 2019, 12, 50. [Google Scholar] [CrossRef] [PubMed] [Green Version]


Publisher’s Note: MDPI stays neutral with regard to jurisdictional claims in published maps and institutional affiliations. |
© 2021 by the authors. Licensee MDPI, Basel, Switzerland. This article is an open access article distributed under the terms and conditions of the Creative Commons Attribution (CC BY) license (https://creativecommons.org/licenses/by/4.0/).