Abstract
Hardfacing layers on mild steel substrates were successfully manufactured using a plasma transferred arc welding (PTAW) process to combine tungsten carbide powder and binder metal. Three morphological types of tungsten carbide powder were employed: spherical, fused angular, and mixed powder. The effects of both the morphology and the quantity of tungsten carbide powder on the wear property of the products were determined using a dry sand wheel abrasion test. The results revealed that two conditions effectively increased the wear resistance of the hardfacing layers: the use of spherical tungsten carbide and the use of an increased quantity of tungsten carbide. Moreover, the formation of an interfacial layer of intermetallic compounds (IMCs) between the tungsten carbide and binder metal, and the relationship between the microstructure of the IMC layer and its wear property were also investigated. It was confirmed that, in general, preferential wear occurs in the binder metal region. It was also unveiled that the wear property improves when interfacial IMC bands are formed and grown to appropriate width. To obtain a sound layer more resistant to wear, the PTAW conditions should be adequately controlled. In particular, these include the process peak temperature and the cooling rate, which affect the formation of the microstructure.
1. Introduction
The hardfacing process is one of the most famous surface modification technologies. It is a metal working process where harder materials are applied on the surface of base materials by various characteristic methods. It has been used to manufacture industrial parts containing both superior hardness and wear resistance for use in key industries such as mining, power plants, steel making, and machinery [1,2]. To provide a micro-ordered thin layer, techniques such as flame spraying, chemical vapor deposition (CVD) [3,4], and physical vapor deposition (PVD) have been applied in the electronics industry. On the other hand, cladding [5], laser melt injection [6], and overlay welding [7,8] processes have been selected to provide millimeter-ordered, relatively thick layers for manufacturing functional and structural parts.
Specifically, plasma transferred arc welding (PTAW) is one of the most effective hardfacing techniques because PTAW makes it easy to control the hardfacing layer, which determines mechanical properties like hardness and wear resistance [4,9]. Moreover, it also provides great flexibility for its application to industrial parts with various morphologies. Based on these merits, the PTAW technique has been studied often, and reported on for the past several decades [10,11,12]. For example, Vytenis Jankauskas et al. reported the improvement of wear properties, cost efficiency, and effect of the kind of substrate [13]. However, the papers that have reported on the effect of the powder morphology on the wear property are few in number. Moreover, papers about the formation and manner of growth of the interfacial microstructure between the binder and powder material, and its effect on mechanical properties, are rare. However, this must be understood if the performance of PTAW is to be improved.
In this study, PTAW was performed to manufacture hardfacing layers with tungsten carbide (WC) powder. A mild steel (SS400) was selected as the substrate. Three kinds of tungsten carbide powder (spherical, fused angular, and a mix of them) were employed. The effect of the morphology and quantity of WC powder on wear and hardness was investigated in detail. Furthermore, the authors revealed the formation and growth manner of the microstructure in the hardfacing layer, especially the interfacial microstructure between the WC and binder metal. The authors also discussed the relationship between the interfacial microstructure and the wear property.
2. Materials and Methods
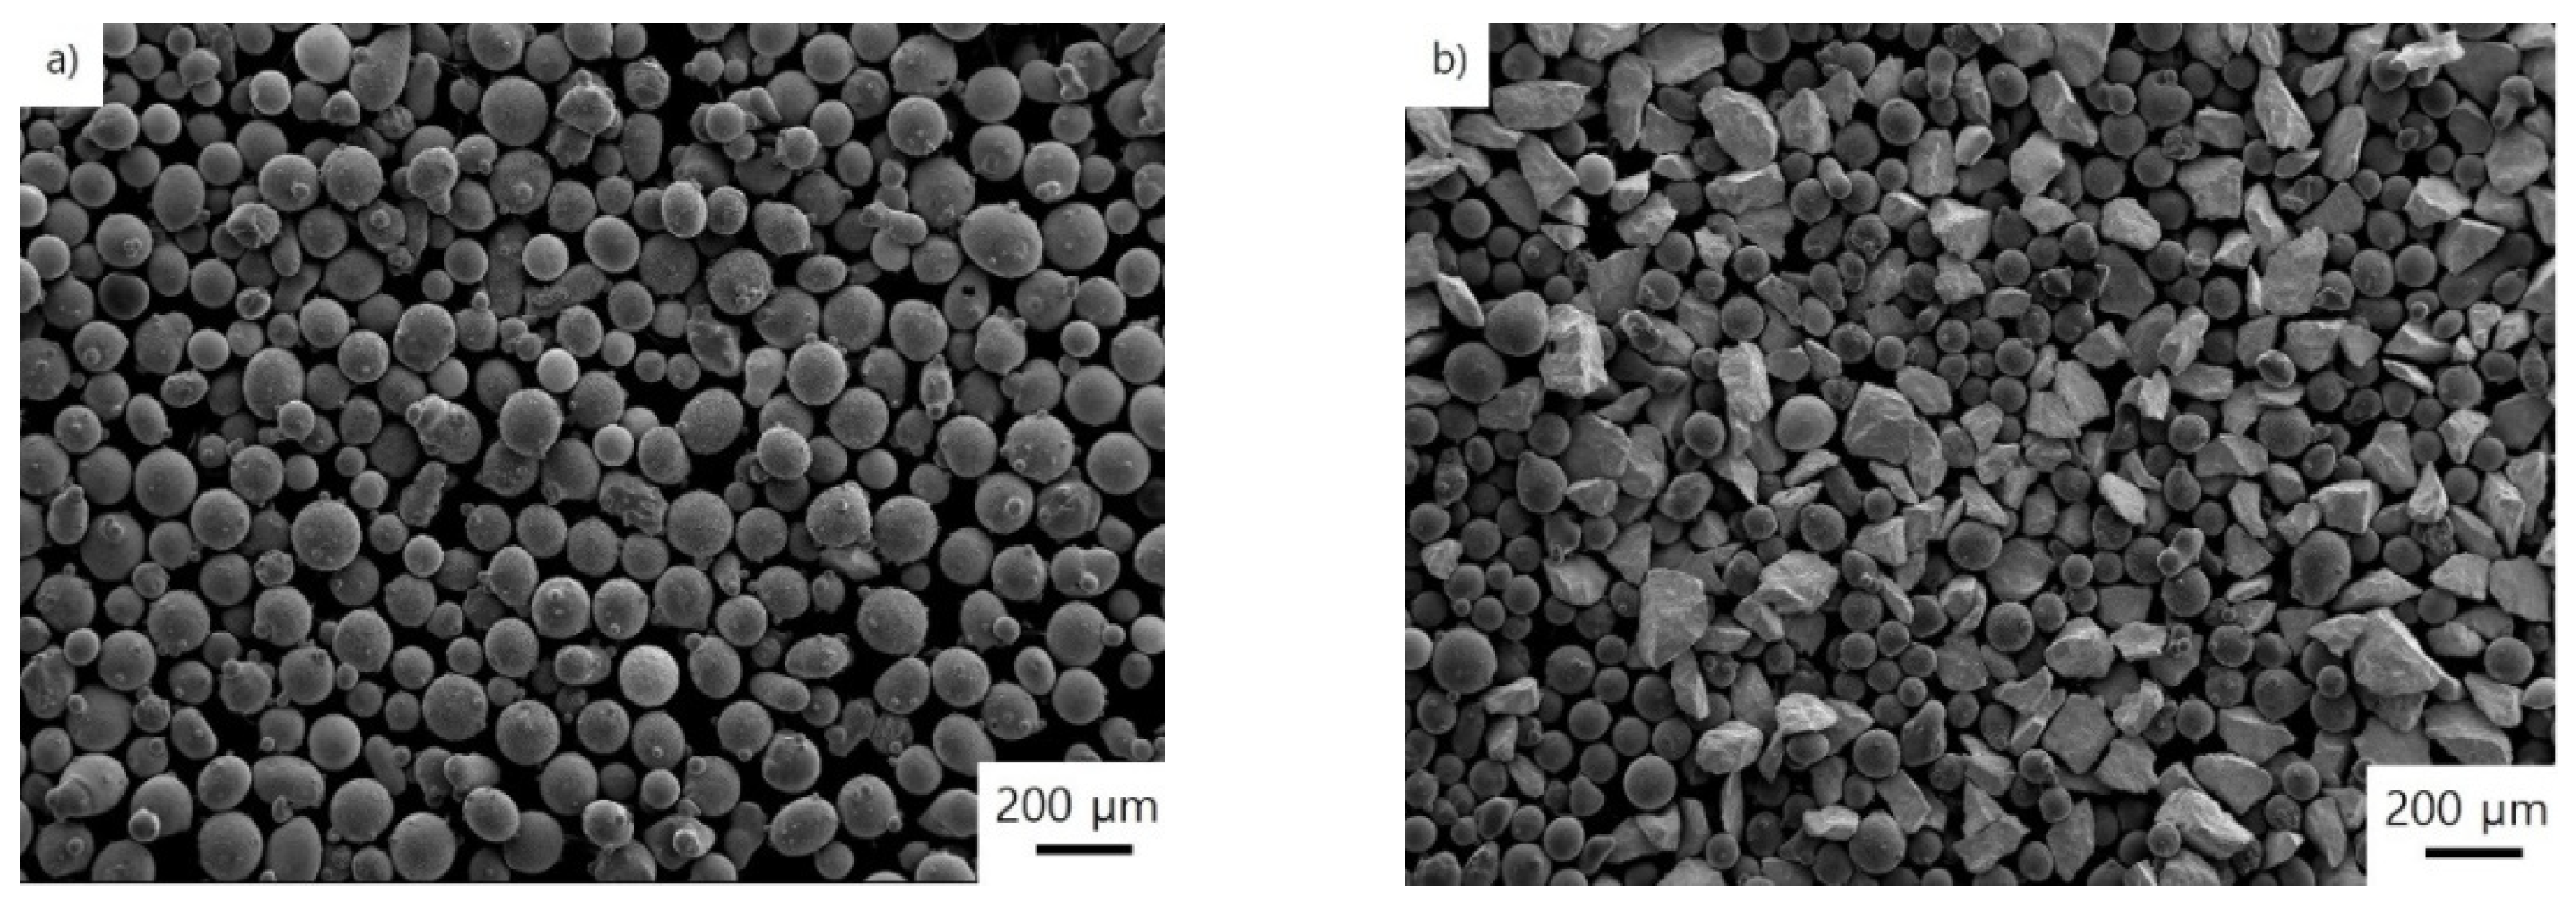
Plasma transferred arc welding was performed with tungsten carbide (WC) powders on a SS400 mild steel substrate. Three types of WC powders (spherical, fused angular, and a mix of spherical and fused angular powders) were used in this study and presented in Figure 1 and Table 1. An iron-based hard metal powder containing 14 wt % vanadium and 6 wt % chromium was also applied as a binder metal, because it has superior hardness compared to that of the conventional binder metals. The chemical composition of the binder metal powder is given in Table 2. The mass proportion of WC to the binder metal is in the range of 40–60%. The authors manufactured 15 types of specimens according to both the WC morphology and the quantity of WC used. Details about the specimens are listed in Table 3.
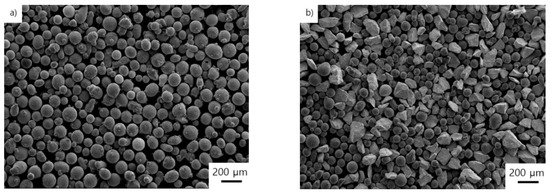
Figure 1.
SEM images of tungsten carbide types: (a) spherical and (b) mix of spherical and fused angular powders.

Table 1.
Type and size of WC powder used in this study.

Table 2.
Chemical composition of binder metal powder (mass %).

Table 3.
Specimen classification and composition of WC and binder metal (mass %).
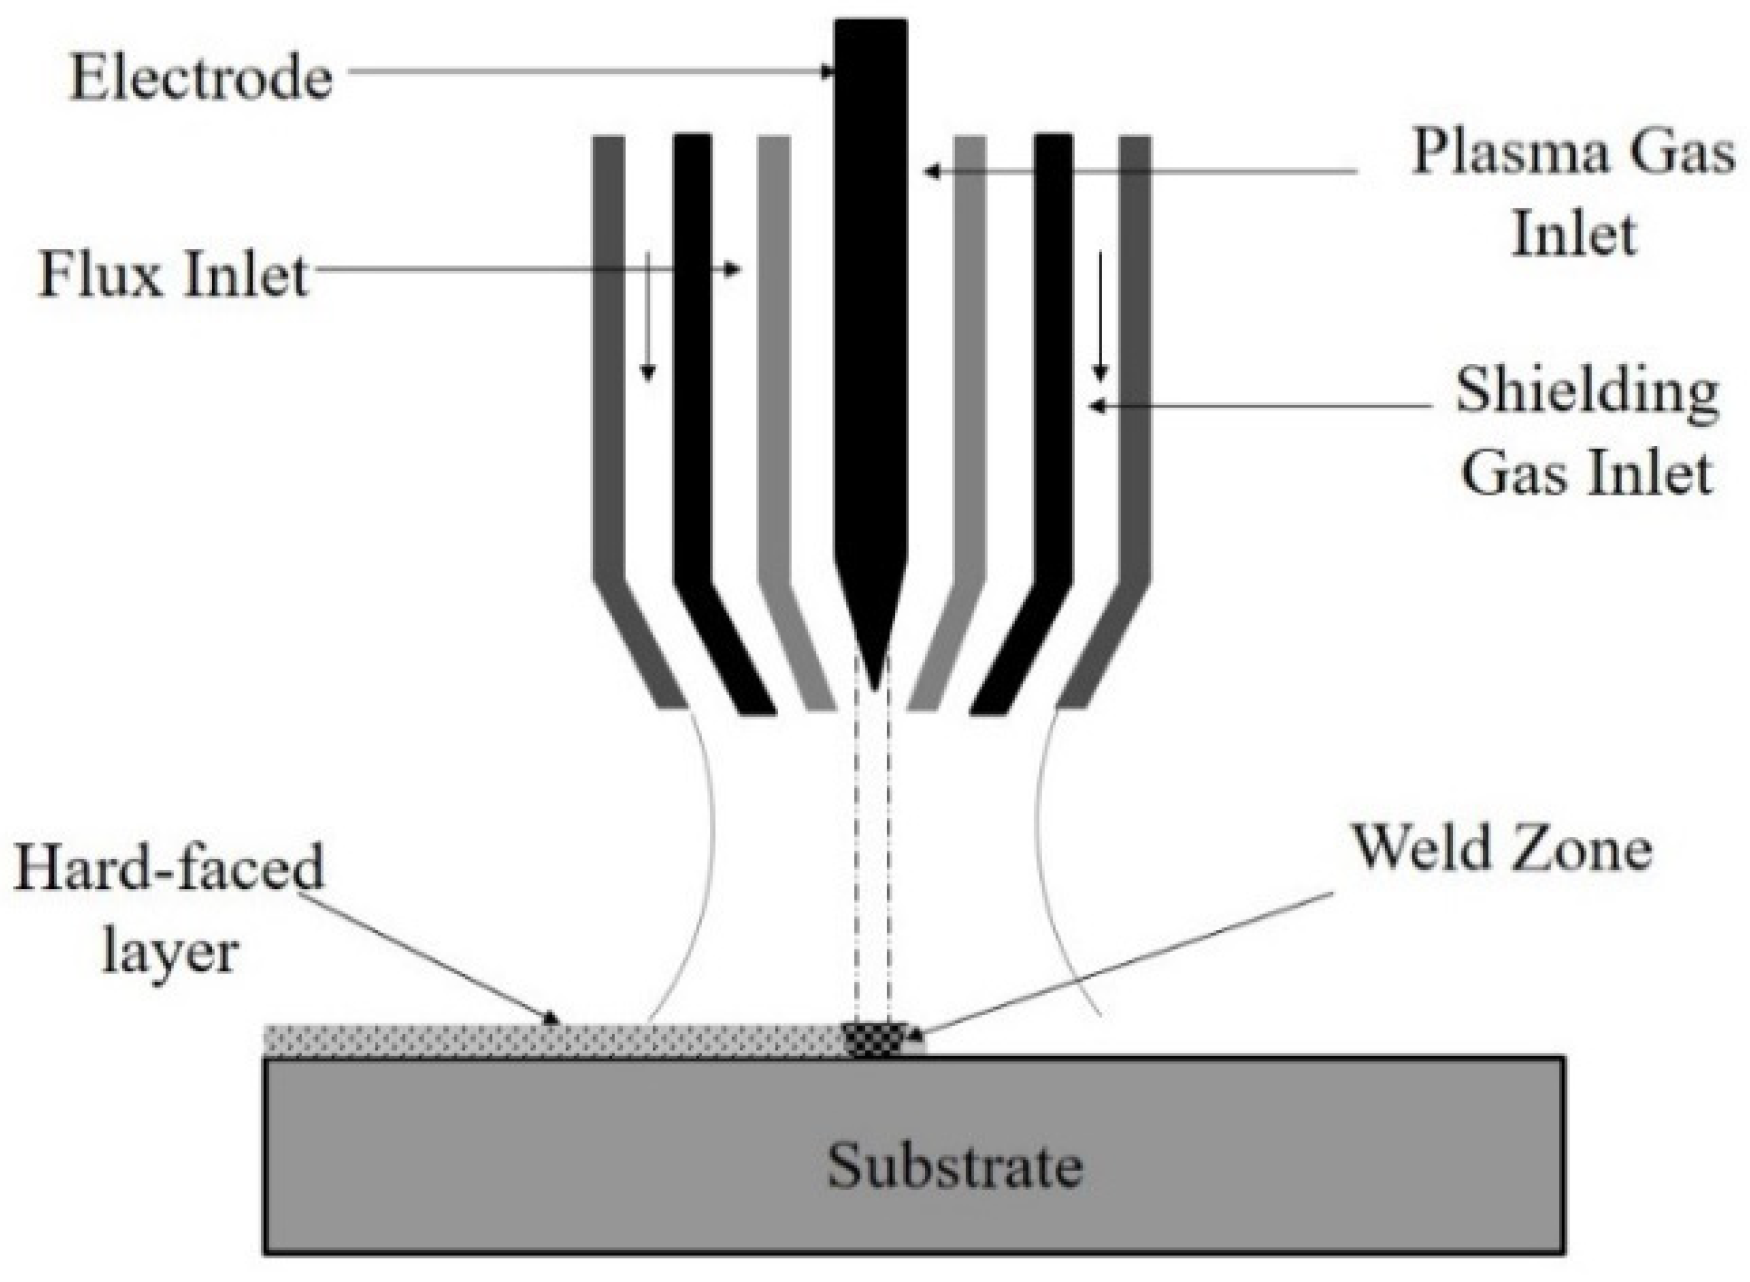
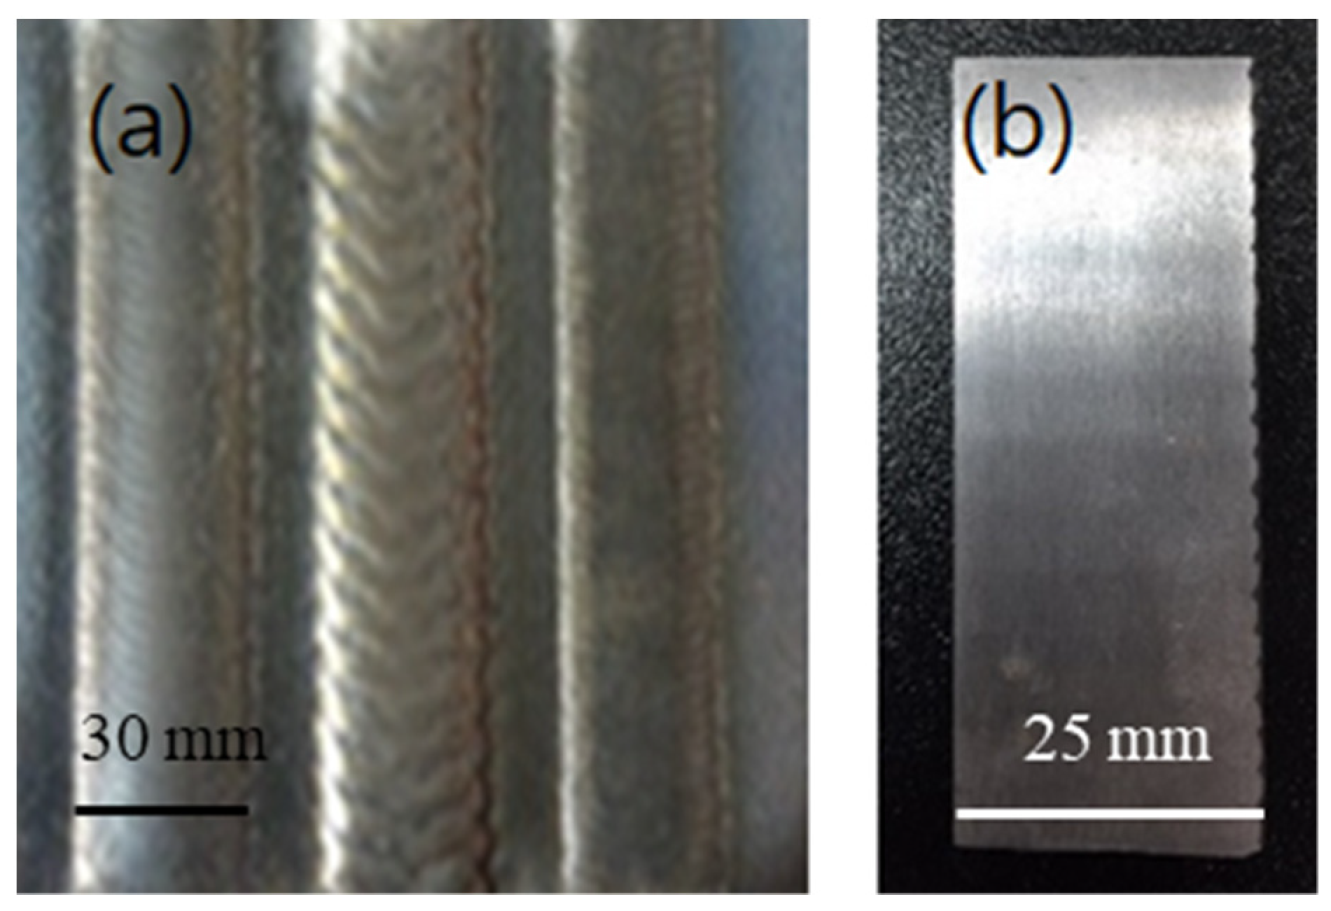
A schematic representation of the PTAW process is shown in Figure 2. PTAW was performed using a DAIHEN FD-V8 robot (OTC DAIHEN, Inc., Gurugram, India), DURUM Durweld 300T PTA controller (Commersald, Modena, Italy), Powder Feeder PFU 4 (Commersald, Modena, Italy), and PTA Torch PT 300AUT (Commersald, Modena, Italy). Through a preliminary experiment, optimal process conditions (voltage, current, weaving speed, powder feed rate, welding speed, and argon shielding gas flow rate) were successfully obtained for the welding of a 4 mm thick overlay with two layers, and the details are listed in Table 4. The substrates were pre-heated below and/or around 100 °C through torching before PTAW. Figure 3a shows the specimen prepared by PTAW. The specimens were allowed to cool at room temperature and then machined for a dry sand wheel abrasion (DWA) test, as shown in Table 3b. The specimens were cut to standard dimensions (75 mm long × 25 mm wide × 10 mm thick) for the DWA test (ASTM G65-Procedure A, ASWA-ENA-04, engineerdata.net, Cheorwon-gun, Korea); dry sand rubber wheel apparatus). The load of 130 N was applied on the wheel, and Ottawa silica sand in a 50/70 mesh size (212–300 µm diameter particle size) was used [14]. The test surfaces were machined at the position of 1.0 mm (bottom region) away from the interface between the substrate and the hardfacing layer. For additional tests to observe and evaluate the effect of position in depth on wear property, the test surfaces were also machined at the position of 2.0 mm (top region) away from the interface. The abrasion test was conducted according to the ASTM G65 standard. The quantity of wear was measured using an electronic weighing scale (Shimadzu, AUW220D, Kyoto, Japan) over six intervals, every 5 min. A Rockwell hardness digital tester (Daekyung, DTR-300N, Incheon, Korea) was used to measure the hardness of each surface with a load of 150 kgf and 10 s of dwell time. An X-ray diffractometer (D/MAX-2500, Rigaku, Tokyo, Japan) was used with a 4°/min of scan speed to identify phases in materials.
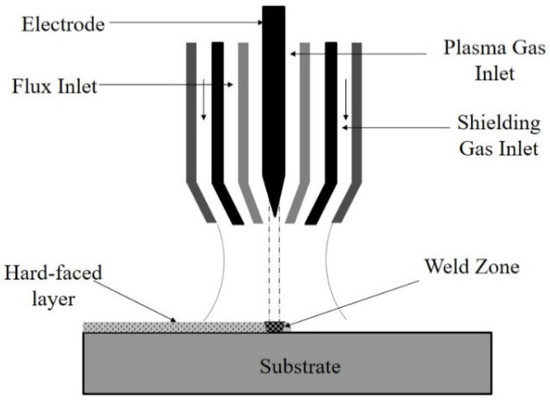
Figure 2.
Schematic illustration of the PTAW process.

Table 4.
PTAW process parameters.
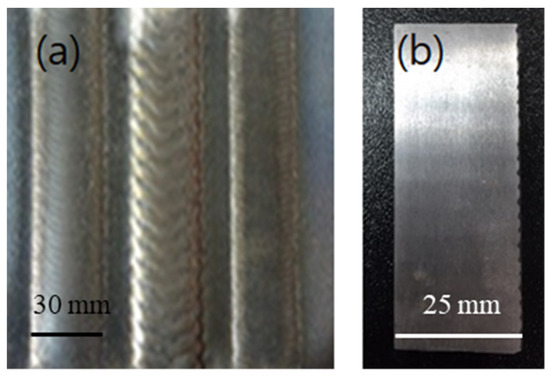
Figure 3.
Hardfaced specimens manufactured by the PTAW process: (a) as welded, (b) machined with ASTM G65.
The specimens were polished using sand papers and diamond paste, and then etched using Murakami’s reagent. The microstructure of the specimens was precisely observed using scanning electron microscopy (SEM, JEOL, JSM-7100F, Tokyo, Japan). Energy dispersive X-ray spectrometry (EDS) analysis was also conducted by Aztec software (version 3.3, Oxford Instrument, High Wycombe, UK). The quantitative analysis of the microstructure was performed by the intercept method at five different positions, for three different overlay thicknesses for statistical evaluation. The formation of intermediate layer between WC and binder metal was observed in detail.
3. Results
3.1. Formation and Growth of Intermediate Phases (IPs) in the Hardfacing Layer
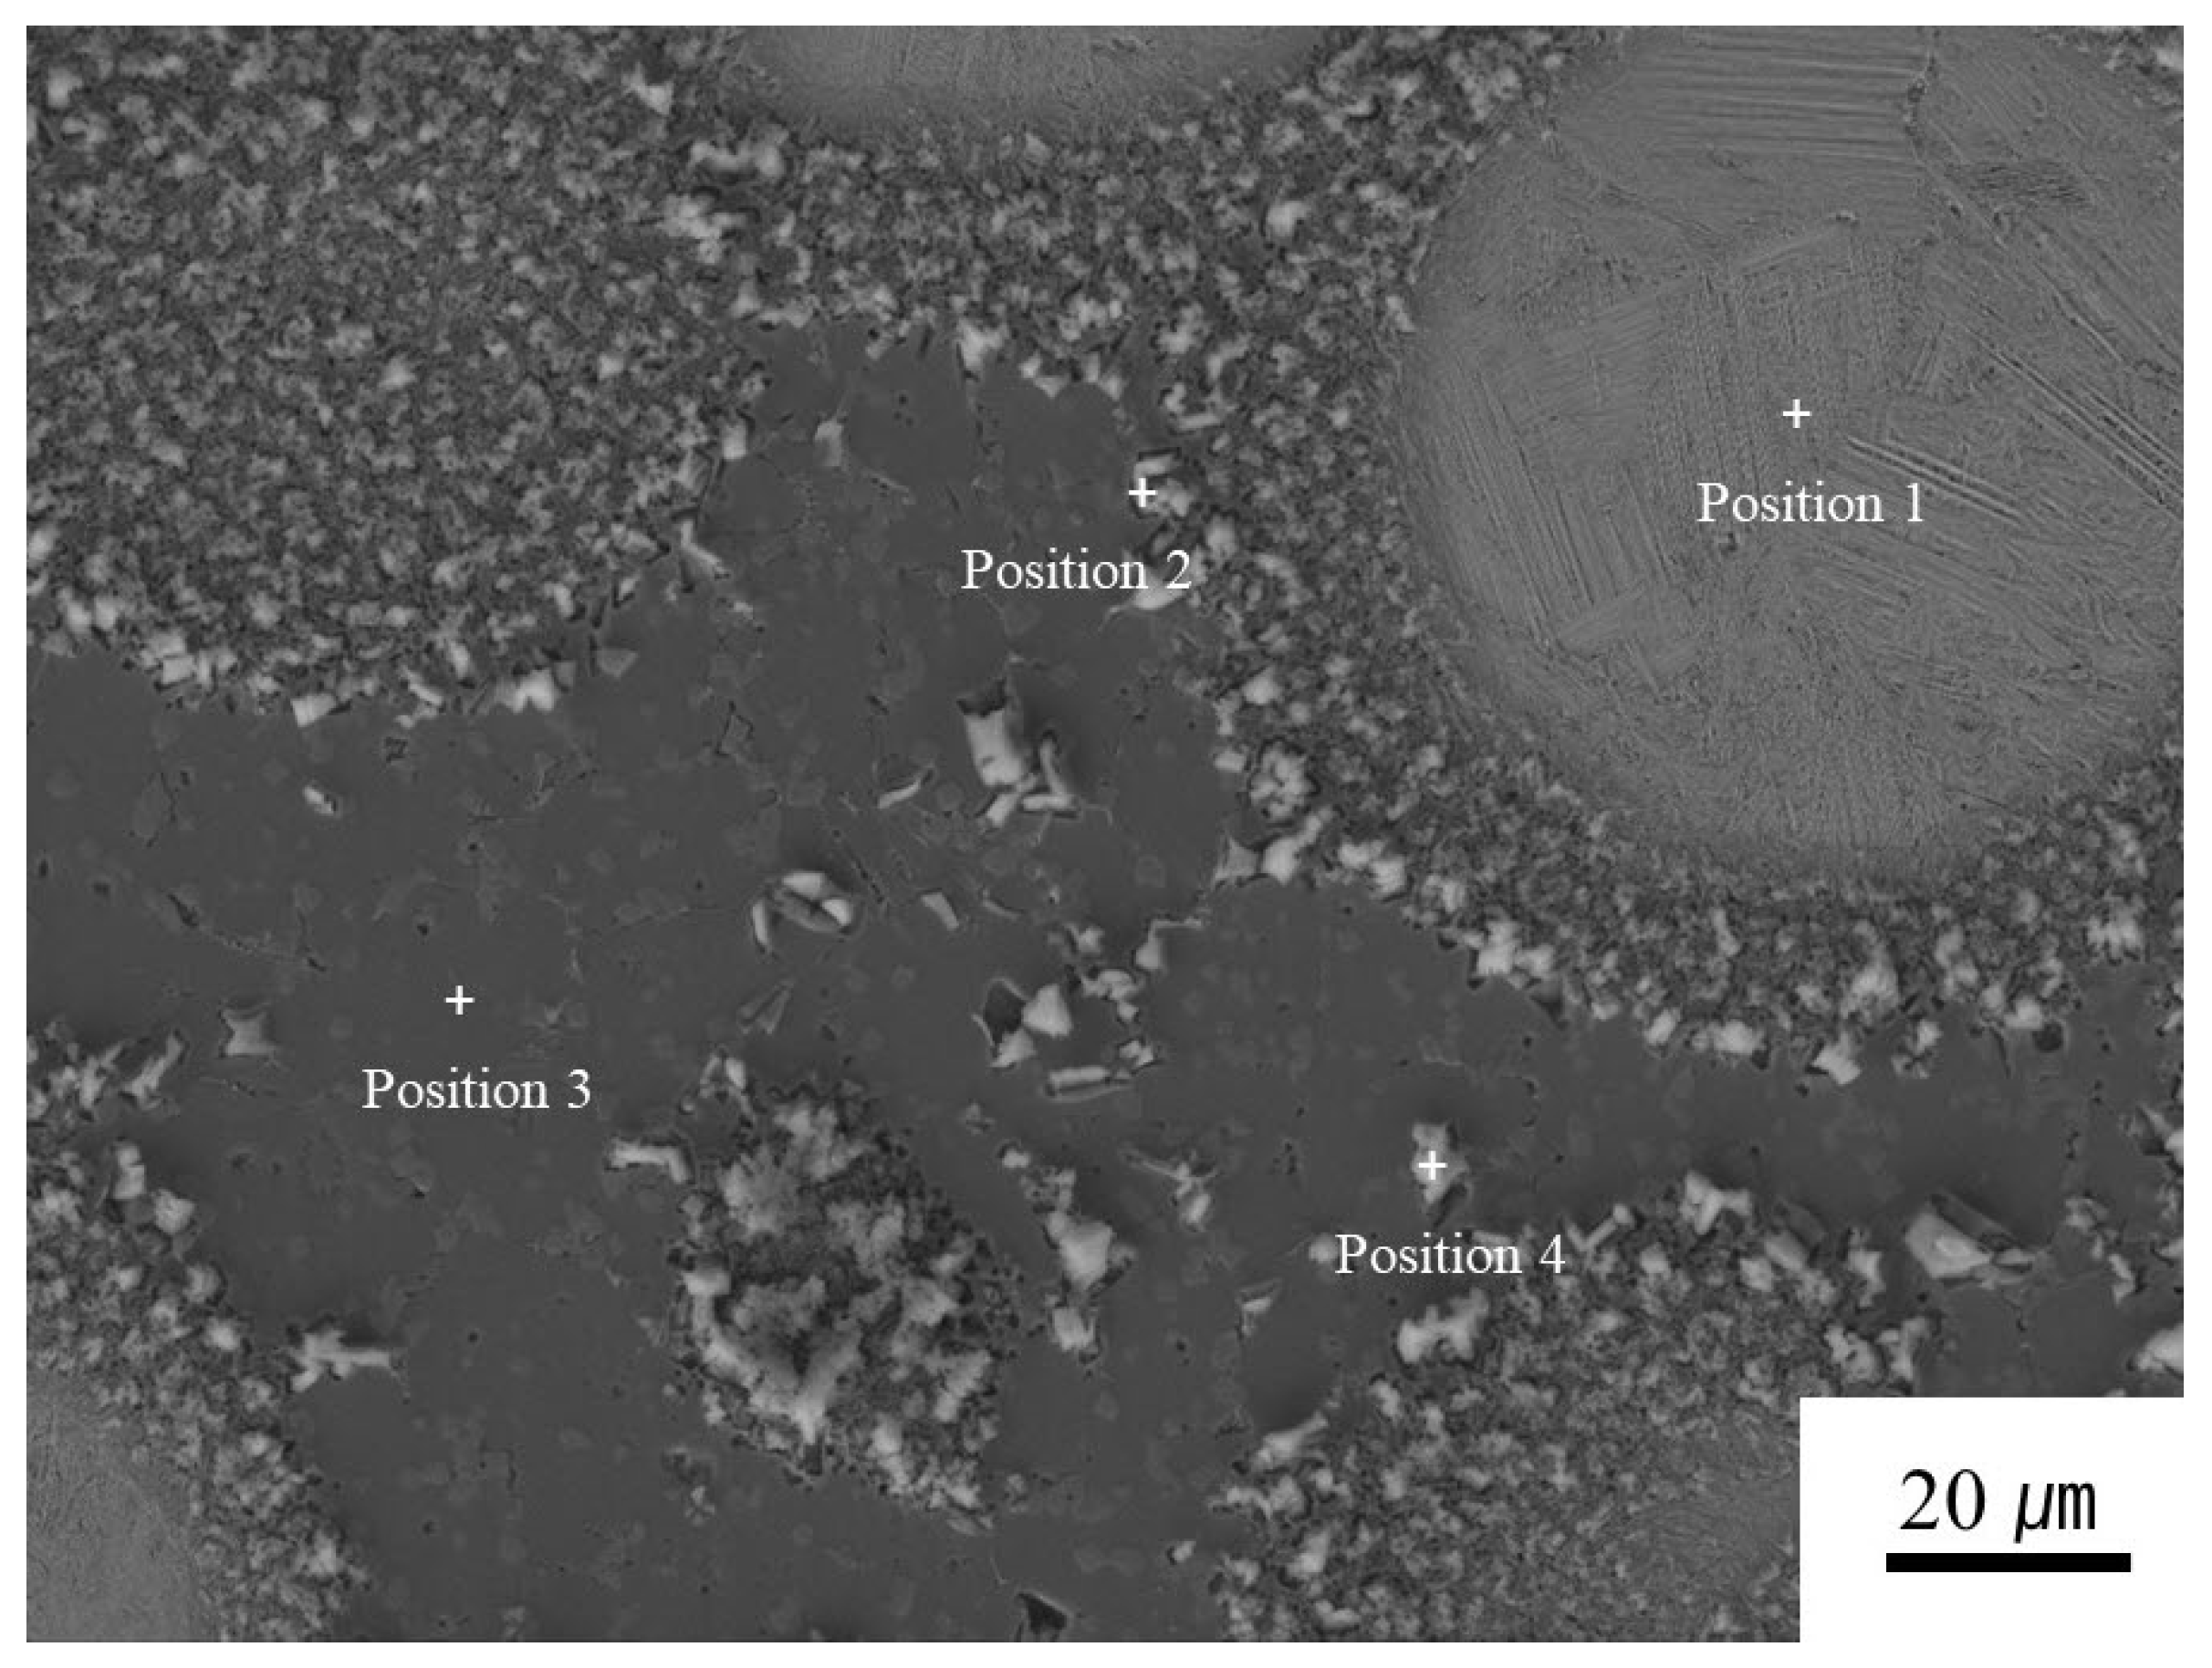
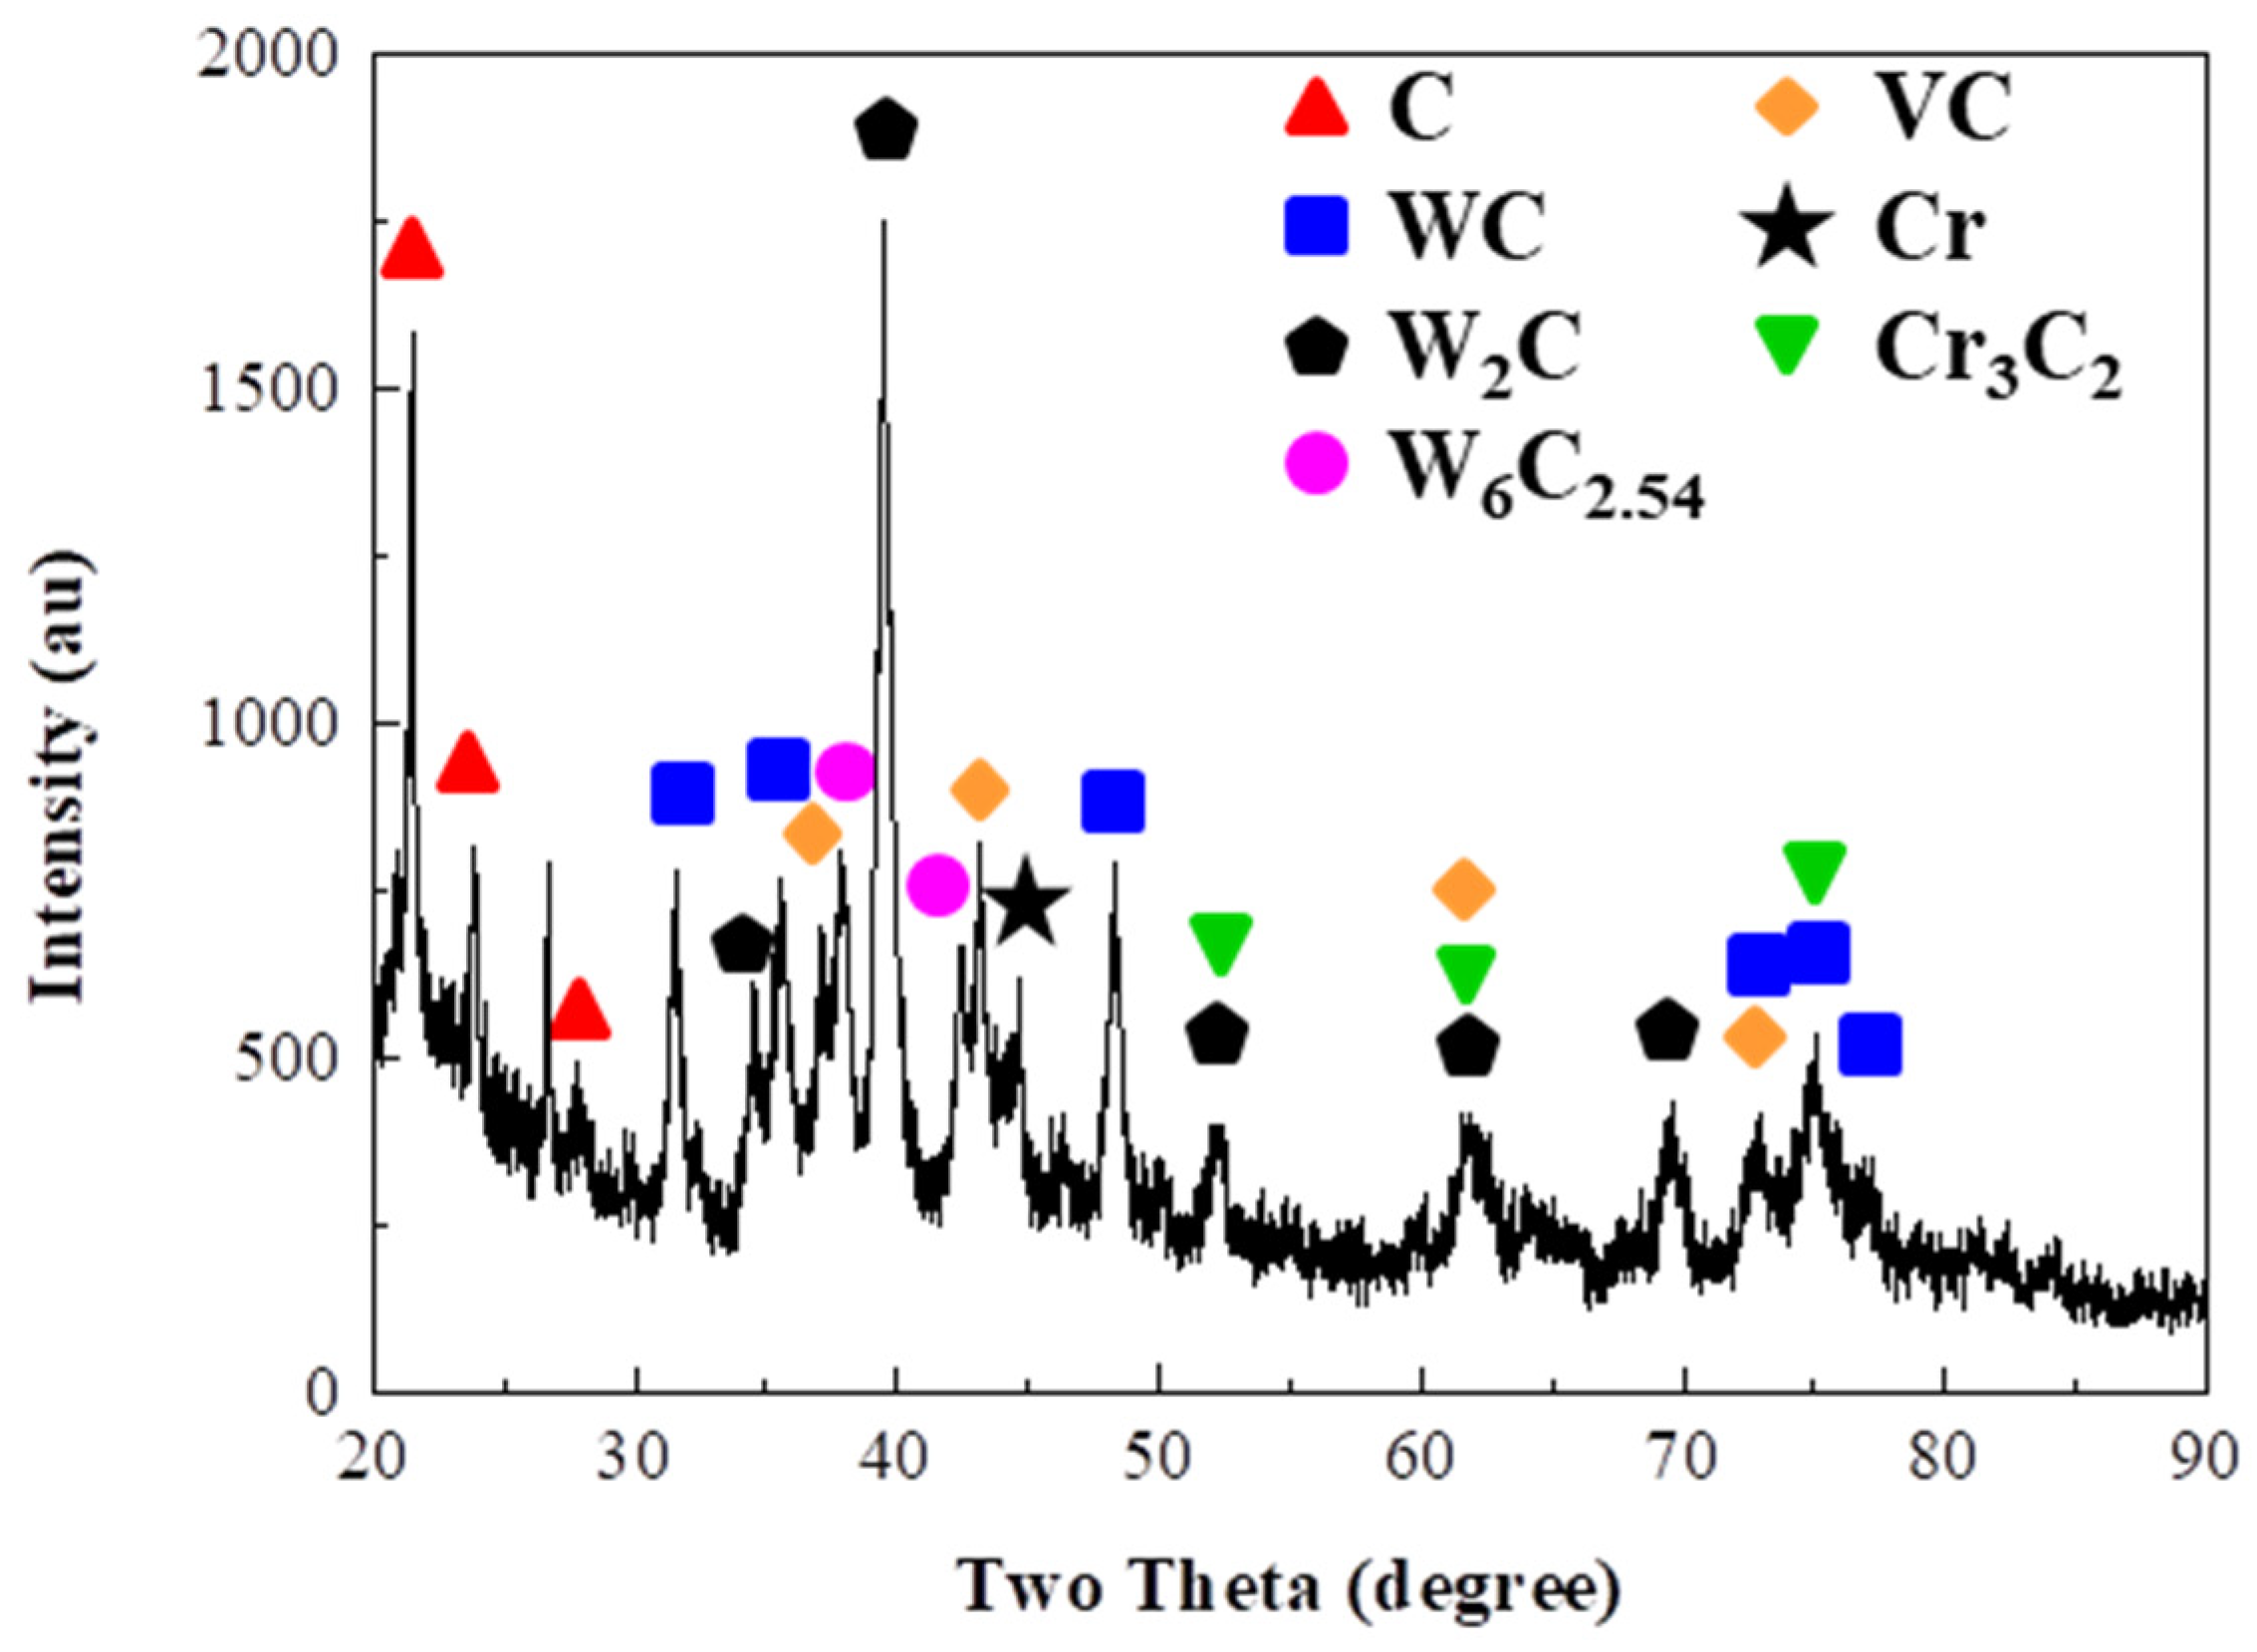
Figure 4 shows an SEM image for a part of the hardfacing layer fabricated using spherical WC powder. This visual field consists of four areas. The circular region (Position 1) with bright contrast corresponds to WC. The flat region (Position 3) with dark contrast equivalent to the binder metal consists of vanadium, chromium, carbon, and iron. A large number of small protrusions (Position 2) around the WC and isolated ridges (Position 4) in the binder metal are intermediate phases (IPs) containing tungsten, carbon, iron, vanadium, and chromium newly formed during solidification and cooling after the PTAW process. The results of the FE-SEM EDS analysis for each region are listed in Table 5. As expected, only tungsten and carbon were detected at the center of Position 1. Iron, carbon, vanadium, and chromium were detected at Position 4 of the binder metal. However, manganese and silicon originally in the binder metal were not detected. As reasons for this, the authors suggest two possibilities. One is that the quantity of those elements in the binder metal is very small (just one mass percent). The other is that both elements were consumed during formation of the isolated ridge-like IPs in the binder metal region. This is persuasive, considering the results of the EDS analysis in Table 5. Cr- [14,15] and V- [16] containing particles were identified after PTAW. XRD results as shown in Figure 5 indicate that various phases, i.e., Cr- and V-containing phases were detected as well as WC. Further analysis is required to clearly identify new IPs. The small protrusion-like IPs around the WC are mainly tungsten, while the isolated ridge-like IPs in the binder metal are mainly made up of iron. The two types of IPs commonly contain vanadium, chromium, and carbon because the binder metal had the same elements. As a result, it was revealed that the hardfacing layer consists of WC, a binder metal matrix, and two forms of IPs (tungsten-rich IPs around the WC and iron-rich IPs isolated in the binder metal). The authors also believe that the tungsten-rich IPs formed and grew by diffusion of WC at the interface between the solid WC and liquid binder metal during the PTAW process (which involves melting, solidification, and cooling). It suggests that the iron-rich IPs could be precipitated in the binder metal throughout the entire solidification and cooling process.
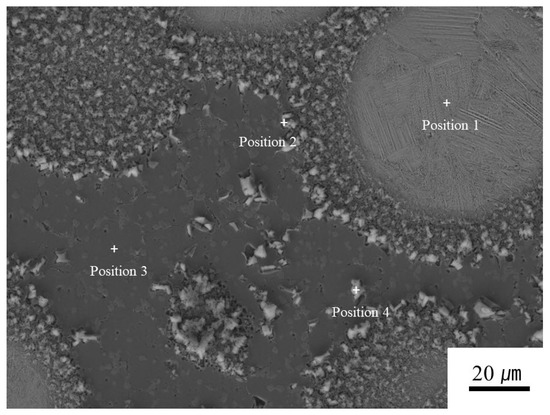
Figure 4.
SEM bright field image of the tungsten carbide, binder metal, and intermediate phases in the hardfacing layer of SWC60 sample.

Table 5.
EDS analysis results for the four positions marked in Figure 4 (at %).
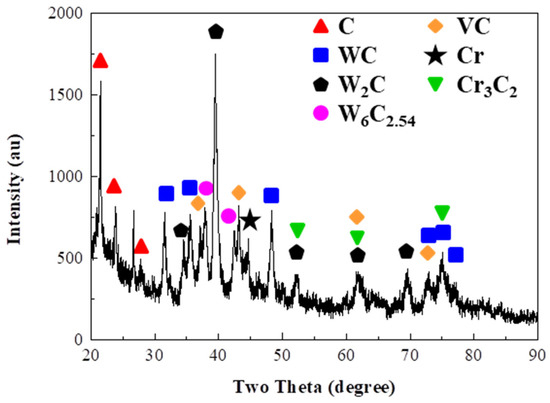
Figure 5.
XRD pattern of the SWC60.
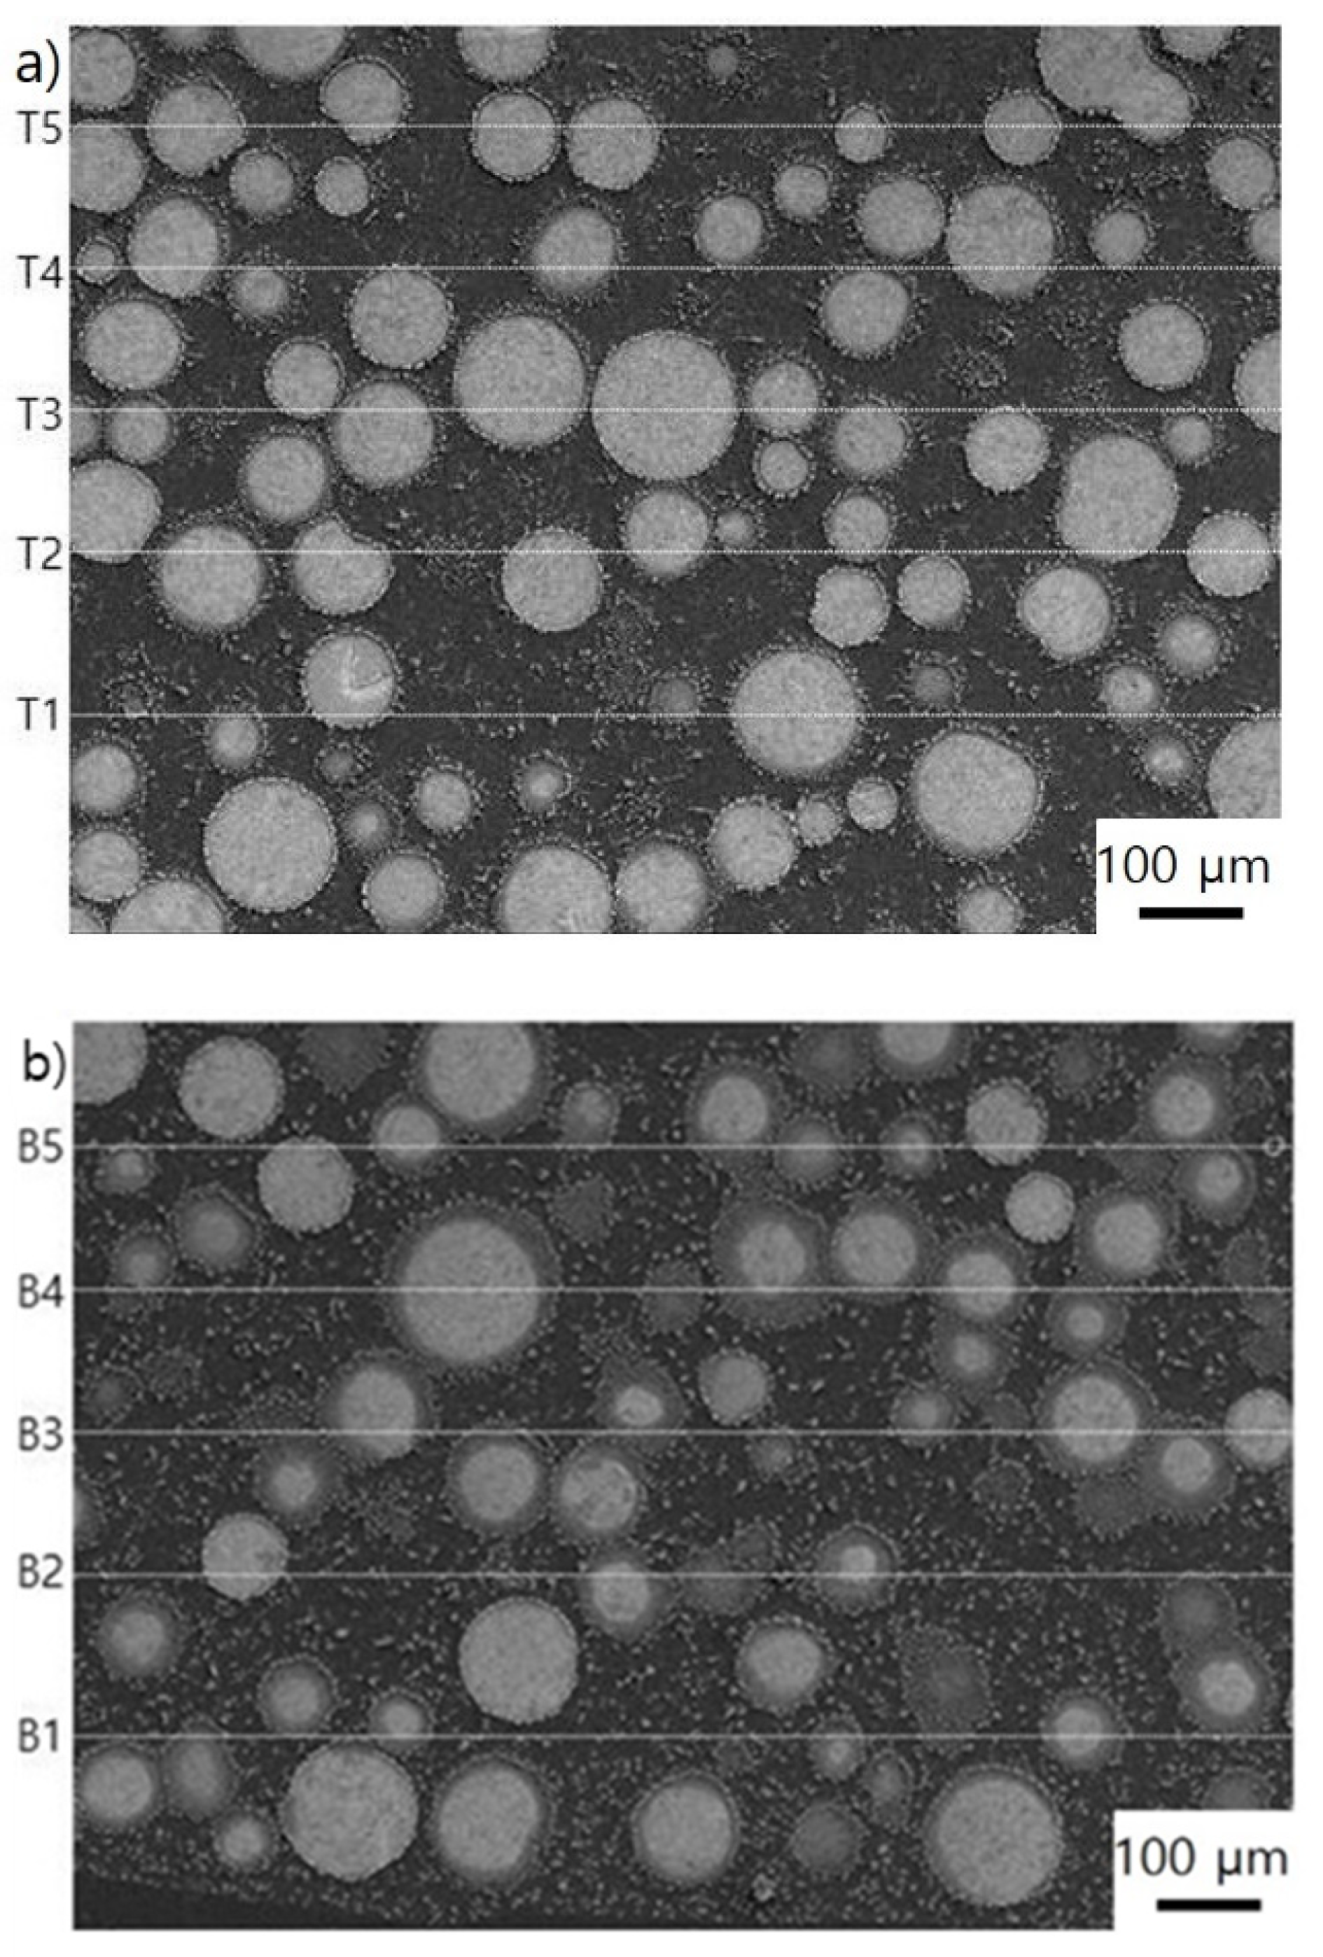
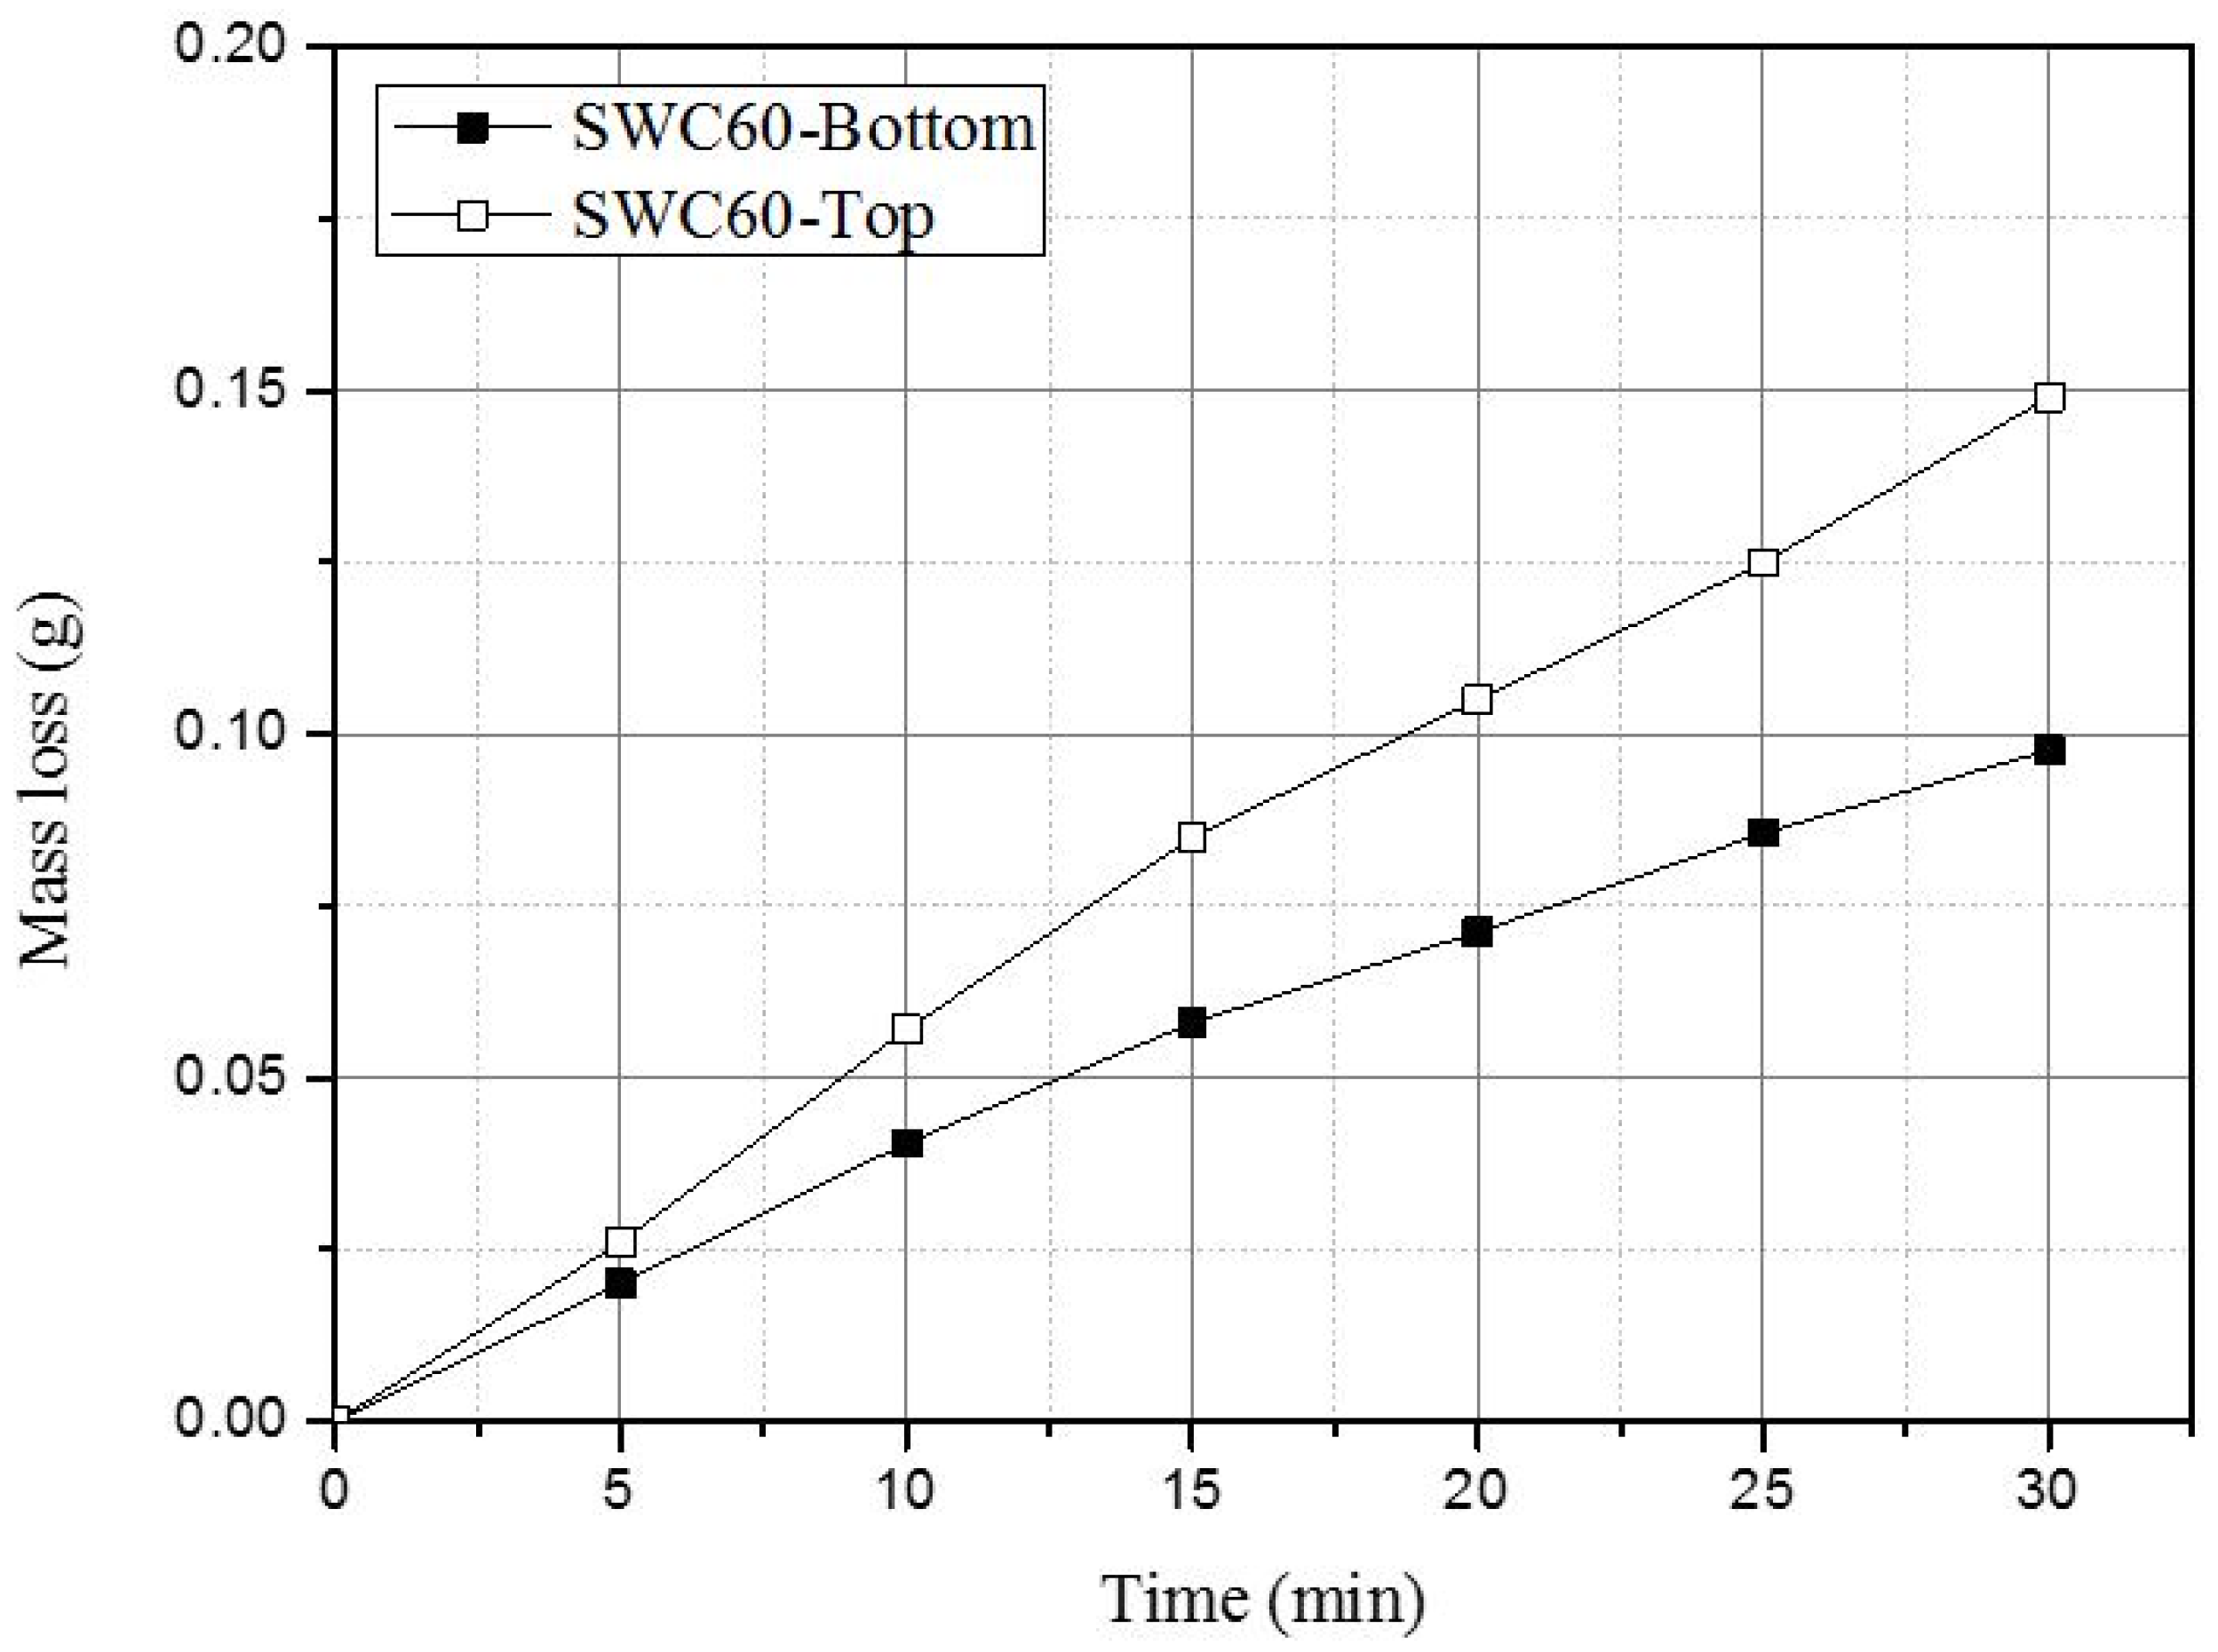
The thermal histories may differ between their depths in the hardfacing layer, even for the same sample. It also has an effect on the microstructure formation such as intermediate phases formed around the WC powders in the hardfacing layer. The authors observed the microstructure at the top (rapid cooling) and bottom (slow cooling) region in the same layer, and also confirmed microstructural behavior through measurement of the volume fraction of each area. Figure 6 shows SEM images for the distribution of the WC powders, the IPs formed at the interface between WC and binder metal, and the binder metal matrix in the hardfacing layer of the SWC60 specimen. Even if it is similar overall, the IPs bands’ structure shows a decided difference. The thicker IPs bands were formed at the bottom region. The results of volume fraction measurement of each area are listed in Table 6. At the top, the volume fraction of the IPs bands is smaller by 14.4%, while that of the binder metal matrix is relatively larger (by 52.2%). In contrast, at the bottom, the volume fraction of the IPs bands is higher (30.1%), while that of the binder metal matrix is less (46.6%). This clearly reveals that the fraction of the WC powders, the IPs bands, and the binder metal matrix varies according to their depth and that is has a different thermal history, though the same hardfacing layer. This also suggests that wear resistance could be varied by its depth, even if in the same hardfacing layer. To confirm this, the authors conducted DWA tests for two specimens prepared from the same hardfacing layer of a SWC60 sample. The surfaces of the two specimens were processed at the position of 1.0 mm (bottom region) and 2.0 mm (top region) away from the interface between the substrate and the hardfacing layer. The results are shown in Figure 7. Both the abrasion rate and wear amount at the top specimen was higher than those of the bottom specimen, while the mass loss increased linearly with increments of test time in both specimens. We believe that the slow cooling rate in the bottom region brings about the growth of the IPs bands formed between solid WC powder and liquid binder metal matrix based on diffusion, during the PTAW process.
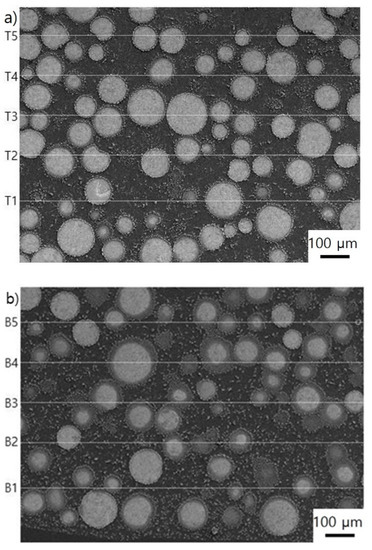
Figure 6.
SEM images of the distribution of tungsten carbide powder, intermediate phase layer between tungsten carbide and binder metal matrix, and binder metal in the hardfacing layer of SWC60. (a) Top region, (b) bottom region. Top and bottom regions indicate 2.0 mm and 1.0 mm position away from the interface between substrate and hardfacing layer, respectively.

Table 6.
Volume fractions of tungsten carbide powder, intermediate phase layer between tungsten carbide and binder metal, and binder metal in the hardfacing layer.
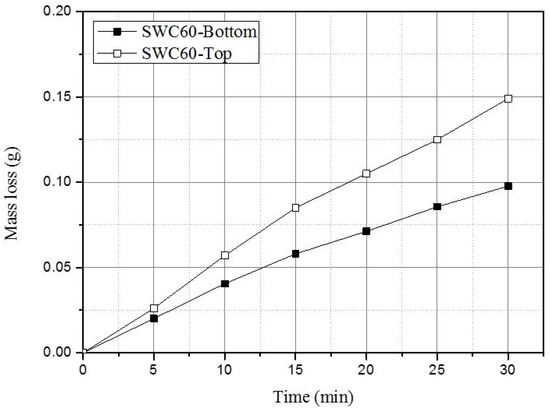
Figure 7.
Dry sand wheel abrasion test results for the top and bottom regions in the same hardfacing layer of SWC60 sample.
3.2. Effect of WC Morphology on the Mechanical Properties of the PTAW Hardfacing Layer
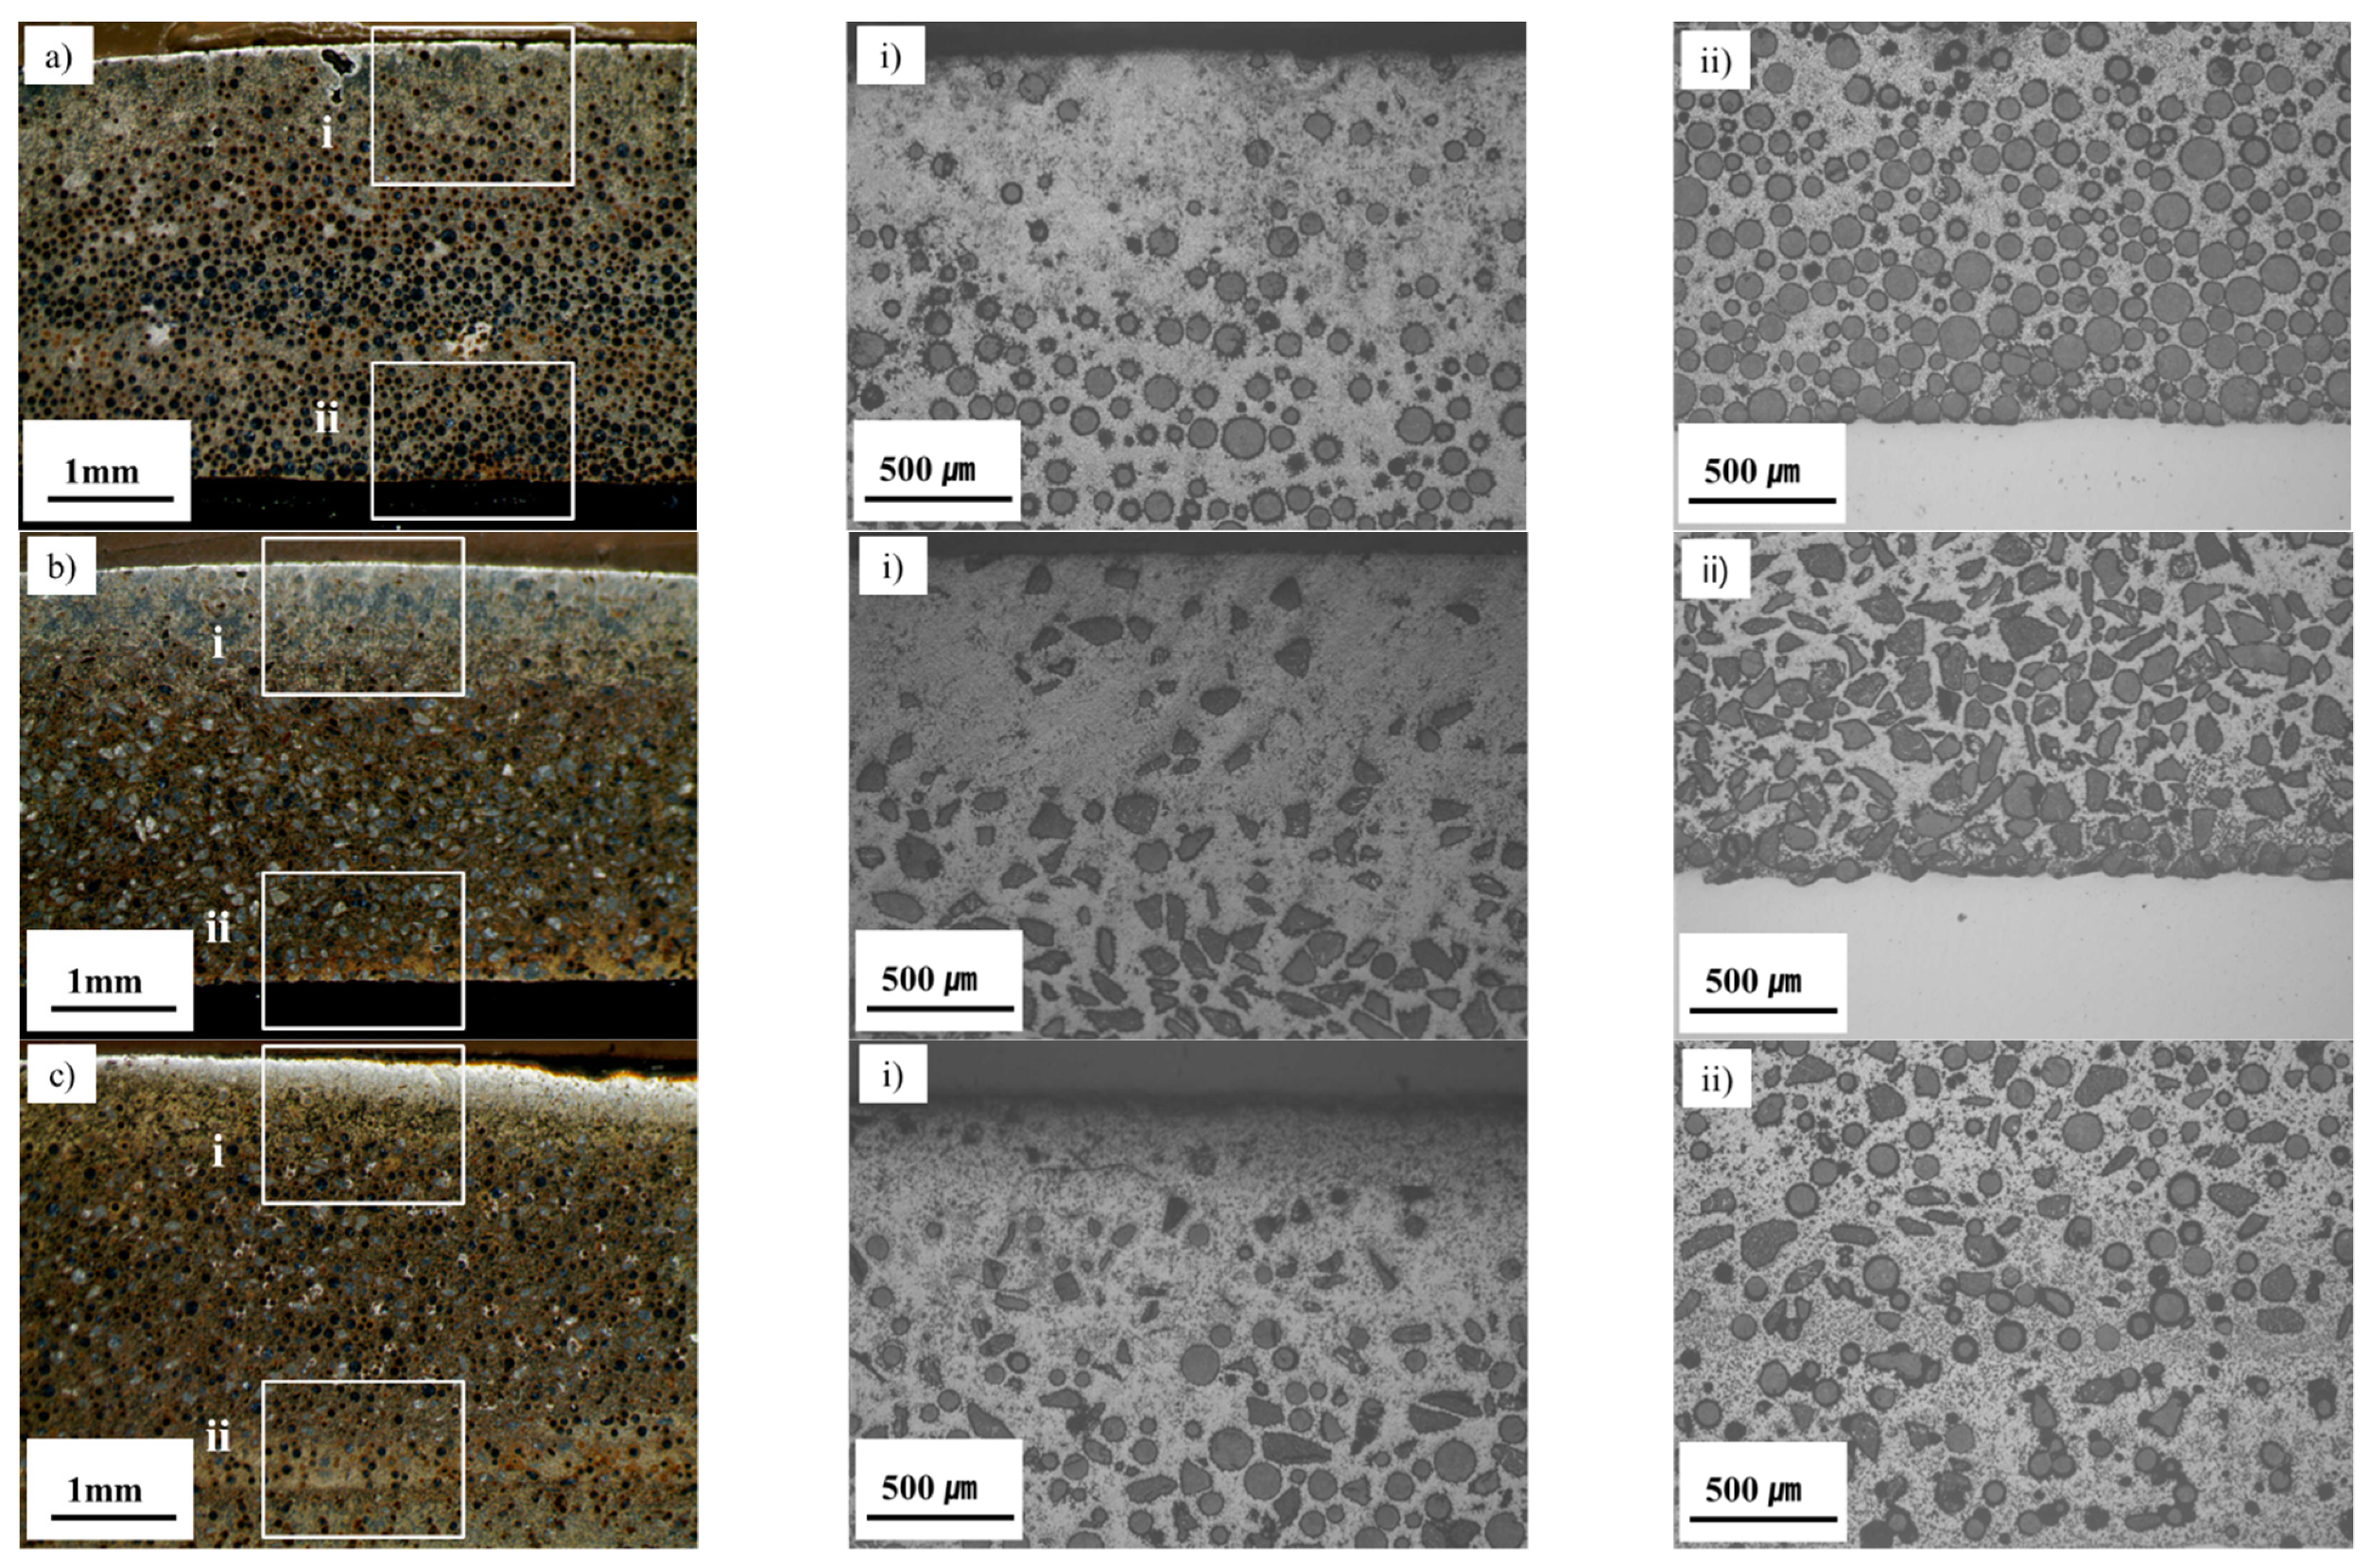
Hardfacing samples were successfully manufactured using the PTAW process, and optical microscope images of cross sections of the SWC60, FWC60, and MWC60 samples are shown in Figure 8. The thickness of the welded layers averages 4 mm, as shown in Figure 8a–c. This figure shows the heterogeneous distribution of the WC powder in the hardfacing layer. We observe that the WC powder tends to concentrate at the bottom of the hardfacing layer in all cases (as shown in each part ii in Figure 8). There is a lack of WC particles in the top region of the hardfacing layer, which can be observed in Figure 8 (in each part i). We believe that the WC particles go to the bottom of the hardfacing layer during the PTAW process because the specific gravity of the WC particles is greater than that of the melted binder metal. A top region with insufficient distribution of WC particles was machined to investigate the effect of WC morphology on the resulting mechanical properties.
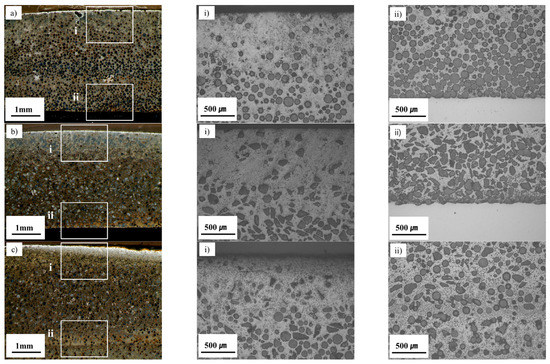
Figure 8.
Low magnification microscopic images of (a) SWC60, (b) FWC60, and (c) MWC60; (i) and (ii) are higher magnification microscopic images of surface and bottom (interface between hardfacing layer and substrate) regions, respectively.
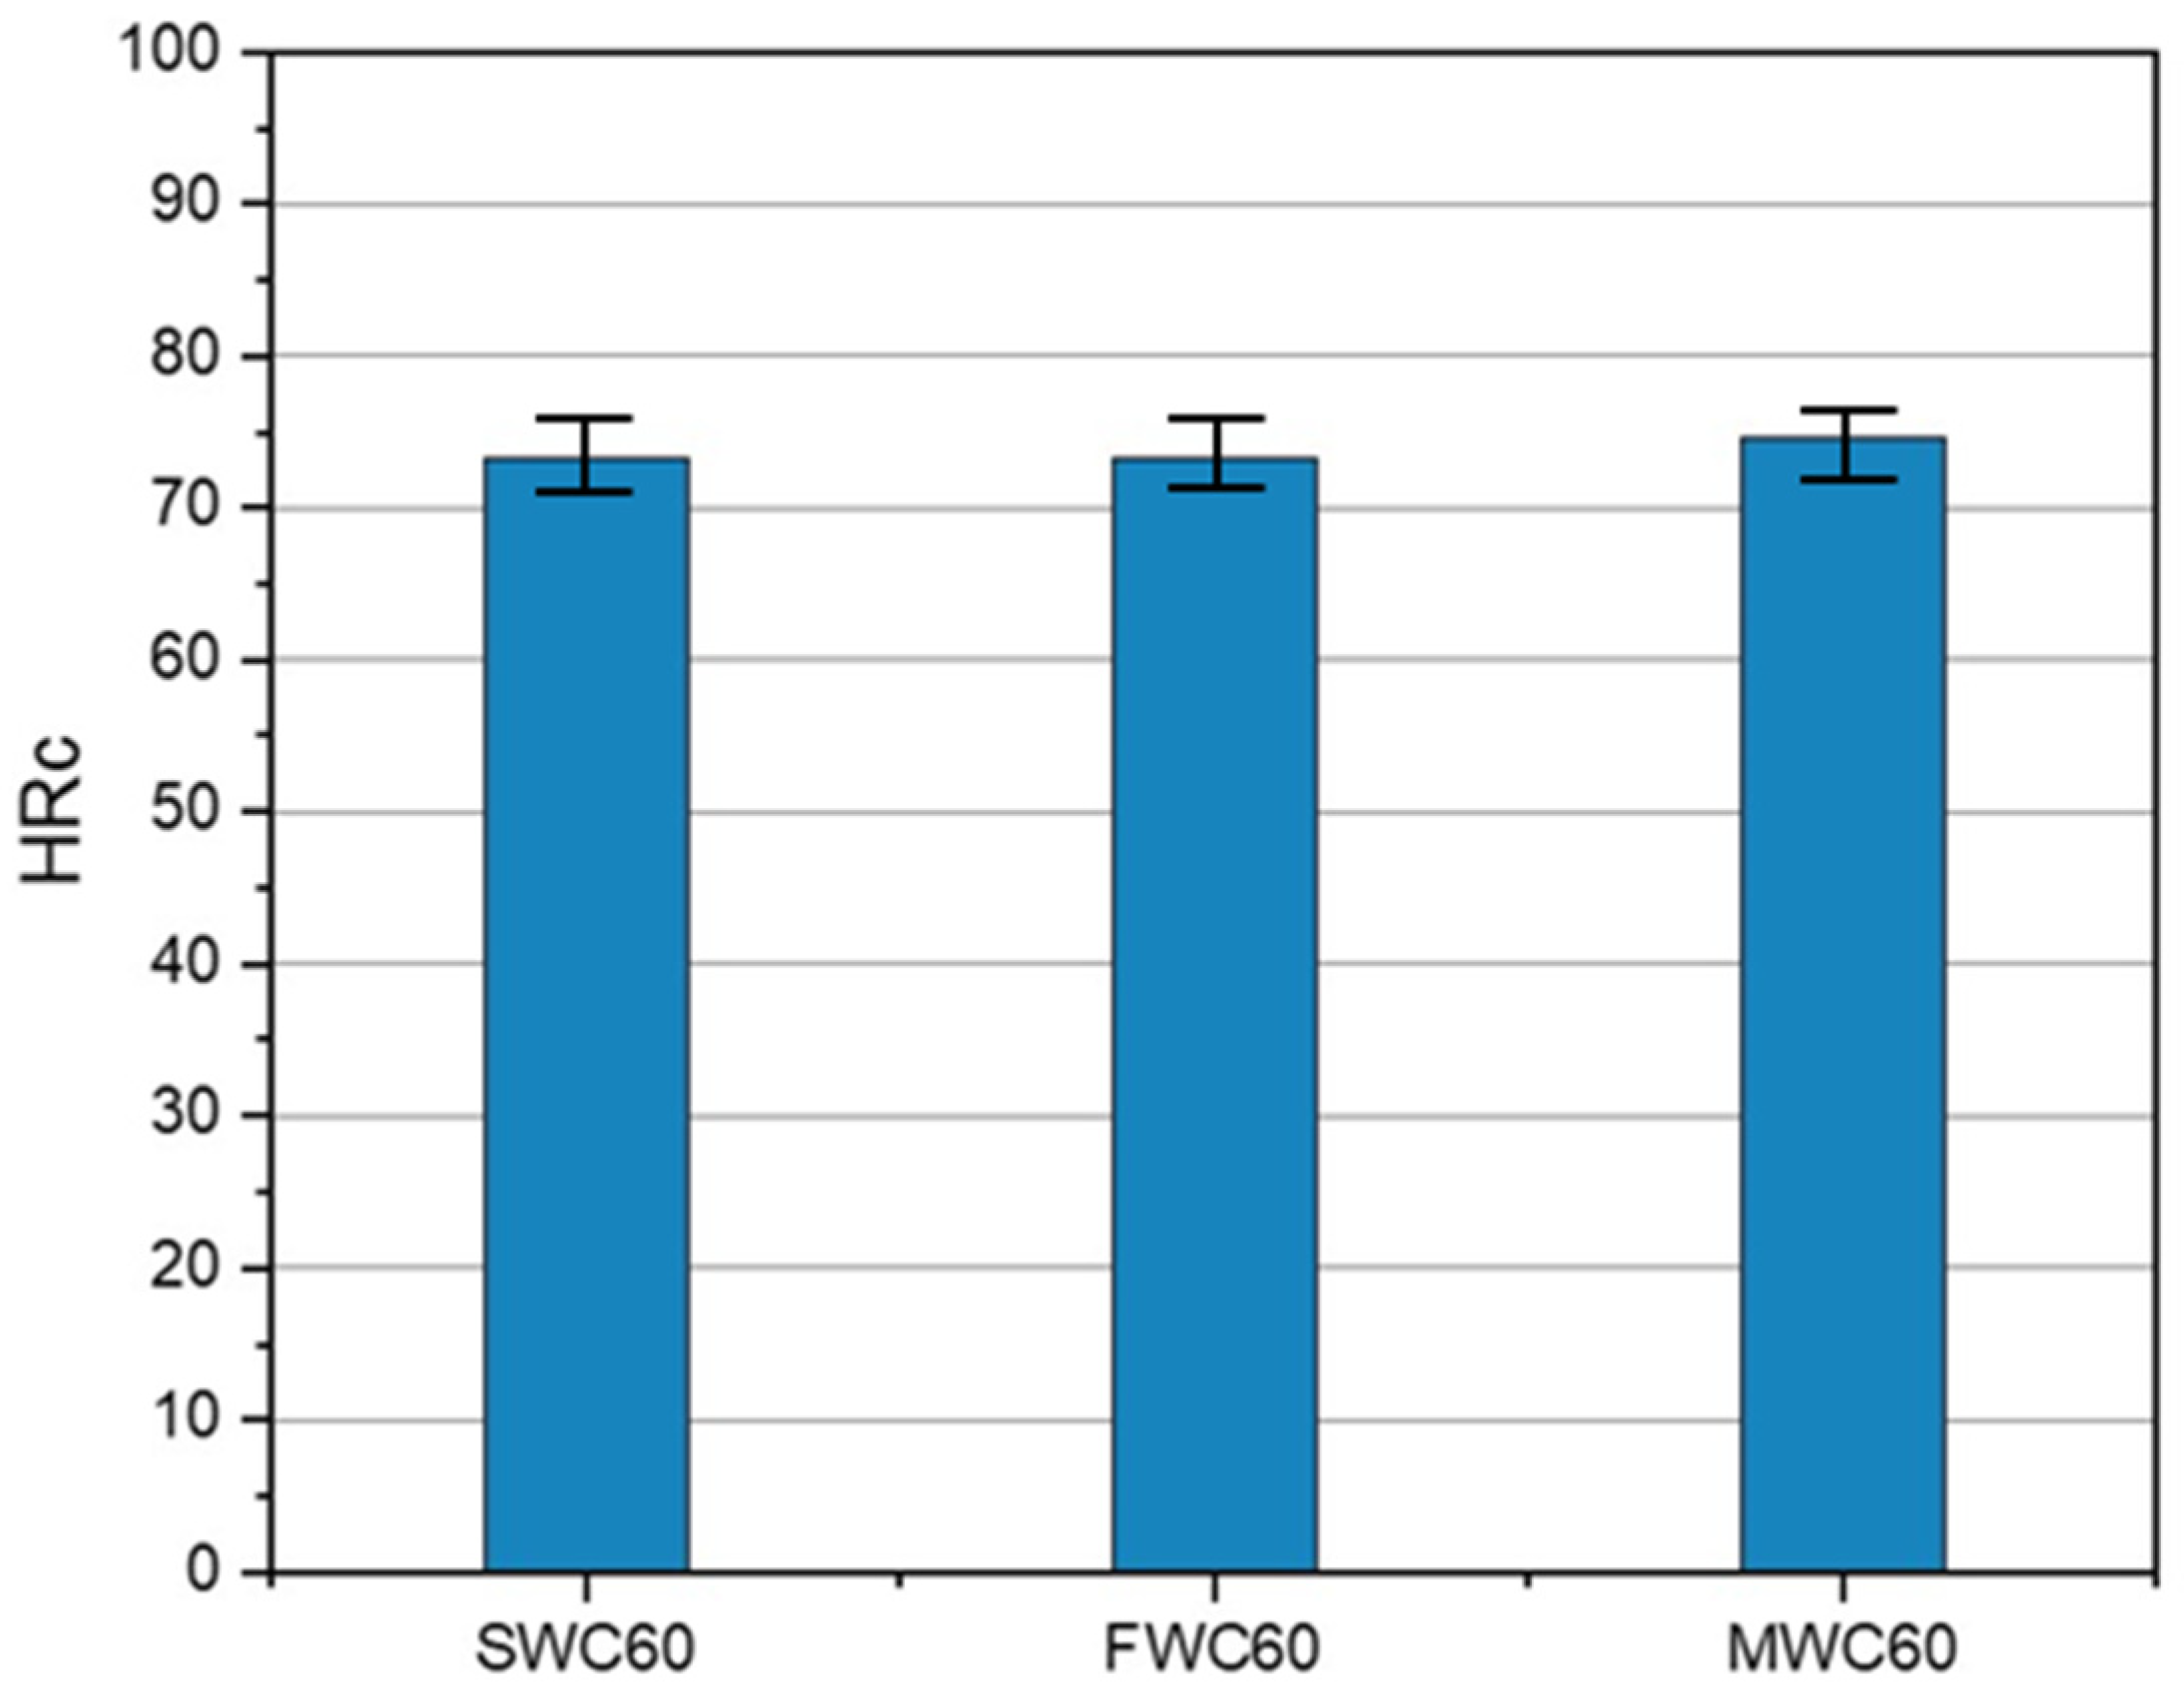
Figure 9 shows the results of the Rockwell hardness tests for the SWC60, FWC60, and MWC60 specimens. The Rockwell hardness values of the specimens were very similar (72–73 HRc) and meaningful differences were not found. This suggests that the hardfacing layer regions were very sound and that the WC particles were packed to an appropriate density. On the basis of the above results, the morphology of the WC powder used was judged not to have an effect on the hardness of the hardfacing layer manufactured using the PTAW process.
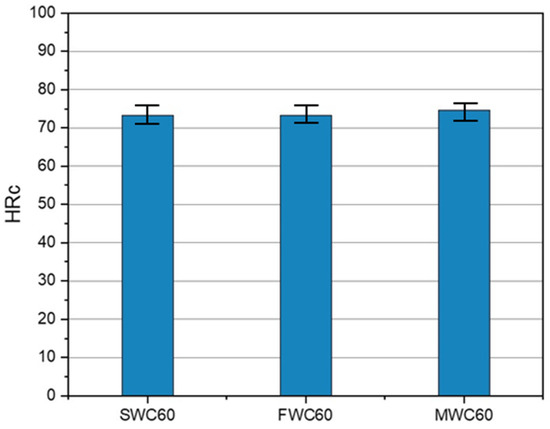
Figure 9.
Rockwell hardness values of the SWC60, FWC60, and MWC60 specimens.
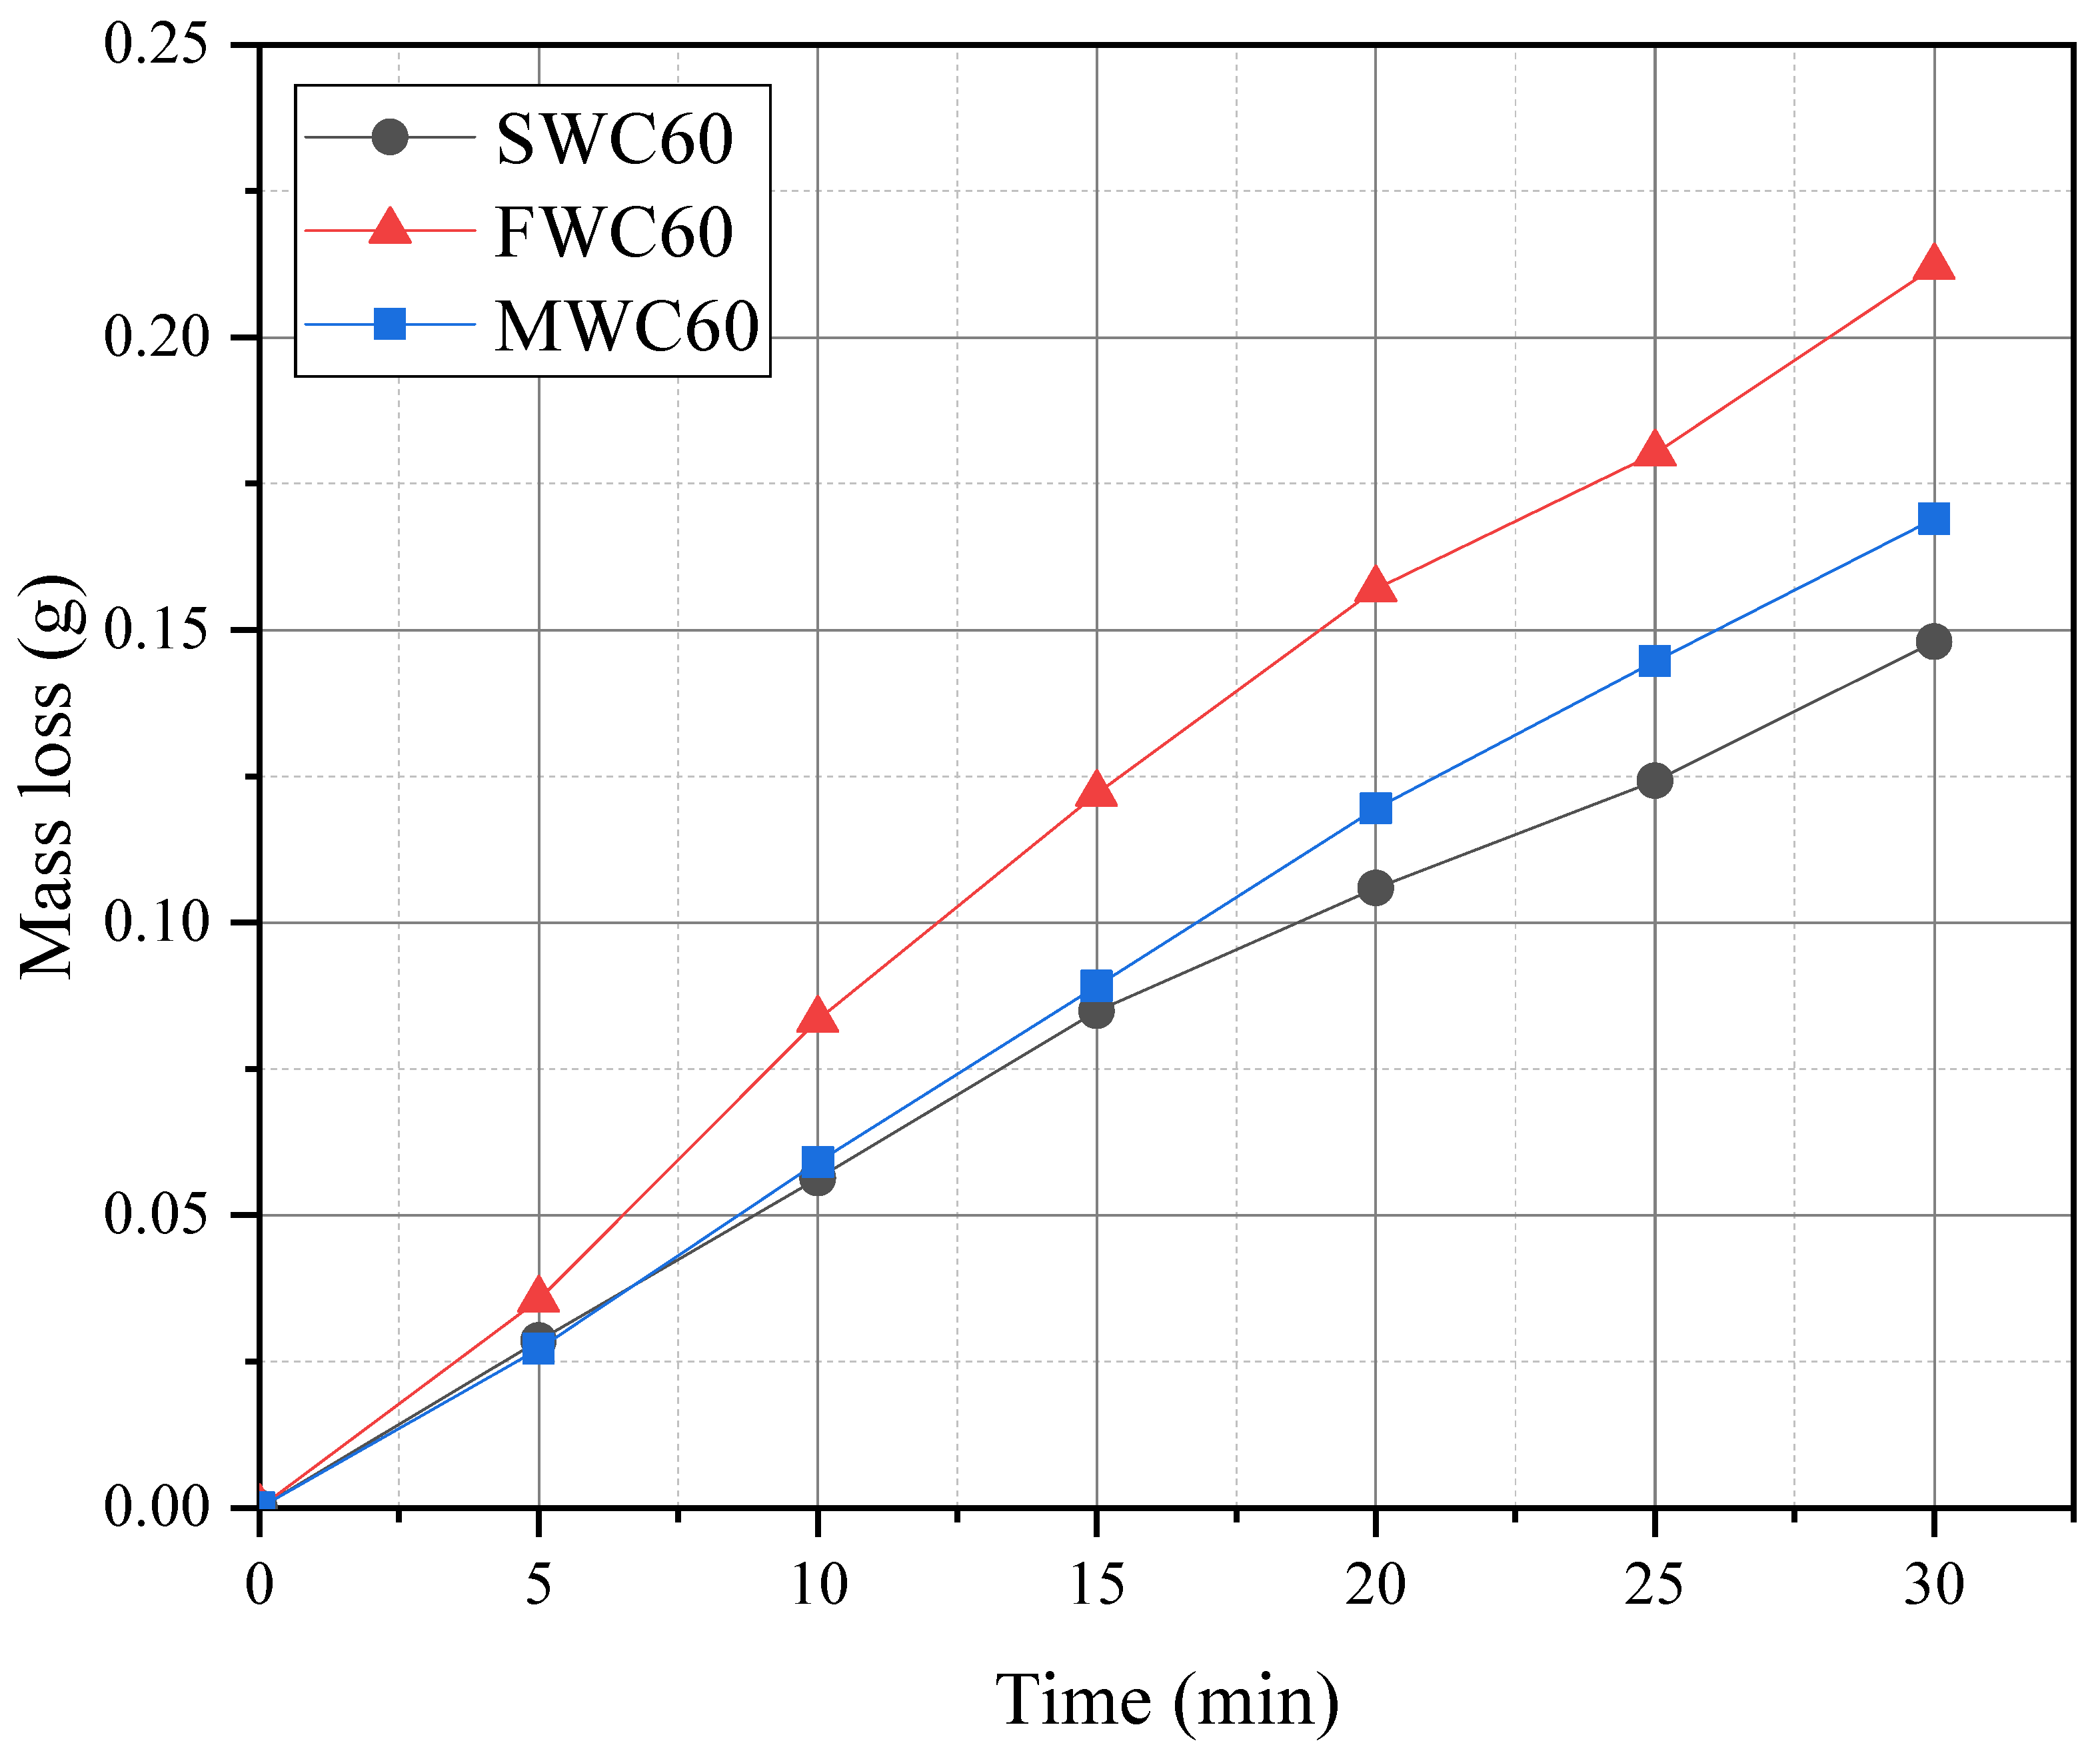
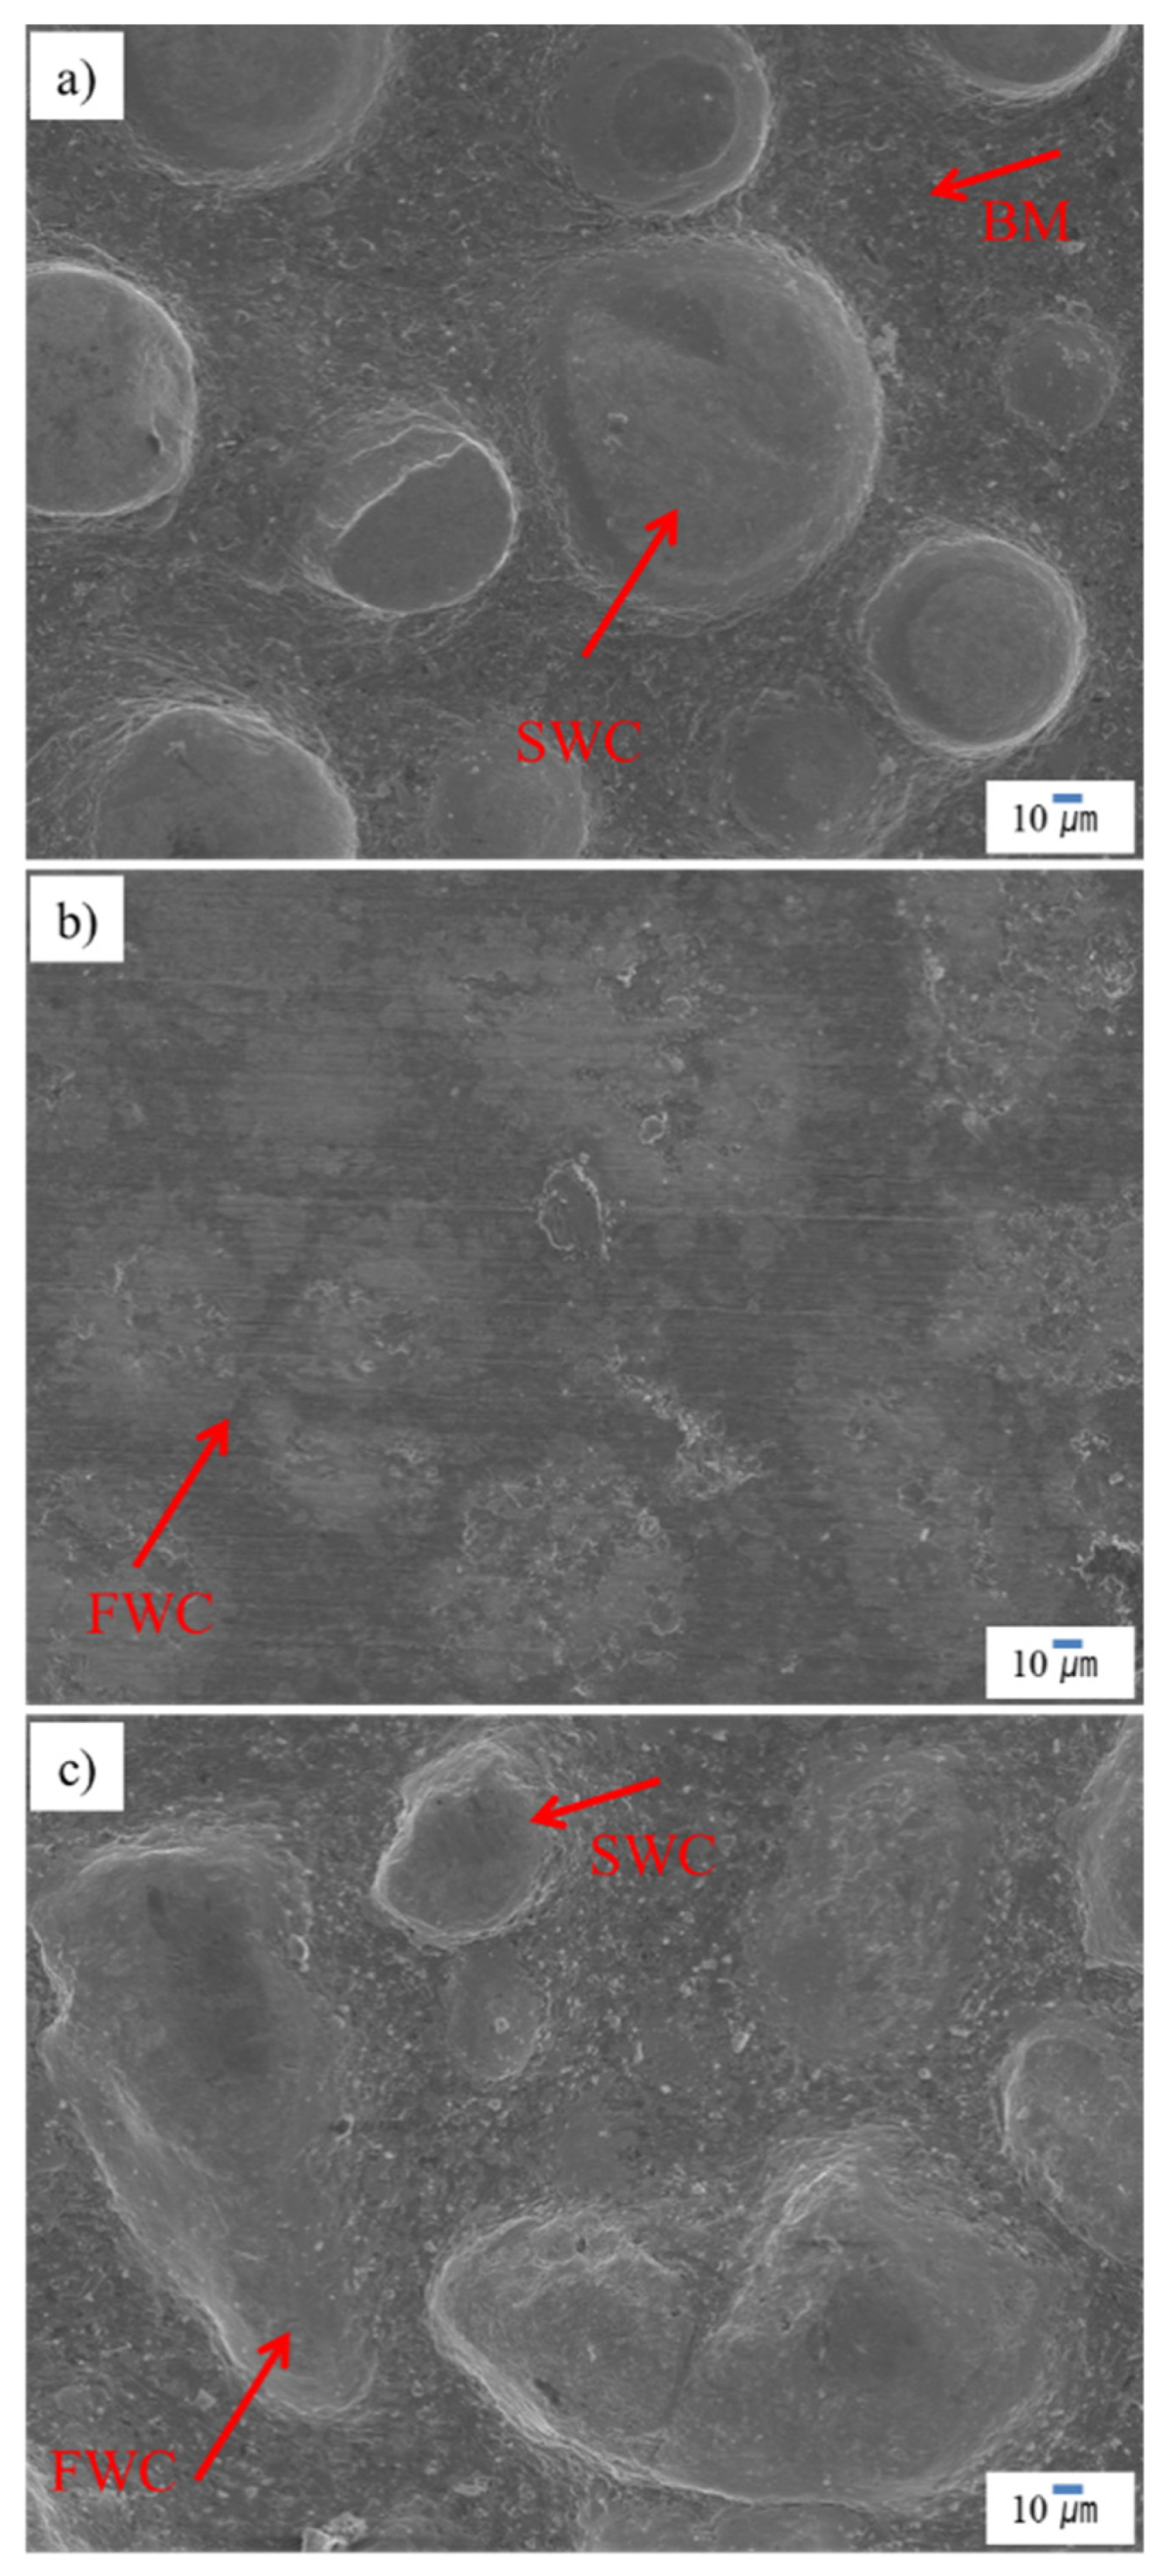
Dry sand wheel abrasion tests on the SWC60, FWC60, and MWC60 specimens were conducted. The results are shown in Figure 10. The quantity of mass loss by abrasion increased almost linearly with increasing testing time, regardless of the type of specimen. However, the rates of wear were different in each sample. This represented a distinct trend with the morphology of the WC powder types selected for preparation of the samples. Both the rate of wear and the amount of wear are smallest in SWC60, and highest in FWC60. Those of MWC60 are in the middle. It is clear that both the quantity and the rate of wear are seriously affected by the morphology of the WC powder as a reinforcement material. It is also confirmed that the spherical WC is the most effective form for wear resistance. Figure 11 shows the SEM images of the surface of each specimen after the DWA test. The circular and angular images with different contrast are tungsten carbides buried in the binder metal. The intricately connected pit-like images represent the binder metal matrix (which consists of vanadium, chromium, iron, and other elements) in the hardfacing layer. A preferential wear of the matrix was observed for all the specimens. The size and depth of wear of FWC60 were greater than those of SWC60. This means that fused angular WC accelerates wear on the surface of the hardfacing layer. It also suggests that both irregular shape and heterogeneous distribution of WC encourage wear of the binder metal.
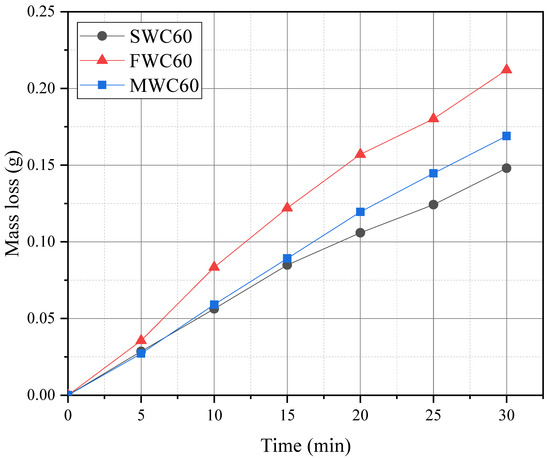
Figure 10.
Dry sand wheel abrasion test results for the SWC60, FWC60, and MWC60 specimens.
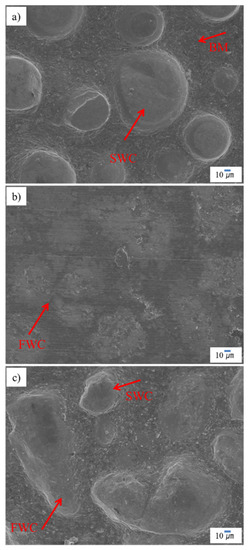
Figure 11.
SEM images of the surface after the dry sand wheel abrasion test (a) SWC60, (b) FWC60, and (c) MWC60. The intricately connected pit-like images represent the binder metal matrix. Circular and angular particles in the matrix are SWC and FWC, respectively.
3.3. Effect of WC Quantity on the Mechanical Properties of the PTAW Hardfacing Layer
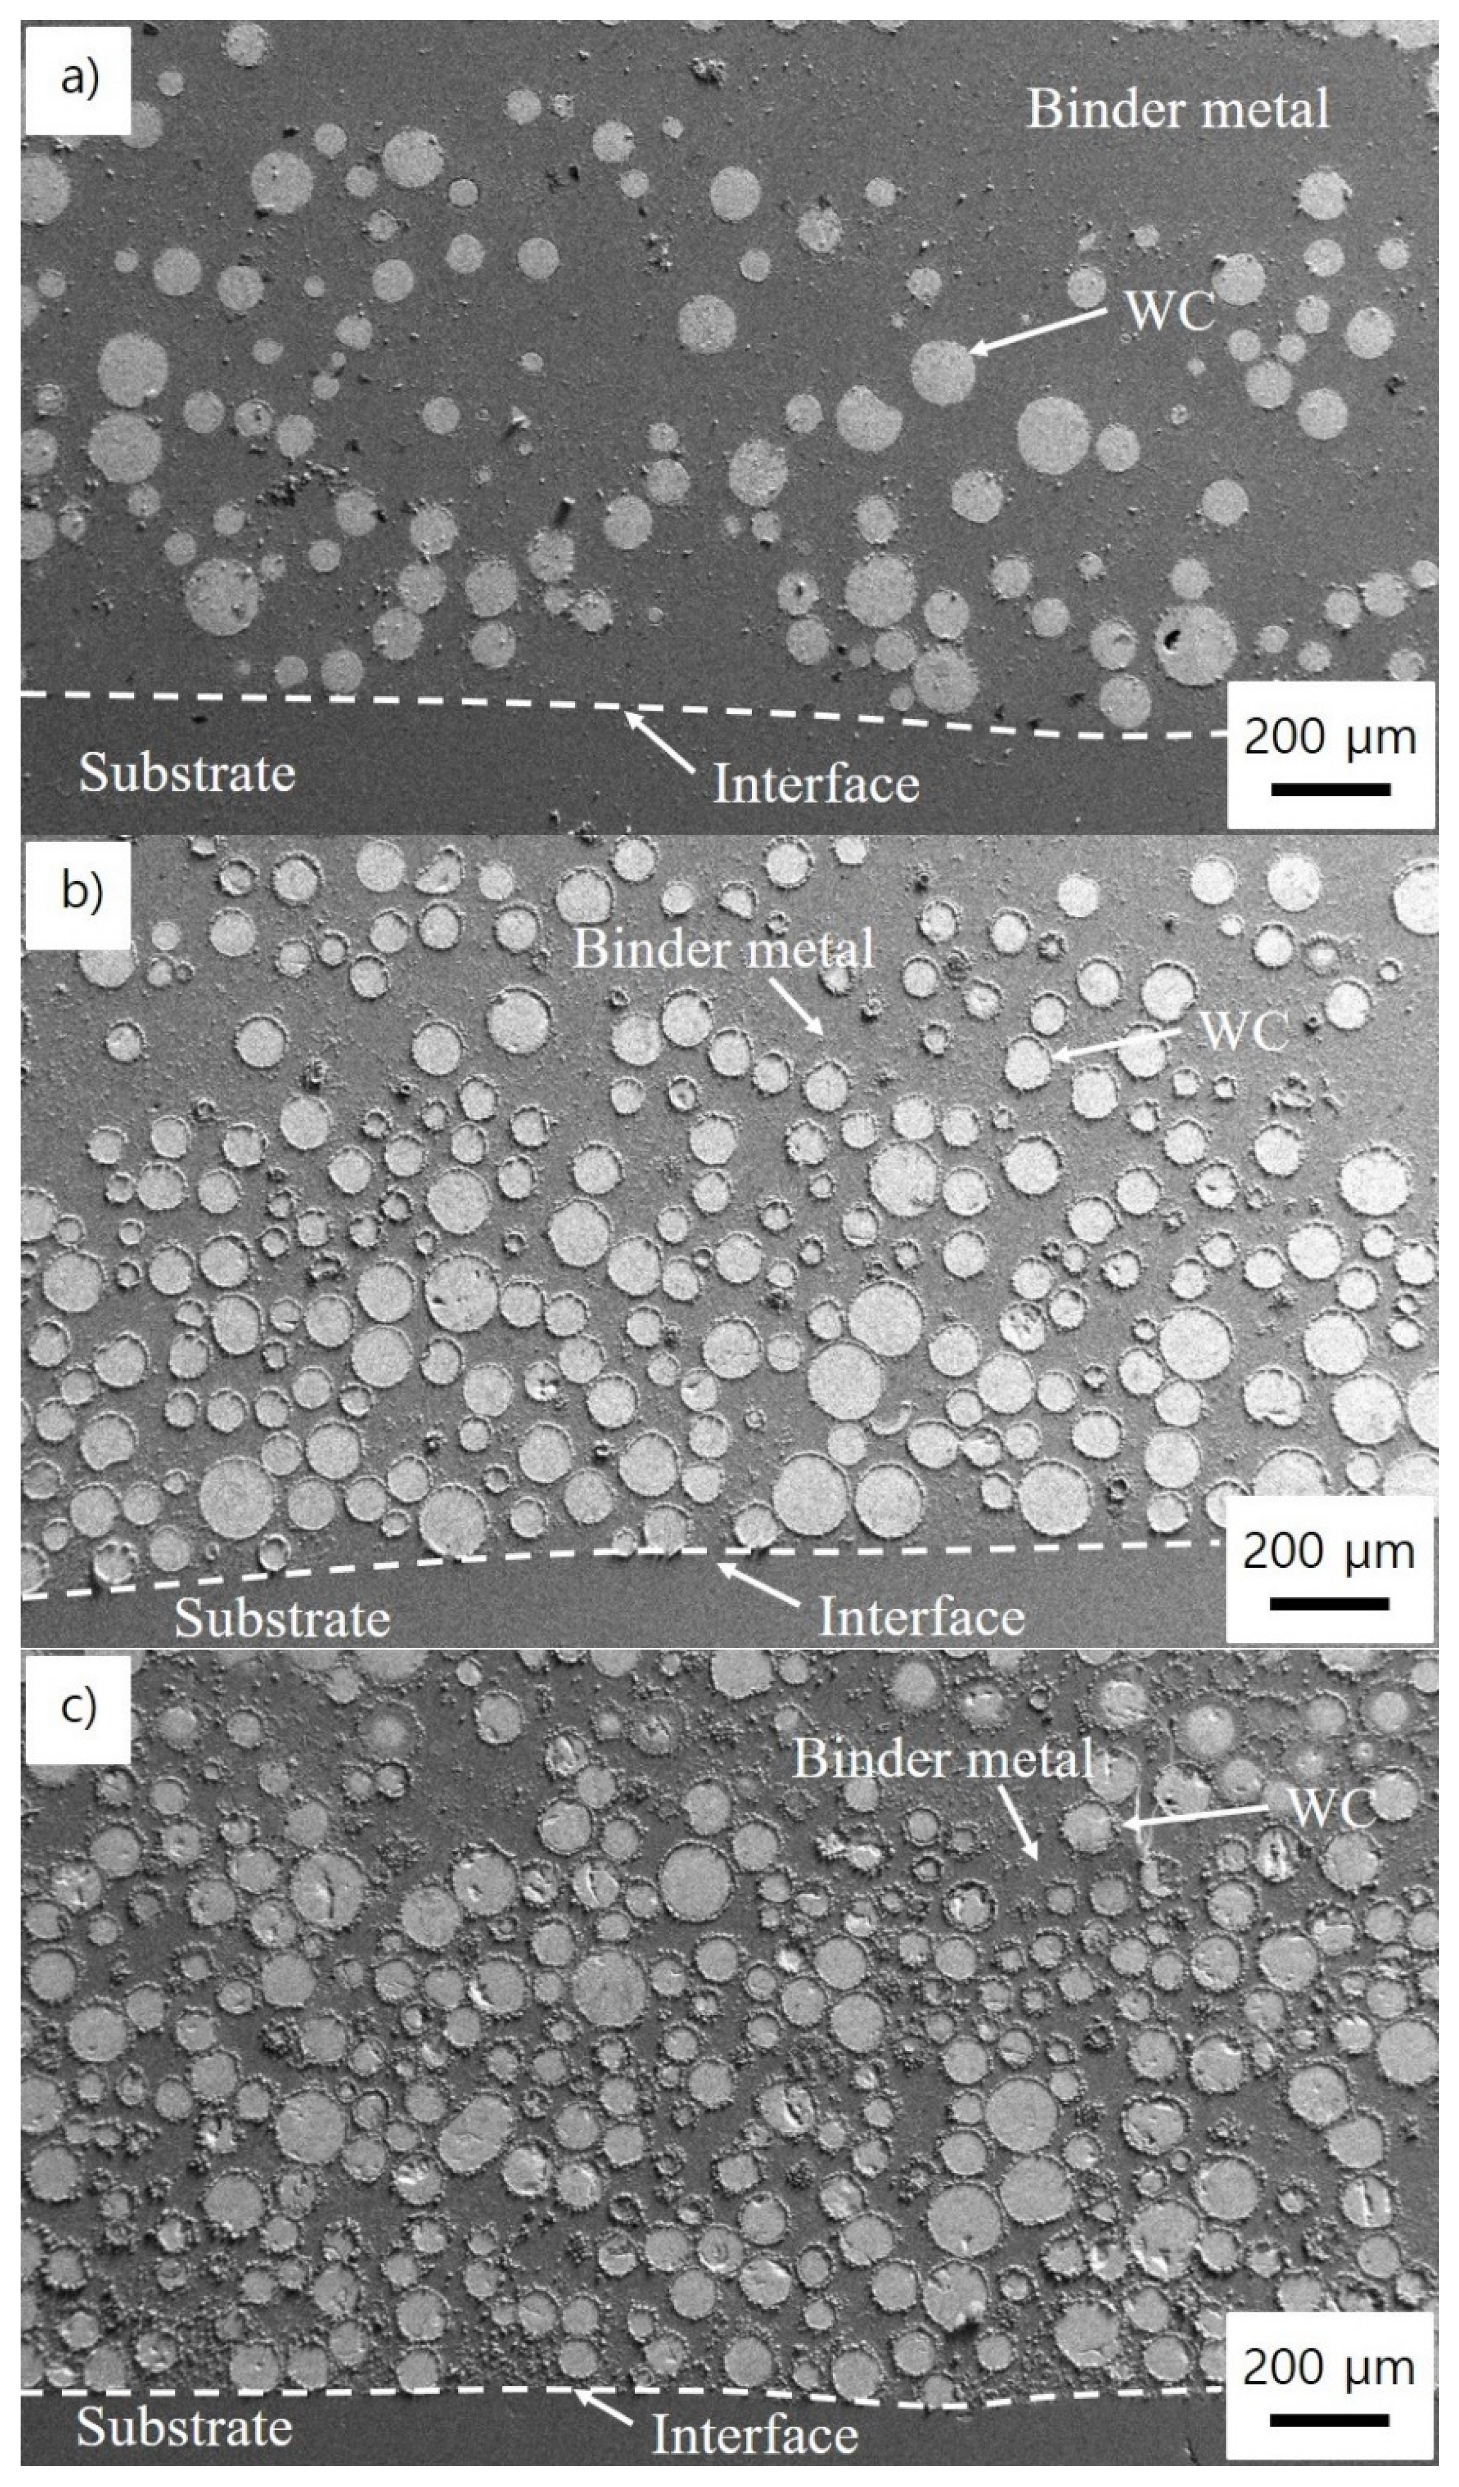
The scanning electron microscope images for the cross section of the hardfacing layer of the PTAW specimens manufactured with spherical WC powder are shown in Figure 12. The dark and bright gray contrasts indicate binder metal and tungsten carbide particles, respectively. The more dark-gray contrast at the bottom of the images corresponds to the mild steel substrate. The number density of the WC in the hardfacing layer increases with an increase in the quantity of WC supplied during the PTAW process, as shown in Figure 12a–c. This suggests that the quantity of WC in the hardfacing layer may affect the wear and hardness of the PTAW specimens.
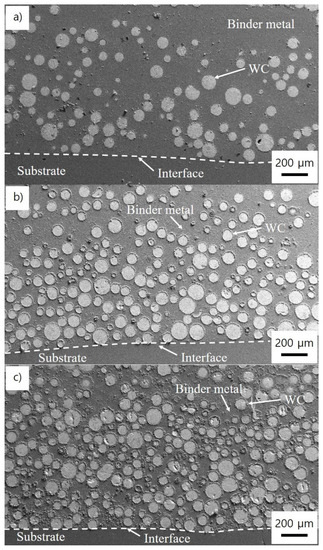
Figure 12.
Optical microscope images of the cross sections of the PTAW samples: (a) SWC40, (b) SWC50, and (c) SWC60.
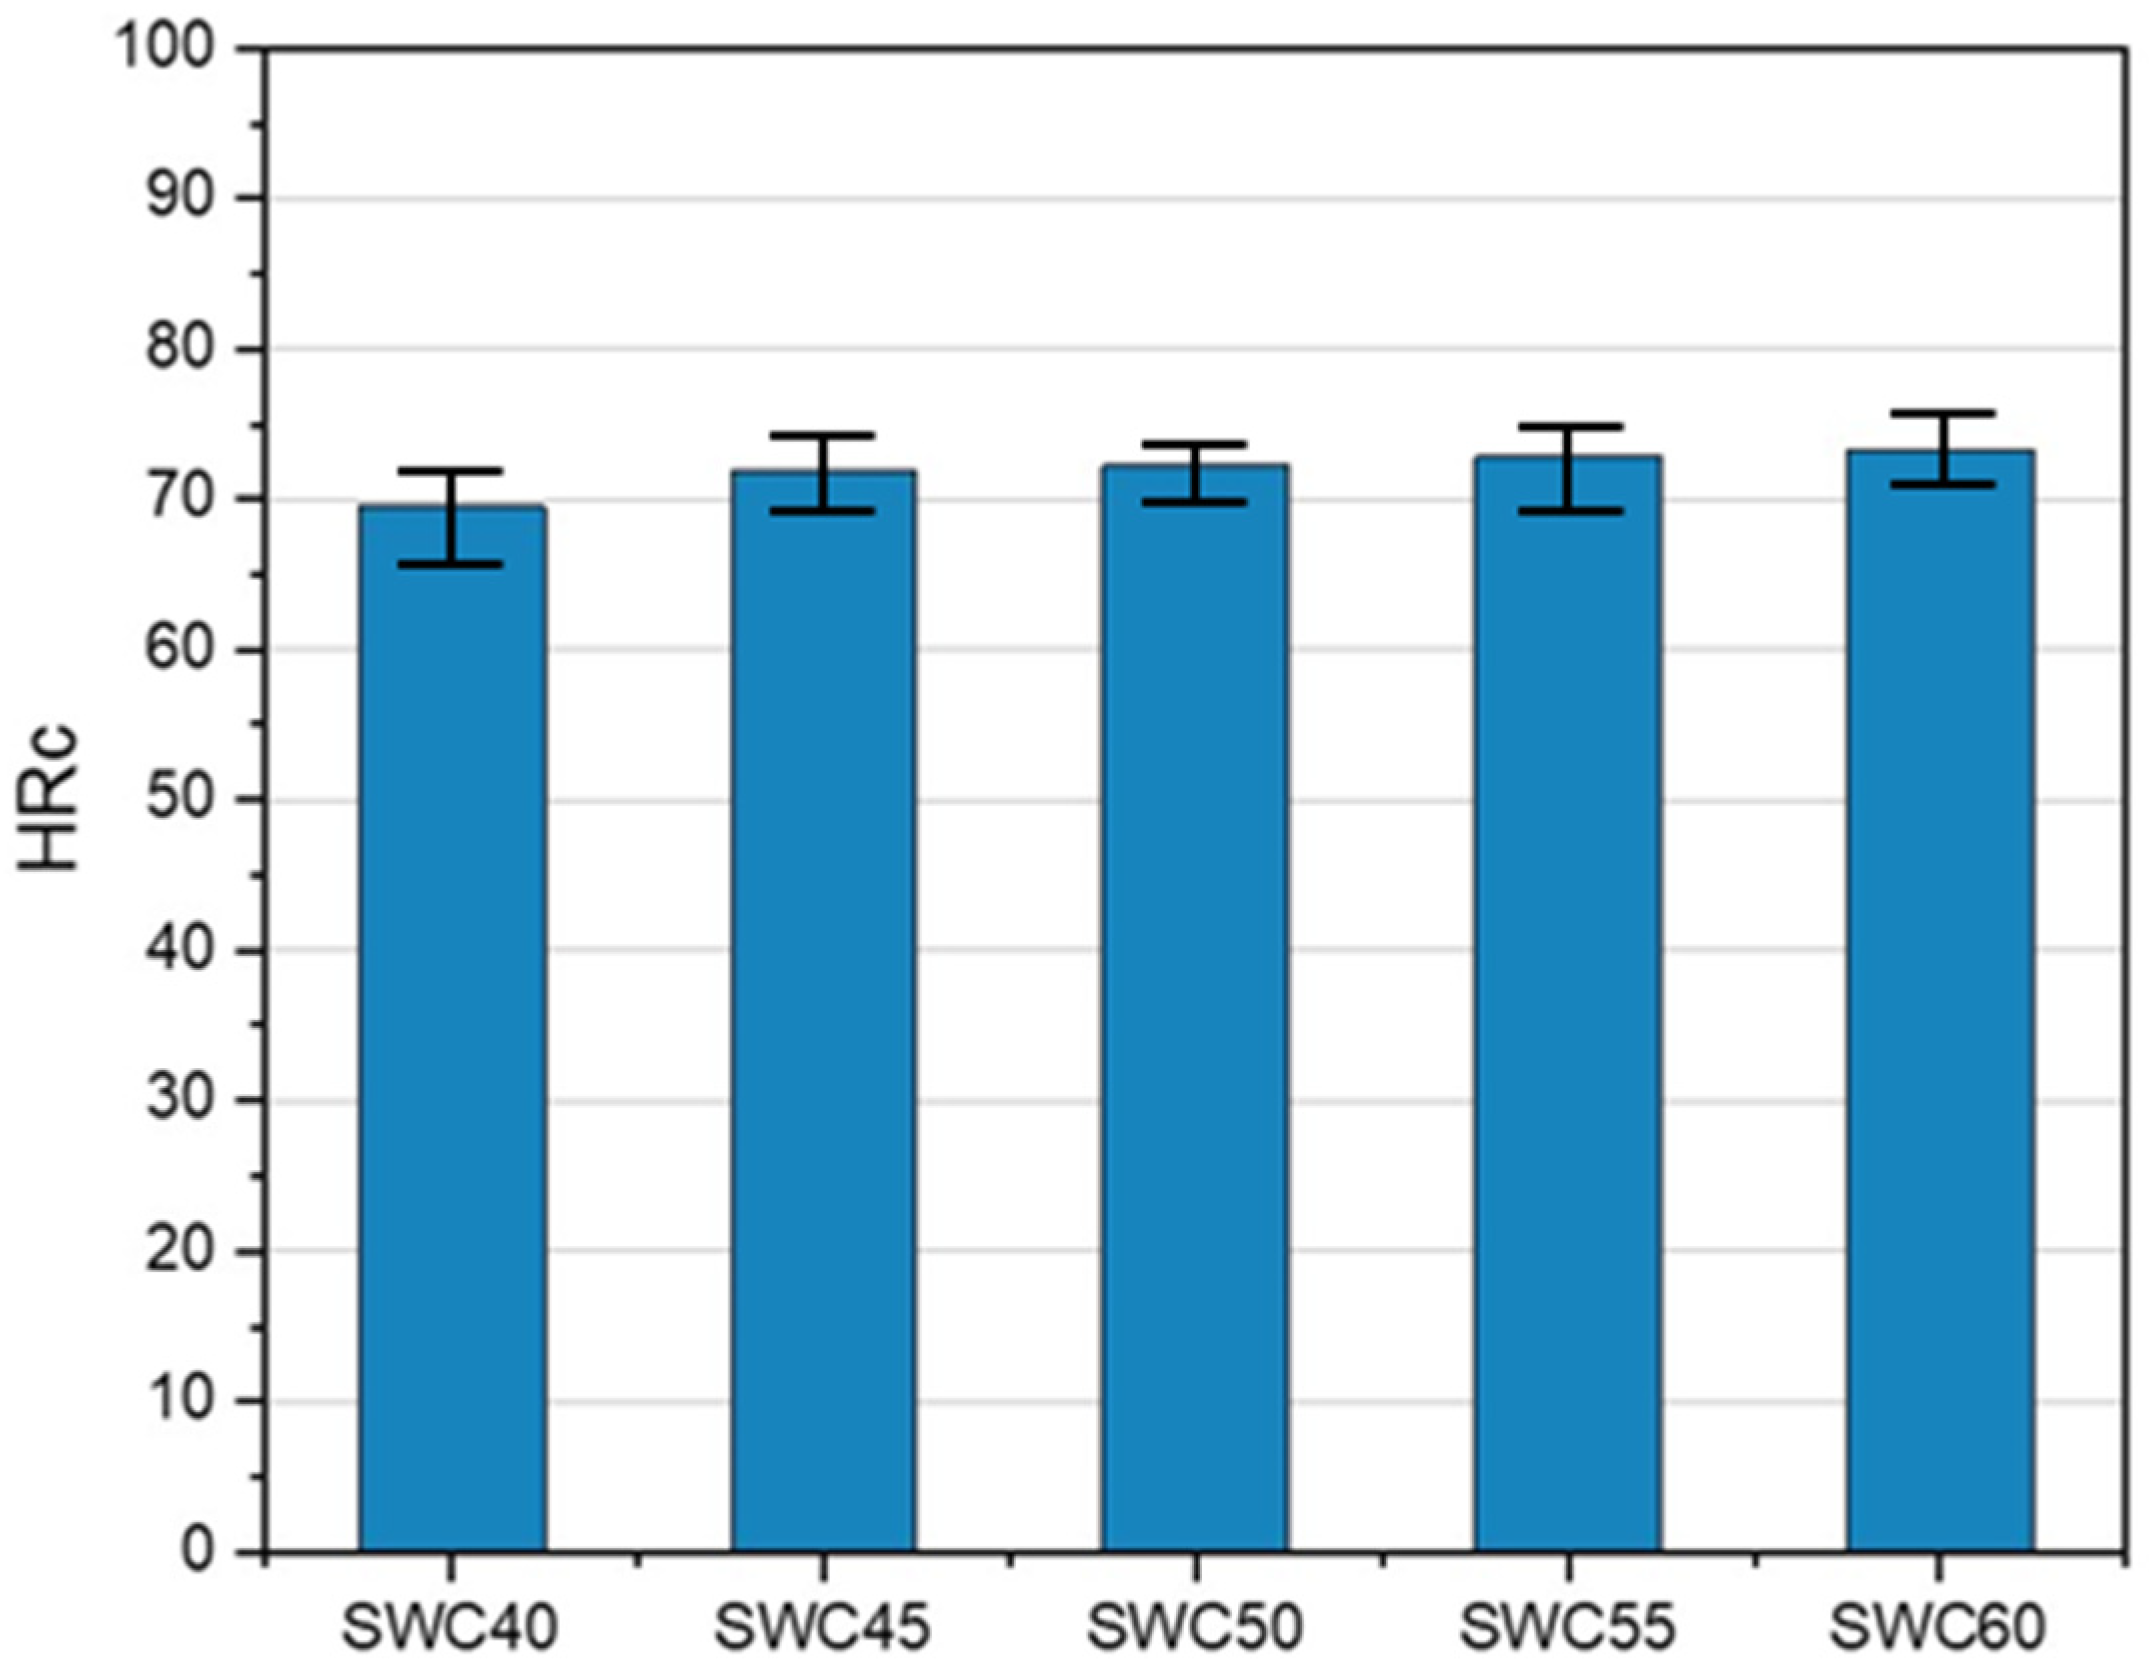
Figure 13 shows the results for the hardness values on the surface of the hardfacing layer of each specimen. There is no great difference among the hardness values, even though the quantity of WC powder varied from 40 to 60 mass %. However, it slightly increased with an increase in the quantity of WC powder. The reason for this was considered to be that the hardness of the binder metal had the same level of control as that of the WC powder.
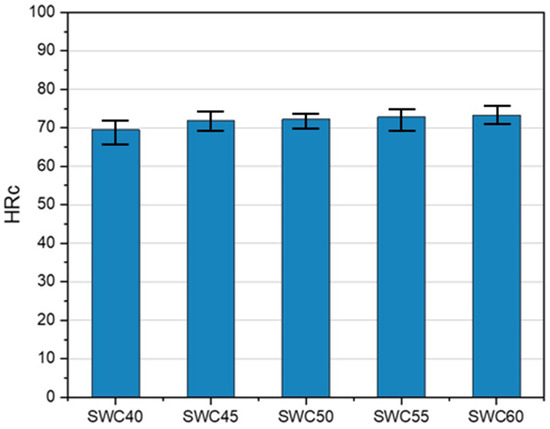
Figure 13.
Rockwell hardness values of the PTAW specimens made using different quantities of spherical tungsten carbide powder.
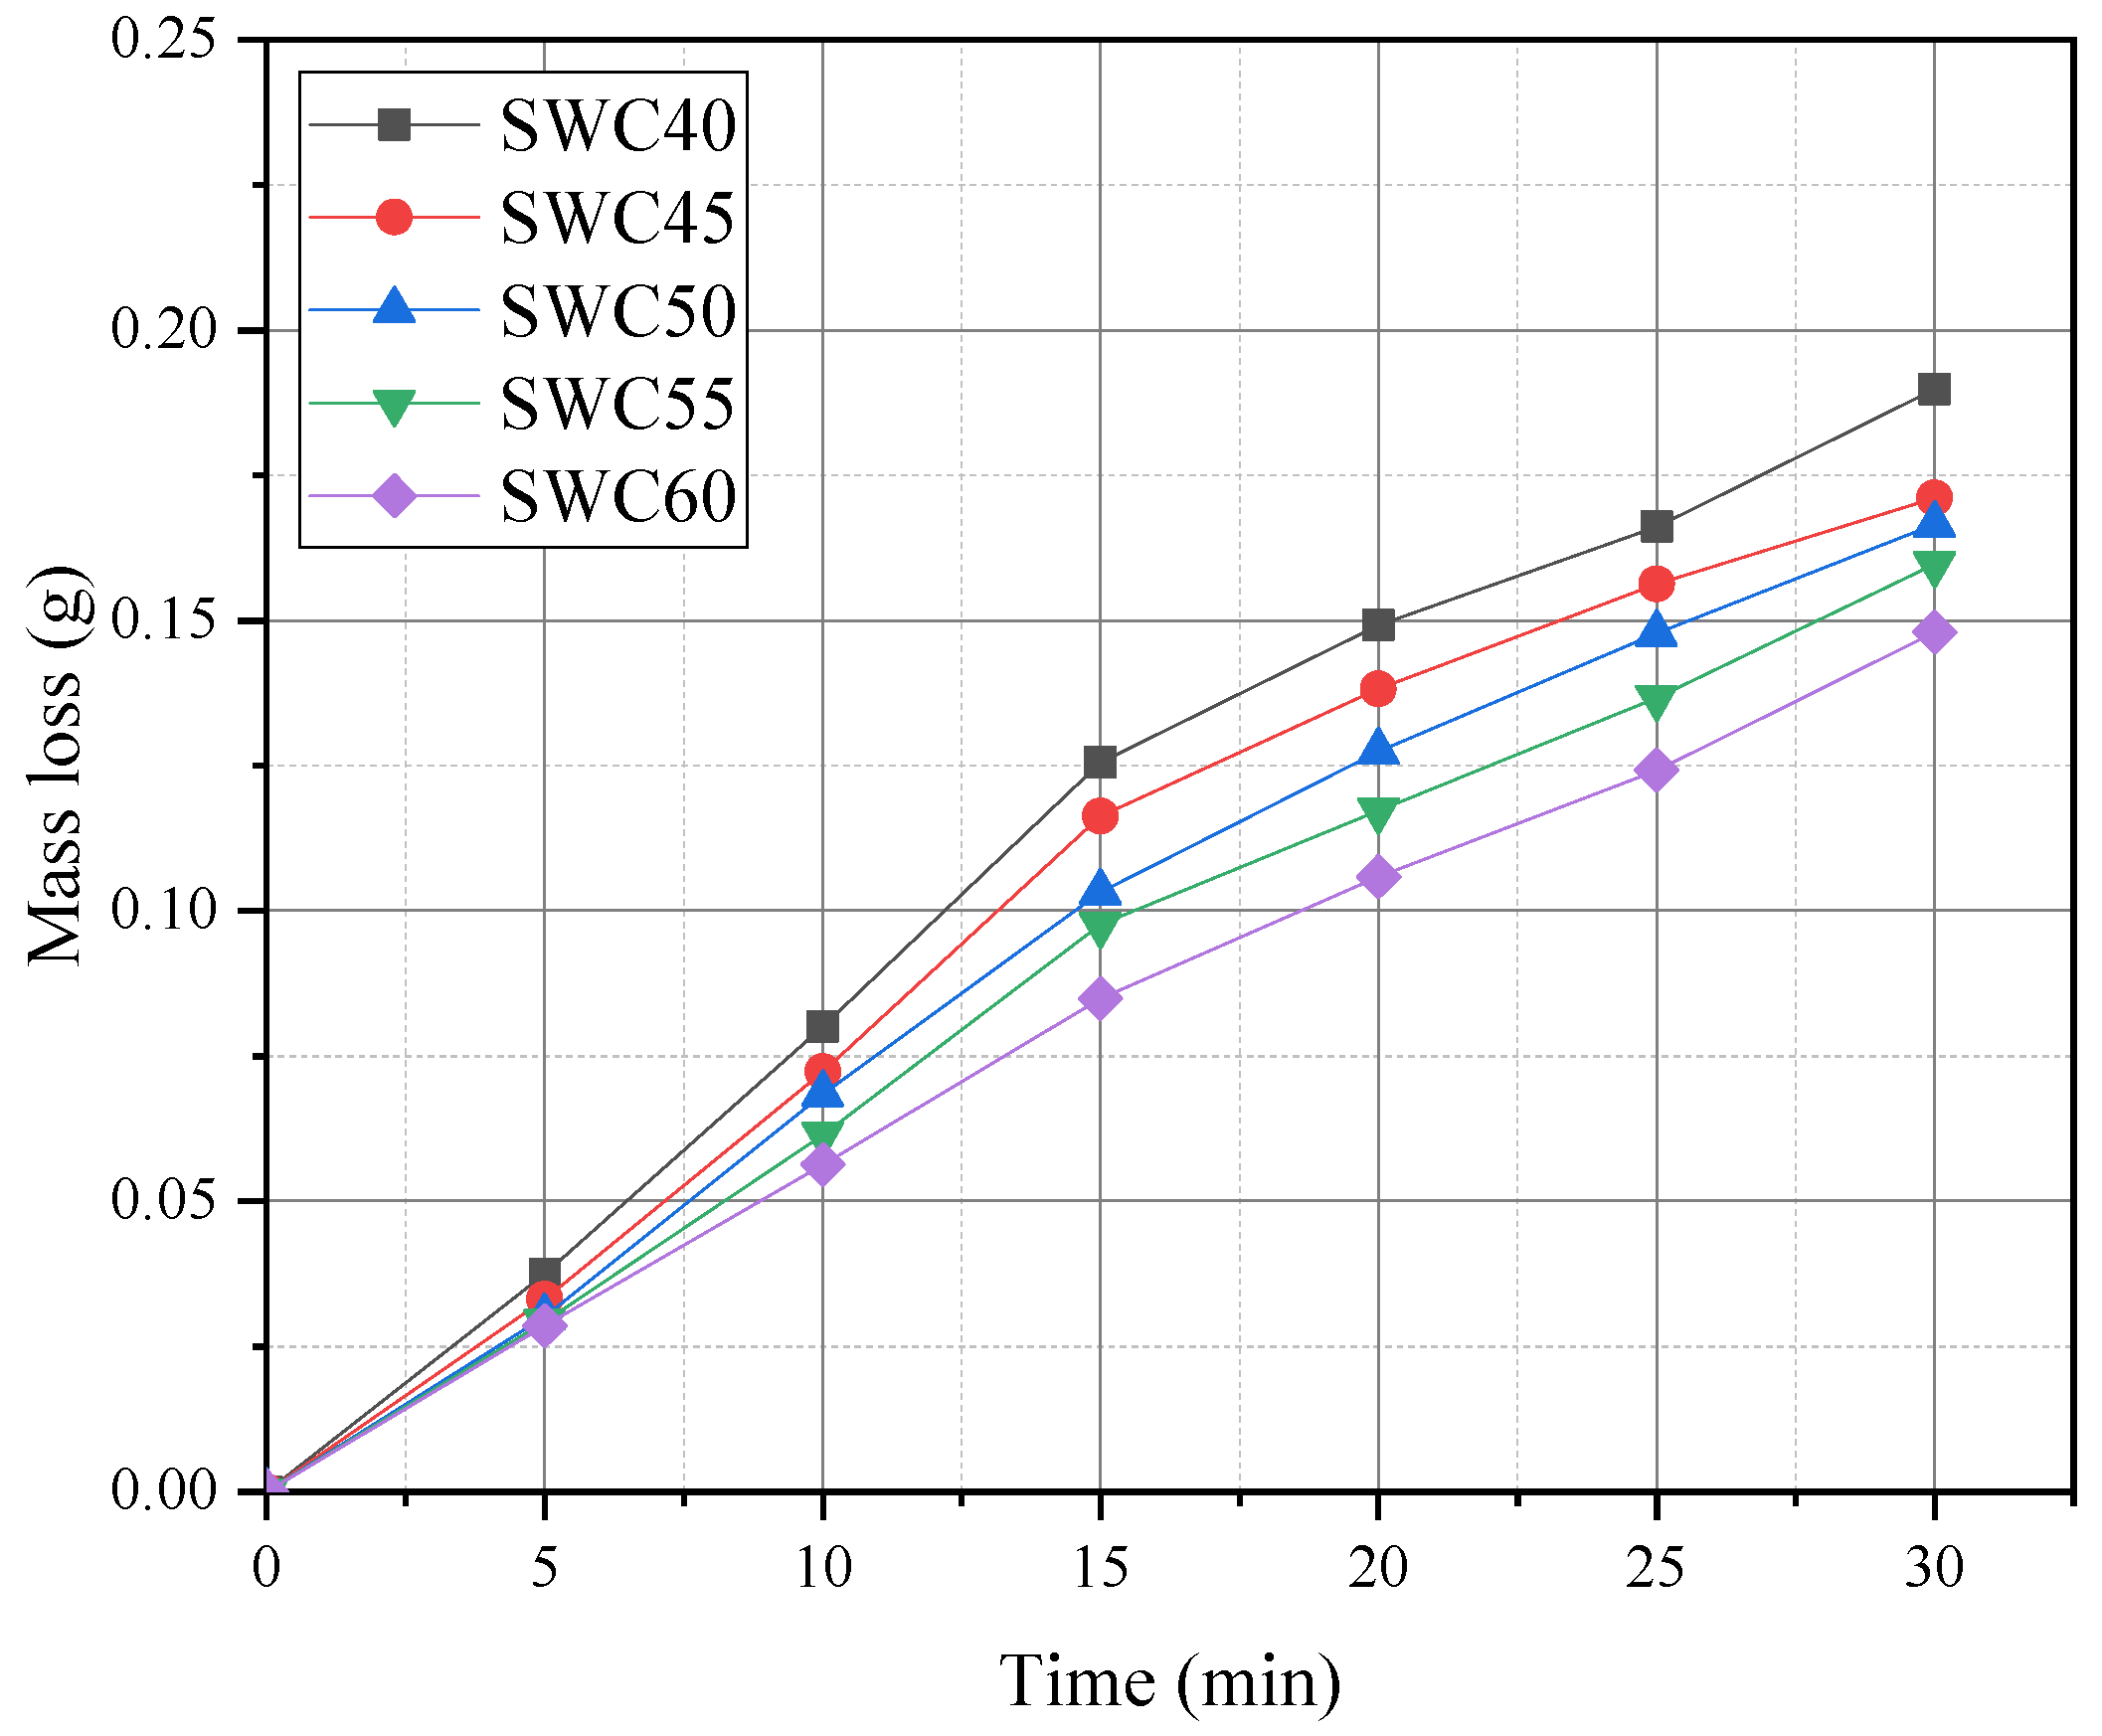
The results of the dry sand wheel abrasion tests of the PTAW specimens are shown in Figure 14. The mass loss decreased with an increase in the quantity of WC powder supplied during the PTAW process. In contrast, the mass loss increased with an increase in the duration of the abrasion test. Meanwhile, the wear rate also decreased with an increase in the quantity of WC powder. It was clearly confirmed that the quantity of WC powder supplied during PTAW process affects the wear property, and that an increase in the quantity of WC used provided better wear resistance of the hardfacing layer fabricated by the PTAW process.
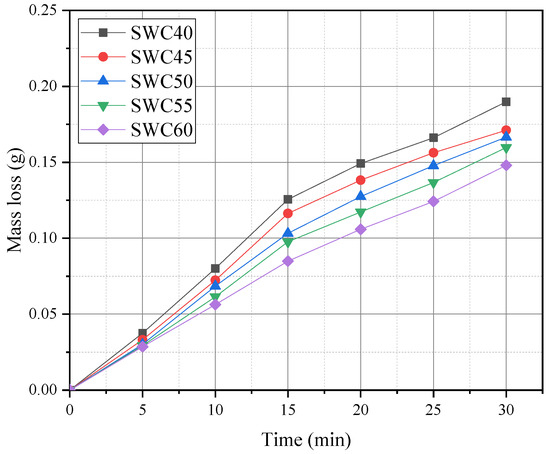
Figure 14.
Dry sand wheel abrasion test results for the PTAW specimens.
4. Discussion
Wear Mechanism and the IPs Bands Formed around the WC Powders in the Hardfacing Layer
Lee et al. observed the formation of an interfacial microstructure between solid/liquid metals interface [17], and also investigated the growth of intermediate phase layer at the interface [18]. The growth of the IPs bands also leads to a decrement of the proportion of the binder metal matrix that has relatively lower hardness value. It confirmed that the formation and growth of the interfacial microstructure affect the wear property within the same hardfacing layer, as shown in Figure 7. The authors observed the growth manner of IPs and their band structure. The useful results will be submitted in a future report.
The DWA tests in this study were conducted for relatively short running time, less than 30 min. Both wear property and wear mechanism in the early stage of the DWA tests were evaluated. The dominant wear mechanism was abrasive wear in the binder metal matrix, because preferential wear would occur on softer matrix surfaces. Chen Guoqing et al. [15] reported that the main wear mechanism of the early step of the tests was abrasive wear, based on the observation about the worn surface of PTAW specimens. T. Liyanage et al. [14] also reported that a softer matrix between harder particles would be gouged out from the abrading surface, in an abrasive wear situation.
In this study, the morphology of WC particles mainly contributed to wear resistance. Figure 10 shows the mass loss of FWC60 was larger than that of SWC60 and MWC 60. It matches with SEM images (Figure 11) right after the DWA tests. The wear of the angular WC and matrix was observed in Figure 11b while spherical WC particles withstood the abrasion tests in Figure 11a. Different depths of WC particles at the center and edge were partially found.
The microstructure of the hardfacing layer was dependent on WC quantity and solidification. Figure 12 shows that the numbers of WC particles increased based on the quantity of WC. The microstructure consists of low numbers of WC particles at the top and high numbers at the bottom. Newly formed IPs were identified in the vicinity of WC particles. The abrasion rate and mass loss decreased at the bottom region when containing interfacial IMC bands. Therefore, an appropriate formation and growth of IMC bands improve wear property. If a longer test time, over several hours, was applied, dominant wear mechanism would be changed to cavities due to the pull-out of the hard particles from the binder metal matrix [15].
5. Conclusions
In the present study, hardfacing layers on mild steel substrates were manufactured using the plasma transferred arc welding (PTAW) process with tungsten carbide (WC) powder and binder metal. Three kinds of WC powder (spherical, fused angular, and mixed powder) were employed. The effects of the morphology and the quantity of WC powder used on the wear property were examined. The formation of an interfacial IMC layer between the WC and binder metal, and the relationship between the microstructure and wear property, were also investigated. The following conclusions are drawn from the results.
The morphology of the WC powder as reinforcement material substantially affects the wear property of the PTAW hardfacing layer. The spherical WC is the most effective for wear resistance (among spherical, fused angular, and mixed powders). Both the quantity of WC powder supplied during the PTAW process and the increase in the quantity of WC used are useful for obtaining a better wear resistance. Furthermore, WC of irregular shape and with a heterogeneous distribution reduces the wear resistance.
The PTAW hardfacing layer consists of four microstructural areas. The circular regions correspond to tungsten carbide, the flat region indicates binder metal, small protrusion-like IMCs are isolated in the binder metal, and an IMC band forms at the interface between the WC and the binder metal. Preferential wear generally occurs in the binder metal region. The wear property improves when the interfacial IMC bands are formed and grow to an appropriate width. The growth of the interfacial IMC bands also means a reduction of the binder metal fraction. The PTAW conditions, including the process peak temperature and the cooling rate, affect the microstructure formation and should be controlled adequately to obtain better wear resistance.
Author Contributions
Conceptualization, investigation, write, review and editing, K.-j.L.; data curation, review and editing, D.K. All authors have read and agreed to the published version of the manuscript.
Funding
This research received no external funding.
Institutional Review Board Statement
Not applicable.
Informed Consent Statement
Not applicable.
Data Availability Statement
Not applicable.
Acknowledgments
The authors would like to express their thanks to DY WELTEC for manufacturing the hardfacing specimens. This work was supported by the Project for Innovative Growth of Regional Enterprises of the Ministry of SMEs and Startups (Project number: P0010129). This paper was also sponsored by the project for support and development of Ppuri and agricultural machinery technology of Jeollabuk-do Province (Project number: IZ210022).
Conflicts of Interest
The authors declare no conflict of interest.
References
- Jones, A.H.; Roffey, P. The improvement of hard facing coatings for ground engaging applications by the addition of tungsten carbide. Wear 2009, 267, 925–933. [Google Scholar] [CrossRef]
- Günther, K.; Liefeith, J.; Henckell, P.; Ali, Y.; Bergmann, J.P. Influence of processing condition on the degradation kinetics of fused tungsten carbides in hardfacing. Int. J. Refract. Met. Hard Mater. 2018, 70, 224–231. [Google Scholar] [CrossRef]
- Takahashi, T.; Itoh, H. Chemical vapor deposition of tungsten carbide dendrites. J. Cryst. Growth 1972, 12, 265–271. [Google Scholar] [CrossRef]
- Sun, Y.M.; Lee, S.Y.; Lemonds, A.M.; Engbrecht, E.R.; Veldman, S.; Lozano, J.; White, J.M.; Ekerdt, J.G.; Emesh, I.; Pfeifer, K. Low temperature chemical vapor deposition of tungsten carbides for copper diffusion barriers. Thin Solid Film. 2001, 397, 109–115. [Google Scholar] [CrossRef]
- Reed, B.; Wang, R.; Lu, P.Y.; Qu, J. Autoclave grid-to-rod fretting wear evolution of a candidate coating for accident-tolerant fuel. Wear 2021, 466–467, 203578. [Google Scholar] [CrossRef]
- Xu, B.; Jiang, P.; Geng, S.; Zhao, J.; Mi, G. In-situ reaction and mechanical properties of 6061 aluminun alloy weld joint with SiCp by laser melting injection. Mater. Des. 2021, 203, 109538. [Google Scholar] [CrossRef]
- Cao, X.; Zhu, P.; Wang, W.; Liu, T.; Lu, Y.; Shoji, T. Effect of thermal aging on oxide film of stainless-steel weld overlay cladding exposed to high temperature water. Mater. Charact. 2018, 138, 195–207. [Google Scholar] [CrossRef]
- Mendez, P.F.; Barnes, N.; Bell, K.; Borle, S.D.; Gajapathi, S.S.; Guest, S.D.; Izadi, H.; Gol, A.K.; Wood, G. Welding Processes for Wear Resistant Overlays. J. Manuf. Processes 2014, 16, 4–25. [Google Scholar] [CrossRef]
- Sundaramoorthy, R.; Tong, S.X.; Parekh, D.; Subramanian, C. Effect of Matrix Chemistry and WC types on the Performance of Ni-WC based MMC overlays deposited by Plasma Transferred Arc (PTA) Welding. Wear 2017, 376–377, 1720–1727. [Google Scholar] [CrossRef]
- Bourithis, L.; Papadimitriou, G.D. The effect of microstructure and wear conditiojns on the wear resistance of steel metal matrix composites fabricated with PTA alloying technique. Wear 2009, 266, 1155–1164. [Google Scholar] [CrossRef]
- Iakovou, R.; Bourithis, L.; Papadimitriou, G. Synthesis of boride coatings of steel using plasma transferred arc (PTA) process and its wear performance. Wear 2002, 252, 1007–1015. [Google Scholar] [CrossRef]
- Deuis, R.L.; Yellup, J.M.; Subramanian, C. Metal-matrix composite coatings by PTA surfacing. Compos. Sci. Technol. 1998, 58, 299–309. [Google Scholar] [CrossRef]
- Jankauskas, V.; Antonov, M.; Varnauskas, V.; Skirkus, R.; Goljandin, D. Effect of WC Grain size and content on low stress abrasive wear of manual arc welded hardfacings with low-carbon or stainless steel matrix. Wear 2015, 328–329, 378–390. [Google Scholar] [CrossRef]
- Liyanage, T.; Fisher, G.; Gerlich, A.P. Microstructures and abrasive wear performance of PTAW deposited Ni-WC overlays using different Ni-alloy chemistries. Wear 2012, 274–275, 345–354. [Google Scholar] [CrossRef]
- Chen, G.; Fu, X.; Wei, Y.; Zhou, W. Microstructure and wear properties of nickel-based surfacing deposited by plasma transferred arc welding. Surf. Coat. Technol. 2013, 228, s276–s282. [Google Scholar]
- Gnyusov, S.F.; Degterev, A.S.; Tarasov, S.Y. The effect of plsma torch weaving on microstructural evolution in multiple-pass plasma-transferred arc Fe-Cr-V-Mo-C coating. Surf. Coat. Technol. 2018, 344, 75–84. [Google Scholar] [CrossRef]
- Lee, K.; Kumai, S. Interfacial microstructure and strength of steel to aluminum alloy lap joints welded by a defocused laser beam. Mater. Trans. 2005, 46, 1847–1856. [Google Scholar] [CrossRef]
- Lee, K.; Kumai, S. Characterization of intermetallic compound layer formed at the weld interface of the defocused laser welded low carbon steel/6111 aluminum alloy lap joint. Mater. Trans. 2006, 47, 1178–1185. [Google Scholar] [CrossRef] [Green Version]
Publisher’s Note: MDPI stays neutral with regard to jurisdictional claims in published maps and institutional affiliations. |
© 2021 by the authors. Licensee MDPI, Basel, Switzerland. This article is an open access article distributed under the terms and conditions of the Creative Commons Attribution (CC BY) license (https://creativecommons.org/licenses/by/4.0/).

