Article

Flow Field in Slab Continuous Casting Mold with Large Width Optimized with High Temperature Quantitative Measurement and Numerical Calculation

1
State Key Laboratory of Advanced Special Steel, School of Material Science and Engineering, Shanghai University, Shanghai 200444, China
2
Shougang Jingtang United Iron and Steel Co., Ltd., Tangshan 063200, China
*
Author to whom correspondence should be addressed.
Metals 2021, 11(2), 261; https://doi.org/10.3390/met11020261
Submission received: 7 January 2021 / Revised: 21 January 2021 / Accepted: 29 January 2021 / Published: 4 February 2021

Abstract

:
In this paper, the rod deflection method was applied to quantitatively measure velocity near the mold surface at high temperatures and the k-ε model coupled with a discrete phase model (DPM) was adopted to simulate the flow field in the mold. The calculated results match very well with the measured results under all the present conditions. Under the conditions of the large mold width of 1800 mm, 1.1 m/min casting speed and 140 mm submerged entry nozzle (SEN) immersion depth, the velocity near the mold surface decreases with increasing the argon gas flow rate. When the argon gas flow rate is 6 L/min, the flow pattern is the double roll flow (DRF). When the argon gas flow rate is increased to 10 L/min and 14 L/min, the flow pattern is the single roll flow (SRF), and the risk of slag entrainment increases. With an argon gas flow rate of 10 L/min, and an immersion depth of 160 mm, the velocity near the mold surface sensitively increases with increasing the casting speed. When the casting speed is 1.1 m/min, an intermediate flow (IF) is formed with the intensified mold surface fluctuation, which can easily result in slag entrainment defects. When the casting speed is only increased to 1.2 m/min, the velocity near the mold surface changes drastically and is close to the upper limit velocity of 0.4 m/s. When the casting speed is 1.1 m/min, and the argon gas flow rate is 10 L/min, the velocity near the mold surface is obviously increased with increasing the immersion depth. When the immersion depth of the nozzle increases from 140 mm and 160 mm to 180 mm, the flow pattern changes from SRF or IF to DRF. When the bottom shape of the SEN changes from mountain to well, the velocity near the mold surface decreases. We suggest adopting the well-bottom nozzle to reduce the risk of slag entrainment.

1. Introduction

With the development of the automobile industry, the demand for an exposed panel with high surface quality is on the rise. In order to reduce the incidence of linear defects on the surface of the automobile exposed panel, studies aiming to find improvements in steelmaking and continuous casting (CC) technologies have been continuously carried out by many integrated steel companies in the world. Generally, the width of the mold usually ranges from 880 to 2300 mm and the defect ratio of the slab with a width larger than 1600 mm shares a high proportion, according to the practical industrial experiments. Since there is a close relationship between the defects caused by the CC process and the flow field in the mold, the flow field in a CC mold with a width larger than 1600 mm requires urgent study.
The effects of the parameters of the CC process and the structure of the nozzle on the flow field in the CC mold with a wide cross-section have been studied extensively. As regards the investigations with water model and numerical simulations, Bessho [1] studied the flow field in a mold with a width of 1250–2000 mm by means of a numerical simulation and water model, and found that the two factors determining the flow pattern of molten steel in the mold are the kinetic energy of molten steel at the side port of submerged entry nozzle (SEN) and the buoyancy force generated by the argon gas bubbles. Chen [2,3,4], He [5] and Liu [6] used a water model to study the flow field in a mold with four different widths ranging from 1800 to 3250 mm and concluded that increasing the air blowing volume easily leads to an increase in fluctuation in the liquid level at 1/4 the width of the mold. Lin [7] reported that the surface velocity of a slab CC mold changed significantly with the casting speed when using a large slab width of 1650 mm and the water model. Wang [8] investigated the flow field of liquid steel in the mold, including large widths of 1850 and 2150 mm, and indicated that the optimal argon gas flow rate is positively correlated with the casting speed. Hernandez [9] used the k-ε model coupled with the volume of fluid model (VOF) to find that the rectangular side port of SEN can effectively reduce the occurrence of backflow compared with the circular side port. As regards the flow field in the mold with a width of 1736 mm, by using a Large Eddy Simulation (LES), Liu [10] found that the lower circulation area in the mold is usually asymmetric, while the upper circulation area has two typical flow patterns, namely clockwise flow and counter clockwise flow. For the flow field in a mold with a width of 1880 mm, Ramos [11] pointed out that the flow pattern in the mold depends on the kinetic energy of the steel stream at the side port of the SEN and the peak velocity is near the side port. Xiong [12] used a water model to study the influence of the side port shape of SEN on the level fluctuation on the surface of the mold with a width of 1800 mm, and demonstrated that the amplitude of the liquid level fluctuation is in the order of elliptic nozzle < rectangular nozzle < square nozzle. Ren [13] found that the average liquid level contour and flow field tend to be symmetrical when the casting speed is low for slab continuous casting in a mold with a width of 2000 mm.
As regards the investigations including industrial experiments, Kato [14] utilized the water model and industrial experiments to study the flow field in a mold with a width of 1600 mm, and proposed that two optimized conditions for the flow field are that the liquid steel must fill the nozzle and that the flow must be a piston flow in the nozzle. Again, using the water model and industrial experiments to study the flow field in molds with widths of 1650 mm and 1850 mm, Tsukaguchi [15] indicated that the SEN with swirling flow can increase the CC speed and improve the slab surface quality. Deng [16,17,18] conducted a large number of tests with the water model and industrial experiments for a wide slab CC mold, and concluded that the ratio of casting speed to mold width and argon gas flow rate is the decisive factor affecting the flow pattern in the mold, and the critical argon gas flow rate from double roll flow (DRF) to single roll flow (SRF) increases significantly with increasing casting speed. For the 1930 mm mold width, Chen [19] demonstrated that the advantage of the concave bottom nozzle is able to slow down the appearance of the asymmetric flow on the two side ports of the SEN. Cho [20] made use of LES and VOF models, in addition to industrial experiments to study the flow field in a mold with a width of 1600 mm, and found that an SEN with a negative inclination angle is helpful for the formation of DRF.
In order to study the flow field in the mold more accurately and directly, a large number of researchers have developed various velocity measurement methods to measure the velocity of molten steel in the mold. Iguchi [21] put forward a measurement method to measure molten metal with a low melting point and spherical velocimeter. The velocity of the molten metal can be calculated by measuring the resistance of a metal ball in the molten metal. Iguchi [22] proposed another method for measuring the flow rate of molten steel by measuring the shedding frequency of a Karman vortex street. The resistance measurement method could also obtain the liquid steel flow rate by measuring the resistance of a non-deflectable rod inserted into the liquid steel. Thomas [23] used the nail dipping method to obtain the velocity of liquid steel and free surface profile of the mold by measuring the slope and direction of the solidified liquid steel on the nail plate.
However, the quantitative high temperature measurements of velocities near the mold surface under the different CC parameters, such as the different casting speeds, argon gas flow rates, immersion depths of SEN and different nozzle bottom shapes were rarely carried out together with a comparison of the numerical simulation results. These quantitative results are very important for steel plants to optimize the flow field in the mold to minimize the slag entrainment defects for automobile exposed panel production.
In our previous research studies, the rod deflection method [24] was proposed as a technique to obtain the velocity near the mold surface by measuring the deflection angle of a detecting rod inserted into the liquid steel. With the combination of the measurement of velocity near the mold surface and mathematical modelling, the flow fields in the mold with the narrow width [25] and the medium width [26] were also investigated under the different CC parameters. In this paper, under the different CC parameters of the casting speed, argon gas flow rate, SEN immersion depth and bottom shape, the rod deflection method was used to quantitatively measure the velocity near the surface of the mold at a high temperature. Furthermore, the standard k-ε coupled with DPM model was simultaneously used to quantitatively study the effects of the above CC parameters on the velocity near the liquid surface, flow pattern, and liquid level fluctuation in the mold with a large width of 1800 and 2000 mm. Here. the influence of various CC parameters on the flow field is clarified, which is helpful in order to reduce the incidence of slag entrainment defects in the CC process with molds with large widths for producing automobile exposed panels.

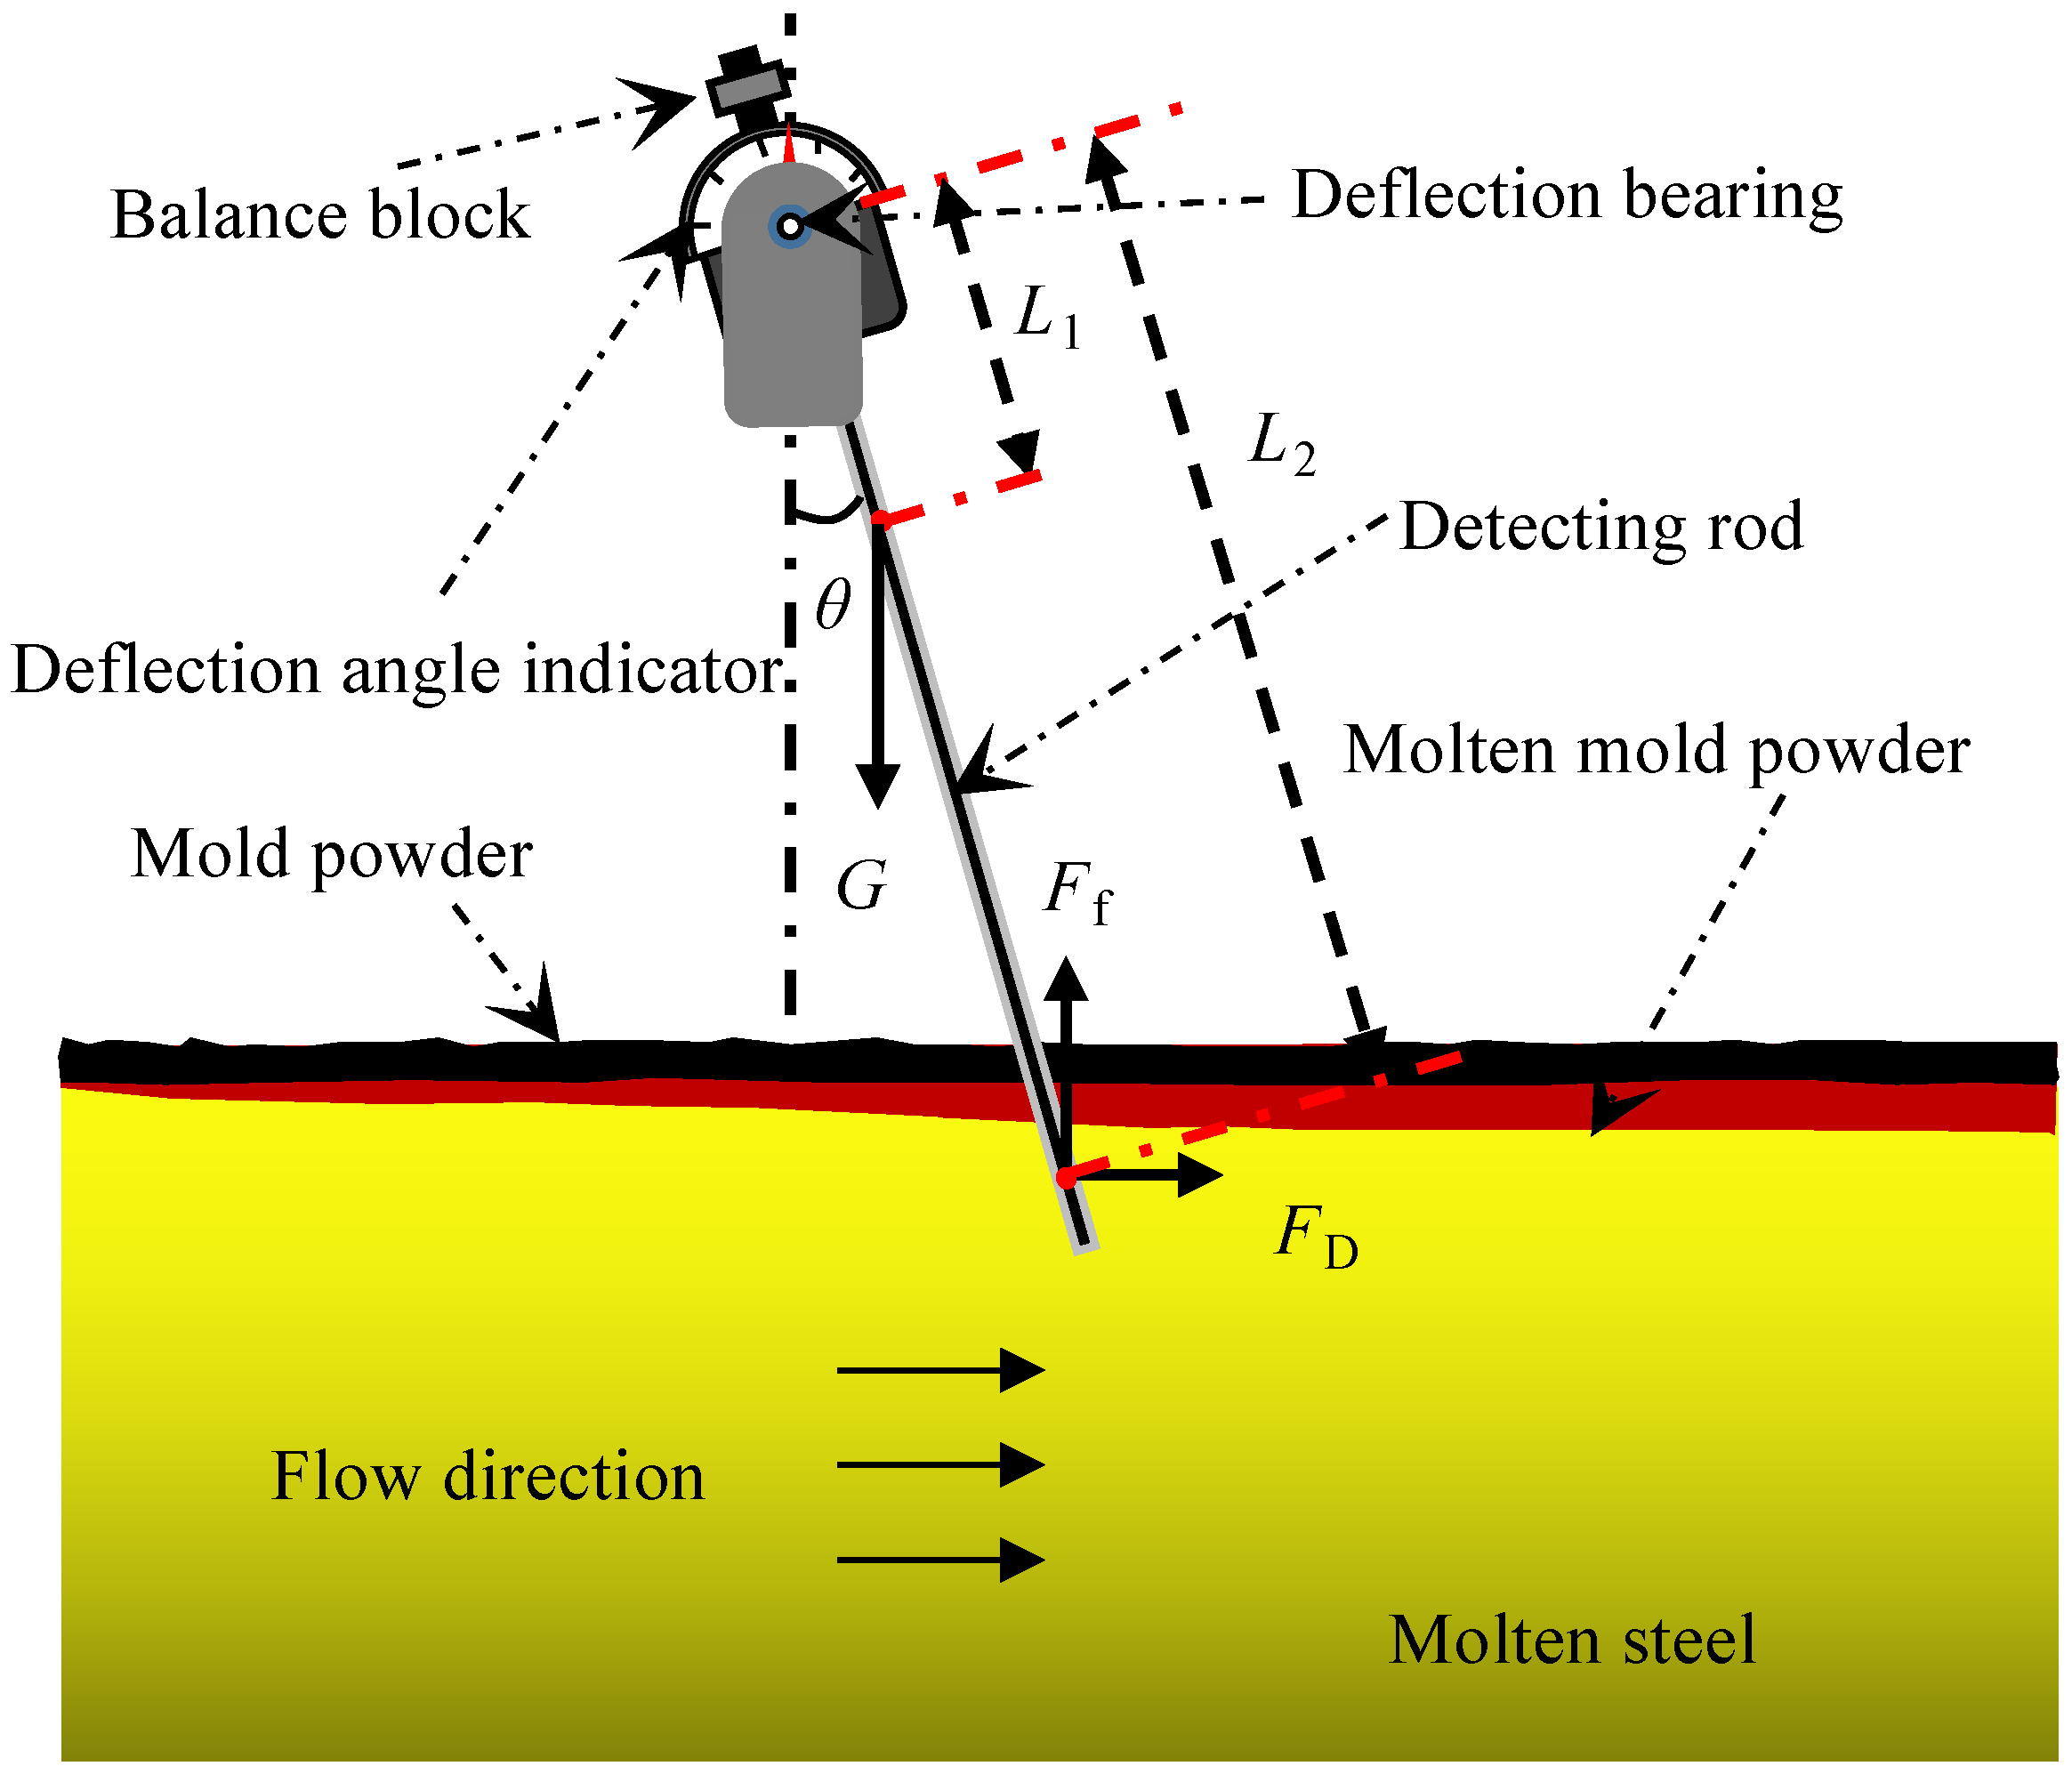
2. High Temperature Velocity Measurement Method

For the ultra low carbon steel used for producing automobile exposed panels, a high temperature velocity measurement was conducted. In order to measure the velocity near the mold surface more accurately and simply, the rod deflection method was put forward in our previous research [24,25,26,27]. In Figure 1, the velocity measuring device of the rod deflection method is composed of a balance block, deflection bearing, deflection angle indicator and detecting rod. The function of the balance block is to make the center of gravity of the whole velocity measuring device close to the center of the deflection shaft, which means that a slight change in the liquid steel flow rate can be reflected in the deflection angle of the detecting rod. When measuring the velocity near the surface of the mold, it is only necessary to insert the detecting rod into the position at the 1/4 width of the mold. In this process, the detecting rod should be perpendicular to the mold surface. The impact of the molten steel flow on the rod will cause its deflection of a certain angle. The stainless steel is used for the detecting rod material because it has no magnetism and is not affected by the electromagnetic field. One stainless steel detecting rod with a diameter of 10 mm can stay in the molten steel for about 30 s before it melts and 10 deflection angles can be collected after that the detecting rod tend to be stable in the molten steel. Under each process condition, three detecting rods were used to obtain more than 30 deflection angles.
When the three forces of gravity, buoyancy force and impact force acting on the detecting rod reach a balanced state, the detecting rod leans to a certain deflection angle (θ), the relationship of three forces can be described by the following equation:
G L 1 sin θ F f L 2 sin θ = F D L 2 cos θ
where G is the gravity of the detecting rod (N). L1 is the distance between the barycenter of detecting rod and the rotational pivot (m). Ff is the buoyancy force on detecting rod (N). FD is the impact force on detecting rod (N). L2 is the distance between the acting point of the impact force and the rotational pivot (m). The impact force can be obtained by the Equation (2), because the impact force of liquid steel on the detecting rod is equal to the drag force.
F D = C D ρ U 0 2 2 A
where U0 is the velocity near the mold surface (m/s). CD is the resistance coefficient of the flow. ρ is the density of the molten steel (kg/m3). A is the projected area of the immersion part of the detecting rod in the direction vertical to the flow of molten steel (m2). So, the velocity near the mold surface can be calculated from the deflection angle (θ) of the detecting rod from Equation (3).
U 0 = 2 ( G L 1 tan θ F f L 2 tan θ ) L 2 C D ρ A
The velocities near the mold surface can be quantitatively measured at high temperatures by using this method. For a detailed description of the measuring method of the rod deflection method refer to our previous papers [24,25,26,27].

3. Mathematical Model

3.1. Numerical Simulation

In this paper, a standard k-ε model coupled with the DPM model aiming to build a connection between the continuous phase and the discrete phase, was applied to simulate the turbulent flow in the SEN and CC mold. In order to simplify the complex solution process, some reasonable assumptions were applied in the numerical simulation in this paper. These include: that molten steel is an incompressible fluid; the argon gas bubbles are rigid spheres with a uniform diameter, which are not affected by pressure and temperature; the fusion between bubbles and bubble rupture are ignored; the discrete phases such as argon gas bubbles do not occupy the volume in the computational domain and are regarded as point particles; the influence of the solidified shell of slab on the flow field is ignored; the influence of mold powder on the flow field is ignored; the mold oscillations are not considered.

3.2. Governing Equation

In the calculation of the liquid steel and argon two-phase flow in the mold, the Euler method was used for the liquid steel continuous phase and the Lagrange method was used for the argon gas discrete phase. The discrete phase and continuous phase are coupled by source term F in governing Equation (5). The continuous phase and the discrete phase are a bidirectional coupling. The movement of the particles is affected by the continuous phase, and conversely, the particles also affect the movement of the continuous phase.
The mass conservation (Equation (4)) and the momentum conservation (Equation (5)) equations are used to calculate the motion of continuous phase.
ρ t + ( ρ u i ) x i = 0
t ( ρ u i ) + ( ρ u i u j ) x i = p x i + x j [ ( μ l + μ t ) ( u i x j + u j x i ) ] + ρ g i + F
where u is the flow velocity (m/s); ρ is the density of molten steel (kg/m3); p is the pressure; μl + μt is the effective viscosity (Pa·s); g is the gravitational acceleration (m/s2); F is the force of the argon gas bubbles acting on the molten steel (N/m3).
In this paper, the turbulent flow is simulated with the standard k-ε model. The turbulent viscosity μt is a function of the turbulent kinetic energy k and the turbulent energy dissipation rate ε.
μ t = C μ ρ k 2 ε
The standard k-ε model ignores the effect of molecular viscosity, and establishes two transport equations of k and ε.
t ( ρ k ) + x i ( ρ k u i ) = x j [ ( μ l + μ t σ k ) k x j ] + G k ρ ε
t ( ρ ε ) + x i ( ρ ε u i ) = x i [ ( μ l + μ t σ ε ) ε x j ] + C 1 ε k G k C 2 ρ ε 2 k
where the constants in the model are Cμ = 0.09, σk = 1.00, σε = 1.30, C1 = 1.44, C2 = 1.92.
Gk is the turbulent kinetic energy generation, which is expressed as:
G k = μ t ( u i , j x j + u i , j x i ) u i , j x j
To calculate F for Equation (5), the DPM model solves a force balance on each argon gas bubble governed by Newton’s second law and can be described as following:
m b d u b d t = F d + F g + F b + F v + F P + F L
where mb is the mass of bubble (kg); μb is the velocity of bubble (m/s); Fd is the drag force (N); Fg is the gravitational force (N); Fb is the buoyancy force (N); Fv is the virtual mass force (N); Fp is the pressure gradient force (N); FL is the lift force (N). All the detailed information about the forces mentioned above has been carefully explained in our previous work [24].

3.3. Computational Domain and Boundary Conditions

Figure 2 shows the geometry and computational meshes of the mold. The computational domain consists of 680,000 cells. In particular, the mesh size in the SEN is refined to calculate the fluid flow more accurately. The orthogonal quality is 0.47 (minimum) and the skewness is 0.52 (maximum). The parameters of the experiment and numerical simulation for each part are presented in Table 1.
For continuous phase molten steel, the inlet velocity can be regarded as a fixed value due to the mass conservation between the inlet and outlet. The outlet boundary condition is set to be the pressure outlet. The stable sliding surface is applied to be the free surface boundary condition. Additionally, the other wall boundary conditions are taken as the stable non sliding surface.
For the discrete phase of the argon gas bubbles, the argon gas bubbles are set as rigid spheres with a diameter of 1 mm. The boundary conditions of the top free surfaces and the outlet of the mold are set to escape, which means that the discrete phase particles will escape from the computational domain when touching these regions. The boundary condition of the SEN is taken as a reflection. Namely, the particles will rebound away from the wall with the recovery coefficient specified by the user. All the boundary conditions of the remaining walls are set to be a trap, and particles will be adsorbed on the walls when contacting with the walls. The convergence criterion is set to be that the residual value is smaller than 0.001. The unsteady simulations are chosen to describe the flow of the molten steel in the mold because of the transient flow field in the actual mold. For the present work, the time step for the simulation is 0.005 s, and the total time of calculation for the continuous casting process is 30 s; when the flow field in the mold has reached a relatively stable state. Consequently, the simulated results after calculation for 30 s are presented in this paper.

4. Results and Discussion

In this paper, the rod deflection method was used to measure the velocity near the mold surface under the different CC parameters (casting speed, argon gas flow rate, SEN immersion depth and bottom shape). Moreover, the calculated and measured results under these conditions are compared and analyzed. The effects of the different CC parameters on the flow pattern and liquid level fluctuation in the mold are further studied.

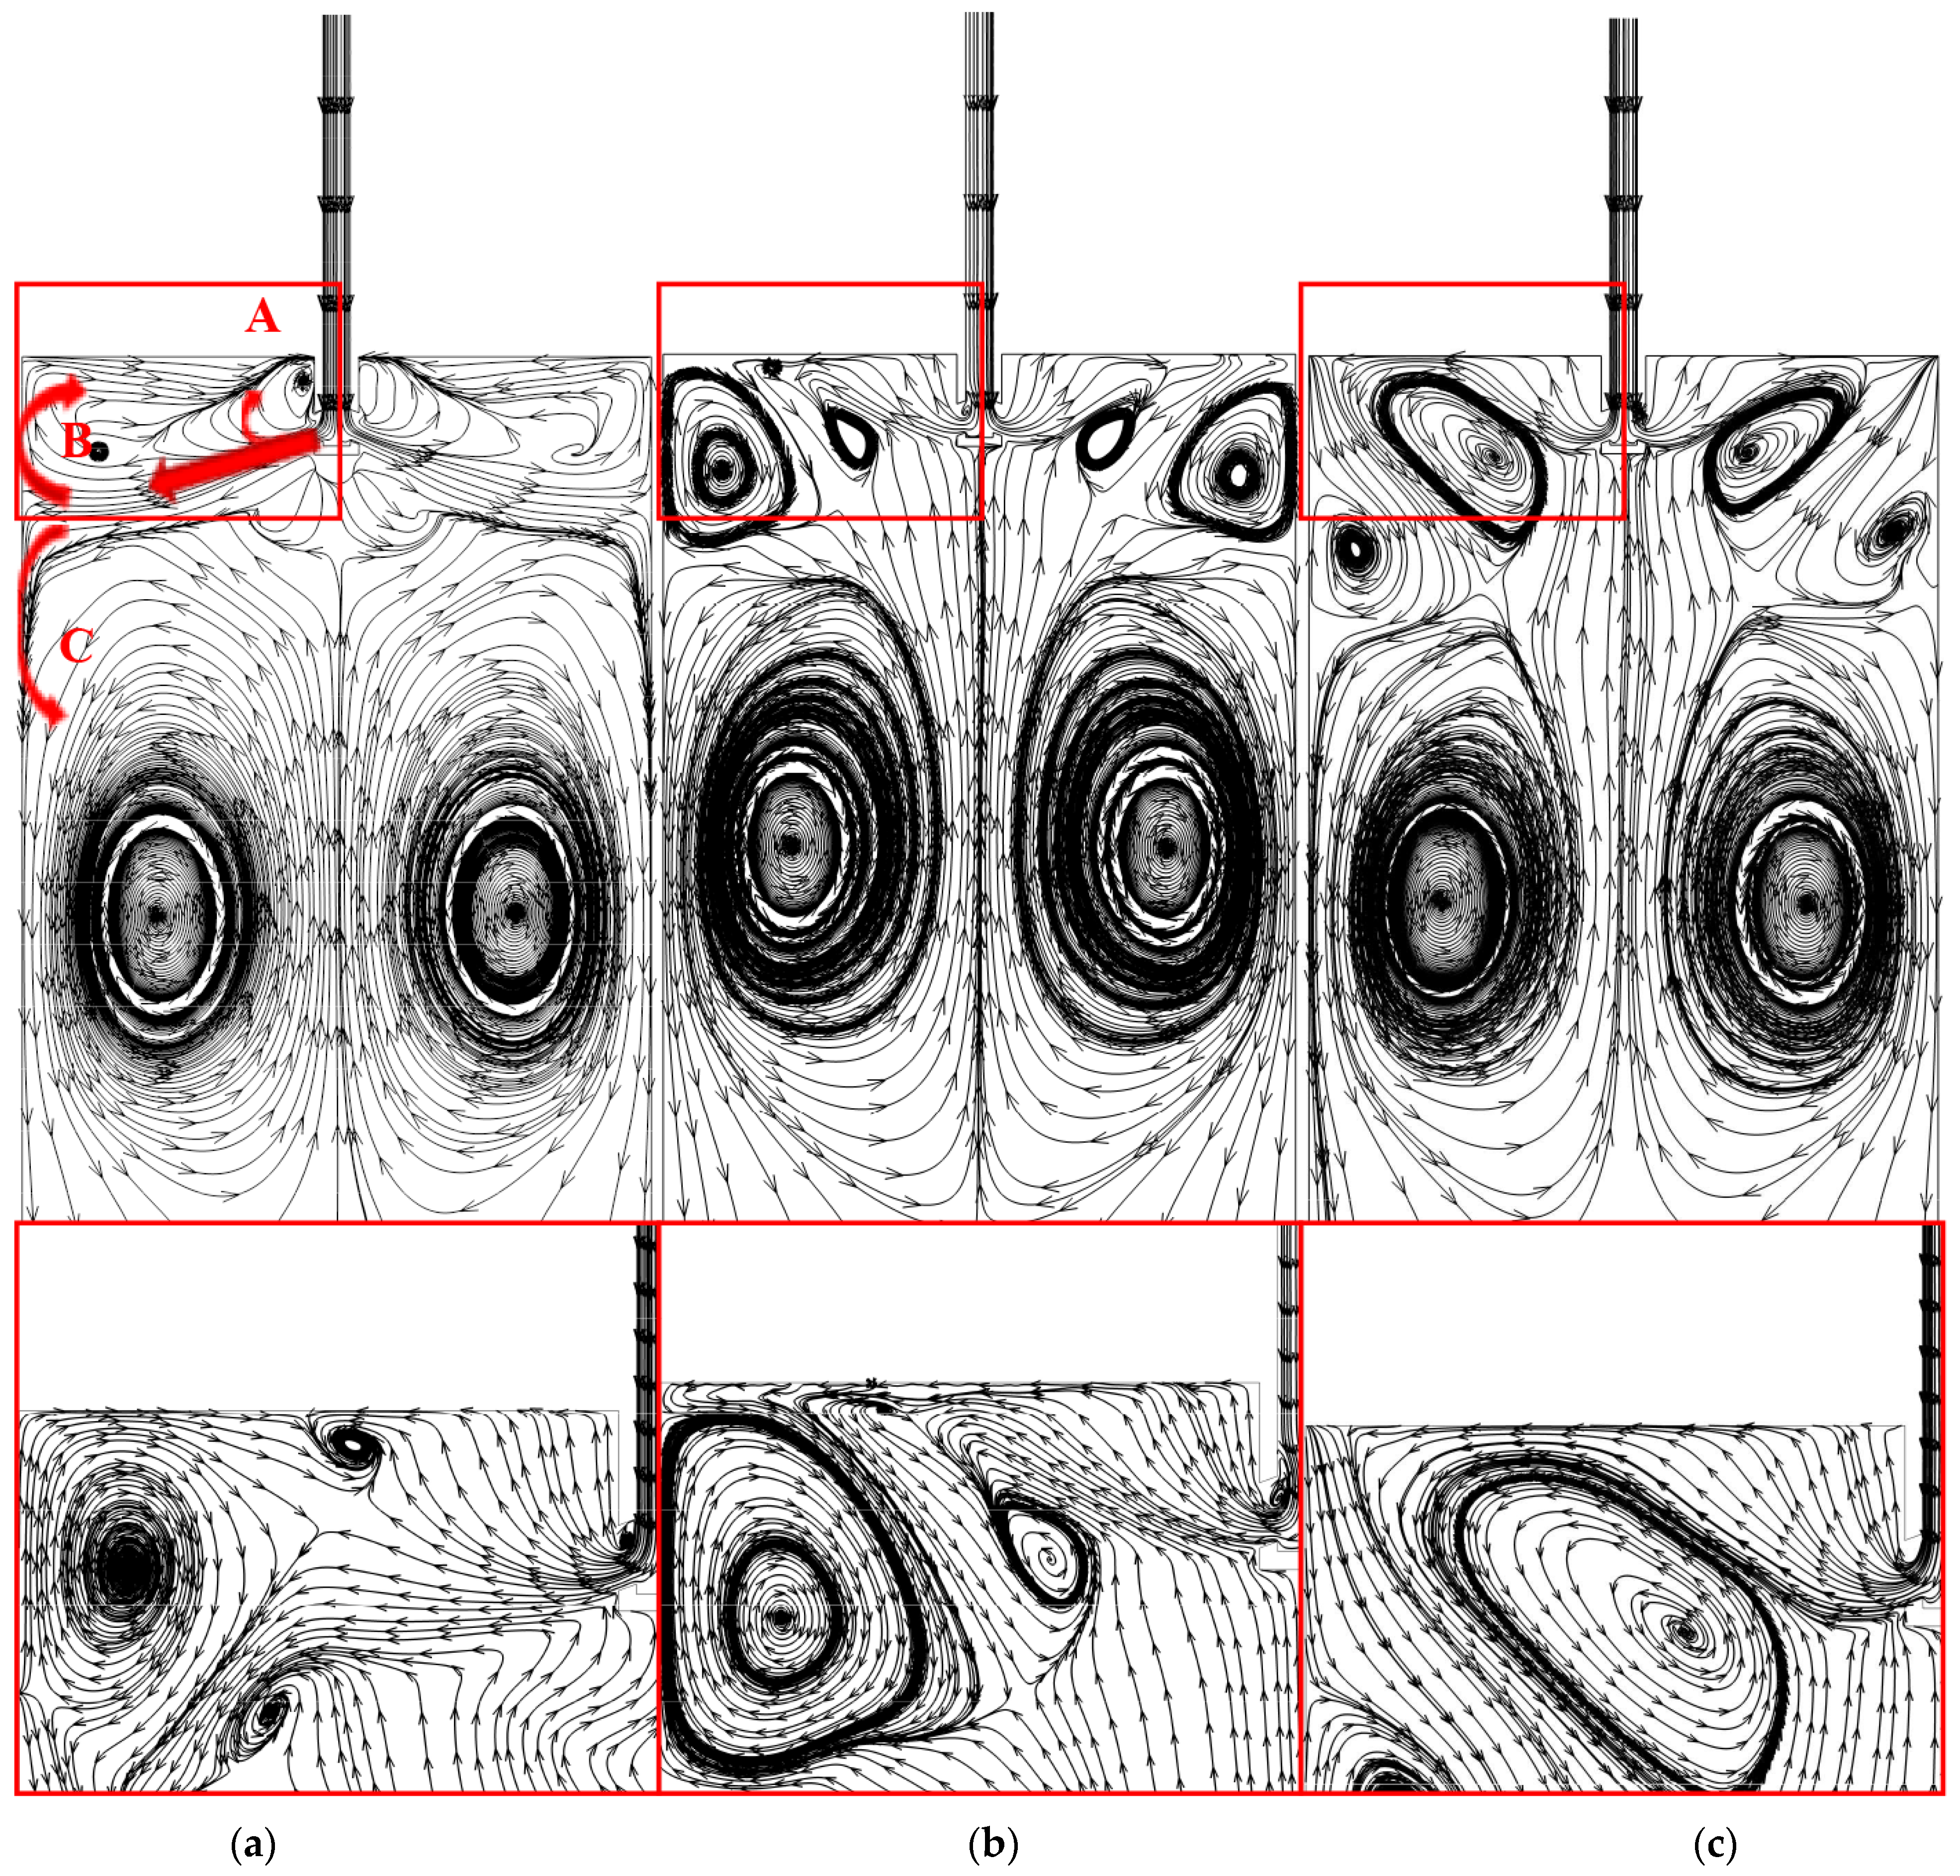
4.1. Effect of Argon Gas Flow Rate

In Figure 3, the calculated velocities near the mold surface are compared with the measured ones under the different argon gas flow rates. When the cross-section width is 1800 mm, the casting speed is 1.1 m/min, and the nozzle immersion depth is 140 mm. The calculated velocity is the velocity 10 mm below the top surface of the mold. It is clear that the calculated results match well with the measured results. With increasing argon gas flow rates, both the measured and calculated values show a decreasing trend. When the argon gas flow rate is 6 L/min, both the measured and calculated values are about 0.25 m/s, which indicates that the molten steel near the mold surface flows from the narrow wall to the SEN, so the flow pattern in the mold is the DRF. When the argon gas flow rates are 10 L/min and 14 L/min, the velocity near the mold surface is smaller than −0.2 m/s, indicating the flow pattern in the mold may be the intermediate flow (IF) or SRF. Therefore, the argon gas flow rate has a great influence on the flow pattern in the mold with a large width.
Figure 4 shows the streamlines on center plane Z = 0 of the mold, when the argon gas flow rates are 6 L/min, 10 L/min and 14 L/min, respectively, under the same conditions mentioned above. The figures below are the enlarged views corresponding to the marked area of the figures above. When the argon gas flow rate is 6 L/min, a part of the molten steel named stream A will flow up directly to the mold surface near the nozzle wall [28]. The other part molten steel stream flows to the narrow wall of the mold and then is divided into two streams when approaching the narrow wall. Stream B moves up along the narrow wall to reach the mold surface, and then flows to the nozzle. When meeting with stream A on the mold surface, it drives stream A and the SEN together, due to the fact that stream B is much stronger than stream A. Stream C moves down along the narrow wall to form a clockwise circulation flow in the lower part of the mold. Therefore, the flow pattern is DRF at the argon gas flow rate of 6 L/min, which has low risk of slag entrainment. Just as Kunstreich concluded, maintaining a stable DRF is key to eliminating slab defects [29].
When the argon gas flow rate is 10 or 14 L/min, the enlarger view below shows that stream A has occupied the whole upper circulation area, and stream B nearly disappears under the effect of the floating of the argon gas bubbles. The flow stream flowing out of the side port of the SEN no longer moves directly to the narrow wall, but instead moves directly up to the mold surface near the nozzle, thus forming an SRF. In this case, it is easy for slag entrainment to be caused due to the downward flow near the narrow wall of the mold. This results in the incidence of slag entrainment defects being greatly increased, which is consistent with the previous results [30,31].
The top-surface levels obtained from the surface pressure are related to the stability of the top surface. The top-surface liquid displacement (hi) was estimated from a simple potential energy balance [32]:
h i = P i P mean ( ρ steel ρ slag ) g
where the Pi is the pressure of one position on the top surface, Pmean is the mean value of pressure across the whole top surface; ρsteel is the density of the molten steel; ρslag is the density of the top slag and g is the gravitational acceleration rate.
Figure 5 is the top surface level profile of the mold under the same conditions and it can reflect the fluctuation of the top free surface of the mold. When the argon gas flow rate is 6 L/min, the fluctuation of the whole liquid level is small, as shown in Figure 5a. As the stream moves out of the nozzle, it impacts the narrow wall and consumes part of the kinetic energy, and then enters the top free surface at a certain angle. So, a small fluctuation of the free surface will be formed between the narrow wall and the SEN. When the argon gas flow rate is 10 L/min, the fluctuation of the liquid level near the nozzle increases, as shown in Figure 5b. The high fluctuation area increases obviously, resulting in the increased risk of slag entrainment. When the argon gas flow rate is 14 L/min—because a large amount of molten steel rushes to the top free surface near the nozzle—the fluctuation of the whole free surface will inevitably deteriorate sharply, and the risk of slag entrainment will further increase, as presented in Figure 5c. Therefore, when the mold width is 1800 mm, the immersion depth is 140 mm, and the casting speed is 1.1 m/min, the argon gas flow rate should be controlled at or below 6 L/min.

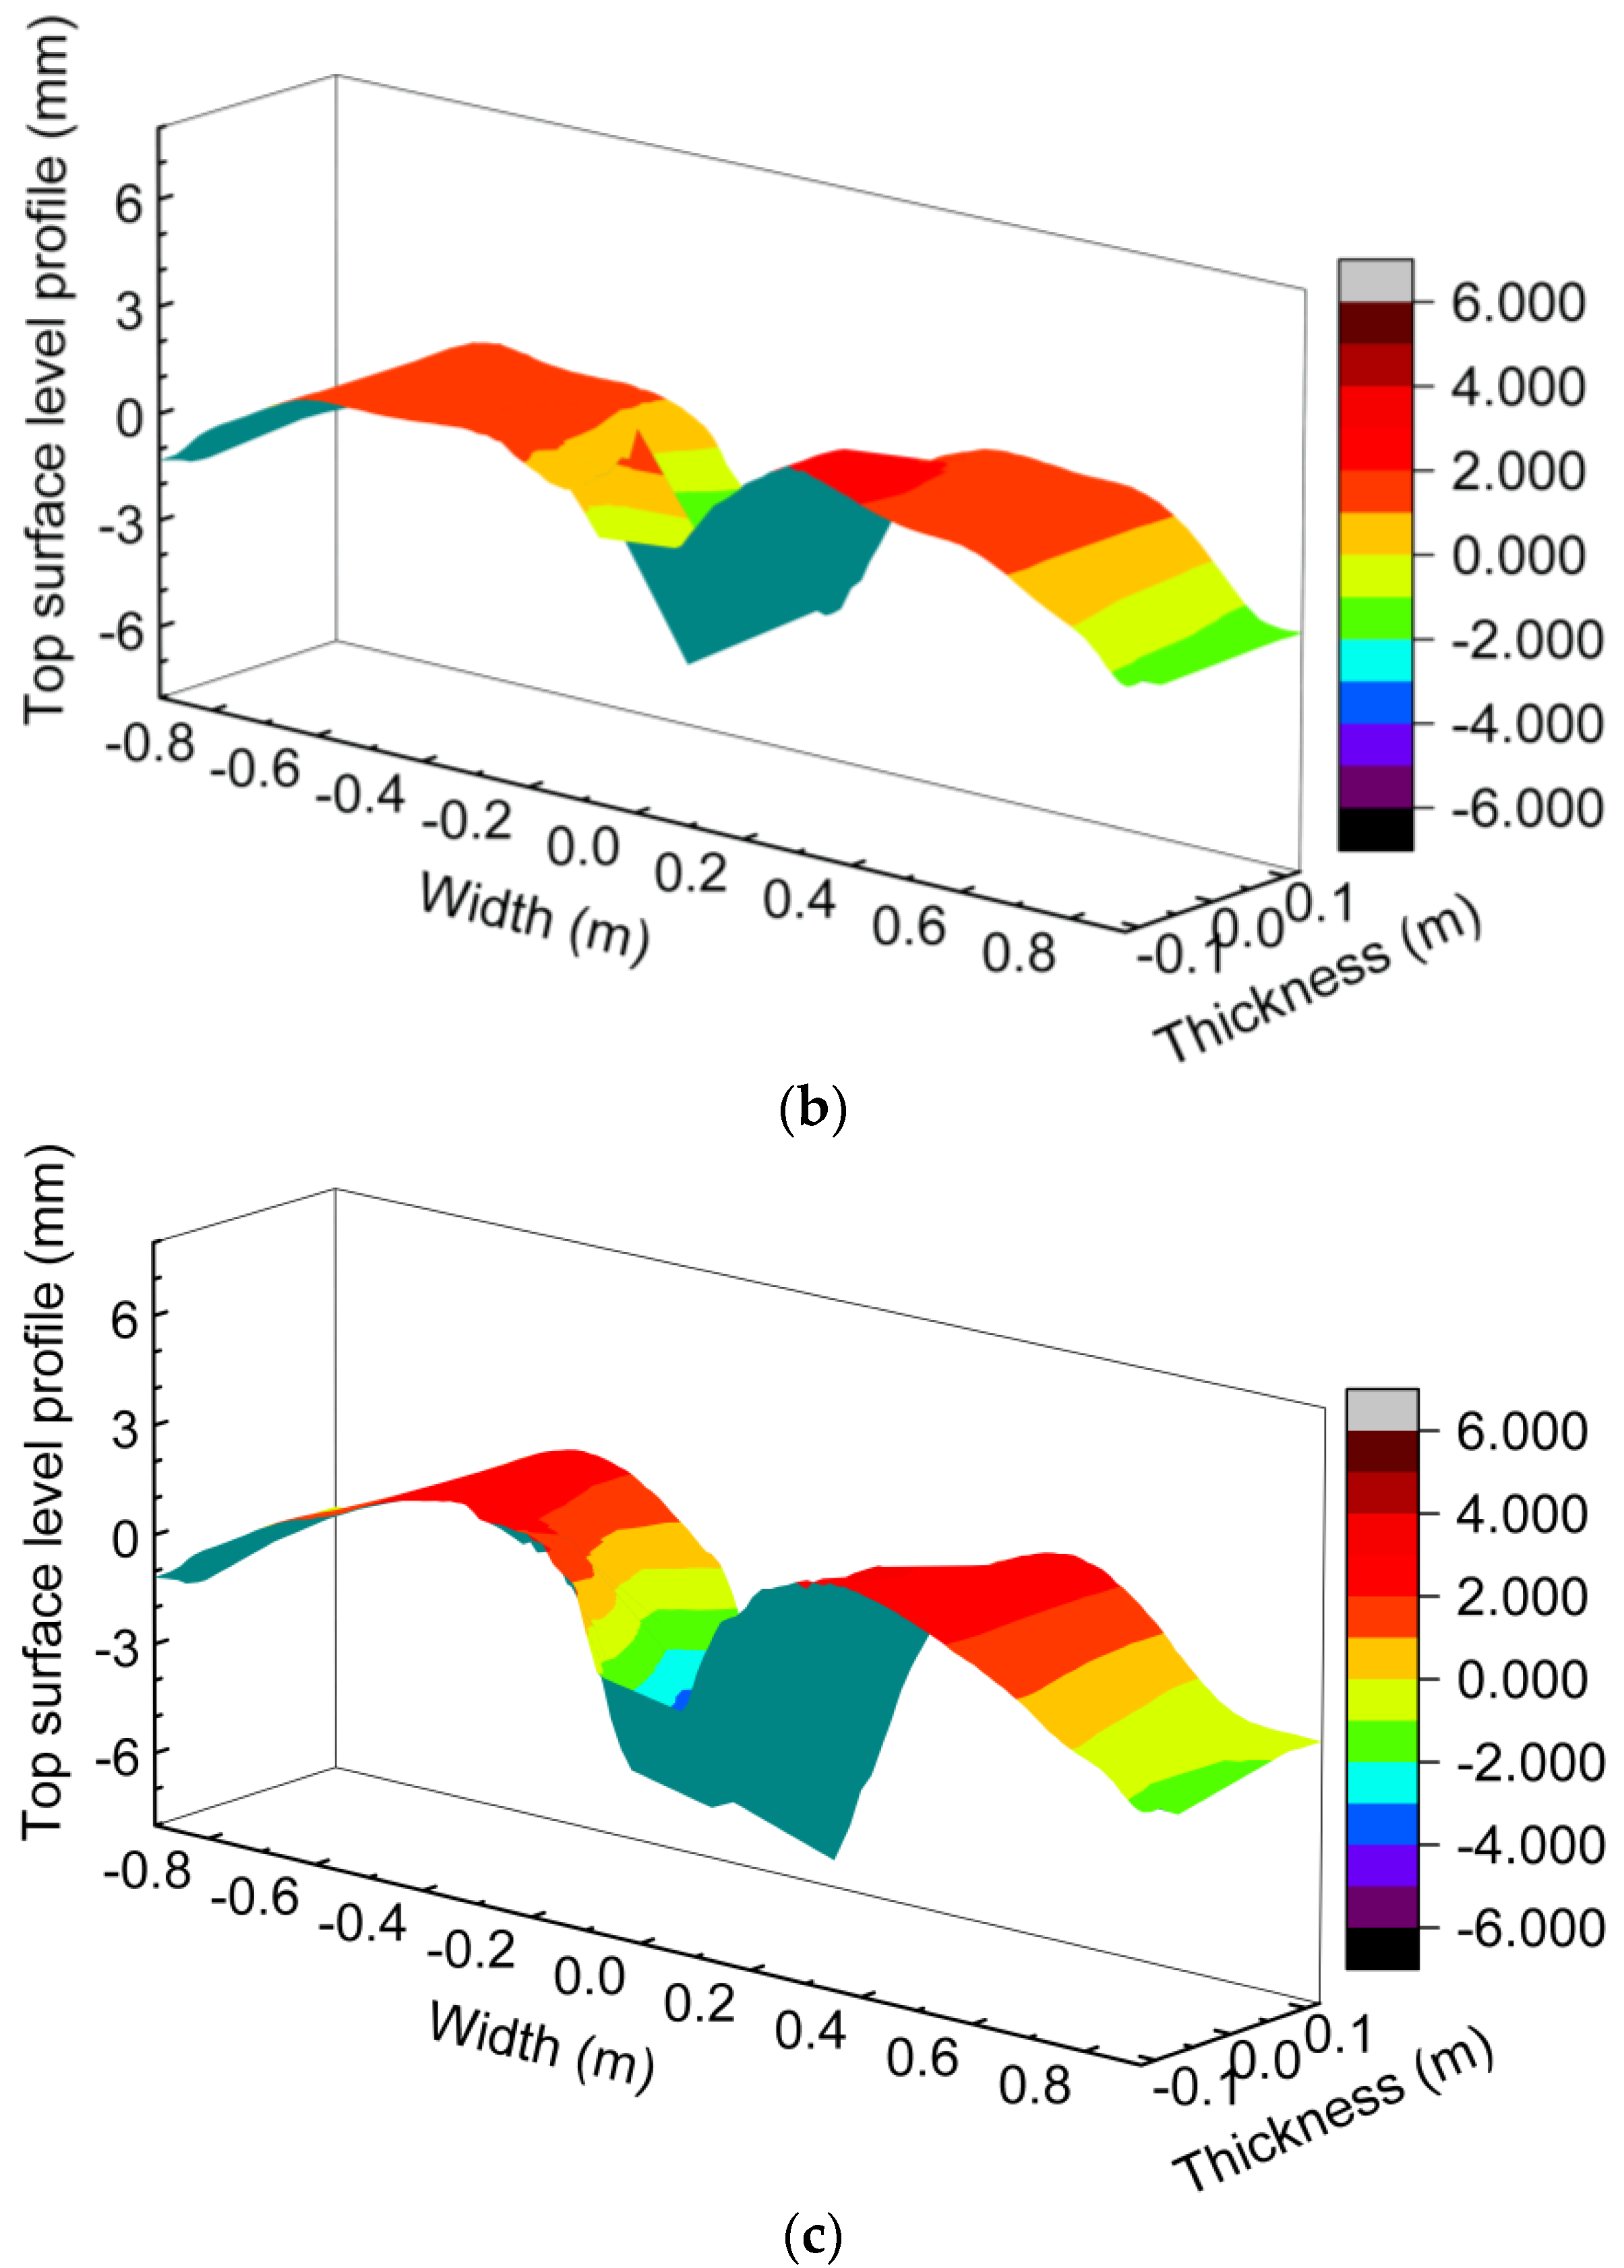
4.2. Effect of Casting Speed

The calculated velocity near the mold surface is compared with that measured at the different casting speeds in Figure 6. The experimental conditions are a mold width of 1800 mm, argon gas flow rate of 10 L/min, immersion depth of 160 mm, and casting speed of 1.1 and 1.2 m/min, respectively. The calculated results match well with the measured results. When the casting speed is 1.1 m/min, both the calculated and measured liquid steel flow velocities are negative, which indicates that the flow direction of the molten steel near the mold surface is from the SEN to the mold narrow wall and the flow pattern may be IF or SRF. However, when the casting speed is increased to 1.2 m/min, the measured and calculated values are both positive and the flow velocity is close to 0.4 m/s. Namely, the flow direction of the molten steel near the mold surface is from the mold narrow wall to the SEN and the flow pattern is DRF. On the other hand, the velocity of 0.4 m/s is generally regarded as the upper limit velocity near the mold surface. When the velocity is larger than 0.4 m/s, the risk of shear entrainment of the mold powder will be greatly increased [33]. Therefore, the casting speed should be controlled to be smaller than 1.2 m/min. It can be seen, that the change of casting speed is only 0.1 m/min, but the flow velocity near the mold top free surface changes drastically and the flow direction is reversed sharply. Therefore, the flow field in the CC mold with a large width is very sensitive to the casting speed. The main reason is that the change in steel throughput is very large when the casting speed is changed for the CC mold with a large width.
Figure 7 presents the comparison of the streamlines on the center plane of the mold when the casting speed is 1.1 and 1.2 m/min, respectively. From Figure 7a, it can be clearly seen that when the casting speed is 1.1 m/min, stream A—which flows directly to the mold surface near the nozzle—is stronger than stream B. Therefore, the molten steel near the mold surface at 1/4 the width of the mold flows from SEN to the narrow wall. The reason is that the jet stream from the side port is relatively weak and is lifted and dissipated by the flotation of the argon gas bubbles. Moreover, owing to the shallow immersion depth of the SEN, the upward molten steel near the port of the SEN can reach the mold surface with a small kinetic energy loss and flow to the narrow wall, thus forming an IF flow pattern between the SRF and DRF. This was discussed in Kunstreich and Liu’s research, where it was stated that this flow state is unstable and the meeting point changes with time [29,34]. The risk of slag entrainment in this flow state is also high.
In contrast, when the casting speed is 1.2 m/min, the flow of molten steel from the side port is relatively strong and most of the molten steel flows directly to the narrow wall and is divided into two streams. The upward stream B moves up along the narrow wall to the mold top surface, and then flows towards the SEN. Stream C flows downwards along the narrow wall to form a counterclockwise circulation flow in the left lower part of the mold. Under the influence of the floating of the argon gas bubbles, the small stream A with a small amount of kinetic energy will move up near the SEN wall, but the flow is very weak. At the high casting speed of 1.2 m/min, stream B is much stronger than steam A and so plays the dominant role, thus forming the DRF.
Figure 8 shows the top surface level profile of the mold under the same conditions mentioned above. When the casting speed is 1.1 m/min, most of the molten steel flows upwards to the top free surface near the nozzle under the effect of the floating of the argon gas bubbles, so that the liquid level near the SEN fluctuates violently, as shown in Figure 8a. When the casting speed is 1.2 m/min—owing to the strong stream B—the molten steel can still flow to the top free surface with a large amount of kinetic energy after impacting the narrow wall, and then combines with the weak stream A to flow to the SEN together on the mold surface to form a DRF. It has also been reported that the fluctuation in the mold liquid level is relatively gentle under the DRF [35]. Therefore, when the mold width is 1800 mm, the argon gas flow rate is 10 L/min, and the immersion depth is 160 mm, the casting speed should be greater than 1.1 m/min and smaller than 1.2 m/min.

4.3. Effect of Immersion Depth

Under the conditions of a mold width of 1800 mm, casting speed of 1.1 m/min, and argon gas flow rate of 10 L/min, the numerical simulation results of the surface velocities are compared with the results obtained by the rod deflection method with the different SEN immersion depths in Figure 9. When the immersion depth of the SEN is 140 and 160 mm, the surface velocity of the mold is negative from the calculation and measurement results, which means that the flow direction of the molten steel near the mold surface is from the SEN to the narrow wall of the mold. So, it can be judged that the flow pattern is the SRF or IF. When the immersion depth is 180 mm, the velocity near the mold surface is positive. The flow direction of the molten steel near the mold surface is from the mold narrow wall to the SEN. Owing to the small surface velocity, the flow pattern can be judged as a weak DRF.
Figure 10 shows the streamlines on the center plane of the mold when the immersion depth is 140, 160 and 180 mm, under the above conditions. It can be seen from the streamlines that with increasing the immersion depth, the strengths of stream A and stream B change obviously. When the immersion depth is 140 mm, stream A is dominant, so the flow pattern in the mold is close to the SRF. When the immersion depth is 160 mm, the strength of stream A is almost equivalent to that of stream B, and the flow pattern in the mold should be IF. When the immersion depth is further increased to 180 mm, stream B dominates the upper circulation flow in the mold, and the flow pattern of the mold is weak DRF. The reason for this is that increasing the SEN immersion depth leads to an increase in the upwards distance of stream A, which makes it more difficult to directly impact the top free surface. Therefore, with an increasing SEN immersion depth, it is easier to form DRF, which can reduce the risk of slag entrainment.
Figure 11 shows the top surface level profiles of the mold under the same above conditions. When the casting speed is 1.1 m/min and the argon gas flow rate is 10 L/min, the kinetic energy of molten steel flowing out from side port is relatively small and the buoyancy force of the argon gas bubbles is relatively larger. When the immersion depth of the SEN is 140 mm, the climbing distance of the molten steel to the top surface is short, and the strong energy stream A impinging on the top free surface leads to a sharp fluctuation in the top free surface near the SEN and 1/4 width of the mold. With increasing the SEN immersion depth to 160 mm, stream A impinging on the free surface becomes weak due to large distance to the top surface. Stream B becomes stronger and tends to form IF. It can be seen in the liquid level fluctuation diagram that the change in liquid level gradually tends to be gentle, but the fluctuation near the nozzle is still intense. This is because the liquid steel can impact the top free surface under the buoyancy force of the argon gas bubbles, resulting in a sharp fluctuation in the liquid level near the nozzle. When the immersion depth of the SEN is further increased to 180 mm, more of molten steel of stream A will combine into stream B because of insufficient energy floating up. It is easier to form a DRF. Therefore, under the present process conditions, the mold flow field is the optimized when the immersion depth is 180 mm.

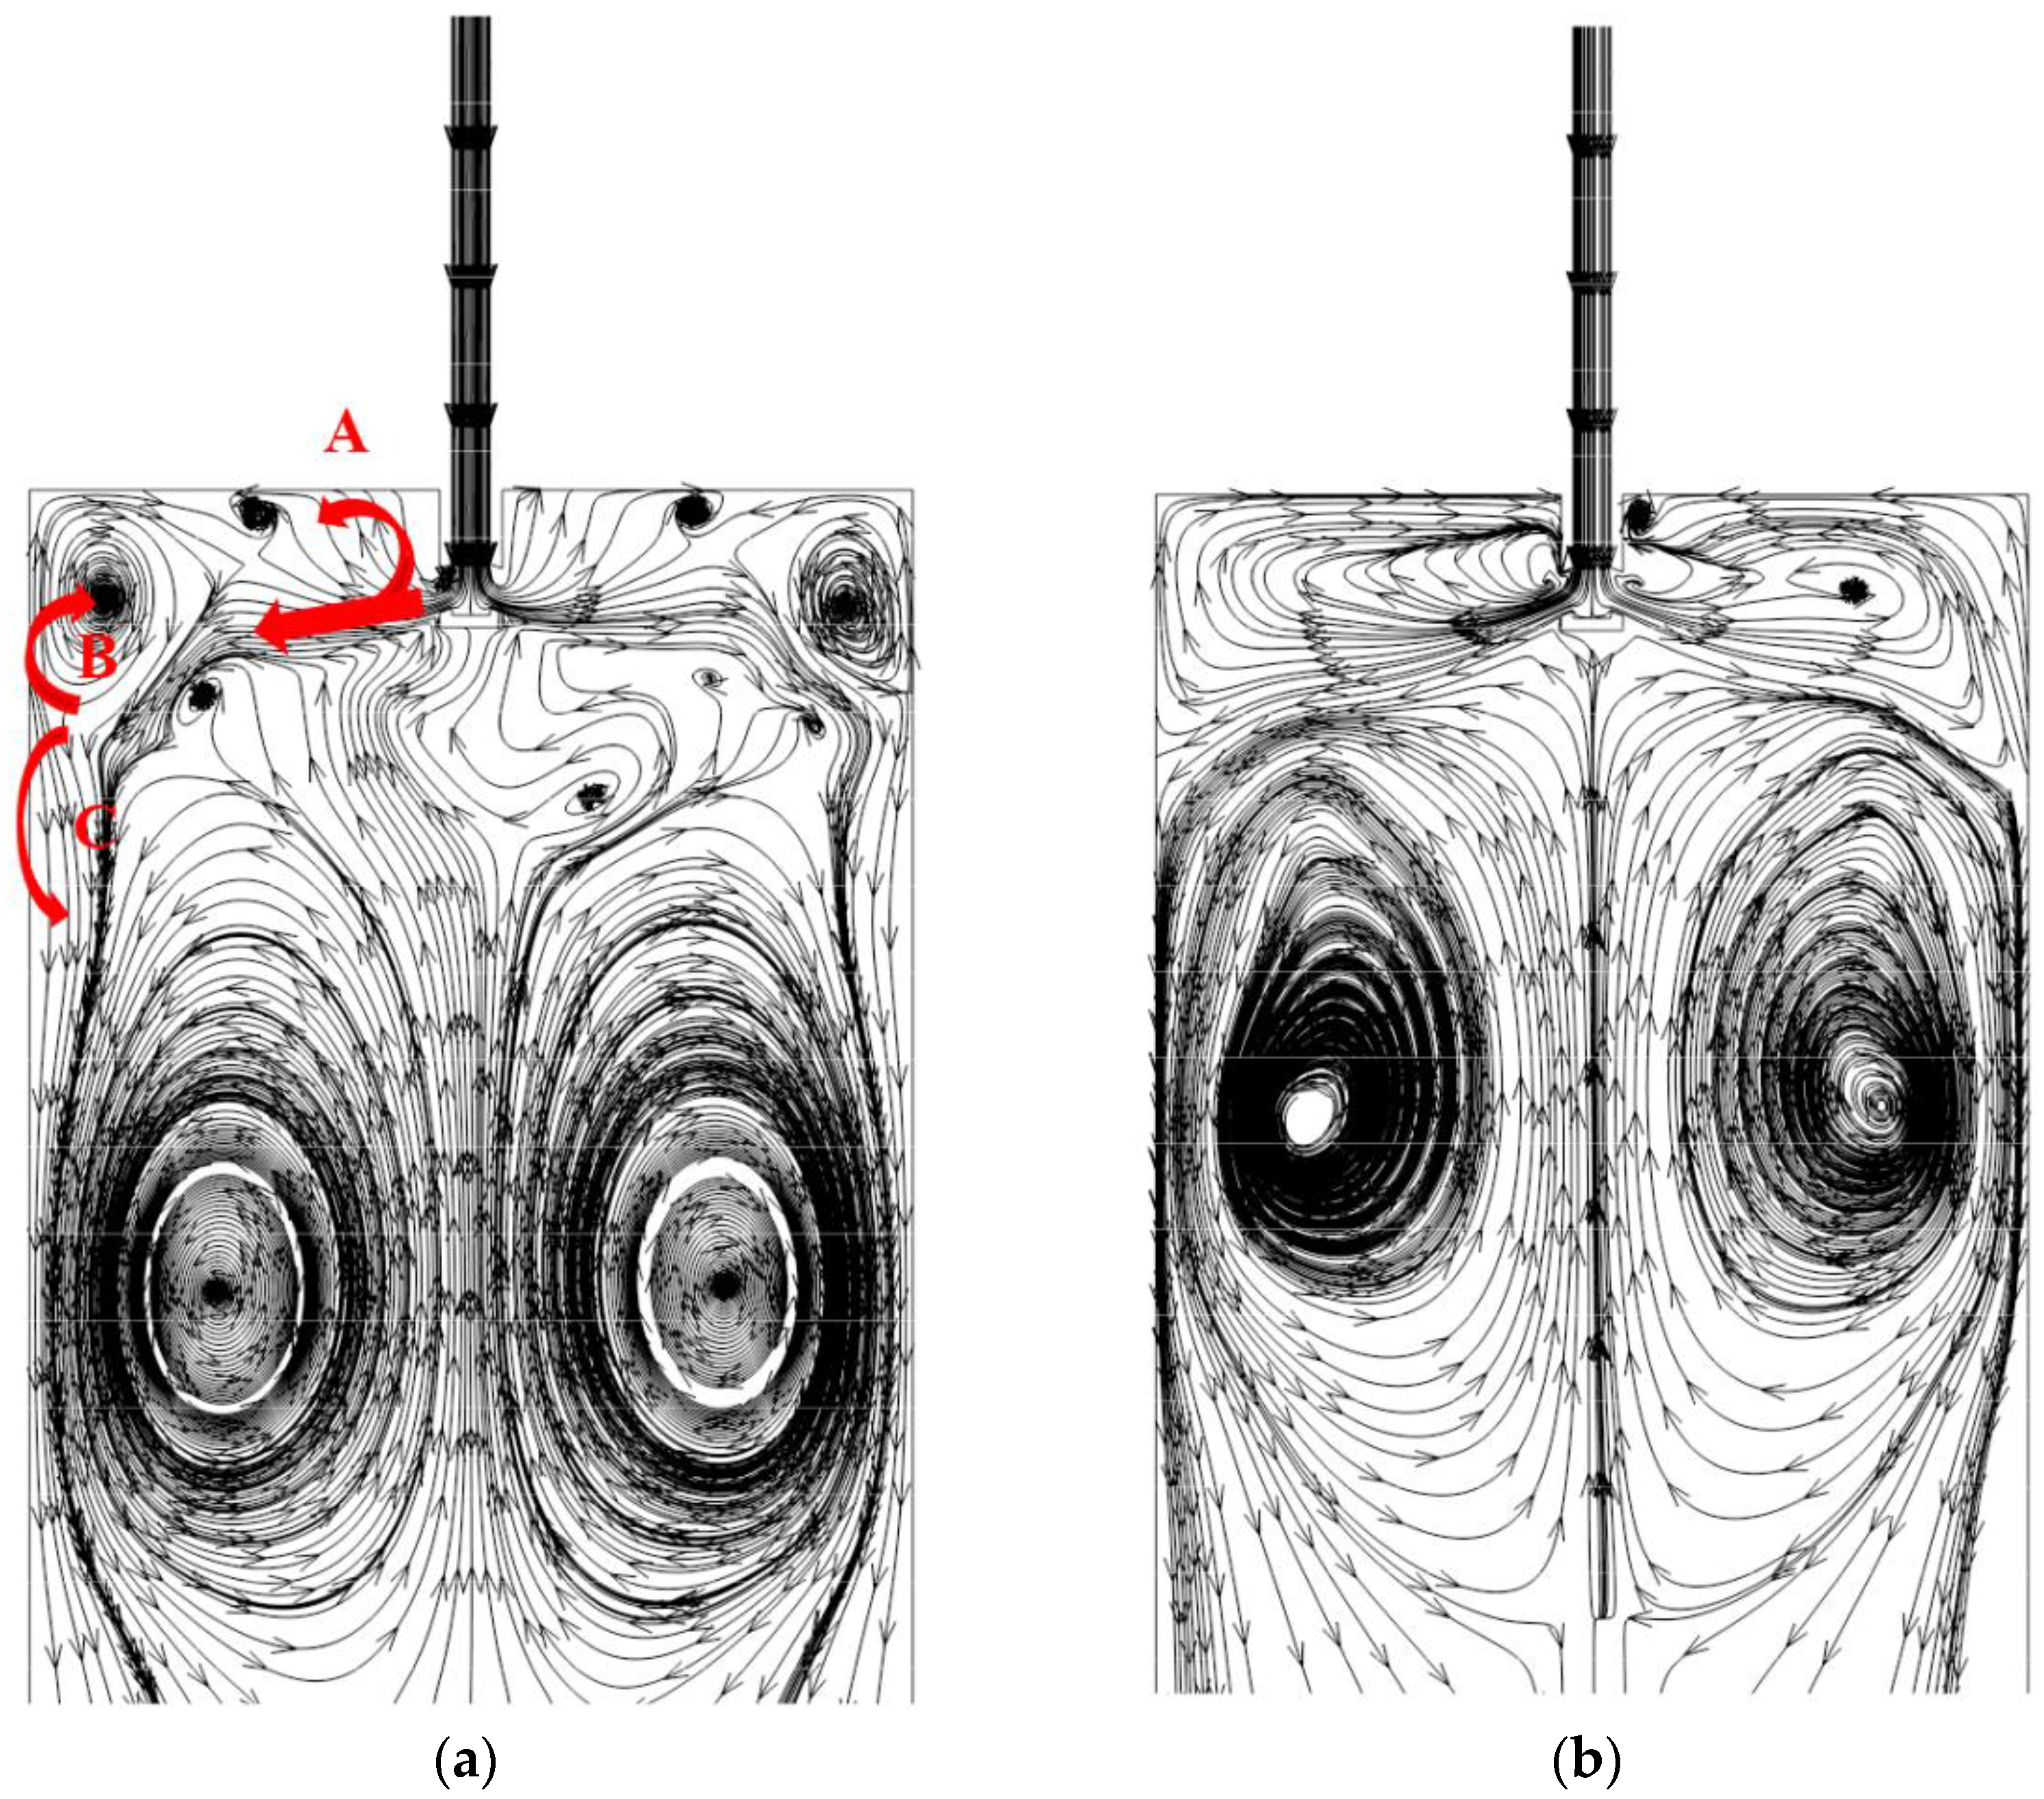
4.4. Effect of SEN Bottom Shape

Figure 12 shows the comparison between the surface velocities measured by rod deflection method and numerical simulation under the conditions of the mold width of 2000 mm, the casting speed of 1.0 m/min, the argon gas flow rate of 8 L/min and the immersion depth of 150 mm. When the bottom shape of the SEN is a mountain, the measured and calculated velocities near the mold surface are about 0.4 m/s. When the bottom shape of the SEN is a well, the measured and calculated velocities are smaller than 0.25 m/s. Although both are DRF, the former velocities are much larger than the latter ones.
Under the same conditions mentioned above, Figure 13 shows the streamlines on the center plane of the mold when the bottom shape is a mountain and a well. When the bottom shape is a mountain, the molten steel impinges on the bottom of the SEN without much consumption of kinetic energy due to the mountain bottom shape and ejects from the ports on both sides, and then impacts the narrow wall to split into two strong streams. A part of the flow stream moves intensively upwards along the narrow wall, enters the top free surface at a certain angle, then moves towards the SEN. Therefore, a strong DRF will be formed with the mountain bottom shaped SEN.
On the other hand, when the bottom shape of the SEN is a well, the molten steel will whirl and rebound in the groove when it impacts the bottom of the nozzle, resulting in a great loss of kinetic energy of the jet stream. The strength of the flow ejecting from the ports is much weaker than that of the mountain bottom shaped SEN, so that the DRF formed is obviously weaker.
Under the same conditions, Figure 14 shows the top surface level profiles of the mold with different bottom shapes of SEN. When the bottom shape is a mountain, the fluctuation of the free surface near the 1/4 width of the mold is quite intense, which is caused by the strong upward circulation flow [36]. The strong streams will eject from the ports on both sides without much consumption of kinetic energy due to mountain bottom shape. A part of flow stream moves intensively upward along the narrow wall to form the strong DRF. Under this condition, the surface velocity is as high as 0.4 m/s, so the liquid level fluctuation is large and the shear stress near the top surface is intensified, and the risk of slag entrainment is greatly increased. Lu also concluded that the strong upper circulation flow easily results in slag entrainment by the strong shear stress [31]. When the bottom shape is well, the free surface fluctuation of the mold is obviously alleviated. Under the present conditions, the SEN with a well bottom shape is much better than that with mountain shape bottom.

5. Conclusions

In this paper, the rod deflection method was applied to quantitatively measure the velocity near the mold surface at high temperatures under the different casting speeds: argon gas flow rates; the submerged entry nozzle (SEN) immersion depths; and bottom shapes of SEN. The k-ε model coupled with discrete phase model was utilized to simulate the flow field in the mold. The main conclusions are as follows.
(1)
Under the conditions of the large mold width of 1800 mm, 1.1 m/min casting speed and 140 mm SEN immersion depth, the velocity near the mold surface decreases with increasing the argon gas flow rate. The calculated results match very well with the measured results. When the argon gas flow rate is 6 L/min, the flow pattern is the double roll flow (DRF), and the liquid level fluctuation is small. When the argon gas flow rate is increased to 10 and 14 L/min, the flow pattern is the single roll flow (SRF), the liquid level fluctuation is large, and the risk of slag entrainment increases.
(2)
When the mold width is 1800 mm, the argon gas flow rate is 10 L/min, and the immersion depth is 160 mm, the velocity near the mold surface sensitively increases with increasing casting speed. The calculated results are consistent with the measured ones. When the casting speed is 1.1 m/min, the direction of the velocity near the mold surface is from SEN to narrow wall, forming an intermediate flow (IF). The mold surface fluctuation is obviously intensified, which is easy to cause slag entrainment defects. When the casting speed is only increased to 1.2 m/min, the velocity near the mold surface changes drastically and is close to 0.4 m/s, which is the upper limit velocity near the mold surface. Therefore, the optimized casting speed should be larger than 1.1 m/min and smaller than 1.2 m/min.
(3)
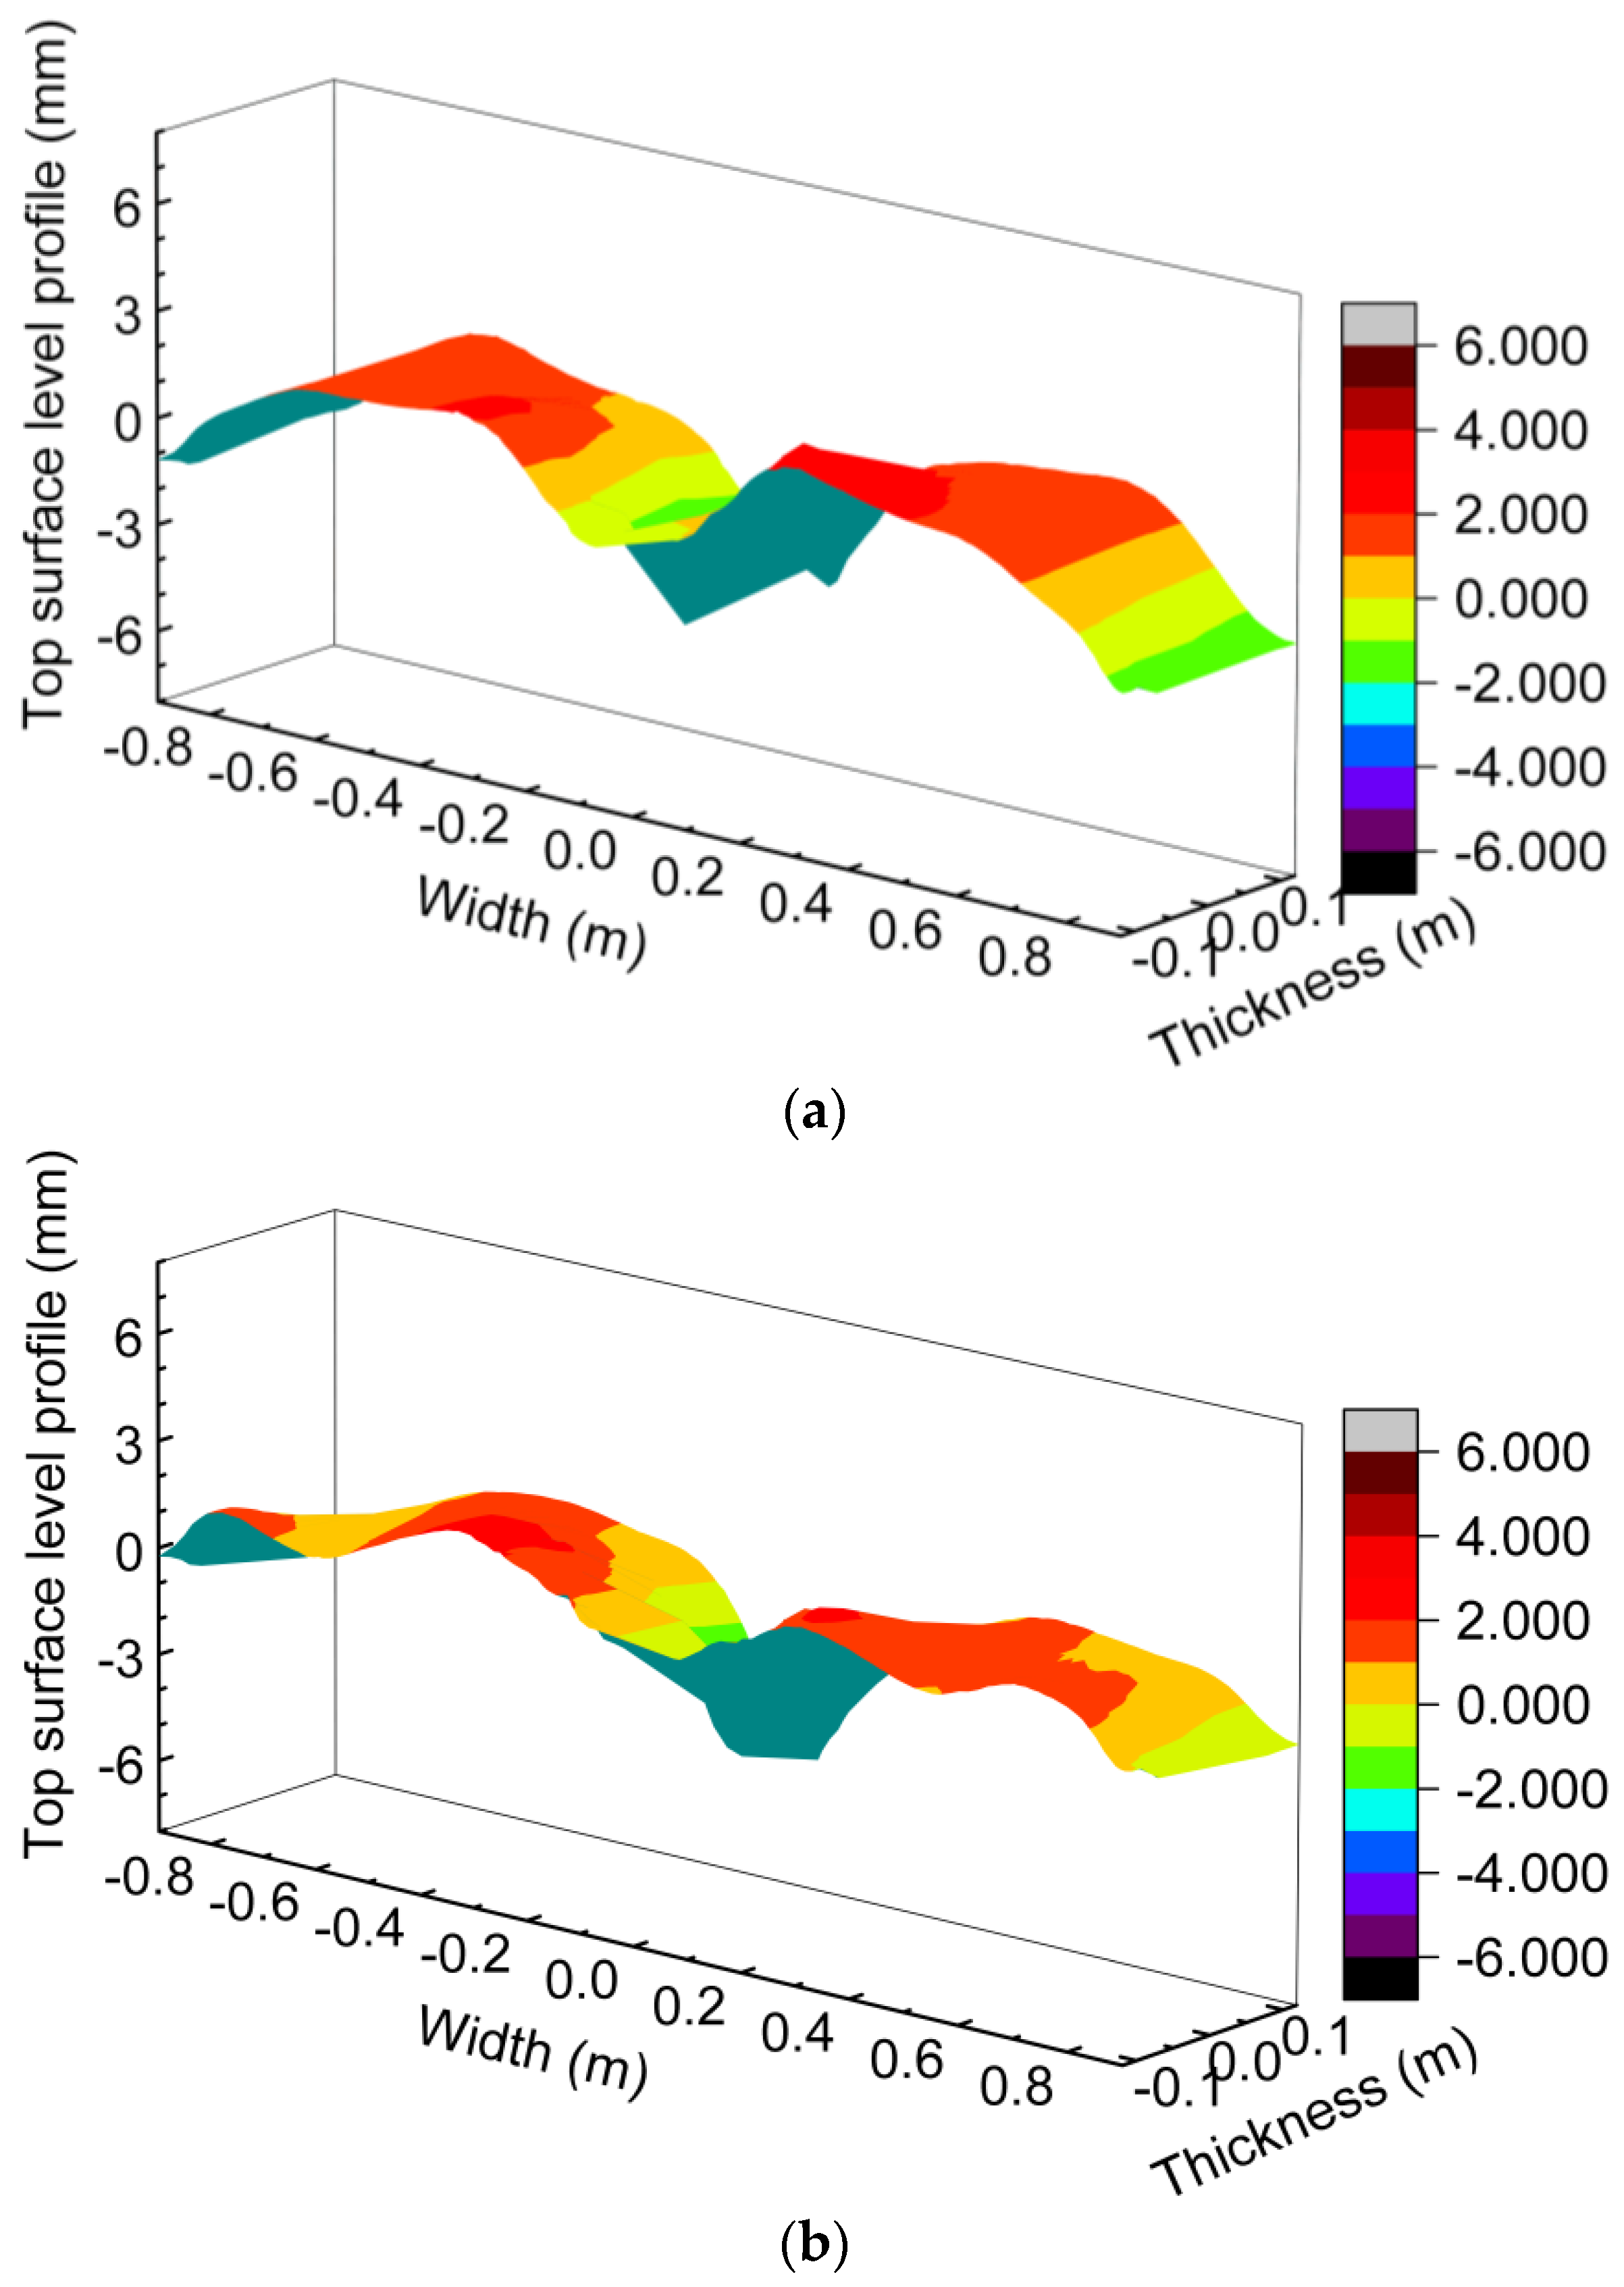
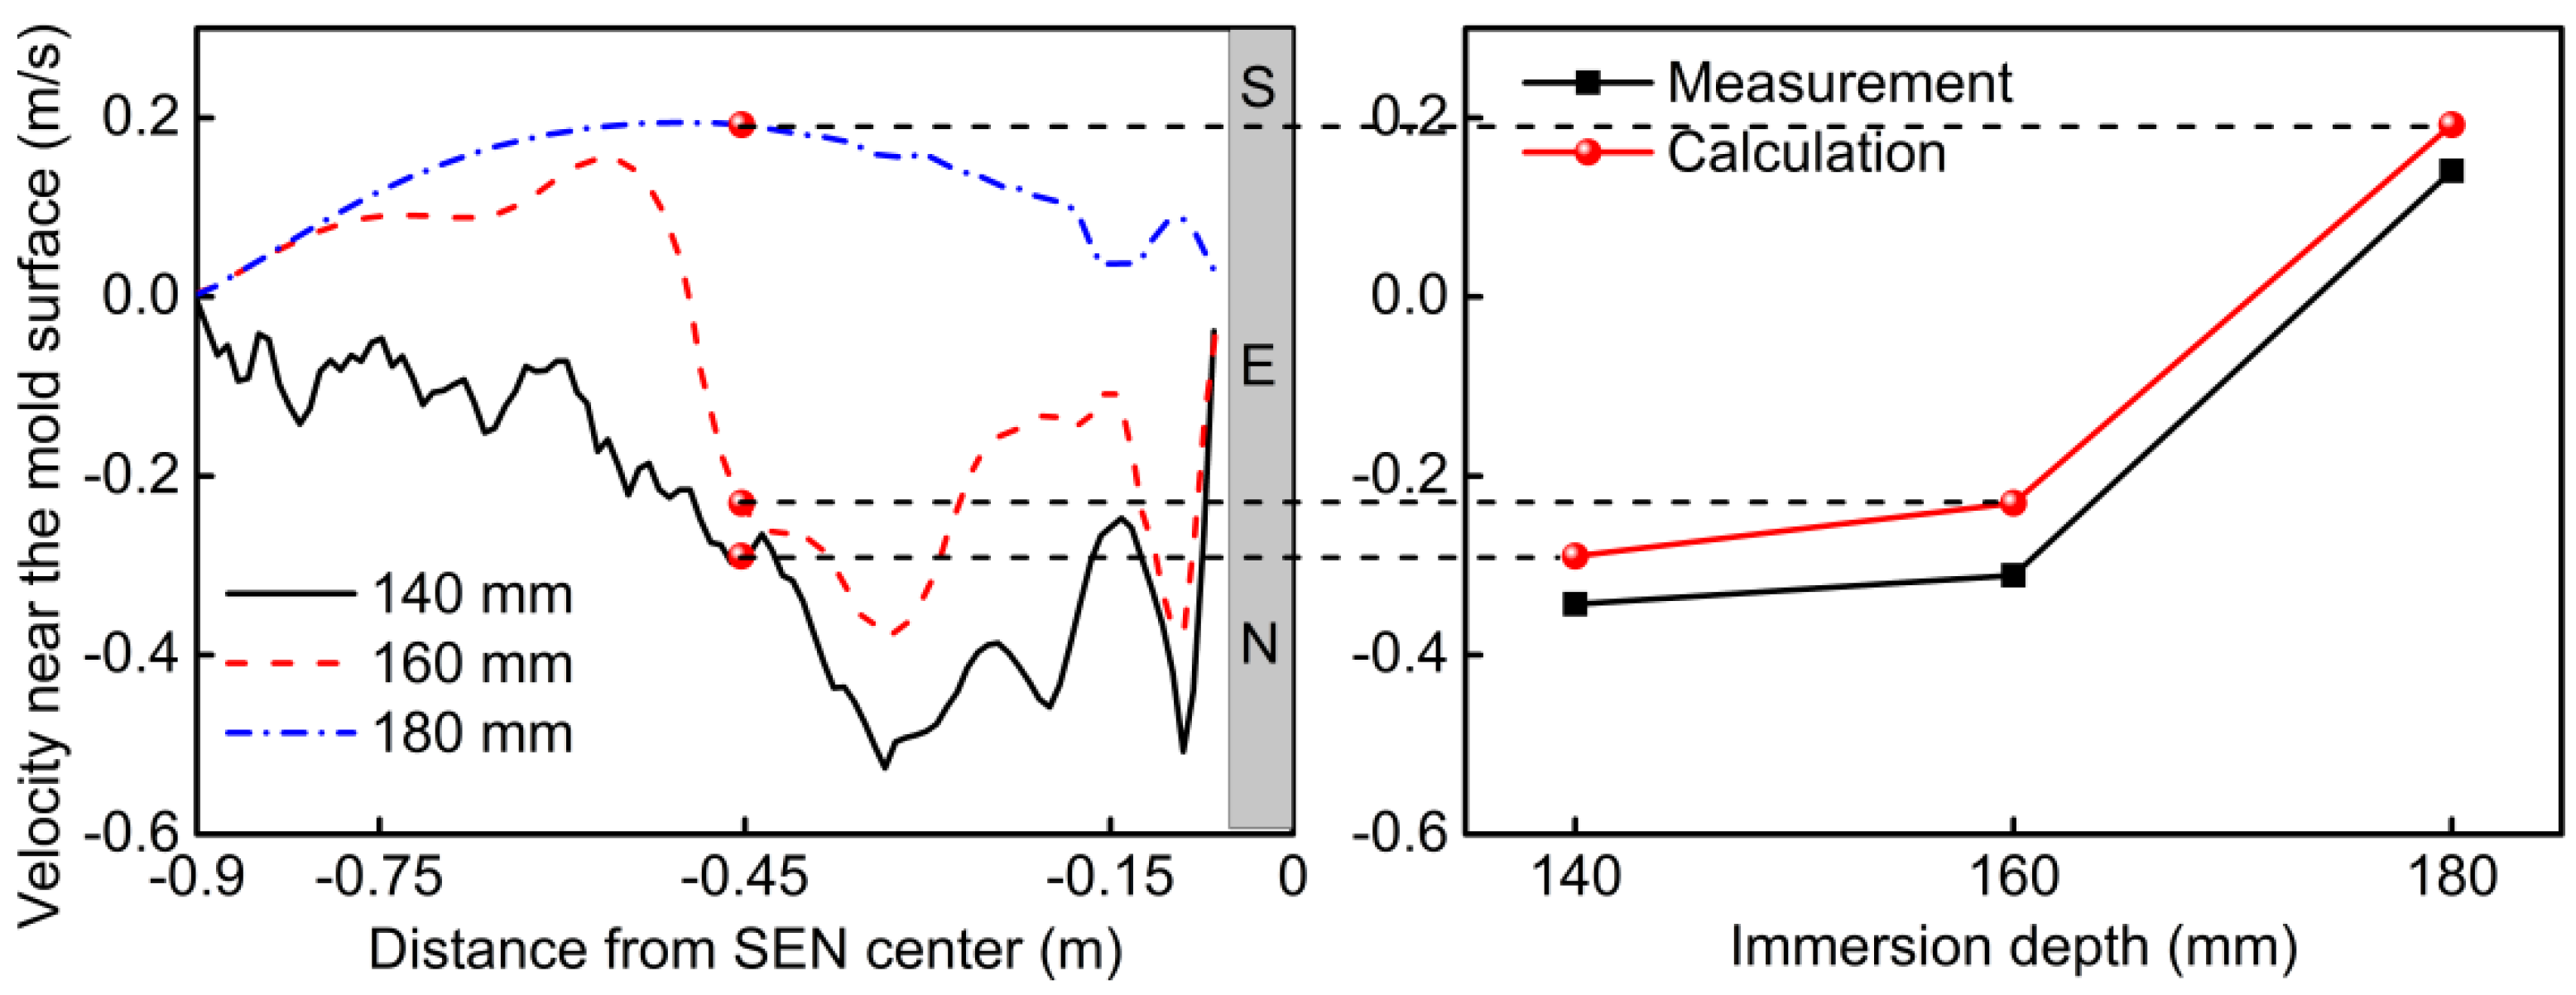
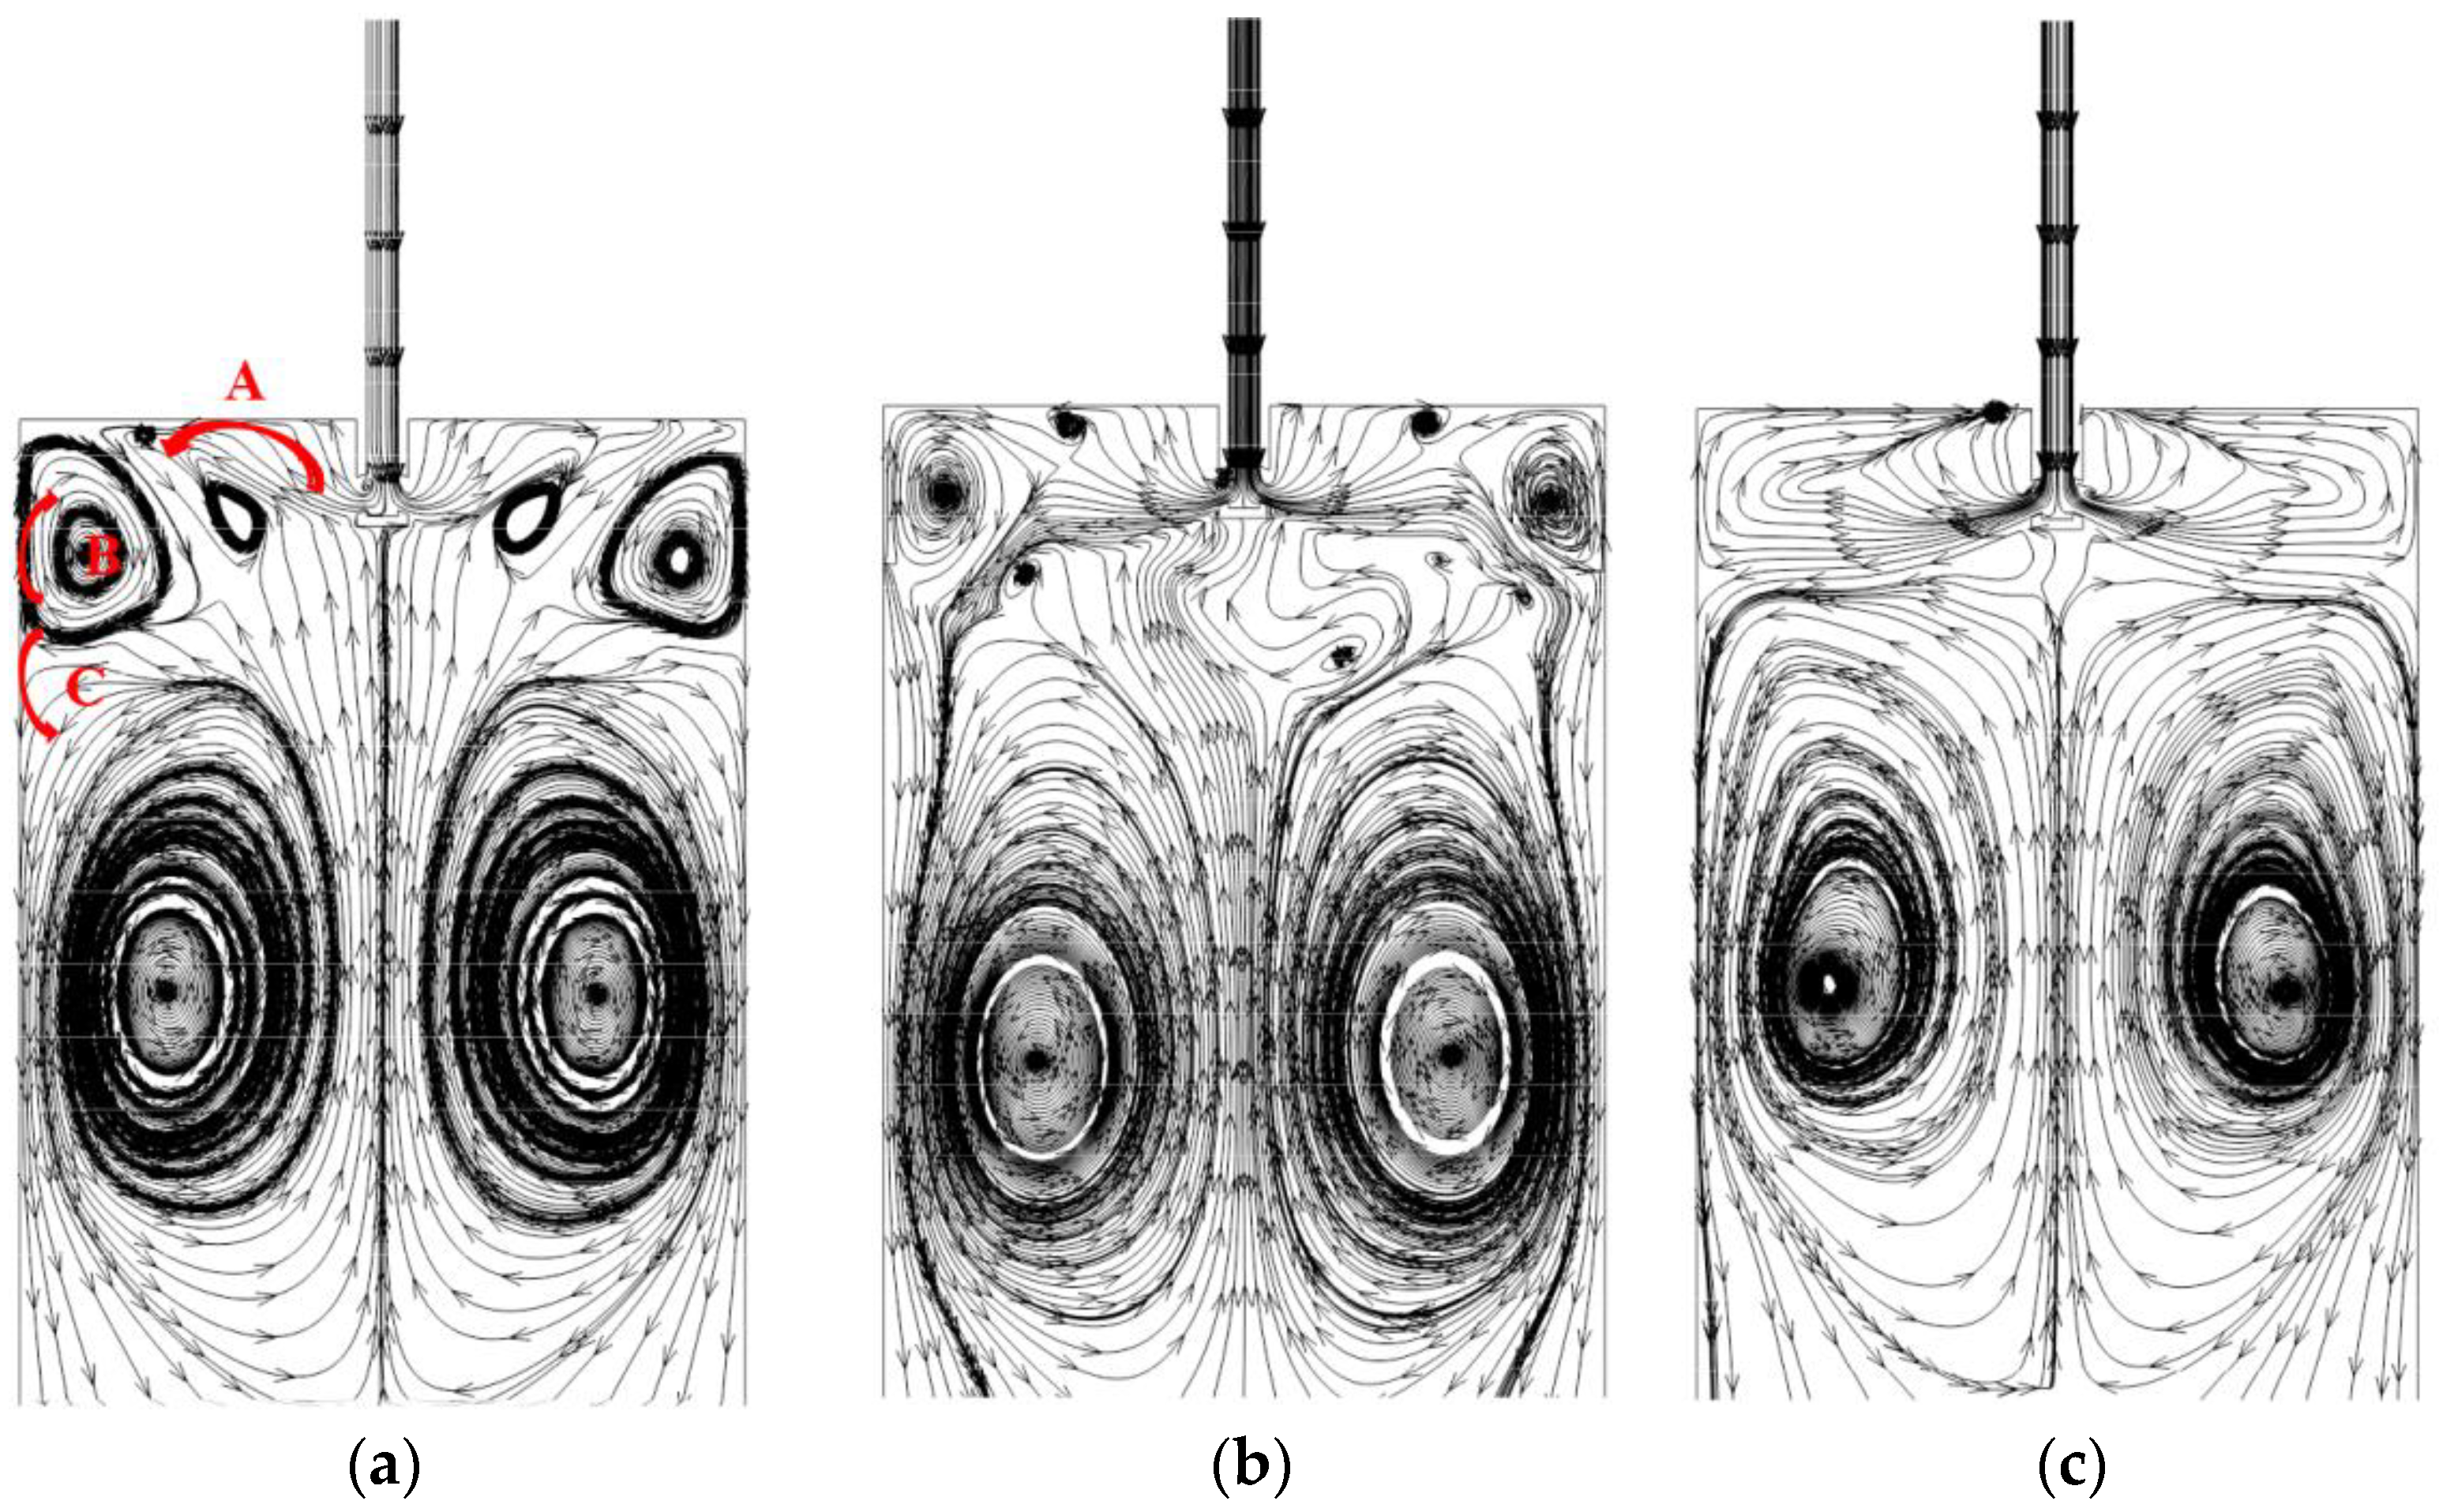
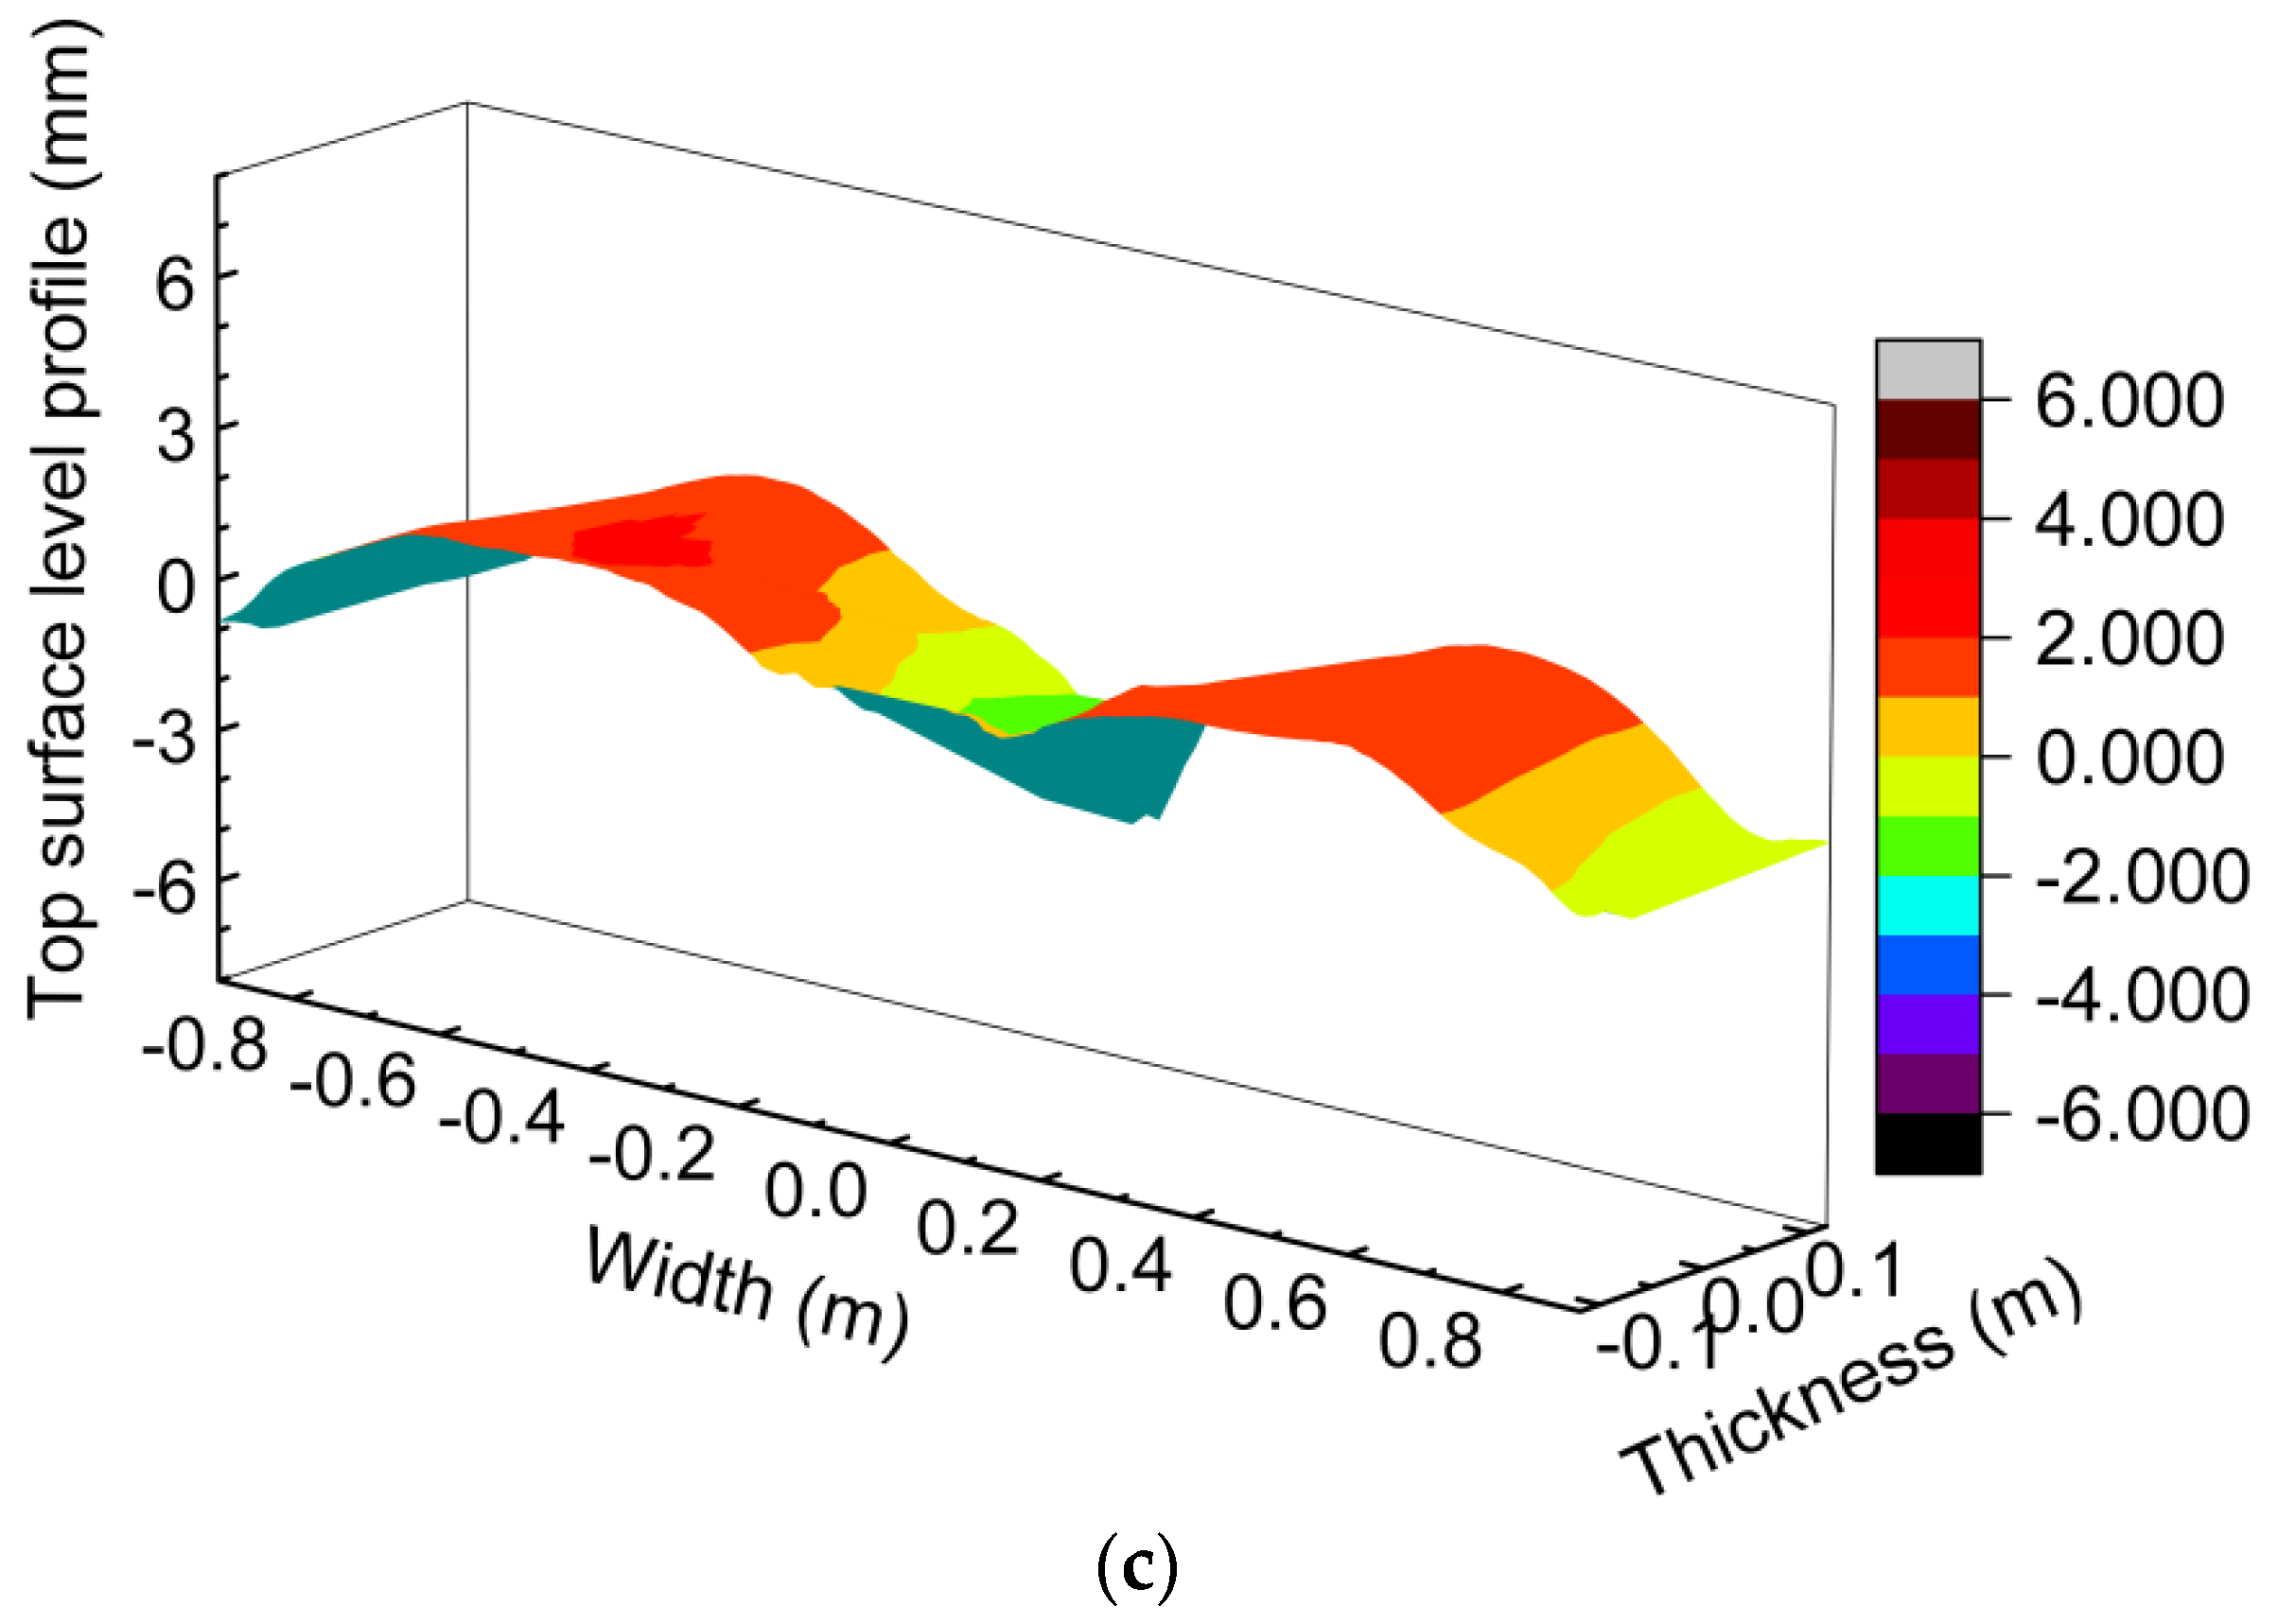
When the mold width is 1800 mm, the casting speed is 1.1 m/min, and the argon gas flow rate is 10 L/min, the velocity near the mold surface is obviously increased with the increasing immersion depth. The calculated results are also in accord with the measured ones. When the immersion depth of the nozzle is 140 and 160 mm, the velocity near the mold surface is from SEN to narrow wall, the flow pattern is SRF or IF, and the liquid level fluctuates greatly. When the immersion depth of the SEN is 180 mm, the velocity near the mold surface is from narrow wall to the SEN, the flow pattern is DRF, and the fluctuation of the liquid level is small, which is conducive to control the risk of slag entrainment.
(4)
When the bottom shape of the SEN changes from a mountain to a well, the velocity near the mold surface decreases from 0.4 to 0.25 m/s under the conditions of 2000 mm mold width, 1.0 m/min casting speed, 8 L/min argon gas flow rate and 150 mm SEN immersion depth. Because the velocity near the mold surface with the mountain shaped nozzle is too large and the liquid level fluctuates greatly, it is suggested to adopt the well-shaped nozzle to reduce the risk of slag entrainment.

Author Contributions

Conceptualization, C.M. and J.Y.; methodology, J.Y.; validation, W.-y.H., H.-s.Q. and C.-l.Z.; formal analysis, C.M.; investigation, C.M.; resources, H.-s.Q., C.-l.Z. and J.Y.; data curation, W.-y.H. and Y.-b.L.; writing—original draft preparation, C.M.; writing—review and editing, J.Y.; visualization, C.M.; supervision, J.Y.; project administration, J.Y. and C.-l.Z.; funding acquisition, J.Y. All authors have read and agreed to the published version of the manuscript.

Funding

This work was supported by the National Natural Science Foundation of China (U1960202). The authors also gratefully acknowledge the financial support from Shougang Jingtang United Iron and Steel Co., LTD.

Institutional Review Board Statement

The study did not involve humans or animals.

Informed Consent Statement

The study did not involve humans or animals.

Data Availability Statement

Data supporting reported results can be found in this paper.

Conflicts of Interest

The authors declare no conflict of interest.

References

  1. Bessho, N.; Yoda, R.; Yamasaki, H.; Fujii, T.; Nozaki, T.; Takatori, S. Numerical analysis of fluid flow in continuous casting mold by bubble dispersion model. ISIJ Int. 1991, 31, 40–45. [Google Scholar] [CrossRef] [Green Version]
  2. Chen, Y.; Zhang, J.M.; Han, L.H. Numerical simulation on fluid flow in mold for wide slab continuous casting. Res. Iron Steel. 2008, 36, 10–13. [Google Scholar] [CrossRef]
  3. Chen, Y.; Zhang, J.M. Water model experiment on argon gas distribution in wide slab casting mold. J. Iron Steel Res. 2008, 20, 17–20. [Google Scholar]
  4. Chen, Y.; Zhang, J.M.; Wang, S.Z. Water model experiments on surface flow fluctuation patterns in wide slab caster mold. Steelmaking 2008, 24, 43–46. [Google Scholar]
  5. He, K.N.; Xiao, J.G.; Wei, Y.H.; Sun, Y.H.; Liao, W.T. Experimental research on structure of submerged entry nozzle and operation parameter optimization for wide slab continuous casting mold. Iron Steel. 2008, 43, 26–29. [Google Scholar]
  6. Liu, G.L.; Wu, S.Z.; Zhang, J.M.; Wang, W.J.; Wang, X.H. Numerical simulation on the surface fluctuation of molten steel in a wide slab continuous casting mold. Chin. J. Eng. 2009, 31, 229–233. [Google Scholar]
  7. Lin, X.C.; Li, J.S.; Zhang, X.L.; Liang, X.W. Water model experiments on surface flow velocity of molten steel in slab caster mold. Chin. Metall. 2010, 20, 15–19. [Google Scholar]
  8. Wang, H.X.; Cao, M.L.; Liu, Z.G. Analysis and control on mold level fluctuation. Steelmaking 2012, 28, 37–41. [Google Scholar]
  9. Garcia-hernandez, S.; Morales, R.D.; Barreto, J.D.J.; Morales-Higa, K. Numerical optimization of nozzle ports to improve the fluidynamics by controlling backflow in a continuous casting slab mold. ISIJ Int. 2013, 53, 1794–1802. [Google Scholar] [CrossRef] [Green Version]
  10. Liu, Z.Q.; Li, B.K.; Jiang, M.F.; Tsukihashi, F. Modeling of transient two-phase flow in a continuous casting mold using euler-euler large eddy simulation scheme. ISIJ Int. 2013, 53, 484–492. [Google Scholar] [CrossRef] [Green Version]
  11. Ramos, I.C.; Morales, R.D.; Garcia-hernandez, S.; Ceballos-Huerta, A. Effects of immersion depth on flow turbulence of liquid steel in a slab mold using a nozzle with upward angle rectangular ports. ISIJ Int. 2014, 54, 1797–1806. [Google Scholar] [CrossRef] [Green Version]
  12. Xiong, X.; Deng, X.X.; Wang, X.H.; Huang, Q.; Zhang, H.B. Effect of port-shape design on fluid flow in high-speed slab continuous casting mold. J. Iron Steel Res. 2014, 26, 35–40. [Google Scholar]
  13. Ren, L.; Zhang, L.F.; Wang, Q.Q.; Zhao, X. Study on fluid flow in a continuous casting slab mold using particle image velocimetry. Chin. J. Eng. 2016, 38, 1393–1403. [Google Scholar]
  14. Kato, T.; Hara, M.; Muto, A.; Hiraki, S.; Kawamoto, M. Fluid flow behavior in submerged entry nozzle of continuous casting. ISIJ Int. 2007, 47, 840–846. [Google Scholar] [CrossRef] [Green Version]
  15. Tsukaguchi, Y.; Hayashi, H.; Kurimoto, H.; Yokoya, S.; Marukawa, K.; Tanaka, T. Development of swirling-flow submerged entry nozzles for slab casting. ISIJ Int. 2010, 50, 721–729. [Google Scholar] [CrossRef] [Green Version]
  16. Deng, X.X.; Ji, C.X.; Cui, Y.; Zhu, G.S.; Li, L.P.; Suo, J.L. Flow pattern in continuous casting slab mold with argon blowing. Iron Steel. 2016, 51, 23–30. [Google Scholar]
  17. Deng, X.X.; Wang, X.H.; Li, L.P.; Yang, D.; Ji, C.X. Effect of nozzle bottom design on jet characteristics in continuous casting slab mold for high speed casting. Steelmaking 2014, 30, 44–48. [Google Scholar]
  18. Deng, X.X.; Ji, C.X.; Li, L.P.; Yin, X.; Yang, Y.; McLean, A. Flow pattern control in continuous slab casting moulds: Physical modelling and plant trials. Ironmak. Steelmak. 2017, 44, 461–471. [Google Scholar] [CrossRef]
  19. Chen, G.; Zhou, H.L.; Yu, L.; Zhong, L.C.; Zhang, K.J. Influence of submerged immersion nozzle structure on liquid surface fluctuation in slab continuous casting mold. Steelmaking 2018, 34, 50–56. [Google Scholar]
  20. Cho, S.M.; Thomas, B.G.; Kim, S.H. Effect of nozzle port angle on transient flow and surface slag behavior during continuous steel-slab casting. Metall. Mater. Trans. B 2018, 50, 52–76. [Google Scholar] [CrossRef]
  21. Iguchi, M.; Kawabata, H.; Demoto, Y.; Morita, Z.-I. Cold model experiment for developing a new velocimeter applicable to molten metal. Tetsu-to-Hagane 1993, 79, 1046–1052. [Google Scholar] [CrossRef] [Green Version]
  22. Iguchi, M.; Terauchi, Y. Karaman vortex probe for the detection of molten metal surface flow in low velocity range. ISIJ Int. 2002, 42, 939–943. [Google Scholar] [CrossRef]
  23. McDavid, R.M.; Thomas, B.G. Flow and thermal behavior of the top surface flux/powder layers in continuous casting mold. Metall. Mater. Trans. B 1996, 27, 672–685. [Google Scholar] [CrossRef]
  24. Zhang, T.; Yang, J.; Jiang, P. Measurement of molten steel velocity near the surface and modeling for transient fluid flow in the continuous casting mold. Metals 2019, 9, 36. [Google Scholar] [CrossRef] [Green Version]
  25. Zhang, T.; Yang, J.; Xu, G.J.; Liu, H.J.; Zhou, J.J.; Qin, W. Effect of operation parameters on flow field in slab continuous casting mold with narrow width. Int. J. Miner. Metall. Mater. 2020. [Google Scholar] [CrossRef]
  26. Jiang, P.; Yang, J.; Zhang, T.; Xu, G.J.; Liu, H.J.; Zhou, J.J.; Qin, W. Optimization of flow field in slab continuous casting mold with medium width using high temperature measurement and numerical simulation for automobile exposed panel production. Metals 2019, 10, 9. [Google Scholar] [CrossRef] [Green Version]
  27. Jiang, P.; He, W.Y.; Qiao, H.S.; Zhao, C.L.; Zhang, T.; Yang, J. Optimization of mold flow field and SEN port shape in continuous casting of automobile exposed panel. Steelmaking 2020, 36, 34–44. [Google Scholar]
  28. Liu, Z.Q.; Li, L.M.; Qi, F.S.; Li, B.K.; Jiang, M.F.; Tsukihashi, F. Population balance modeling of polydispersed bubbly flow in continuous-casting using multiple-size-group approach. Metall. Mater. Trans. B 2014, 46, 406–420. [Google Scholar] [CrossRef]
  29. Kunstreich, S.; Dauby, P.H. Effect of liquid steel flow pattern on slab quality and the need for dynamic electromagnetic control in the mould. Ironmak. Steelmak. 2013, 32, 80–86. [Google Scholar] [CrossRef]
  30. Yoshida, J.; Iguchi, M.; Yokoya, S.-I. Water model experiment on mold powder entrapment around the exit of immersion nozzle in continuous casting mold. Tetsu-to-Hagane 2001, 87, 529–535. [Google Scholar] [CrossRef] [Green Version]
  31. Lu, Q.T.; Yang, R.G.; Wang, X.H.; Zhang, J.M.; Wang, W.J. Water modeling study on factors affecting mold powder entrapment in slab continuous casting. Iron Steel. 2006, 41, 29–32. [Google Scholar]
  32. Zhang, L.F.; Wang, Y.F.; Zuo, X.J. Flow transport and inclusion motion in steel continuous-casting mold under submerged entry nozzle clogging condition. Metall. Mater. Trans. B 2008, 39, 534–550. [Google Scholar] [CrossRef]
  33. Kubota, J.; Okimoto, K.; Shirayama, A. Meniscus flow control in the mold by traveling magnetic field for high speed slab caster. In Steelmaking Conference Proceedings; Iron and Steel Society: Warrendale, PA, USA, 1991; pp. 233–241. [Google Scholar]
  34. Liu, R.; Thomas, B.G.; Sengupta, J.; Chung, S.D.; Trinh, M. Measurements of molten steel surface velocity and effect of stopper-rod movement on transient multiphase fluid flow in continuous casting. ISIJ Int. 2014, 54, 2314–2323. [Google Scholar] [CrossRef] [Green Version]
  35. Zhang, L.F.; Yang, S.B.; Cai, K.K.; Li, J.Y.; Wan, X.G.; Thomas, B.G. Investigation of fluid flow and steel cleanliness in the continuous casting strand. Metall. Mater. Trans. B 2007, 38, 63–83. [Google Scholar] [CrossRef]
  36. Chaudhary, R.; Lee, G.G.; Thomas, B.G.; Kim, S.-H. Transient mold fluid flow with well- and mountain-bottom nozzles in continuous casting of steel. Metall. Mater. Trans. B 2008, 39, 870–884. [Google Scholar] [CrossRef] [Green Version]
Figure 1. Schematic diagram of measuring velocity near the mold surface by rod deflection method.
Metals 11 00261 g001
Figure 2. Geometry and computational meshes of the mold.
Metals 11 00261 g002
Figure 3. Comparison of the measured and calculated velocities near mold surface at the different argon gas flow rates.
Metals 11 00261 g003
Figure 4. Streamlines on the center plane of mold at the different argon gas flow rates of (a) 6 L/min, (b) 10 L/min, (c) 14 L/min, with enlarged views below corresponding to the upper part of the figure.
Metals 11 00261 g004
Figure 5. Top surface level profiles of mold at the different argon gas flow rates of (a) 6 L/min, (b) 10 L/min, (c) 14 L/min.
Metals 11 00261 g005aMetals 11 00261 g005b
Figure 6. Comparison of the measured and calculated velocities near the mold surface at the different casting speeds.
Metals 11 00261 g006
Figure 7. Streamlines on the mold center plane at different casting speeds of (a) 1.1 m/min, (b) 1.2 m/min.
Metals 11 00261 g007
Figure 8. Top surface level profile of mold under different casting speeds of (a) 1.1 m/min, (b) 1.2 m/min.
Metals 11 00261 g008
Figure 9. Comparison of measured and calculated surface velocities of mold at different immersion depths.
Metals 11 00261 g009
Figure 10. Streamlines on center plane of mold at different immersion depths of (a) 140 mm, (b) 160 mm, (c) 180 mm.
Metals 11 00261 g010
Figure 11. Top surface level profiles of mold at the different immersion depths of (a) 140 mm, (b) 160 mm, (c) 180 mm.
Metals 11 00261 g011aMetals 11 00261 g011b
Figure 12. Comparison of the measured and calculated velocities near the mold surface with different bottom shapes of SEN.
Metals 11 00261 g012
Figure 13. Streamlines on center plane of mold with the different SEN bottom shapes of (a) mountain, (b) well.
Metals 11 00261 g013
Figure 14. Top surface level profiles of mold with different SEN bottom shapes of (a) mountain, (b) well.
Metals 11 00261 g014
Table 1. Parameters of experiment and numerical simulation.
ParametersValuesParametersValues
Slab width (mm)1800, 2000Computational domain length (mm)2500
Slab thickness (mm)237Argon gas flow rate (L/min)6, 8, 10, 14
Casting speed (m/min)1.0, 1.1, 1.2Immersion depth of SEN (mm)140, 150, 160, 180
SEN port angle (°)−20SEN bottom shapemountain, well
Fluid density (kg/m3)7020SEN port size (mm × mm)70 × 90
Argon gas density (kg/m3)0.56Fluid dynamic viscosity (kg/m∙s)0.0055
Publisher’s Note: MDPI stays neutral with regard to jurisdictional claims in published maps and institutional affiliations.

