
Characterization of Precipitation in 7055 Aluminum Alloy by Laser Ultrasonics

 ,
,  and
and 
Abstract
1. Introduction
2. Experimental Materials and Methods
2.1. Experimental
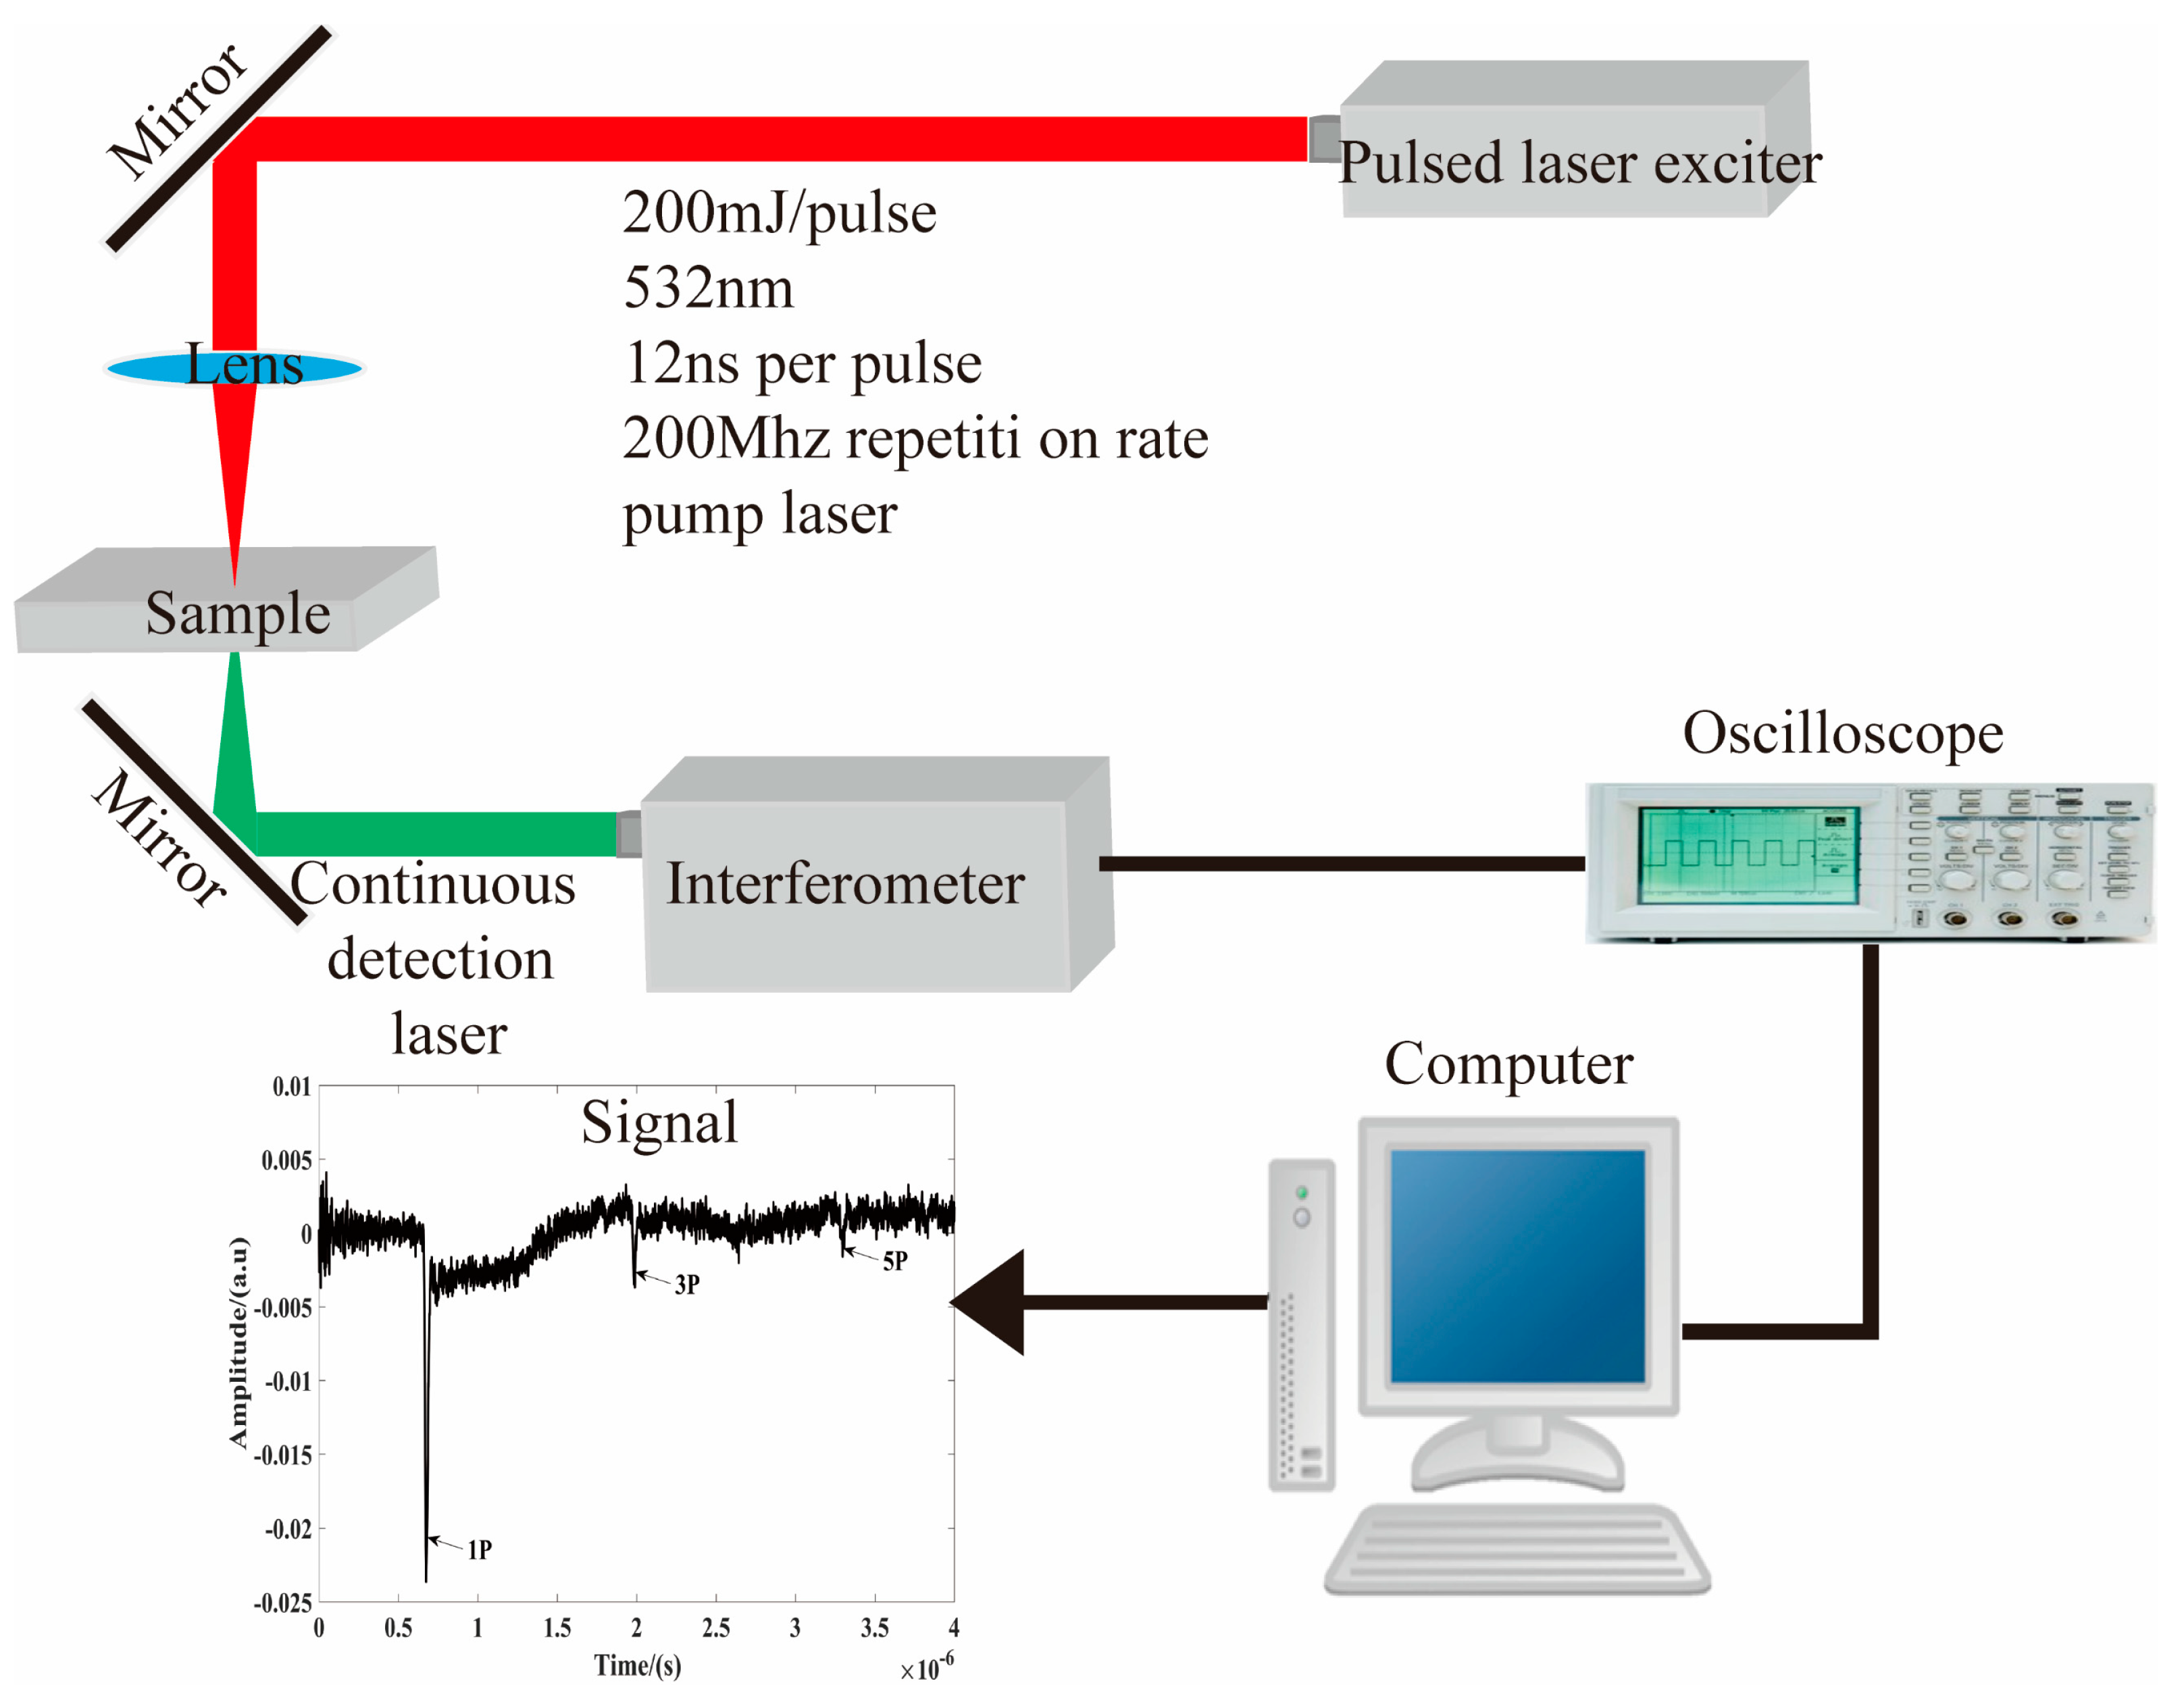
2.2. Laser Ultrasonic Testing System
3. Results
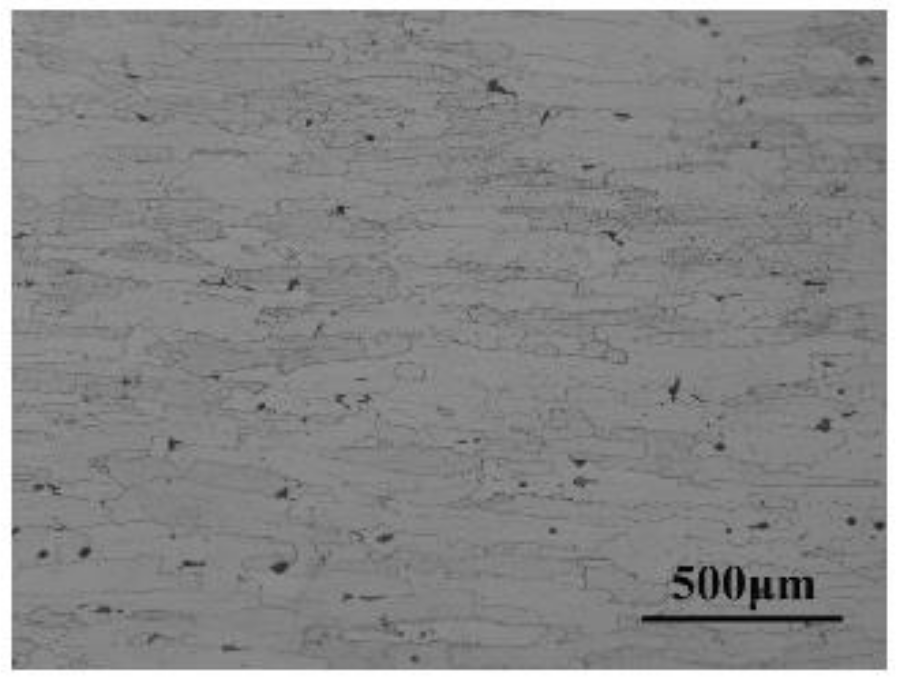
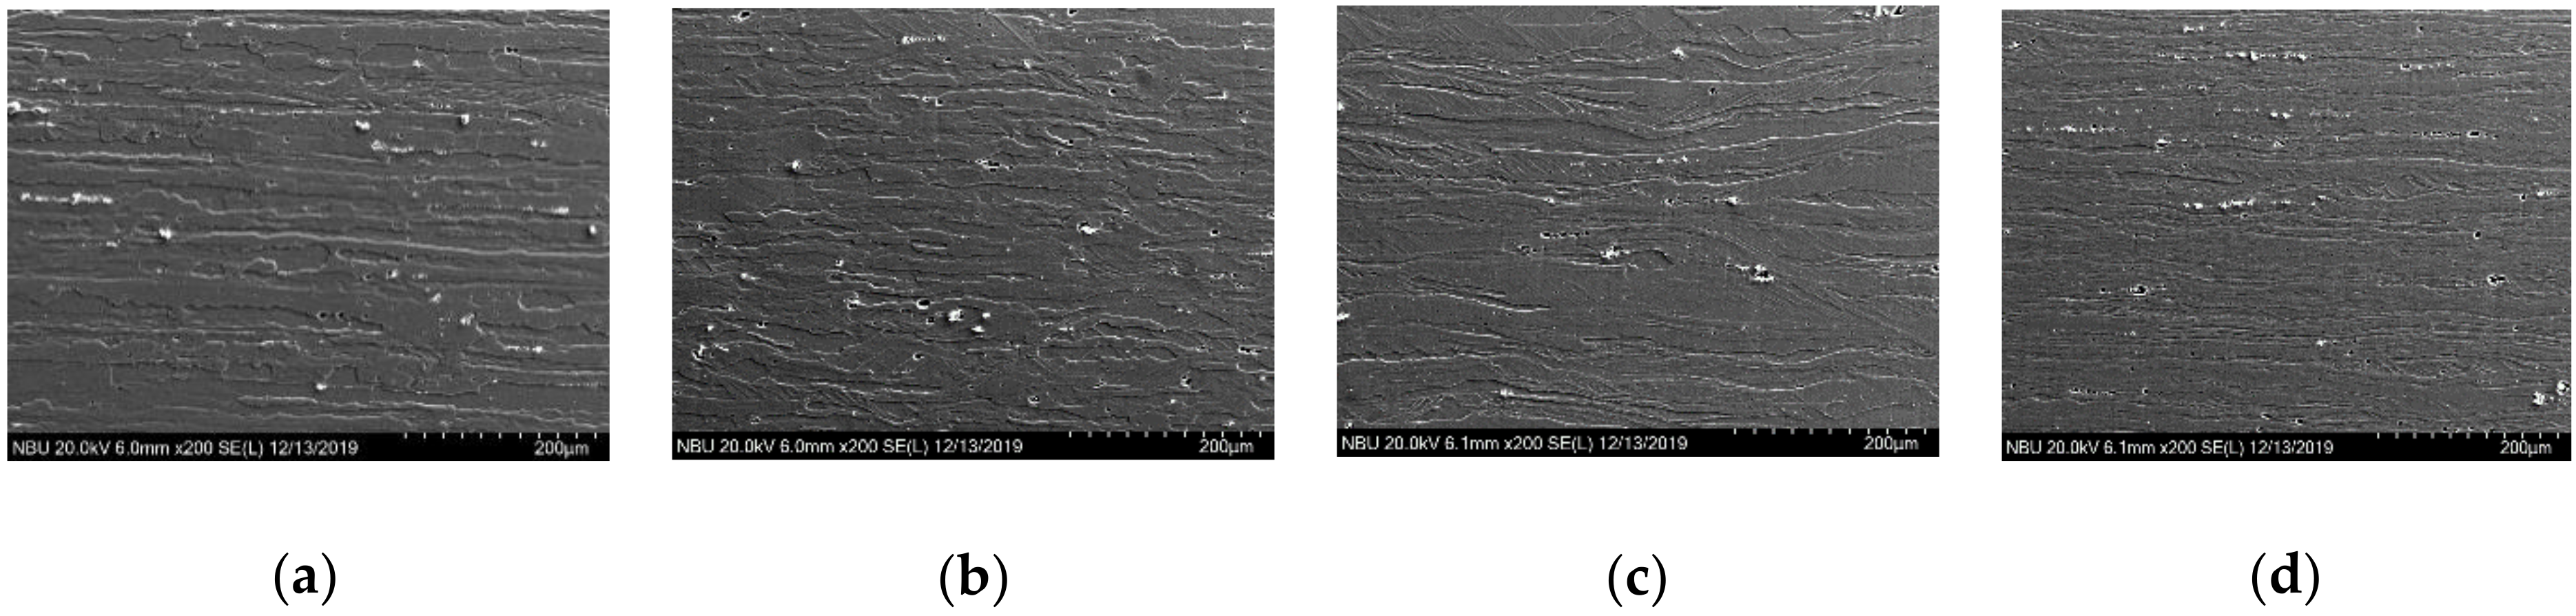
3.1. Grain Size
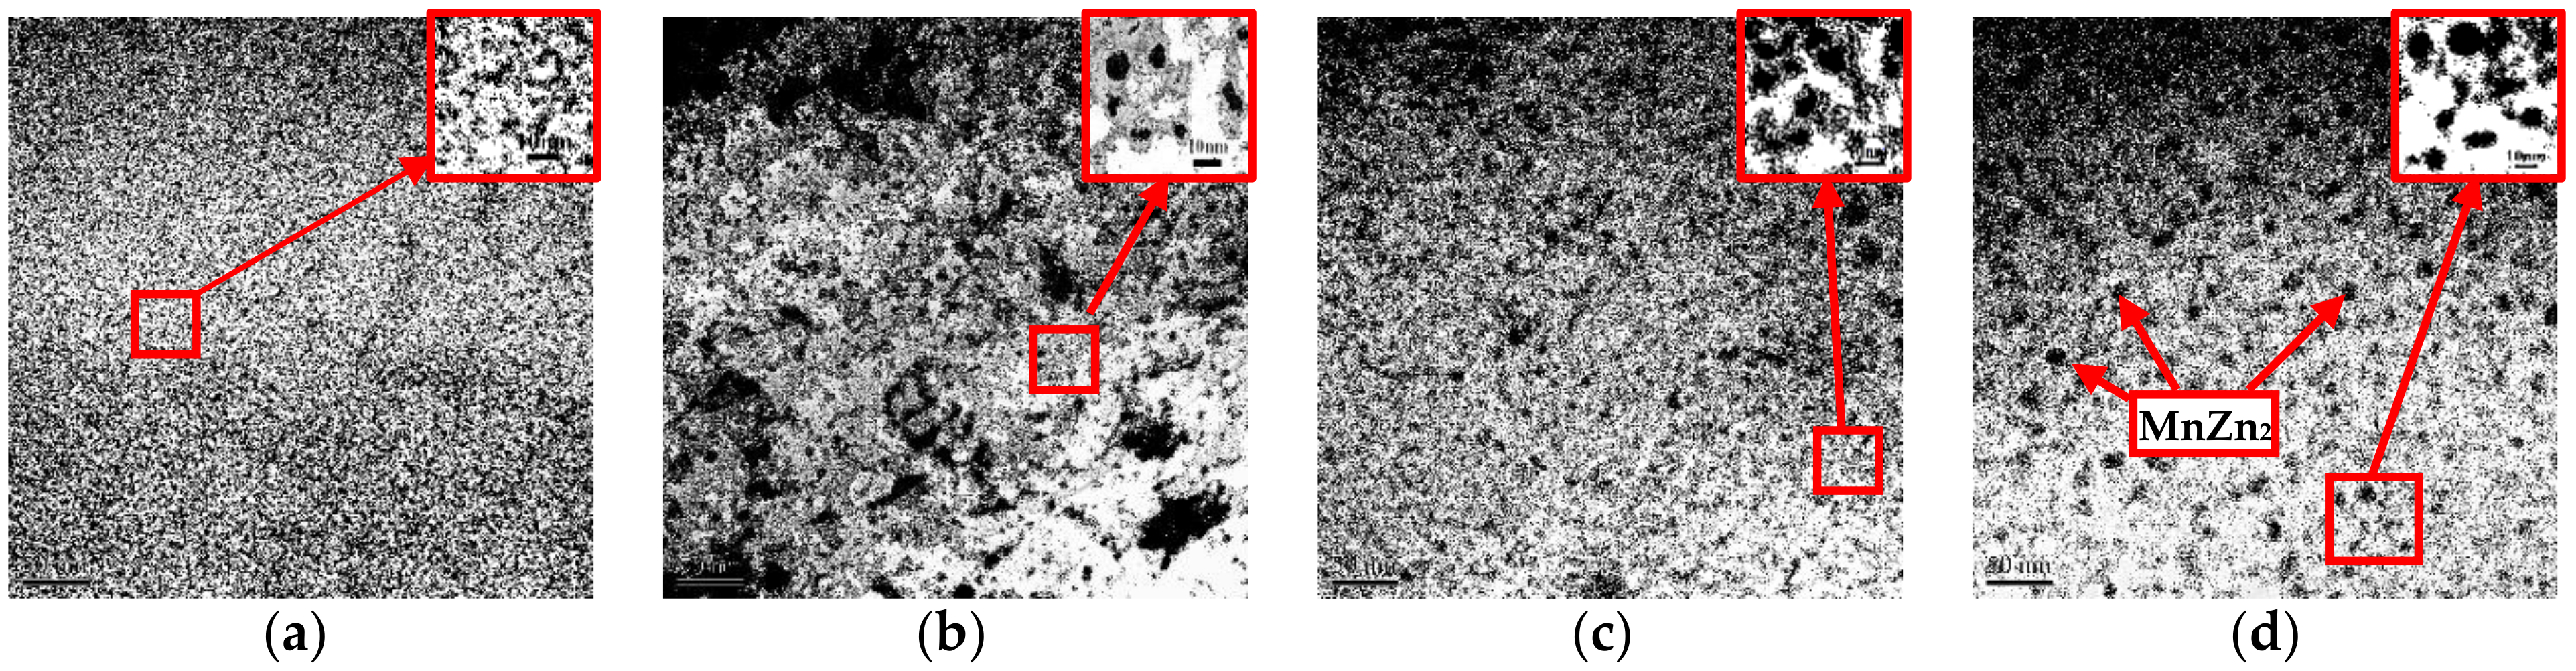
3.2. Precipitation Phase Size
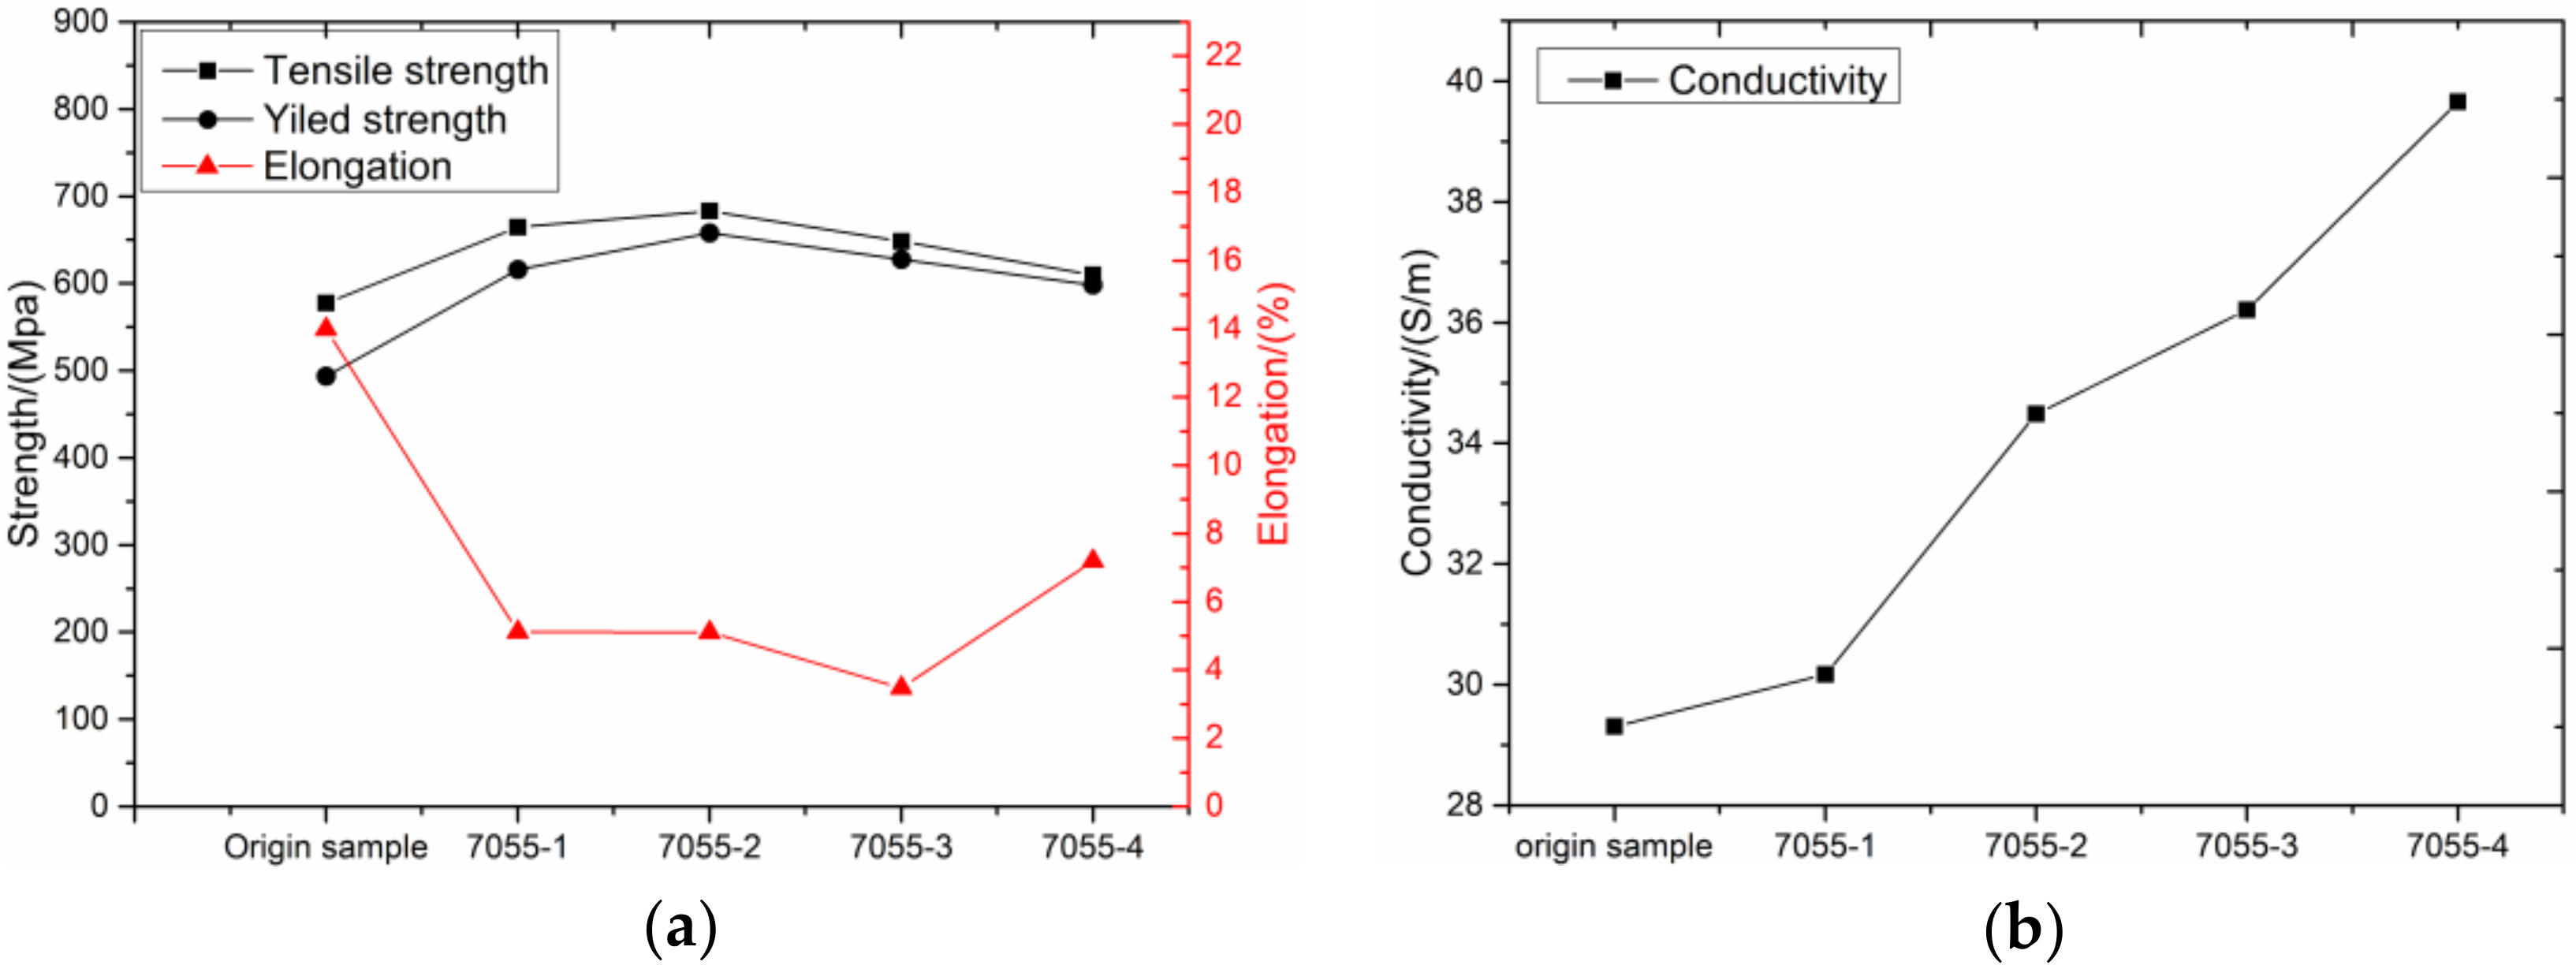
3.3. Mechanical Properties of Rolled Specimens with Different Reductions
4. Analysis and Discussion
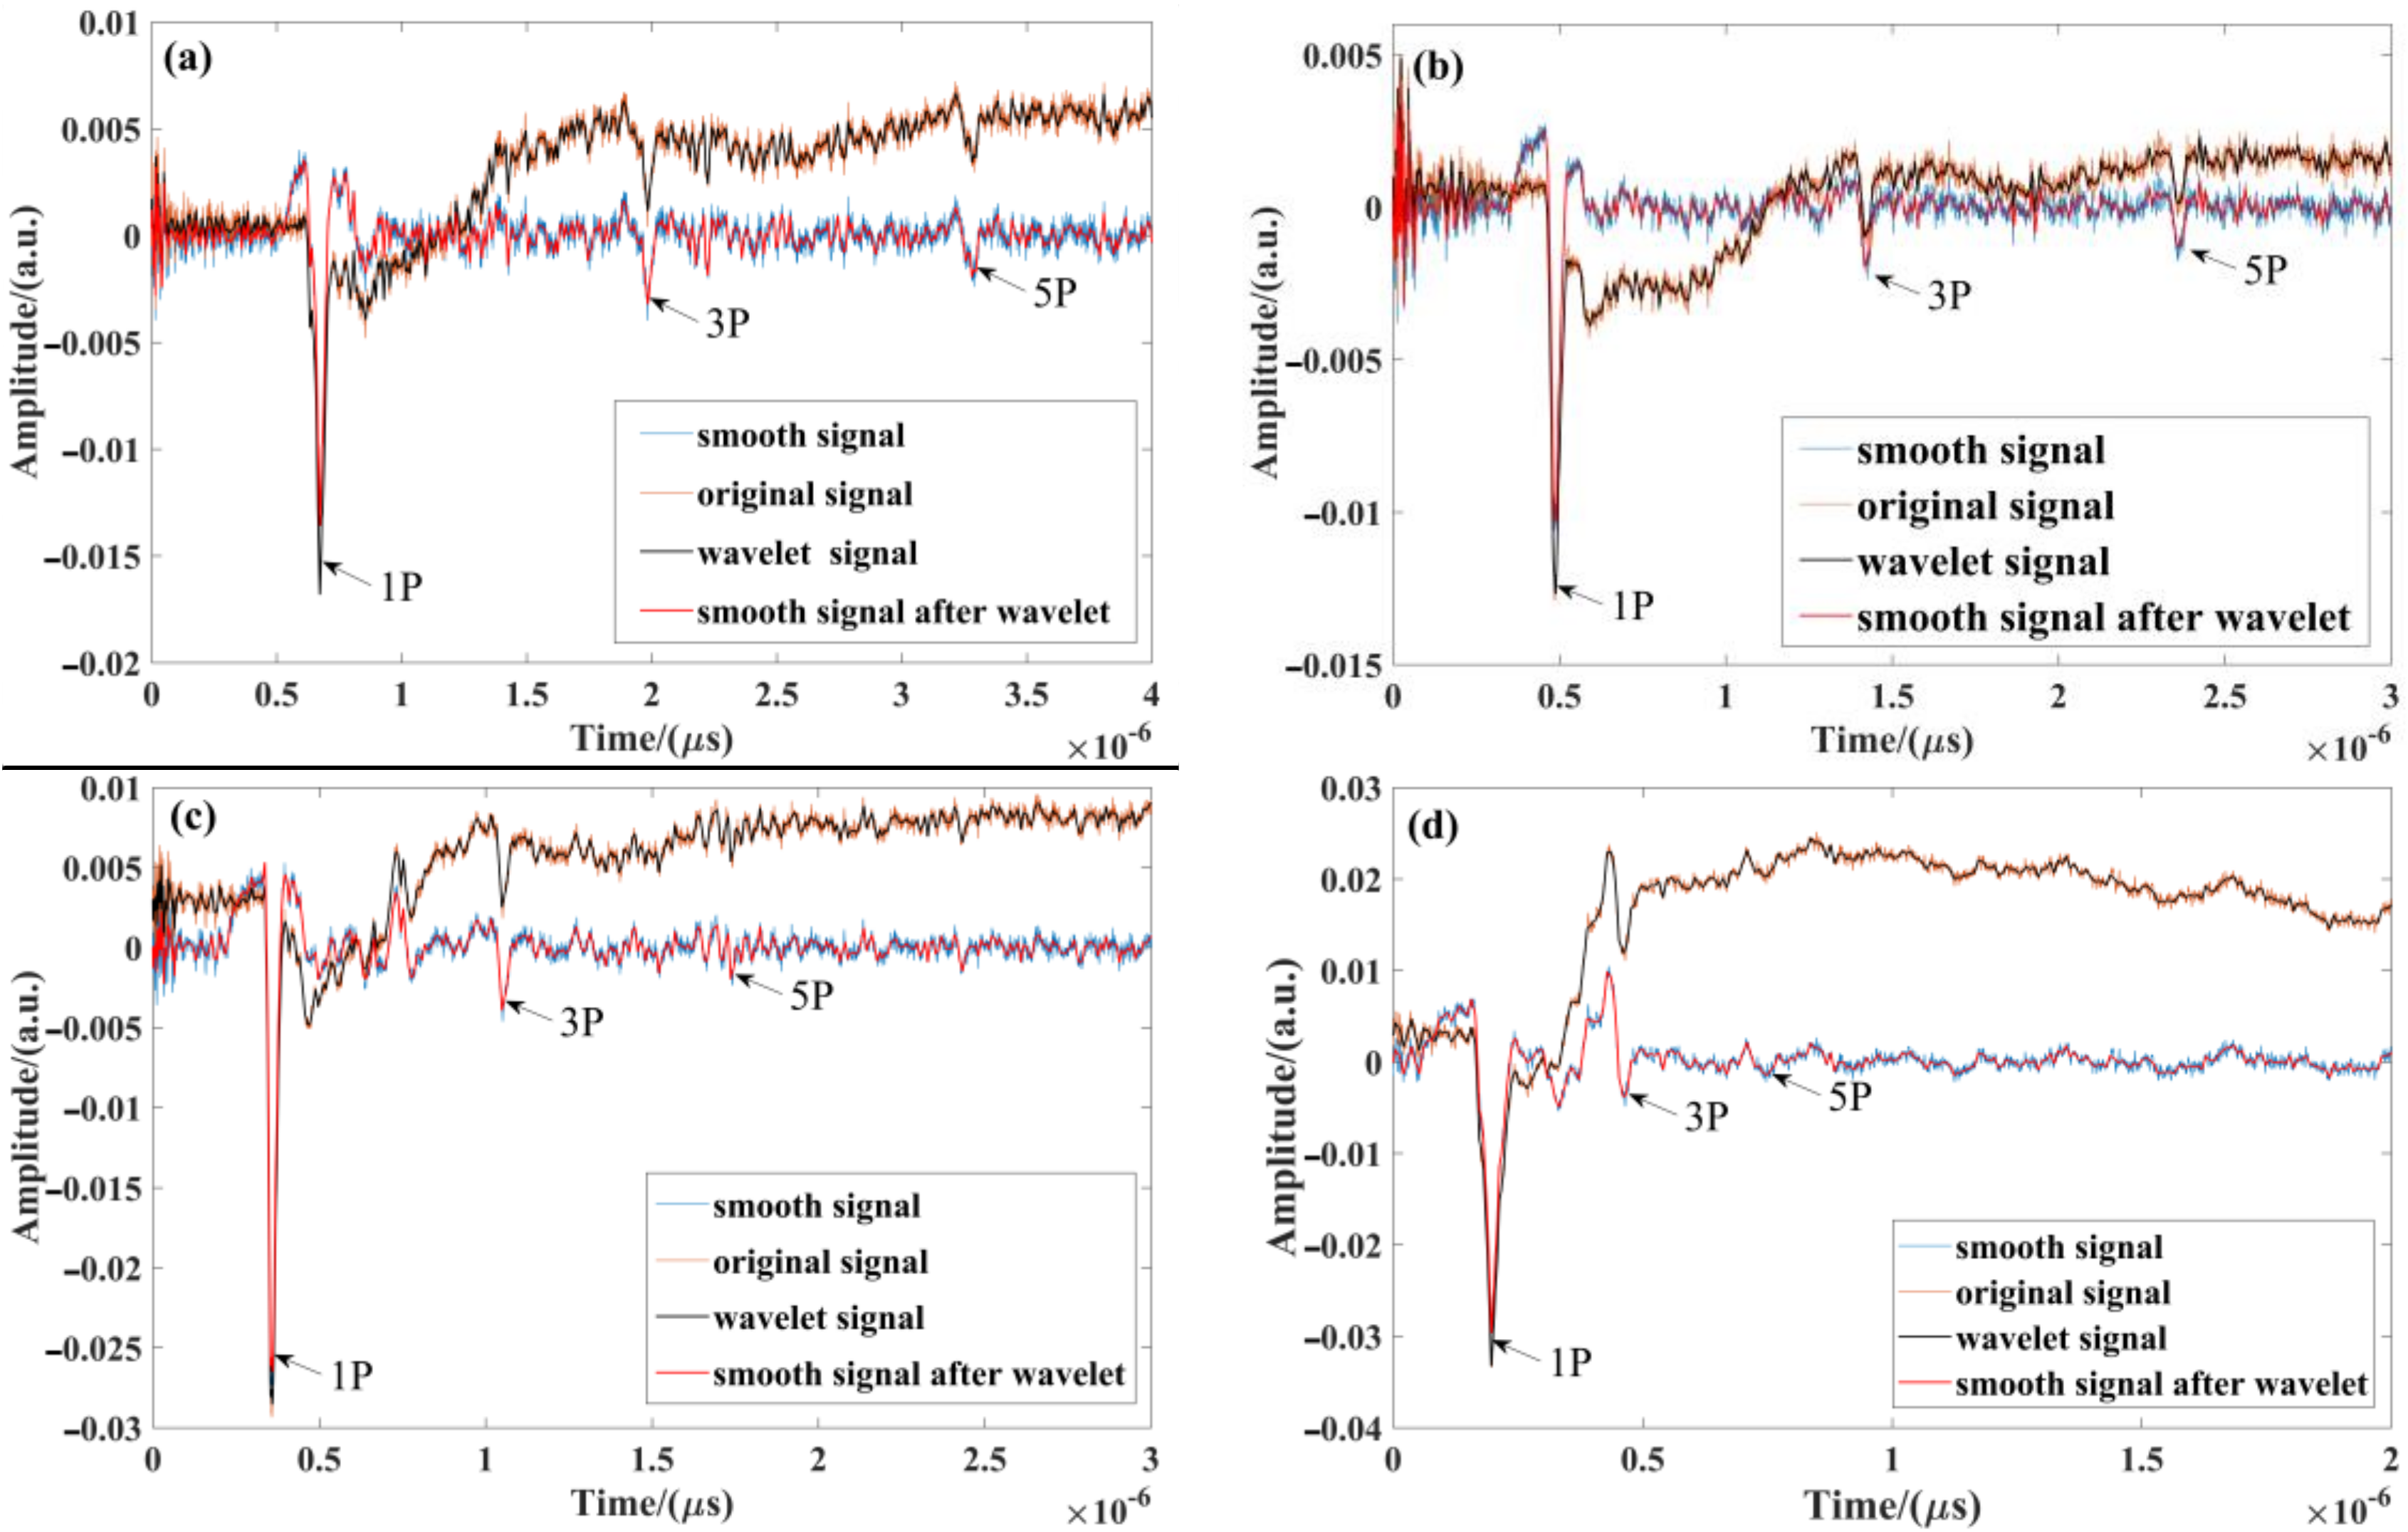
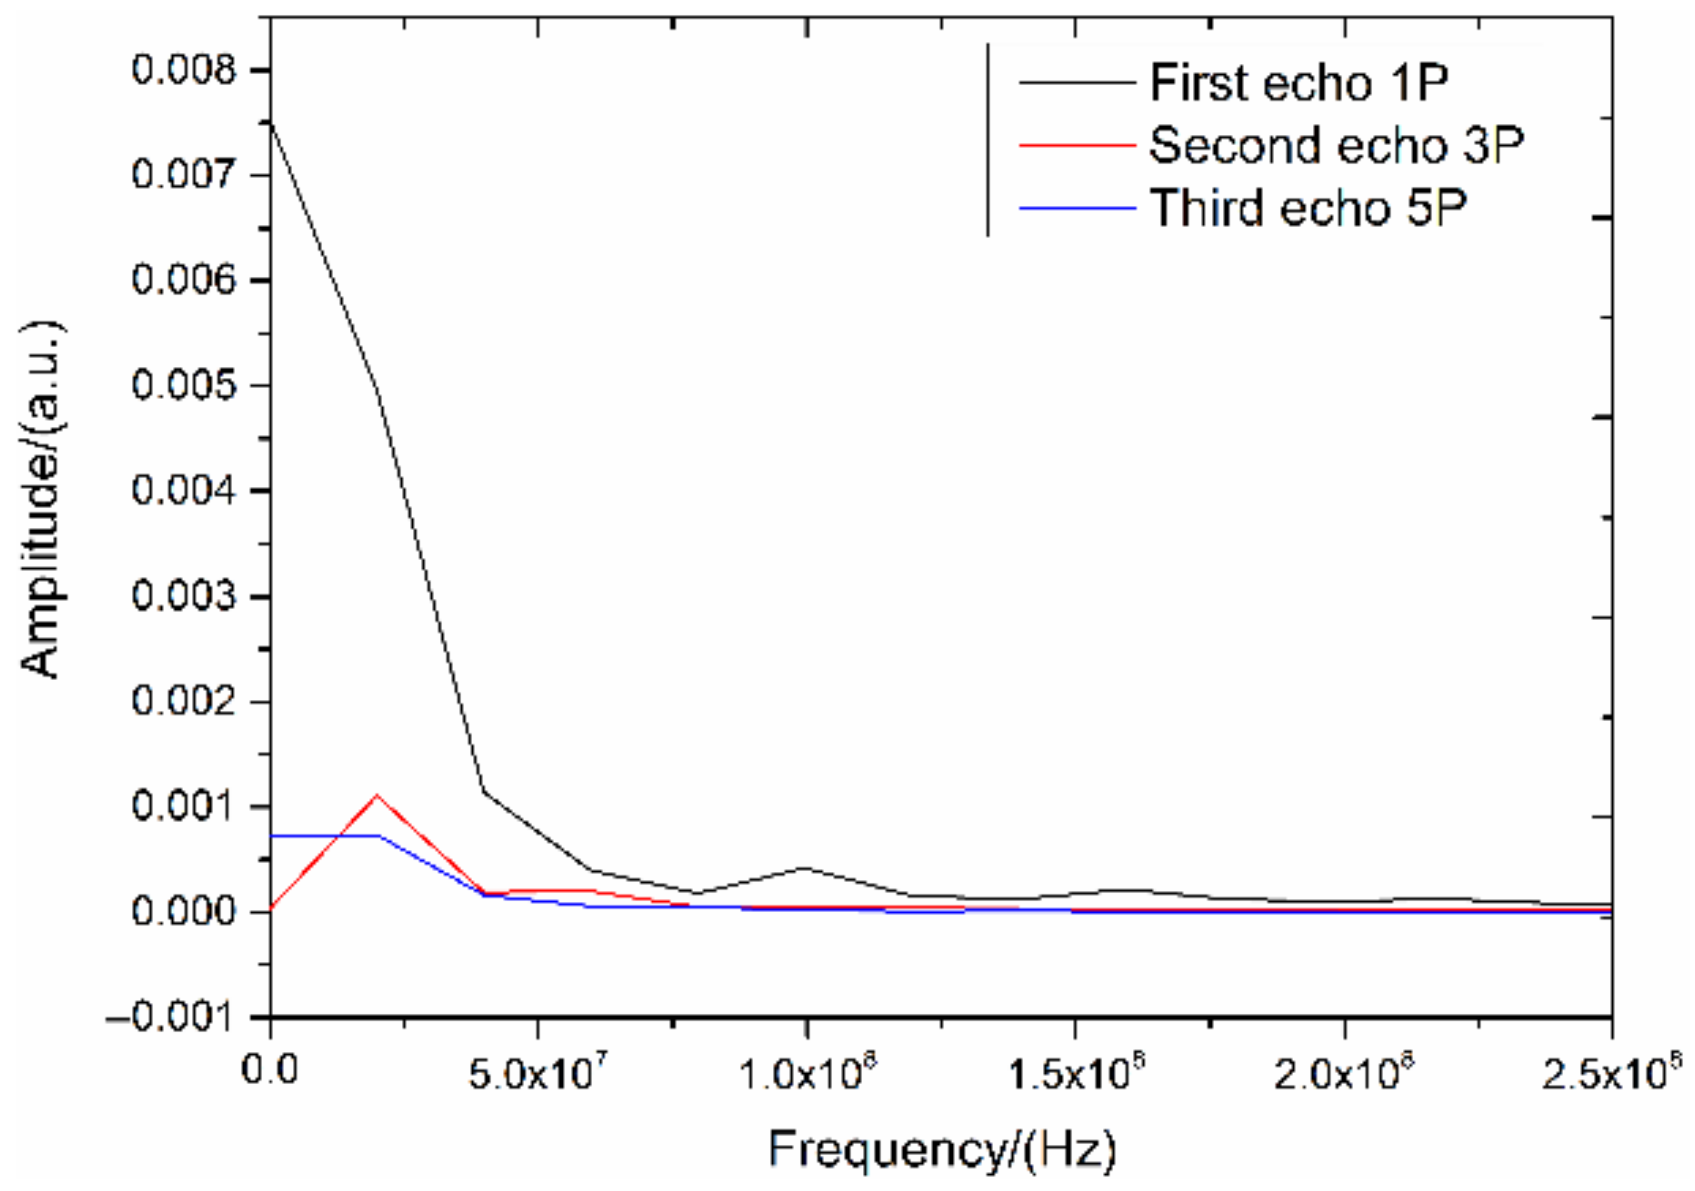
4.1. Signal Processing
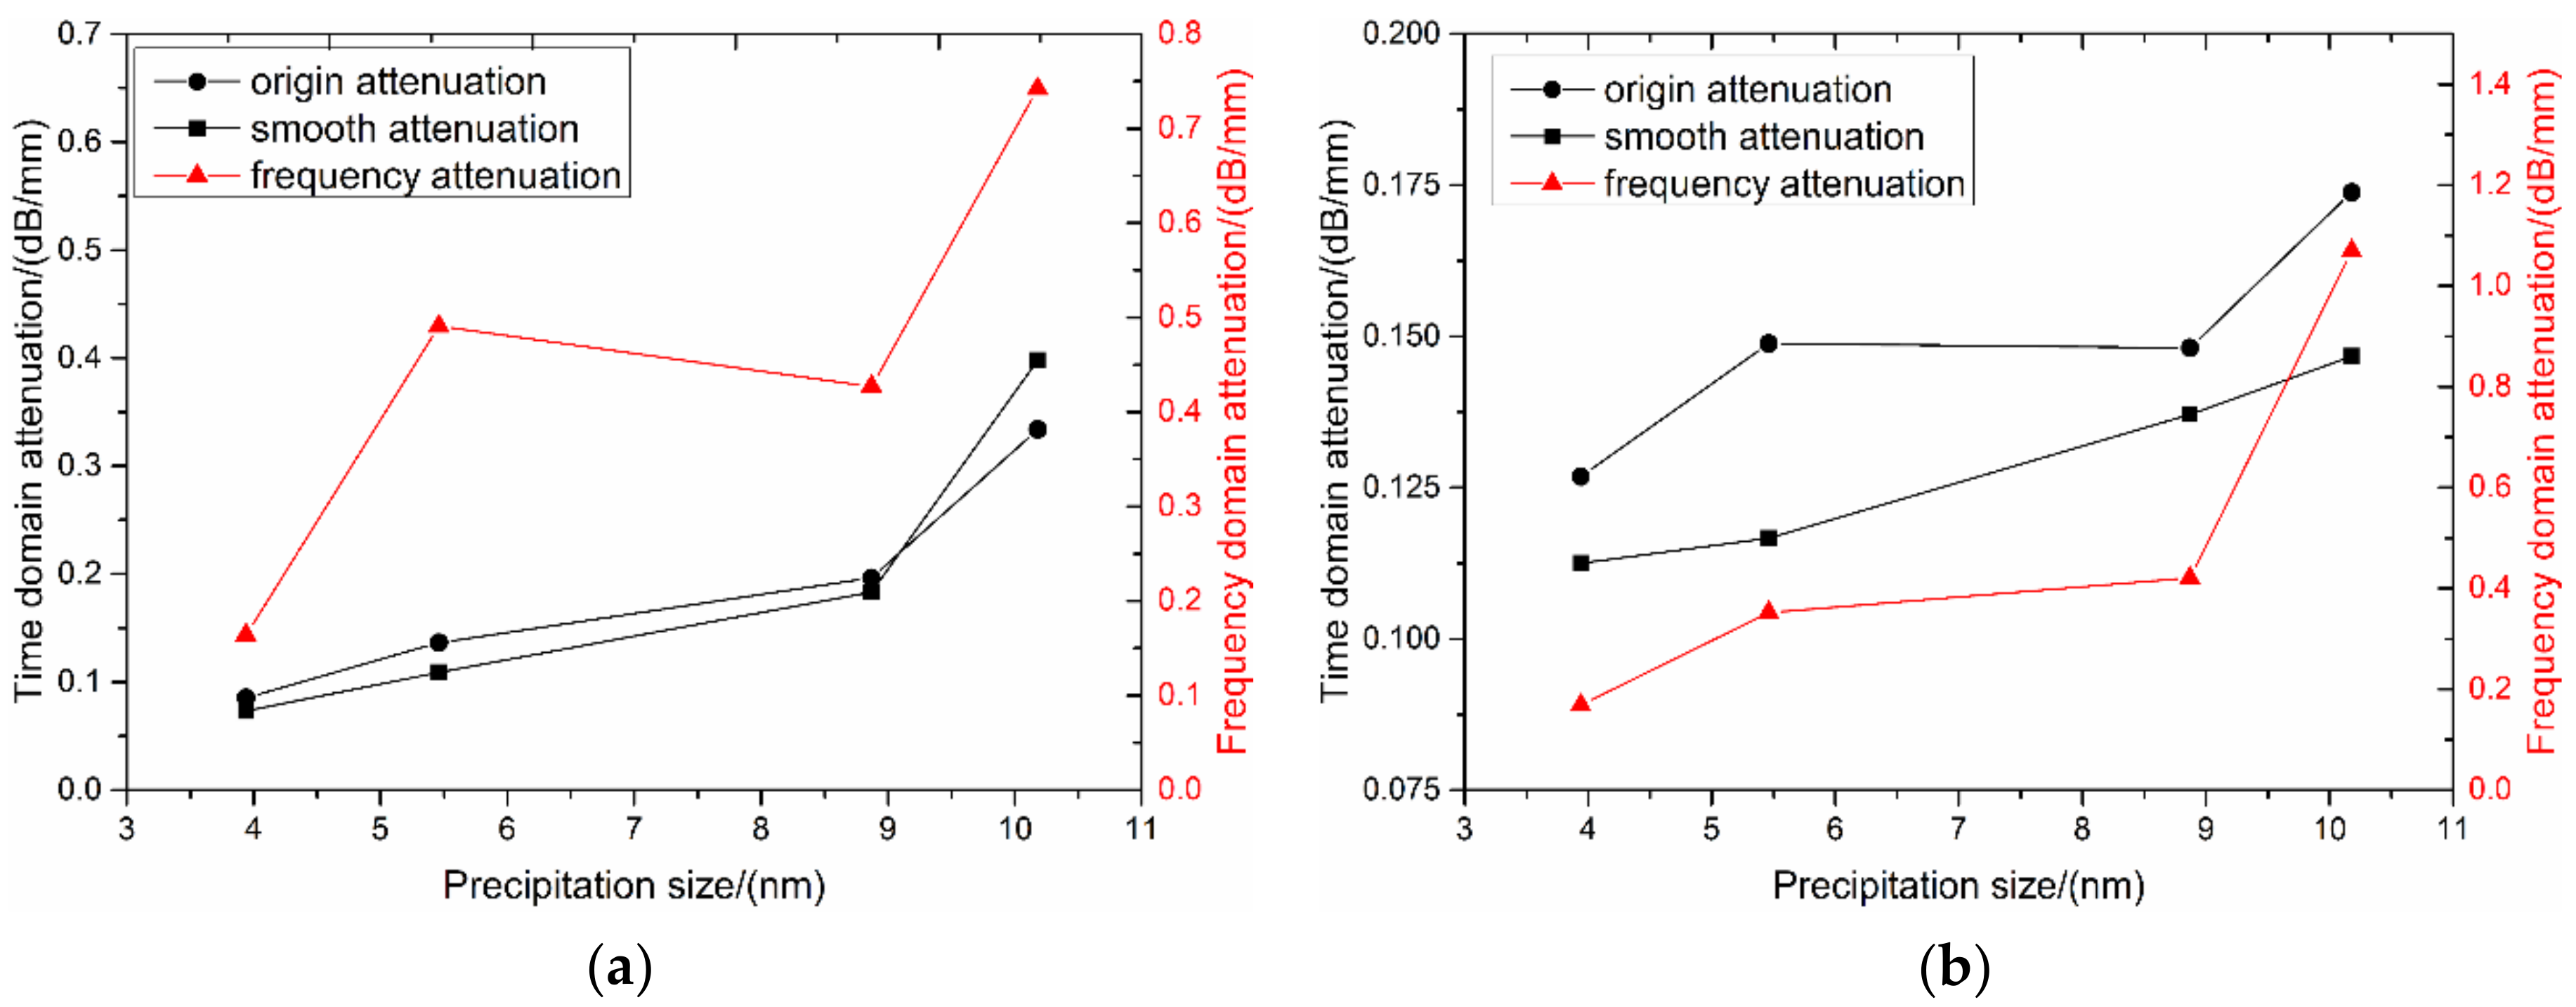
4.2. Attenuation Coefficient
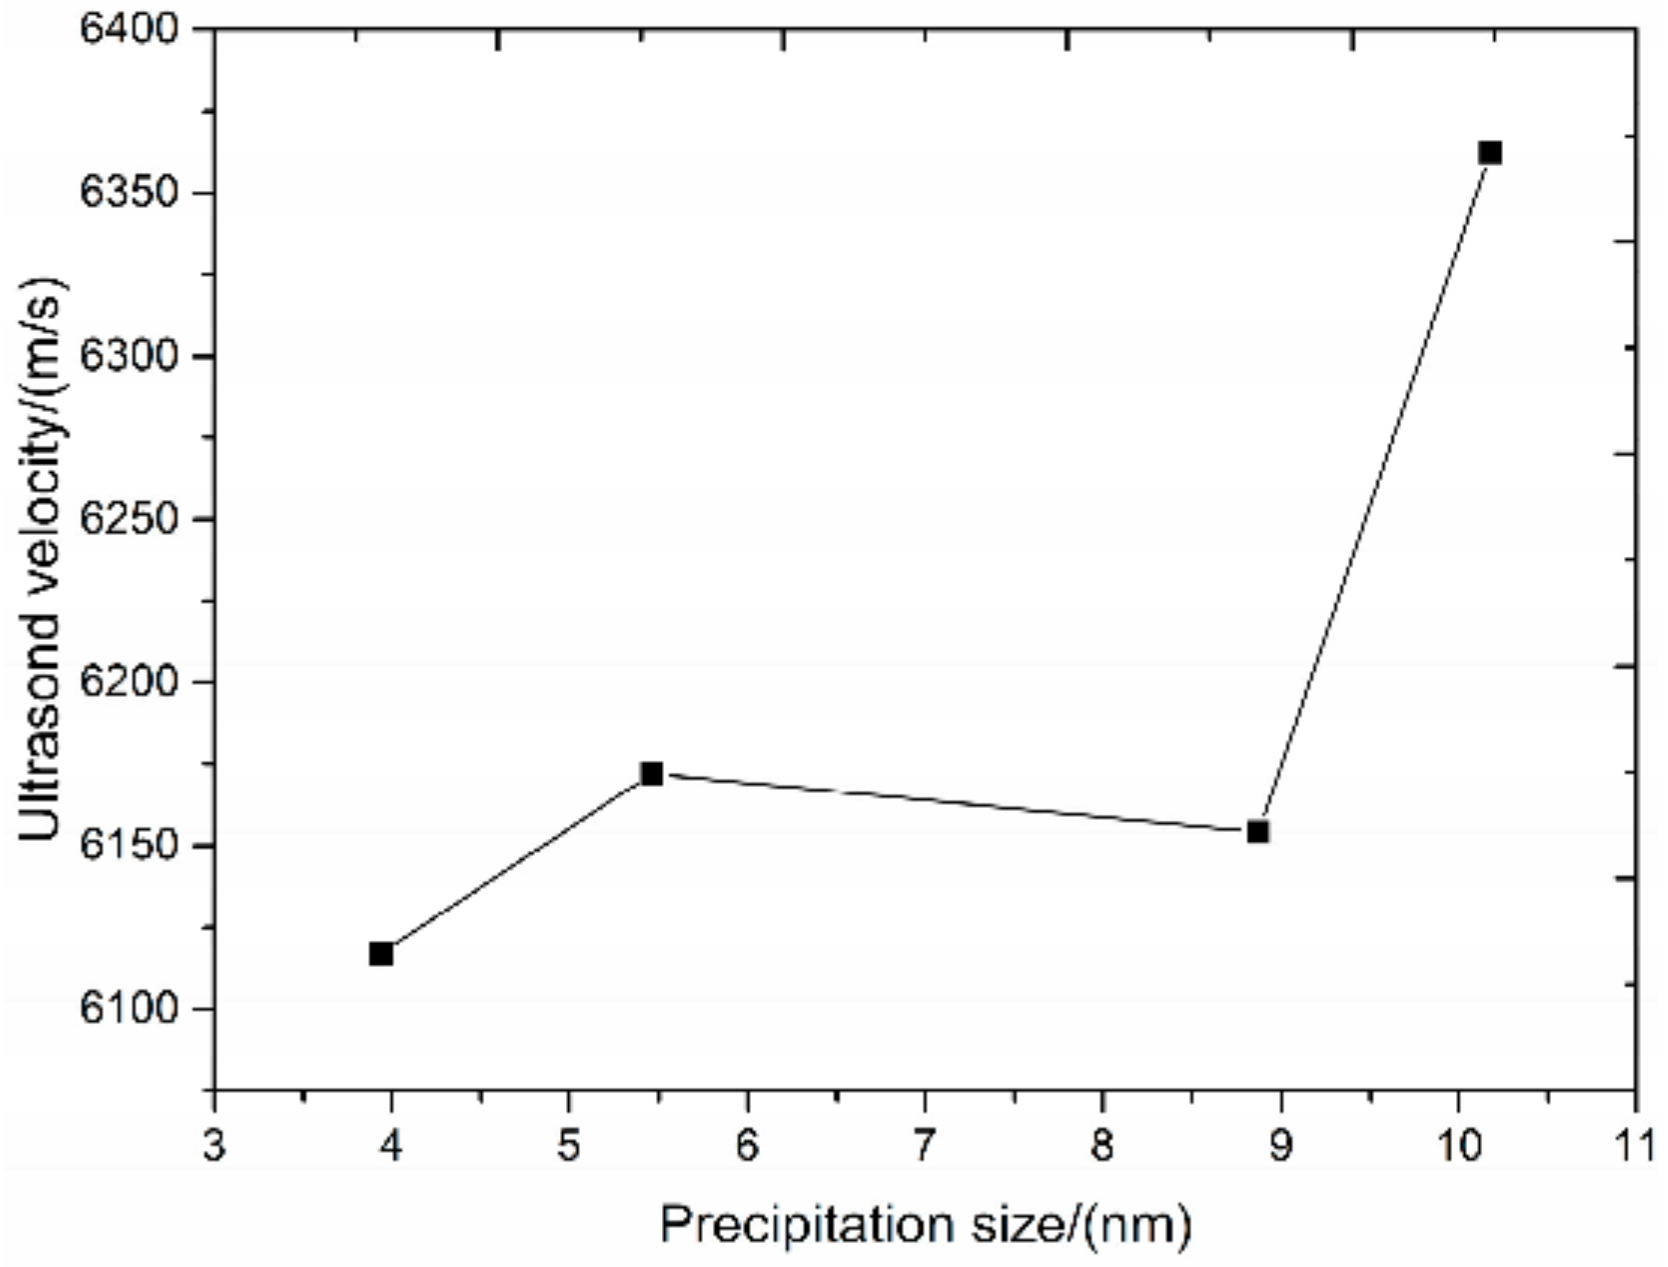
4.3. Ultrasonic Velocity
4.4. Discussion
5. Conclusions
Author Contributions
Funding
Data Availability Statement
Conflicts of Interest
Abbreviations
| TEM | Transmission Electron Microscope |
| SEM | Scanning Electron Microscope |
| Q-Switched Nd: YAG Laser | Q-switched neodymium-doped yttrium aluminum garnet Laser |
| FFT | Fast Fourier Transform |
References
- D’Scotto, D.S.; Gaies, J.; Golumbfskie, W.; Taheri, M.L. Direct measurement of the effect of cold rolling on β phase precipitation kinetics in 5xxx series aluminum alloys. Acta. Mater. 2017, 123, 264–271. [Google Scholar]
- Thronsen, E.; Marioara, C.D.; Sunde, J.K.; Minakuchi, K.; Katsumi, T.; Erga, I.; Andersen, S.J.; Friis, J.; Marthinsen, K.; Matsuda, K. The effect of heavy deformation on the precipitation in an Al-1.3Cu-1.0Mg-0.4Si wt.% alloy. Mater. Des. 2020, 186. [Google Scholar] [CrossRef]
- Jia, Y.W.; Wang, S.C.; Shu, D. Grain size prediction and investigation of 7055 aluminum alloy inoculated by Al-5Ti-1B master alloy. J. Alloys. Compd. 2019, 821. [Google Scholar] [CrossRef]
- Kaibyshev, R.; Sakai, T.; Musin, F.; Nikulin, I.; Miura, H. Superplastic behavior of a 7055 aluminum alloy. Scripta Materialia 2001, 45, 1373–1380. [Google Scholar] [CrossRef]
- Morris, J.G.; Liu, W.C. Al alloys: The influence of concurrent precipitation on recrystallization behavior, kinetics, and texture. JOM 2005, 57, 44–47. [Google Scholar] [CrossRef]
- Ralston, K.D.; Birbilis, N.; Weyland, M.; Hutchinson, C.R. Al alloy: The effect of precipitate size on the yield strength-pitting corrosion correlation in Al–Cu–Mg alloys. Acta. Mater. 2010, 58, 5941–5948. [Google Scholar] [CrossRef]
- Zhang, J.X.; Sun, H.Y.; Li, J.; Liu, W.C. Effect of precipitation state on recrystallization texture of continuous cast AA 2037 aluminum alloy. Mater. Sci. Eng. A 2019, 754, 491–501. [Google Scholar] [CrossRef]
- Zuo, J.R.; Hou, L.G.; Shu, X.D.; Peng, W.F.; Yin, A.M.; Zhang, J.S. Grain Refinement Assisted by Deformation Enhanced Precipitates through Thermomechanical Treatment of AA7055 Al Alloy. Metals 2020, 10, 594. [Google Scholar] [CrossRef]
- Zuo, J.R.; Hou, L.G.; Shi, J.T.; Cui, H.; Zhuang, L.Z.; Zhang, J.S. The mechanism of grain refinement and plasticity enhancement by an improved thermomechanical treatment of 7055 Al alloy. Mater. Sci. Eng. A 2017, 702, 42–52. [Google Scholar] [CrossRef]
- Marchese, G.; Aversa, A.; Lorusso, M.; Manfredi, D.; Calignano, F.; Lombardi, M.; Biamino, S.; Pavese, M. Development and Characterisation of Aluminium Matrix Nanocomposites AlSi10Mg/MgAl2O4 by Laser Powder Bed Fusion. Metals 2018, 8, 175. [Google Scholar] [CrossRef]
- Karlik, M.; Vronka, M.; Hausild, P.; Hajek, M. Influence of cold rolling on the precipitation in an Al–Mn–Zr alloy. Mech. Time-Depend. Mat. 2015, 85, 361–366. [Google Scholar]
- Kim, J.; Jhang, K.Y.; Kim, C. Dependence of nonlinear ultrasonic characteristic on second-phase precipitation in heat-treated Al 6061-T6 alloy. Ultrasonics 2018, 82, 84–90. [Google Scholar] [CrossRef]
- Murthy, G.V.S.; Patel, D.; Sahoo, K.L.A. study of Precipitation behaviour of A356 alloy using ultrasonic velocity measurements. Insight 2016, 58, 367–372. [Google Scholar] [CrossRef]
- Kumaran, S.M.; Priyadharsini, N.; Rajendran, V.; Jayakumar, T.; Palanichamy, P.; Shankar, P.; Raj, B. In situ high temperature ultrasonic evaluation for on-line characterisation of fine scale precipitation reactions in 8090 Al–Li alloy. Mat. Sci. Eng. A-Struct. 2006, 435, 29–39. [Google Scholar] [CrossRef]
- Kumaran, S.M. Identification of high temperature precipitation reactions in 2024 Al–Cu–Mg alloy through ultrasonic parameters. J. Alloy. Compd. 2012, 539, 139–183. [Google Scholar]
- Dong, F.; Wang, X.C.; Yang, Q.; Yin, A.M.; Xu, X.D. Directional dependence of aluminum grain size measurement by laser-ultrasonic technique. Mater. Charact. 2017, 129, 114–120. [Google Scholar] [CrossRef]
- Zhang, Y.J.; Wang, X.C.; Yang, Q.; Dong, F.; Du, X.Z.; Yin, A.M. Characterization of mean grain size of interstitial-free steel based on laser ultrasonic. J. Mate. Sci. 2018, 53, 8510–8522. [Google Scholar] [CrossRef]
- Zhan, Y.; Zhang, E.D.; Ge, Y.M.; Liu, C.S. Residual Stress in Laser Welding of TC4 Titanium Alloy Based on Ultrasonic laser Technology. Appl. Sci. 2018, 8, 1997. [Google Scholar] [CrossRef]
- Bai, X.; Zhao, Y.; Ma, J.; Liu, Y.X.; Wang, Q.W. Grain-Size Distribution Effects on the Attenuation of Laser-Generated Ultrasound in α-Titanium Alloy. Materials 2019, 12, 102. [Google Scholar] [CrossRef]
- Levesque, D.; Kruger, S.E.; Lamouche, G.; Kolarik, R.; Jeskey, G.; Choquet, M.; Monchalin, J.P. Thickness and grain size monitoring in seamless tube-making process using laser ultrasonics. NDT E. Int. 2006, 39, 622–626. [Google Scholar] [CrossRef]
- Yin, A.M.; Wang, X.C.; Glorieux, C.; Yang, Q.; Dong, F.; He, F.; Wang, Y.L.; Sermeus, J.; Van der Donck, T.; Shu, X.D. Texture in steel plates revealed by laser ultrasonic surface acoustic waves velocity dispersion analysis. Ultrasonics 2017, 78, 30–39. [Google Scholar] [CrossRef]
- Deschamps, A.; De Geuser, F.; Horita, Z.; Lee, S.; Renou, G. Precipitation kinetics in a severely plastically deformed 7075 aluminium alloy. Acta. Mater. 2014, 66, 105–117. [Google Scholar] [CrossRef]
- Liu, W.C.; Li, Z.; Man, C.S.; Raabe, D.; Morris, J.G. Effect of precipitation on rolling texture evolution in continuous cast AA 3105 aluminum alloy. Mater. Sci. Eng. A 2006, 434, 105–113. [Google Scholar] [CrossRef]
- Chen, X.; Wu, G.H.; Chen, H.; Zhou, Z.G. A multi-parameter ultrasonic evaluation of mean grain size using optimization. NDT E. Int. 2019, 106, 10–17. [Google Scholar] [CrossRef]
- Li, R.G.; Xin, R.L.; Liu, Q.; Chapuis, A.; Liu, S.F.; Fu, G.Y.; Zong, L. Effect of grain size, texture and density of precipitates on the hardnessand tensile yield stress of Mg-14Gd-0.5Zr alloys. Mater. Des. 2017, 114, 450–458. [Google Scholar] [CrossRef]
- Zhang, J.S.; Wu, G.H.; Zhang, L.; Zhang, X.L.; Shi, C.C.; Sun, J.W. Effect of Zn on precipitation evolution and mechanical properties of a high strength cast Al-Li-Cu alloy. Mater. Charact. 2020, 160. [Google Scholar] [CrossRef]
- Chen, Y.X.; Yang, Y.Q.; Feng, Z.Q.; Huang, B.; Luo, X. Surface gradient nanostructures in high speed machined 7055aluminum alloy. J. Alloy. Compd. 2017, 726. [Google Scholar] [CrossRef]
- Naimi, A.; Yousfi, H.; Trari, M. Influence of cold rolling degree and ageing treatments on the precipitation hardening of 2024 and 7075 alloys. Mech. Time-Depend. Mat. 2013, 17, 285–296. [Google Scholar] [CrossRef]
- Zuo, J.; Hou, L.; Shu, X.; Peng, W.; Yin, A.; Zhang, J. Effect of Deformation on Precipitation and the Microstructure Evolution during Multistep Thermomechanical Processing of Al-Zn-Mg-Cu Alloy. Metals 2020, 10, 1409. [Google Scholar] [CrossRef]
- Zhang, D.; Zhao, H.B.; Yang, J.K. Signal denoising of double-beam and double-scattering laser doppler velocimetry based on wavelet layering. Optik 2020, 202. [Google Scholar] [CrossRef]
- Wang, E.D.; Jiang, P.; Li, X.P.; Cao, H. Infrared stripe correction algorithm based on wavelet decomposition and total variation-guided filtering. J. Eur. Opt. Soc.-Rapid 2019, 16, 13–21. [Google Scholar] [CrossRef]
- Zhang, J.H.; Zhu, Q.; Zhang, J.R.; Song, L.; Wang, J.L. A novel algorithm for threshold image denoising based on wavelet construction. Cluster. Comput. 2019, 22, 12443–12450. [Google Scholar]
- Sundin, S.; Artymowicz, D. Direct measurements of grain size in low-carbon steels using the laser ultrasonic technique. Metall. Mater. Trans. A 2019, 16, 13–21. [Google Scholar] [CrossRef]


| Chemical | Zn | Mg | Cu | Fe | Si | Ti | Zr | Al |
|---|---|---|---|---|---|---|---|---|
| Content | 8.38 | 2.07 | 2.31 | 0.092 | 0.056 | 0.16 | 0.13 | Bal. |
| Sample No. | Solution Treatment | Aging Treatment | R (mm) | V (mm/s) | T | h0 | h1 |
|---|---|---|---|---|---|---|---|
| 7055-1 | 470 °C/8 h + 475 °C/16 h | 120 °C/24 h | 132 | 212 | 170 °C | 5 | 4 |
| 7055-2 | 5 | 3 | |||||
| 7055-3 | 5 | 2 | |||||
| 7055-4 | 5 | 1 |
| Sample No. | Origin Sample | 7055-1 | 7055-2 | 7055-3 | 7055-4 |
|---|---|---|---|---|---|
| Grain size/(μm) | 53.5 | 14.9 | 11.9 | 8.1 | 7.2 |
| Sample No. | 7055-1 | 7055-2 | 7055-3 | 7055-4 |
|---|---|---|---|---|
| Average size of precipitation/(nm) | 3.9 | 5.5 | 8.9 | 10.2 |
| Sample No. | Origin Sample | 7055-1 | 7055-2 | 7055-3 | 7055-4 |
|---|---|---|---|---|---|
| Deformation/(%) | 0 | 20 | 40 | 60 | 80 |
| Tensile strength/(MPa) | 577.6 | 664.5 | 683.3 | 648.2 | 609.6 |
| Yield strength/(MPa) | 493.4 | 616.1 | 657.8 | 627.6 | 598.1 |
| Elongation/(ΔL/L × 100%) | 14 | 5.1 | 5.1 | 3.5 | 7.2 |
| Conductivity/(S/m) | 29.3 | 30.2 | 34.5 | 36.2 | 39.7 |
| Sample No. | Average Size of Precipitates/(nm) | Attenuation Coefficient/(dB/mm) | |||||
|---|---|---|---|---|---|---|---|
| α (Signal) | α (Smooth) | α (FFT) | |||||
| Origin Signal | Wavelet Signal | Origin Signal | Wavelet Signal | Origin Signal | Wavelet Signal | ||
| 7055-1 | 3.9 | 0.08544 | 0.12686 | 0.07302 | 0.11248 | 0.16421 | 0.16854 |
| 7055-2 | 5.5 | 0.13632 | 0.14883 | 0.10881 | 0.11666 | 0.49057 | 0.35236 |
| 7055-3 | 8.9 | 0.19621 | 0.14812 | 0.18319 | 0.13707 | 0.42687 | 0.42028 |
| 7055-4 | 10.2 | 0.33388 | 0.17384 | 0.39799 | 0.14671 | 0.74207 | 1.06924 |
| Sample No. | 7055-1 | 7055-2 | 7055-3 | 7055-4 |
|---|---|---|---|---|
| Average size of precipitates/(nm) | 3.9 | 5.5 | 8.9 | 10.2 |
| Ultrasonic velocity/(m/s) | 6116.976 | 6172.192 | 6154.264 | 6362.386 |
Publisher’s Note: MDPI stays neutral with regard to jurisdictional claims in published maps and institutional affiliations. |
© 2021 by the authors. Licensee MDPI, Basel, Switzerland. This article is an open access article distributed under the terms and conditions of the Creative Commons Attribution (CC BY) license (http://creativecommons.org/licenses/by/4.0/).
Share and Cite
Zhu, Z.; Peng, H.; Xu, Y.; Song, X.; Zuo, J.; Wang, Y.; Shu, X.; Yin, A. Characterization of Precipitation in 7055 Aluminum Alloy by Laser Ultrasonics. Metals 2021, 11, 275. https://doi.org/10.3390/met11020275
Zhu Z, Peng H, Xu Y, Song X, Zuo J, Wang Y, Shu X, Yin A. Characterization of Precipitation in 7055 Aluminum Alloy by Laser Ultrasonics. Metals. 2021; 11(2):275. https://doi.org/10.3390/met11020275
Chicago/Turabian StyleZhu, Zhenge, Hao Peng, Yacheng Xu, Xueyong Song, Jinrong Zuo, Ying Wang, Xuedao Shu, and Anmin Yin. 2021. "Characterization of Precipitation in 7055 Aluminum Alloy by Laser Ultrasonics" Metals 11, no. 2: 275. https://doi.org/10.3390/met11020275
APA StyleZhu, Z., Peng, H., Xu, Y., Song, X., Zuo, J., Wang, Y., Shu, X., & Yin, A. (2021). Characterization of Precipitation in 7055 Aluminum Alloy by Laser Ultrasonics. Metals, 11(2), 275. https://doi.org/10.3390/met11020275