Abstract
The fatigue strength of high silicon-alloyed nodular cast iron is influenced by casting defects and graphite precipitates. The literature as well as the findings of this work show that these microstructural constituents can be tailored by controlling silicon microsegregation. In addition, segregations also affect the ferritic matrix microstructure locally. In the present work, silicon segregations in high silicon-alloyed ductile iron are specifically manipulated by small additions of aluminum. It was demonstrated how the aluminum content affects a wide range of microstructural constituents across a variety of length scales. Specimens from alloys with small additions of aluminum were fabricated and tested by rotating bending. Results show that the fatigue strength can be increased compared to a reference alloy with no aluminum. Microstructure analysis as well as fractography were performed concluding that microstructural changes could be attributed to the increased aluminum content, which allows the fatigue properties to be tailored deliberately. However, according to the results of this study, the negative effect of aluminum on castability and graphite morphology limits the maximum content to approximately 0.2 wt.%.
1. Introduction
Ductile cast iron is a material which, due to the nature of the manufacturing process, shows different microstructures throughout a component. However, the influence of microstructure on fatigue of nodular cast iron is often overlaid by large shrinkage cavities. Shirani and Harkegard [1] have performed fatigue tests on EN-GJS-400-18LT. Crack initiation took place almost exclusively at shrinkage cavities. In the fatigue experiments of Vasko et al. [2], shrinkage cavities determined the macroscopic failure of the fatigue specimens. Against this background, the graphite morphology and the matrix microstructure in nodular cast iron become relevant if large defects can be avoided. In the absence of large casting defects, an influence of graphite morphology on the fatigue properties of ferritic cast iron is measurable [3]. It was found that in EN-GJS-400-18LT (according to DIN EN 1563 [4], ISO1083/JS/400-18-LT/S according to ISO 1083 [5]), large and smaller non-spheroidal graphite nodules reduce the fatigue strength. Here, the pearlite content did not influence the fatigue properties if it was below 10% [6]. In conventional Woehler tests, nodular cast iron generally shows a fatigue endurance limit, which implies the existence of non-propagating cracks. They occur in particular on non-spheroidal graphite or spheroidal graphite, which has local morphological irregularities (roughness of the phase boundary) [7].
As with conventional cast iron, fatigue of high silicon alloy cast iron is dominated by shrinkage cavities and graphite [8]. Static mechanical properties such as the tensile strength increase in fully ferritic grades with silicon contents of 3.2 to 4.3 wt.% compared to conventional ferritic–pearlitic cast iron grades (according to DIN EN 1563 [9]). The elongation at fracture can be twice as high for the same strength. High contents of more than 4.3 wt.% silicon (Si) reduce the mechanical properties of cast iron by promoting the formation of chunky graphite, which reduces the fatigue properties of high silicon-alloyed nodular cast iron [10] and causes the ferritic matrix to become brittle [11]. This embrittlement of high silicon-alloyed cast iron can be explained by microsegregation of silicon. Thereby, the growth of the austenite and graphite formation [12] as well as the preferential solubility of silicon in solid austenite are decoupled, resulting in a negative segregation profile. This is indicated by areas near to graphite nodules, that are characterized by an elevated Si content. With increasing distance from the graphite, the Si content decreases, shown by micro-segregation simulations, Klemm etchings and energy dispersive X-ray spectroscopy (EDS) line scans [13]. Transmission electron microscopy (TEM) investigations show that higher concentrations of silicon favor the formation of B2 and DO3 superstructures in the immediate vicinity of the graphite nodules [14]. Glavas et al. [11] associate their increased occurrence with the decrease in toughness and ductility in Si-alloyed ductile iron. Below a limit of 4.3 wt.% Si, the superstructures can be used specifically to increase strength, as they are obstacles to dislocation movements [15]. Silicon segregations were characterized mechanically by Alhussein et al. [16] using microhardness measurements. According to this, the silicon segregations can be mechanically divided into three zones, each between two graphite nodules, which presumably have a local influence on crack initiation and crack growth. Eiken et al. [17] have simulated the formation of Si segregations in Si-alloyed ductile iron using the phase field method. The simulation results show that the segregation profile of Si depends significantly on the distribution of the graphite nodules. Until now, microsegregation has been seen as an unwelcome side effect. However, alloying with aluminum can lead to a full inversion of the silicon microsegregation profile [13]. Such higher aluminum contents further influence graphite particles and the ferritic matrix. They reduce the solubility of carbon in the melt, which can be expressed by a higher particle number with a simultaneously smaller sphere size, since the possibility of graphite formation increases [18]. This higher formation rate promotes the formation of chunky graphite [19] and decreases nodularity [20]. If these influences and their interactions are thoroughly understood, there could be a potential to specifically adjust the fatigue strength of this alloy group by adding small amounts of aluminum. However, to the best knowledge of the authors, the influence of aluminum as well as the silicon microsegregation profile on fatigue of high silicon-alloyed ductile iron has not yet been investigated in the literature. Thus, the objective of this paper is to investigate the influence of aluminum on microstructure and fatigue strength of solution-strengthened ductile cast iron.
2. Materials and Methods
2.1. Casting
This section describes the manufacturing of the examined alloys and the procedure used for the fatigue tests. In order to determine the influence of metallurgical gradients on fatigue strength of high silicon ductile iron, a series of tests with three alloys, referred to as A1–A3, was manufactured. Based on the solid solution-strengthened cast iron grade EN-GJS-600-10 (according to [9]) with a base silicon content of 4.3 wt.%, different amounts of aluminum were added. Accordingly, contents from 0 wt.% as reference (A1) to 0.3 wt.% (A2) were set as target values. Alloy A3 was set to a content of 0.15 wt.% aluminum. Recycled material, pure iron and ferrosilicon (FeSi) were taken as charge materials for all investigations. These were melted in a medium frequency induction furnace for a cast weight of 65 kg. At a melting temperature of 1400 °C, a solid piece of Al99.8 was dipped into the melt by using a plunger. The melt was then superheated to 1500 °C and kept at this temperature for five minutes to obtain sufficient mixing of the melt. After this short holding time, the slag was removed from the melt and magnesium treatment was performed by overpouring with an FeSiMg pre-alloy. Again, the melt was deslagged and inoculated with 0.3 wt.% SMW 605 (ASK Chemicals GmbH, Hilden, Germany). Just before casting the test specimens at a melting temperature of 1350 °C, spectrometer samples were poured into a copper die and thermal analysis was performed. For each experiment, the casting geometry shown in Figure 1a, consisting of four standard Y4 test blocks according to DIN EN 1563 [9] with a thermal modulus of 1.7 cm in a furan-bounded sand mold, was used. Up to six rotating bending test specimens could then be taken and analyzed from each individual test block.

Figure 1.
Casting with specimen in rotating bending isometric view (a) and side view in mm (b).
2.2. Specimen Analyses
Up to a total of 24 test specimens for the rotating bending fatigue test were produced from one casting. Blanks of these specimens were taken from the test blocks with a water-cooled core drill. The exact position of the specimens was 10 mm from the casting skin on each side of the block. The distance between the specimen centers was 20 mm, with the central specimen of the three being in the middle of the Y4 test block, as illustrated in Figure 1b. As will be seen in the later results, the influence of the different sample positions can be excluded and will not be considered further.
The disc-shaped samples for spectrometric analysis were ground with a rough SiC sandpaper and their chemical composition was examined on an optical emission spectrometer (OES) type OE750 (Hitachi High-Tech Analytical Science, Uedem, Germany). Table 1 shows the compositions for all three melts processed, which slightly differ from the targeted values. Moreover, the compositions vary slightly between the alloys considered. The carbon equivalent is approximately constant. Hence, a similar hypoeutectic solidification can be presumed.

Table 1.
Chemical composition of the three processed melts, contents in wt.%.
2.3. Fatigue Tests
Stress-controlled rotating bending fatigue tests under a stress ratio of R = −1 were carried out in the high cycle fatigue regime (HCF) on all three alloys, A1–A3. For each alloy, at least 20 specimens were machined and manually polished lengthways to avoid the influence from surface roughness. The length of the specimens was 70 mm with a gauge diameter of 5 mm, as shown in Figure 2. Staircase procedures were carried out in accordance with [21] using a step size of 15 MPa. The testing machine KS-PUN 0192 (Carl Schenk Maschinenfabrik GmbH, Darmstadt, Germany) operated under a frequency of 100 Hz. In order to avoid deviation introduced by the machine, all specimens were tested on the same machine. Samples were tested either until full rupture or reaching the maximum number of cycles, which was set to 107. The machine was then stopped and samples were marked as run-outs. The fatigue strength, σA, was determined for fracture probabilities of 10%, 50%, and 90% respectively. The statistical evaluation of testing was based on a combined method. From the staircase procedure, the strength for 50% probability of failure was determined by calculating the arithmetic mean value. Mixed horizons with fractures and run-outs were evaluated with the help of Rossow’s estimation function. The probability mesh in the transition zone to long life fatigue was determined by linear regression.
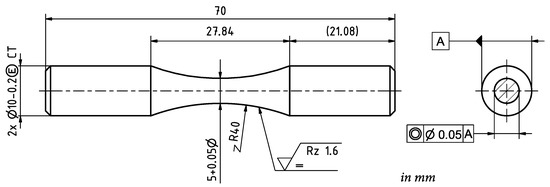
Figure 2.
Technical drawing of the fatigue specimen for rotating bending.
3. Results
3.1. Influence of Aluminum on Silicon Segregation
In this section, possibilities to control the microstructure by metallurgical gradients are presented. Energy-dispersive X-ray spectroscopy (EDS) line scans were performed at 15 kV, 10 mm working distance and with a dwell time of 500 ms using EDAX TEAM software (AMETEK GmbH, Weiterstadt, Germany). The scanning electron microscopy devices used were a FEI Helios Nanolab G3 CX DualBeam (Thermofisher GmbH, Dreieich, Germany) focused ion beam (FIB) and a Gemini Supra 55VP (Carl Zeiss Microscopy GmbH, Oberkochen, Germany). Several of those EDS line scans were carried out between graphite nodules to quantify segregation of silicon. It became apparent that segregations were only seldom observed between graphite nodules. The distance between two graphite nodules had to be larger than 80 µm to measure silicon gradients. This condition also applied for each spatial direction. Otherwise, the silicon segregation was homogenized by the closely spaced graphite nodules. However, if these requirements were fulfilled, a high concentration of silicon was observed in the case of alloy A1 (0.0 wt.% Al) directly at the graphite-ferrite interphase up to 5.7 %, as shown in Figure 3. As previously pointed out, high local silicon concentrations were associated with B2 and DO3 superstructures, which results in local embrittlement of the ferrite. To facilitate comparison of the data, the line scans in Figure 3 were normalized to a uniform dimensionless length of 20, based on the number of measurements carried out between two graphite nodules. The high aluminum content in alloy A2 (0.33 wt.% Al) almost completely homogenized the silicon gradient, but did not invert it. For alloy A3 (0.18 wt.% Al), the silicon segregation was smaller compared to alloy A1.
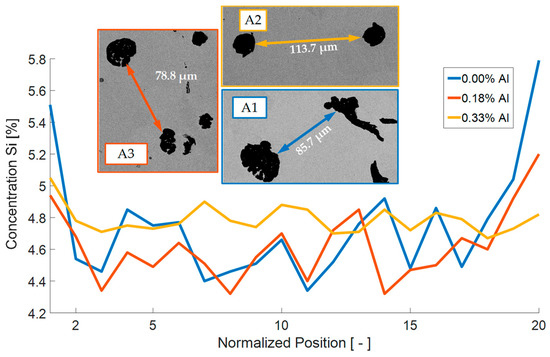
Figure 3.
Normalized EDS line scan to determine local silicon concentration for alloys A1–A3.
3.2. Fatigue Tests
Figure 4 shows the Woehler diagram of the rotating bending fatigue testing. The horizontal lines indicate the fatigue endurance strength at 50% failure probability determined by statistical analysis, as described in Section 2.3. With a value of σA,50% = 255.0 MPa, the alloy with 0.33 wt.% aluminum (A2) showed the lowest fatigue strength compared to the other alloys. Compared to the reference alloy A1 (no aluminum, σA,50% = 265.5 MPa), the alloy with 0.18 wt.% aluminum showed a much larger fatigue strength at 50% failure probability of σA,50% = 314 MPa. The scatter in the finite life region was significantly high for constant stress values, as is usual for nodular cast iron.

Figure 4.
Woehler diagram of rotating bending fatigue testing of alloys A1, A2 (0.33 wt.% Al) and A3 (0.18 wt.% Al).
Compared to alloys A1 and A2, the staircase results of the alloy with 0.18 wt.% aluminum scattered considerably higher, resulting in run-outs on seven different stress levels. This is also revealed by Figure 5 which shows the probability mesh in the transition zone to infinite life of all three investigated alloys obtained through regression by minimizing the stress amplitude square errors. Here, alloy A3 (0.18 wt.% Al) showed the lowest fatigue strength at 10% failure probability due to the high scatter, which led to a poor regression. For alloy A2, only two stress levels could be evaluated from the fatigue data obtained from the rotating bending tests.
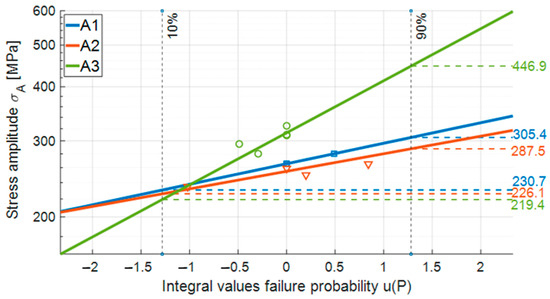
Figure 5.
Probability mesh in transition zone of rotating bending fatigue testing of alloys A1 (0 wt.% Al), A2 (0.33 wt.% Al) and A3 (0.18 wt.% Al).
3.3. Root Cause Analysis
This section presents a hierarchical root cause analysis to explain the differences in fatigue strength of the reference alloy A1 compared to the alloys with aluminum A2 and A3.
3.3.1. Fractography
All fractured samples were analyzed by means of fractography, shown in Figure 6. Secondary electron (SE) and backscattered electron (BSE) imaging were conducted using accelerating voltage of 15 kV. Crack loci were identified, and the projected area was measured using the open-source software ImageJ Fiji. Then, the √ area-parameter according to Murakami [22] was calculated. Compared to alloy A2 and A3 with 123.2 µm and 137.4 µm respectively, alloy A1 showed a much lower average √ area-parameter of crack, initiating defects of 99.3 µm. Alloy A1 was dominated by cases where only one crack initiation site could be identified (Table A1, Appendix A). Here, crack initiating defects were predominantly micro shrinkages. This changed for alloy A2, where the proportion of fractured specimens with multiple crack initiation sites increased (Table A2, Appendix A). In addition, the cracks originated solely from non-spheroidal graphite instead of micro shrinkage. Moreover, the center left image in Figure 6 clearly shows that additional graphite clusters accumulated, forming a larger defect. For alloy A3, the trend shifted again slightly towards micro shrinkage as crack initiation sites, with graphite remaining the dominant factor (Table A3, Appendix A). However, fracture surfaces showed mainly spheroidal graphite, whereas the cracks predominantly initiated at clusters, as the lower left and right image in Figure 6 shows.
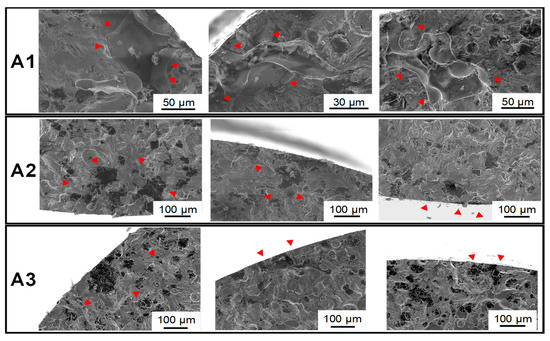
Figure 6.
SEM pictures of Crack loci on fracture surfaces of broken specimens from alloys A1–A3.
3.3.2. Graphite Morphology
Three metallographic samples were taken from the center of the casting and another three samples from fatigue specimens. Specimens were processed according to the preparation steps listed in Table A4 in the Appendix A. All samples were cleaned with ethanol after each step to avoid corrosion on the sample surface. More than ten light microscopic images were randomly recorded at 100× magnification with a resolution of 2600 × 2060 pixels for each metallographic sample. The examination area in these images corresponded to the specifications of at least 500 particles according to DIN EN ISO 945-4 [23]. Exemplary micrographs in Figure 7 show spheroidal graphite for alloy A1. The aluminum-alloyed materials A2 and A3 showed larger graphite nodules compared to A1. The high aluminum content in A2 resulted in degenerated non-spheroidal graphite. Hence, a low nodularity follows for alloy A2, shown in Table 2. The nodularity is defined as the percentage of spheroidal graphite in cast iron and was determined according to ASTM E2567 [24] and DIN EN ISO 945-4 [23]. Noticeable is the lower nodule count for both aluminum-alloyed materials, A2 and A3. Comparing different locations on the metallographic specimens of the aluminum-alloyed materials, it is noteworthy that the graphite was more unevenly distributed compared to alloy A1.
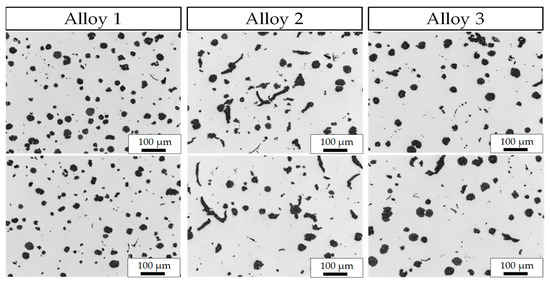
Figure 7.
Exemplary micrographs of alloys A1–A3 at 100× magnification.
Table 2.
Results of graphite analysis on alloys A1–A3.
3.3.3. Electron Backscatter Diffraction Measurements (EBSD)
Electron backscatter diffraction measurement (EBSD) characterizations were conducted using a FEI Helios Nanolab G3 CX DualBeam focused ion beam (FIB) scanning electron microscope (SEM) (Thermofisher GmbH, Dreieich, Germany). The metallographic samples were taken from fatigue samples at a good distance from the highly stressed volume. All samples were wet-ground and polished. An EDAX/TSL system (AMETEK GmbH, Weiterstadt, Germany) equipped with a Hikari camera was used for electron backscatter diffraction (EBSD) measurements at 13 mm working distance. Large area EBSD scans that provide statistical information on grain size and Taylor factor were conducted at 20 kV with a step size of 3 µm. Figure 8 shows grain size distribution for all alloys, A1–A3. The grain size diameter is reported as the mean of the circle equivalent diameters of the measured grain areas. Distributions show no clear difference between the alloys. However, the grain size diameter was slightly increased for the alloys with aluminum, with A3 exhibiting the largest mean grain size diameter of 51.8 µm.
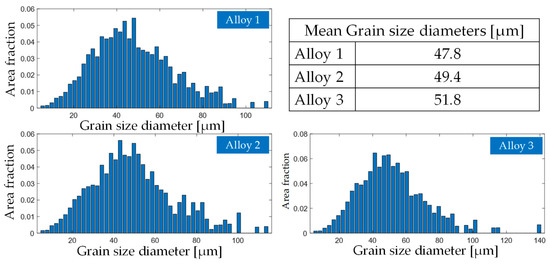
Figure 8.
Grain size distribution of alloys A1–A3.
Taylor factors maps were created in order to investigate possible texture and orientation differences between alloys. The Taylor model is able to describe slip in the individual crystals with the key assumption being a uniform strain state within each constituent crystal equal to the macroscopic strain. The propensity of a crystal to slip can be described with the Taylor factor. Here, for the bcc-crystals only the {110} <111> slip systems have been analyzed by using a loading direction out of the paper plane resulting in a deformation gradient for uniaxial tension. Results in Figure 9 show a clear difference between the three investigated alloys. The alloy A1 with no added aluminum showed lower Taylor factors as can also be seen from the distribution of the Taylor factors shown in the top right corner of Figure 9. The average Taylor factor for alloy A1 was 3.06 with a standard deviation of 0.37. Compared to A1, the alloys with aluminum showed higher average Taylor factors with values of 3.2 for alloy A2 and 3.16 for alloy A3. Moreover, the distribution of Taylor factors clearly shifted to the high value region. This can also be seen in the Taylor factor maps, showing an increased amount of red-colored grains for alloy A2 and A3.
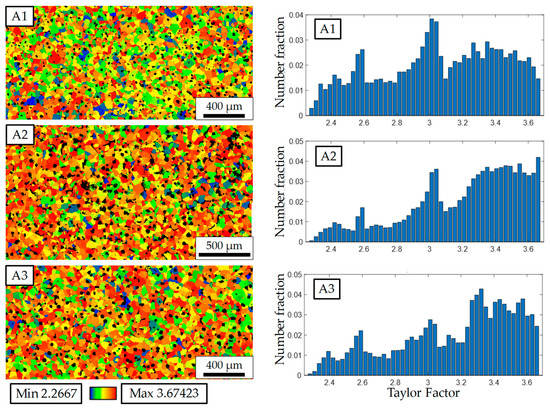
Figure 9.
Taylor factor maps of alloys A1–A3, loading out of paper plane.
4. Discussion and Conclusions
Based on a reference alloy A1 with no aluminum, an alloy with 0.33 wt.% aluminum was cast. From a manufacturing point of view, it should be noted that the high aluminum content negatively influenced the castability, since it reduced the surface tension of the melt, which led to an increased formation of slag. Moreover, a reduced mold filling capacity was observed. Rotating bending tests were conducted for both alloys, resulting in a lower fatigue strength for the aluminum-alloyed material, A2, compared to the reference alloy, A1. A hierarchical analysis of the microstructure was subsequently carried out in order to identify the root causes for decreased fatigue strength. In accordance with literature on cast irons with lower silicon contents [25], it was found that aluminum negatively influences graphite growth resulting in non-spheroidal graphite, which could be held responsible for crack initiation. As a consequence, a much lower nodularity was measured for alloy A2 compared to A1. Degenerations can possibly be explained by an influence of aluminum on the orientation of the graphite surface. In contrast to the literature, a decreased nodule count was measured for aluminum-alloyed material A2 [18,19,20]. Graphite nodules were also unevenly distributed, causing the formation of graphite clusters which acted as crack-initiating defects and finally reduced fatigue strength.
Based on these results, a third alloy, A3, was cast containing only 0.18 wt.% aluminum. Compared to alloy A2, the nodularity was improved and the crack-initiation sites changed from only graphite and graphite clusters in alloy A2 to micro shrinkage and graphite in A3. In comparison to A1 and A2, this alloy showed a much higher fatigue strength at 50% failure probability but accompanied by a higher scatter in the transition region to infinite life. The formation of graphite clusters and micro shrinkage can be held responsible for early failure occurring in the finite life region. With no significant differences revealed by the analysis of graphite morphology, subsequent investigations focused on other influences of the elevated aluminum content on the microstructures of alloys A2 and A3.
Therefore, EBSD scans were carried out in order to compare the grain sizes with no significant differences found. Consequently, aluminum supposedly did not affect the grain sizes. EDS line scans where carried out and silicon microsegregations were found in alloy A1. These segregations were increasingly smoothed with increasing aluminum content, as also reported in the literature [13]. Arguably, the superstructure formation as a result of silicon segregation, which is well known in the literature [14], could favor crack initiation in the vicinity of graphite. However, aluminum is also suspected of forming superstructures and could likewise cause local embrittlement of the ferrite.
Interestingly, different textures were measured in the EBSD analysis for both alloys with elevated aluminum content compared to the reference alloy, A1. The scan was repeated once at another location, supporting the finding that aluminum can be used to set a preferred orientation for the ferrite grains. Thereby, aluminum leads to higher Taylor factors, here calculated for {110} < 111 > slip systems. Large Taylor factors indicate that a deformation requires large amounts of slip, expending large plastic work. In contrast, slip is more efficient for grains with low Taylor factors. Conclusions can be drawn that the global Al content can be used to tailor the constitutive behavior of the ferrite.
This study has shown that fatigue of high silicon-alloyed ductile iron can possibly be controlled deliberately by small additions of aluminum. It was demonstrated how aluminum affects a wide range of microstructural constituents across a variety of length scales. However, not all effects of aluminum on microstructure and resulting local mechanical properties are yet fully understood. In particular, only three alloys were investigated in this study. Meanwhile, it was demonstrated that the addition of aluminum not only affects many microstructure constituents simultaneously, but also the mold filling properties. As a result, the fatigue strength can decrease drastically. However, this study suggests an optimum exists in between all of the abovementioned boundary conditions, which can be determined by a more comprehensive study with a larger number of alloys between 0% and about 0.2% and a consequent higher number of fatigue samples. The following findings are worth highlighting:
- Adding 0.18 wt.% Al to a high silicon-alloyed nodular cast iron resulted in a significantly higher fatigue strength based on the 50% failure probability. This positive effect was diminished by the increased scatter of the fatigue endurance limit of alloy A1.
- The aluminum affects several constituents of the microstructure including the graphite and orientation of ferrite grains.
- The fatigue strength of high silicon-alloyed nodular cast iron can possibly be specifically adjusted by the addition of aluminum. To achieve this, more alloys with aluminum contents between 0.0 wt.% and about 0.2 wt.% Al must be investigated.
The identified complex relation between the amount of aluminum, the parameters of the manufacturing process and their influence on the microstructure and mechanical properties, gives motivation for the following future research work:
- Investigation of the influence of adding aluminum to high silicon-alloyed nodular cast iron on mold filling.
- Systematic investigation of the influence of aluminum on texture formation in ferrite.
Author Contributions
Conceptualization, C.G., J.N., C.B. and A.B.-P.; methodology, C.G. and J.N.; formal analysis, C.G., J.N., C.B. and A.B.-P.; investigation, C.G. and J.N.; resources, A.B.-P. and C.B.; data curation, C.G. and J.N.; writing—original draft preparation, C.G. and J.N.; writing—review and editing, C.G., J.N., C.B. and A.B.-P.; visualization, C.G. and J.N.; supervision, C.B. and A.B.-P. All authors have read and agreed to the published version of the manuscript.
Funding
This research received no external funding.
Institutional Review Board Statement
Not applicable.
Informed Consent Statement
Not applicable.
Data Availability Statement
The data presented in this study are available on request from the corresponding author. The data are not publicly available because they are part of an ongoing study.
Conflicts of Interest
The authors declare no conflict of interest.
Appendix A
Table A1.
Crack locus area sizes alloy 1.
Table A1.
Crack locus area sizes alloy 1.
| Specimen | Crack Locus | √ Area [µm] | √ Sum Area [µm] |
|---|---|---|---|
| 1_1 | Micro shrinkage | 101.8 | - |
| - | Micro shrinkage | 72.2 | - |
| - | Micro shrinkage | 65.6 | 141.0 |
| 1_3 | Micro shrinkage | 39.8 | - |
| - | Graphite | 34.9 | 52.9 |
| 1_6 | Micro shrinkage | 82.8 | 82.8 |
| 1_8 | Micro shrinkage | 122.7 | - |
| - | Micro shrinkage | 72.7 | 142.6 |
| 1_11 | Micro shrinkage | 106.9 | 106.9 |
| 1_13 | Graphite | 99.6 | 99.6 |
| 1_15 | Micro shrinkage | 107.5 | 107.5 |
| 1_17 | Micro shrinkage | 77.8 | 77.8 |
| 1_19 | Micro shrinkage | 109.3 | 109.3 |
Table A2.
Crack locus area sizes alloy 2.
Table A2.
Crack locus area sizes alloy 2.
| Specimen | Crack Locus | √ Area [µm] | √ Sum Area [µm] |
|---|---|---|---|
| 2_8 | Graphite | 50.3 | - |
| - | Graphite | 79.7 | - |
| - | Graphite | 74.3 | - |
| - | Graphite | 67.4 | - |
| - | Graphite | 53.3 | 147.6 |
| 2_10 | Graphite | 73.3 | - |
| - | Graphite | 58.2 | 93.6 |
| 2_11 | Graphite | 100.8 | 100.8 |
| 2_12 | Graphite | 45.1 | - |
| - | Graphite | 65.1 | - |
| - | Graphite | 104.7 | - |
| - | Graphite | 85.0 | - |
| - | Graphite | 47.8 | 163.5 |
| 2_13 | Graphite | 102.1 | 102.1 |
| 2_16 | Graphite | 74.2 | 74.2 |
| 2_18 | Graphite | 74.4 | - |
| - | Graphite | 81.3 | 110.9 |
| 2_23 | Graphite | 160.4 | 160.4 |
Table A3.
Crack locus area sizes alloy 3.
Table A3.
Crack locus area sizes alloy 3.
| Specimen | Crack Locus | √ Area [µm] | √ Sum Area [µm] |
|---|---|---|---|
| 3_4 | Graphite | 124.5 | 124.5 |
| 3_5 | Micro shrinkage | 135.4 | - |
| - | Micro shrinkage | 121.2 | 181.7 |
| 3_10 | Graphite | 67.1 | - |
| - | Graphite | 91.7 | - |
| - | Graphite | 46.3 | 122.7 |
| 3_12 | Graphite | 123.4 | - |
| - | Graphite | 40.0 | 129.7 |
| 3_11 | Micro shrinkage | 129.6 | 129.6 |
| 3_13 | Graphite | 102.6 | - |
| - | Micro shrinkage | 39.3 | 109.8 |
| 3_18 | Micro shrinkage | 117.1 | 117.1 |
| 3_22 | Graphite | 115.0 | - |
| - | Graphite | 73.2 | - |
| - | Graphite | 34.0 | - |
| - | Graphite | 68.3 | - |
| - | Graphite | 61.3 | 167.8 |
Table A4.
Single steps of metallographic preparation.
Table A4.
Single steps of metallographic preparation.
| Step No. | Sandpaper Grit/ Polishing Grit | Grinding Force [N] | Time [min:s] |
|---|---|---|---|
| 1 | 80 | 25 | 2:00 |
| 2 | 180 | 25 | 2:00 |
| 3 | 320 | 25 | 2:00 |
| 4 | 500 | 25 | 2:00 |
| 5 | 1000 | 20 | 3:00 |
| 6 | 9 µm | 25 | 4:00 |
| 7 | 3 µm | 25 | 4:00 |
| 8 | 0.25 µm | 30 | 6:00 |
References
- Shirani, M.; Härkegård, G. Casting defects and fatigue behaviour of ductile cast iron for wind turbine components: A comprehensive study. Mater. Werkst. 2011, 42, 1059–1074. [Google Scholar] [CrossRef]
- Vaško, A. Evaluation of shape of graphite particles in cast irons by a shape factor. Mater. Today Proc. 2016, 3, 1199–1204. [Google Scholar] [CrossRef]
- Endo, M.; Matsuo, T. A practical method for fatigue limit prediction in ductile cast irons. Fatigue Fract. Eng. Mater. Struct. 2019, 211, 628. [Google Scholar] [CrossRef]
- European Committee for Standardization: DIN EN 1563: Founding—Spheroidal Graphite Cast Irons. 2012. Available online: www.perinorm.com (accessed on 5 January 2021).
- ISO: Spheroidal Graphite Cast Irons-Classification. ISO (ISO 1083:218(E)) (2018-04-00). Available online: www.perinorm.com (accessed on 5 January 2021).
- Čanžar, P.; Tonković, Z.; Kodvanj, J. Microstructure influence on fatigue behaviour of nodular cast iron. Mater. Sci. Eng. A 2012, 556, 88–99. [Google Scholar] [CrossRef]
- Palin-Luc, T.; Lasserre, S.; Berard, Y. Experimental investigation on the significance of the conventional endurance limit of a spheroidal graphite cast iron. Fatigue Fract. Eng. Mater. Struct. 1998, 21, 191–200. [Google Scholar] [CrossRef]
- Sujakhu, S.; Castagne, S.; Sakaguchi, M.; Kasvayee, K.A.; Ghassemali, E.; Jarfors, A.E.W.; Wang, W. On the fatigue damage micromechanisms in Si-solution-strengthened spheroidal graphite cast iron. Fatigue Fract. Eng. Mater. Struct. 2018, 41, 625–641. [Google Scholar] [CrossRef]
- Deutsches Institut für Normung e.V.: DIN EN 1563: Gießereiwesen—Gusseisen mit Kugelgraphit. 2012. Available online: www.perinorm.com (accessed on 5 January 2021).
- Borsato, T.; Berto, F.; Ferro, P.; Carollo, C. Influence of solidification defects on the fatigue behaviour of heavy-section silicon solution-strengthened ferritic ductile cast irons. Fatigue Fract. Eng. Mater. Struct. 2018, 41, 2231–2238. [Google Scholar] [CrossRef]
- Glavas, Z.; Strkalj, A.; Stojakovic, A. The Properties of Silicon alloyed ferritic ductile irons. Metalurgija 2016, 55, 293–296. [Google Scholar]
- Eiken, J.; Lacaze, J. Microsegregation build-up during solidification of nodular cast iron—Phase-field simulation versus experimental information. In Proceedings of the 5th Decennial International Conference on Solidification Processing, Old Windsor, UK, 25–28 July 2017. [Google Scholar]
- Franzen, D.; Weiß, P.; Pustal, B.; Bührig-Polaczek, A. Influence of aluminium on silicon microsegregation in solution strengthened ductile iron. J. Mater. Sci. Technol. 2019, 35, 687–694. [Google Scholar] [CrossRef]
- Weiß, P.; Tekavčič, A.; Bührig-Polaczek, A. Mechanistic approach to new design concepts for high silicon ductile iron. Mater. Sci. Eng. A 2018, 713, 67–74. [Google Scholar] [CrossRef]
- Riebisch, M.; Weiß, P.; Cremer, C.; Aboulkhair, I.; Bührig-Polaczek, A. Properties and microstructure of copper-alloyed solid solution-strengthened ductile iron. J. Mater. Sci. Technol. 2018, 34, 725–730. [Google Scholar] [CrossRef]
- Alhussein, A.; Risbet, M.; Bastien, A.; Chobaut, J.P.; Balloy, D.; Favergeon, J. Influence of silicon and addition elements on the mechanical behavior of ferritic ductile cast iron. Mater. Sci. Eng. A 2014, 605, 222–228. [Google Scholar] [CrossRef]
- Eiken, J.; Subasic, E.; Lacaze, J. 3D phase-field computations of microsegregation in nodular cast iron compared to experimental data and Calphad-based Scheil-prediction. Materialia 2020, 9, 100538. [Google Scholar] [CrossRef]
- Shayesteh-Zeraati, A.; Naser-Zoshki, H.; Kiani-Rashid, A.R.; Yousef-Sani, M.R. The effect of aluminium content on morphology, size, volume fraction, and number of graphite nodules in ductile cast iron. Proc. Inst. Mech. Eng. Part L J. Mater. Des. Appl. 2010, 224, 117–122. [Google Scholar] [CrossRef]
- Muhammad Muhmond, H.; Fredriksson, H. Graphite growth control analysis in high Al cast iron. Int. J. Cast Met. Res. 2016, 29, 272–278. [Google Scholar] [CrossRef]
- Soiński, M.S.; Jakubus, A. The Influence of Small Amounts of Aluminium on the Effectiveness of Cast Iron Spheroidization with Magnesium. Arch. Foundry Eng. 2013, 13, 80–83. [Google Scholar] [CrossRef]
- DIN Deutsches Institut für Normung e. V. Schwingfestigkeitsversuch—Durchführung und Auswertung von Zyklischen Versuchen Mit Konstanter Lastamplitude für Metallische Werkstoffproben und Bauteile; ICS 19.060; 77.040.10(DIN 50100:2016-12); Beuth GmbH: Berlin, Germany, 2016. [Google Scholar]
- Murakami, Y. Metal Fatigue Effects of Small Defects and Nonmetallic Inclusions/Yukitaka Murakami; Academic Press: Amsterdam, The Netherlands, 2019. [Google Scholar]
- DIN Deutsches Institut für Normung e. V. Microstructure of Cast Irons-Part 4: Test Method for Evaluating Nodularity in Spheroidal Graphite Cast Irons. Beuth GmbH (DIN ISO 945-4) (2019-05-00). Available online: www.perinorm.com (accessed on 5 January 2021).
- E04 Committee: Test Method for Determining Nodularity and Nodule Count. In Ductile Iron Using Image Analysis; ASTM International: West Conshohocken, PA, USA, 2016; Available online: https://www.astm.org/Standards/E2567.htm (accessed on 5 January 2021).
- Bourdie, J.; Bruneseaux, F.; Parseval, P.; de Gouy, S.; Laffont, L.; Lacaze, J. Effect of Cooling Rate and Aluminium Addition on Graphite Growth during Solidification and Graphitization. MSF 2018, 925, 20–27. [Google Scholar] [CrossRef]


Publisher’s Note: MDPI stays neutral with regard to jurisdictional claims in published maps and institutional affiliations. |
© 2021 by the authors. Licensee MDPI, Basel, Switzerland. This article is an open access article distributed under the terms and conditions of the Creative Commons Attribution (CC BY) license (http://creativecommons.org/licenses/by/4.0/).