Article

A Physical-Based Plane Stress Constitutive Model for High Strength AA7075 under Hot Forming Conditions

1
AVIC Manufacturing Technology, Beijing 100024, China
2
Department of Mechanical Engineering, Imperial College London, London SW7 2AZ, UK
3
Department of Mechanical Engineering, Dalian University of Technology, Dalian 116024, China
*
Author to whom correspondence should be addressed.
Metals 2021, 11(2), 314; https://doi.org/10.3390/met11020314
Submission received: 14 January 2021 / Revised: 5 February 2021 / Accepted: 8 February 2021 / Published: 11 February 2021
(This article belongs to the Special Issue Computational Modeling of Material Forming Processes)

Abstract

:
Physicallybased constitutive equations are increasingly used for finite element simulations of metal forming processes due to the robust capability of modelling of underlying microstructure evolutions. However, one of thelimitations of current models is the lack of practical validation using real microstructure data due to the difficulties in achieving statistically meaningful data at a sufficiently large microstructure scale. Particularly, dislocation density and grain size governing the hardening in sheet deformation are of vital importance and need to be precisely quantified. In this paper, a set of dislocation mechanics-based plane stress material model is constructed for hot forming aluminum alloy. This material model is applied to high strength 7075 aluminum alloy for the prediction of the flow behaviorsconditioned at 300–400 °C with various strain rates. Additionally, an electron backscatter diffraction (EBSD) technique was applied to examine the average grain size and geometrical necessary dislocation (GND) density evolutions, enabling both macro- and micro- characteristics to be successfully predicted. In addition, to simulate the experienced plane stress states in sheet metal forming, the calibrated model is further extended to a plane stress stateto accuratelypredict the forming limits under hot conditions.The comprehensively calibrated material model could be used for guidinga better selection of industrial processing parameters and designing process windows, taking into account both the formed shape as well as post formed microstructure and, hence, properties.

1. Introduction

High strength aluminum alloy panels have been widely used for transportation equipment structures due to the advantages of lightweight and satisfying strength performance [1]. These structures were difficult to be cold stamped restricted by the poor ductility and springback issue [2]. Alternatively, the desired geometry is obtained by cold stamping a few segments and welding into an integral one, which increases the cost and reduces the reliability due to the long welding seams [3]. Forming at elevated temperatures overcomes the above limitations and achieves the part consolidation [4]. A variety of processes under either warm or hot conditions have been proposed, such as warm forming [5], hot forming [6] and superplastic forming [7]. Unlike the elastic-plastic dominated cold stamping process, typical characteristics for elevated temperature forming are: (1) microstructure evolution is complex with the coupled effects of dislocation, recovery and dynamic recrystallization in some particular conditions on the hot flow and post properties [8]; (2) strain rate sensitive viscoplastic deformation becomes dominant [9]. The uniformity of deformation is highly dependent on the forming speed and temperature [10]. Therefore, the design of process and selection of process parameters for forming a complex-shaped component are challenging, requiring the aid of robust finite element (FE) simulations.
To achieve accurate and reliable FE simulations of elevated forming processes of high strength aluminum alloys, a robust material model, enabling to predict both the macro- and micro- properties is necessary. The commonly used phenomenological models, such as Johnson-Cook model [11], Fields–Backofen (FB) model and Arrhenius model [12], are unable to model the underlying microstructure evolutions [13]. Physical-based models, such as Crystal Plasticity models [14] and Internal-State-Variable (ISV) models [15], considering the underlying microstructure evolutions were developed. Among these physical-based models, the ISV model could be used to predict both the microstructures and deformations for industrial-scale parts. El Fakir et al. [16] proposed a set of constitutive equations of AA5754, and successfully predicted the deformation of scaled wing-stiffenercomponent under a novel hot stamping condition. Mohamed et al. [17] developed a continuum damage mechanics-based model of AA6082 to successfully achieve the prediction of damage evolutions. Xiao et al. [18] identified the dynamic recrystallization phenomenon during the hot straining of AA7075, and further incorporated recrystallization mechanism into his model, enabling a better description of the microstructure evolution in hot stamping aluminum alloys. However, all the above models were only validated by the macroscopic stress-strain behaviors, while the underlying microstructure evolutions are not validated, especially the dislocation density, which is the key microstructure for various forming processes at elevated temperatures. The lack of accurate quantification of microstructure evolutions leads to inaccurate microstructure outputs from the model, hence such model cannot be used for predicting the post-formed properties. On the other hand, the stress states of a sheet metal forming are bi-axial. The forming limits under either plane strain or equal biaxial state are lower than that under the uniaxial stress state. However, the above models were constructed based on the uniaxial tensile results without the consideration of plane stress states, which may not be accurate for prediction of the real sheet metal forming condition.
To address above limitations on the constitutive relations and describe both the flow stress curves and the evolved microstructures during warm and hot sheet metal forming at a relatively medium temperature range, in this study, we proposed a dislocation mechanics-based constitutive model to predict both the flows stress curves and the concurrent evolved microstructures under a direct heating forming condition [19]. Electron Back Scattering Diffraction (EBSD) technique was used to visualize the high temperature and high strain rate induced geometrical necessary dislocation (GND) distributions over a relatively large area (>3000 grains) in 7075 aluminum alloy, enabling the capture the statistical nature of GNDs and grain sizes in hot deformation. The model was further extended to plane stress states to provide a direct estimation of the hardening under practical sheet metal forming conditions.

2. Experimentation

2.1. Material

The as-received material was aluminum alloy sheet, 7075, provided by Constellium France. The thickness was 2 mm and the width was 1.2 m. The initial temper was in T6 condition(solution heat treated, water quenching and artificial ageing)with an average grain area of 960 µm2, as shown in Figure 1. The main chemical composition is given in Table 1.

2.2. Test Programme

2.2.1. Uniaxial Hot Tensile Test

Uniaxial hot tensile tests were conducted using Gleeble 3800 thermal mechanical simulator due to the robust function of programming temperature history and loading path. Dog-bone specimens were machined from the as-received rolled material, with the longitudinal direction in the rolling direction. The specimen design was consistent with the one in [20] and is given in Figure 2 for reference. The length and width of the parallel zone was 46 and 12 mm, respectively, to ensure a relatively large uniform temperature and deformation region (10 mm × 12 mm), which will be used for subsequent characterizations of the statistical microstructures.
A test scheme following the direct heating forming condition [19] was used in this study. Figure 3 illustrates the temperature-time profiles of hot uniaxial tensile tests to characterize the viscoplastic flow behaviors, and prepare specimens for microstructure observations under different strain levels. A series of hot tensile tests with different temperature and strain rates were performed. The temperatures used were 300 °C, 350 °C and 400 °C ranging from warm ( ~ 0.4 0.6   T m ) to hot ( > 0.6   T m ) forming conditions. Once the specimen was heated to the target temperature and soaked for 1 s, the material was uniaxially stretched at different strain rates, i.e., 0.1/s, 1/s and 5/s until failure(path ①). For each condition, at least three tests were performed to obtain reliable results.To characterize the evolutions of dislocation and grain size during deformation, interrupted tests (path ②) were conducted at identical temperatures and strain rates, stopped at true strain levels of ~0.1 and ~0.3 followed by quenching using the Gleeble water quenching module. The time before quenching was able to be controlled precisely by the Gleeble program of specimen temperature. These specimens were used for the EBSD characterization. The reliability and repeatability of the tests were ensured by comparing the stress-strain curves achieved at identical conditions while with various true strain levels.

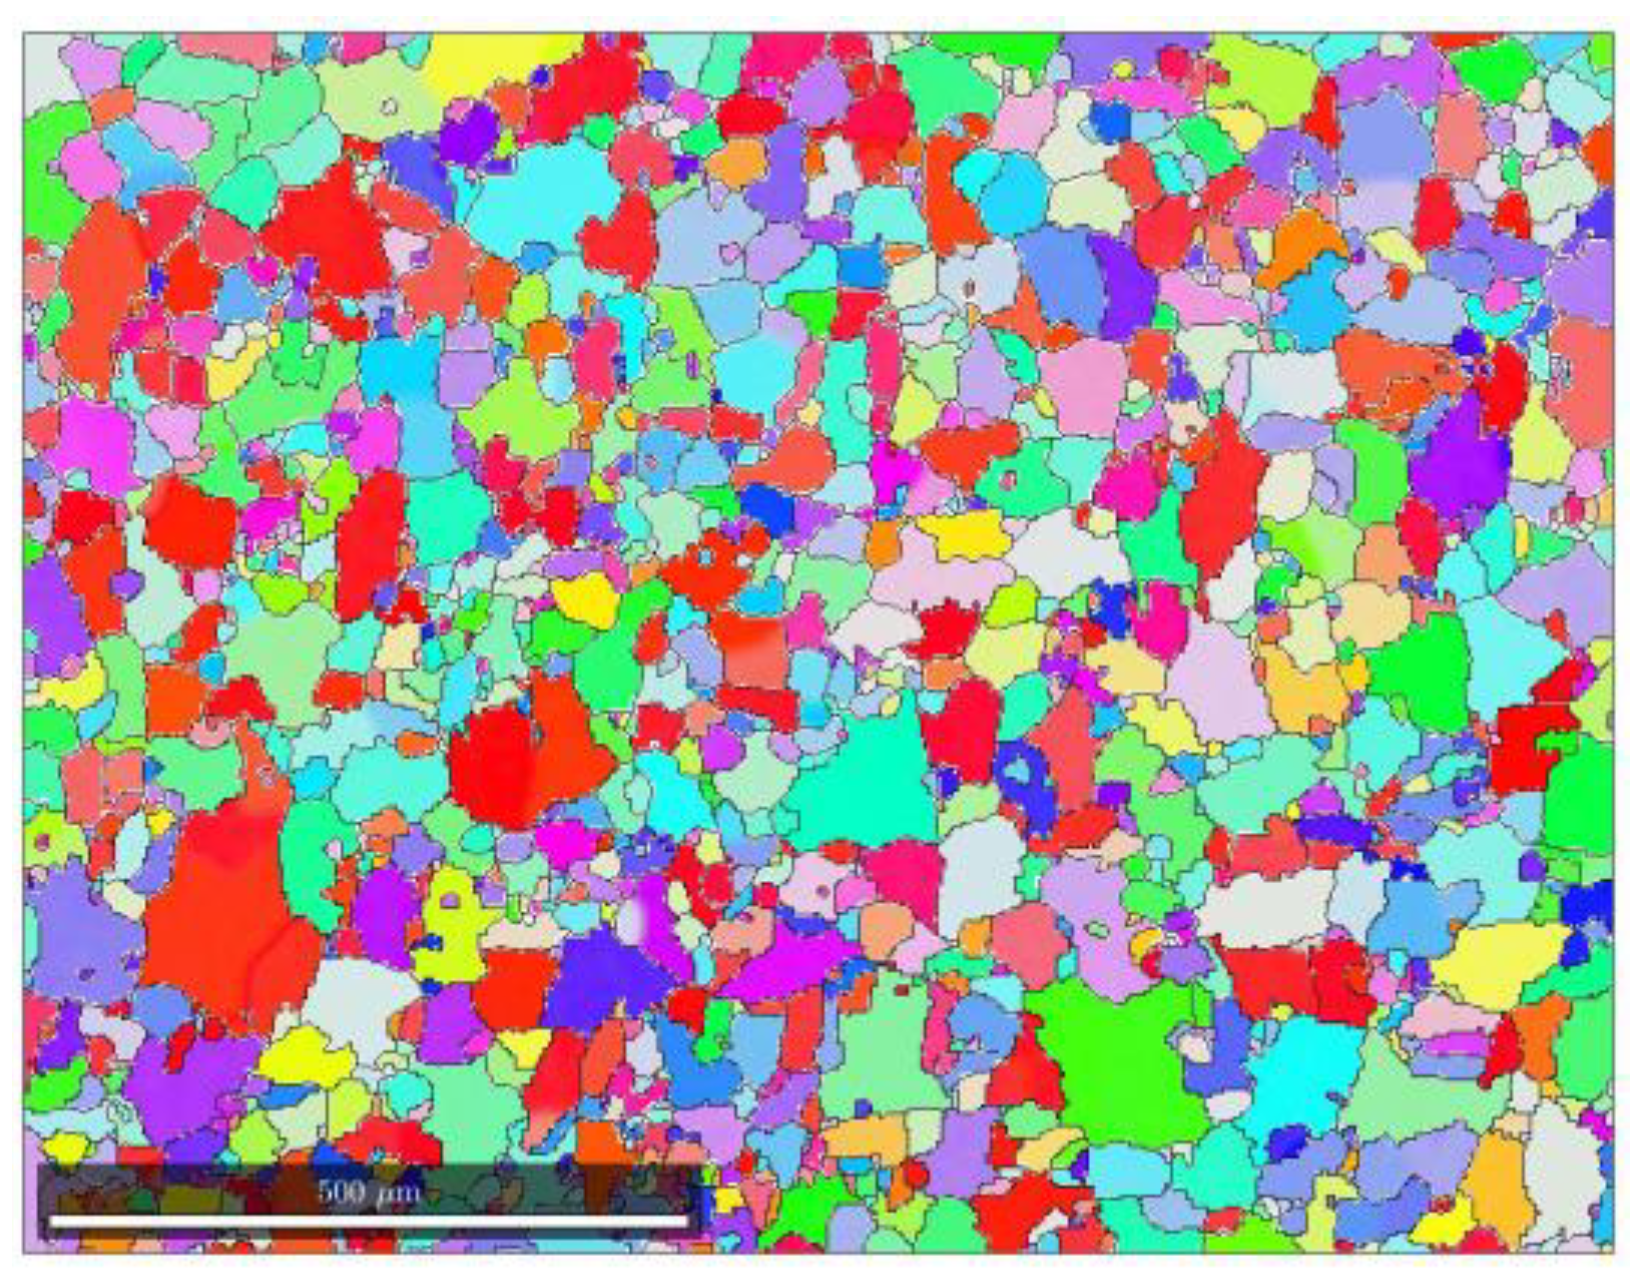
2.2.2. Microstructure Observation

EBSD characterization was performed on sub-sized squares cut from hot strained specimens from the center of the gauge zone, to estimate the GND densities and grain sizes. These squares were further grounded down using SiC papers, sequentially from 320 to 4000 grits. Subsequently, the grounded samples were OPS polished for 30 min using suspension diluted with H2O with a ratio of 1:5 to a mirror finish. The polished samples were further electrical polished at room temperature for 60 s at 20 V using 9.5 vol.% perchloric acid in ethanol. The EBSD analysis was conducted on a Hitachi SEM microscope with a Bruker e-Flash HR detector. To achieve a statistically representative dataset for the GND density, relatively large EBSD maps (i.e., 3017 µm × 1879 µm) were taken with a fixed step size of 3.2 µm. The GND density was estimated using MTex software. More detailed information about the mathematical framework can be found in [21].

3. Material Modelling

3.1. A Unified Dislocation Mechanics-Based Material Model

The internal state variable approach was used to establish a dislocation mechanics-based material model for cooperatively modelling macroscopic flow behavior and corresponding microstructure evolutions, i.e., dislocation density and grain size, in comparison to conventional phenomeonological models. All equations in the model were developed in their rate forms to represent the evolutionary nature of the related material properties during the sheet metal forming processes.

3.1.1. Viscoplasticity Law

A general accepted stress-strain behavior is expressed in Equation (1)
ε ˙ p = ( σ e R k K ) N
where ε ˙ p is the plastic strain rate, σ e is the effective stress, R is the hardening state variable related to dislocations, k is the elastic limit stress. K and N are coefficients.
This equation only considers the dislocation hardening effects on plastic behavior. However, a deformation at high temperatures may also lead to a grain size evolution due to the triggered recrystallization and grain growth. On the other hand, damage and voids may also be created during deformation at high temperatures, especially after necking [22]. Therefore, the equation describing the stress-strain behavior is modified to take in extra effects of grain size and damage and expressed as
ε ˙ p = A ε σ / ( 1 ω ) R k K n 1 ( d ¯ ) u
where ω is a damage related internal variable, varying from 0 to 1. d ¯ is normalized average grain size. The descriptions of ω and d ¯ are introduced in next sections. n 1 and u are material constants. A ε equals 1/s and is used to balance of unit of the equation between the left and right handside.

3.1.2. Modelling of Dislocation Density and Material Hardening

Dislocation is the core microstructure variable for sheet metal forming determining the flow stress level, hardening, and even the onset of dynamic recrystallization in some particular conditions. In this study, a normalized dislocation density is introduced by defining ρ ¯ = 1 ρ i / ρ , where ρ i is the initial dislocation density and ρ is the actual dislocation density in the deformed materials. With further considerations of recrystallization effect on dislocation densities, the normalized dislocation density is described in the following form:
ρ ¯ ˙ = A ( 1 ρ ¯ ) | ε ˙ p | C 1 ρ ¯ n 2 [ C 2 ρ ¯ / ( 1 S ) ] S ˙
where A , C 1 and C 2 are temperature dependent material constants, determining the magnitudes for each term. S and S ˙ represents the recrystallisation volume fraction and its rate of the deformed material. The first term represents the accumulation and dynamic recovery of the dislocation density. The second term represents the static dislocation recovery and the third term describes the consumption of dislocations due to recrystallization if occurs.
Physically, the strain hardening is governed by dislocation density. According to the classic dislocation theory of Kocks [23] given in Equation (4), the material flow stress at room temperature is represented in Equation (4).
σ ( ρ ) = σ 0 + α o μ b ρ = σ 0 + R
where σ 0 represents the initial stress of material, α o μ b ρ represents the hardening stress due to the dislocation accumulation after plastic deformation. α o is a constant at room temperature for cold deformation. μ is the material shear strength, b is the burger’s vector.In addition, at elevated temperatures, the hardening stress is updated to Equation (5) by introducing the temperature effect as given in Equation (6).   α ( T ) = s ( T ) α 0 , in the coefficient, where s is a temperature dependent constant to α o for high temperature conditions, and the effect of strain rate is neglected in this study.
R = α ( T ) μ b ρ
As can be known from the Equation, the premise of accurate validation of material is the precise quantitative characterization of dislocation, and calculation of the magnitude using Equation (5). To keep the consistency of equations, a mathematical derivation was performed on Equation (5) and the rate form after simplification is given as follows:
R ˙ = 0.5 B ρ ¯ 0.5 ρ ¯ ˙
where B is a temperature dependent material constant.

3.1.3. Modelling of Recrystallization Volume Fraction and Grain Size

Softening is a desired microstructure evolution for bulk forming processes, as the flow stress can be significantly reduced and the forming load becomes less. However, softening due to dynamic recrystallization is undesirable for sheet metal forming, which could result in the localized thinning. However, recrystallization may still take place when the dislocation density reaches a critical value at high temperatures. The occurrence of recrystallization will lead to grain boundary movements and creation of smaller grains at the expense of existing dislocations during the hot deformation [24,25,26], and may affect the viscoplastic behavior, especially at low strain rates. As a key influencing factor, the recrystallization volume fraction is taken as an internal state variable in the model and expressed as [27,28]:
S ˙ = q 1 ( 0.1 + S ) q 2 ( 1 S ) ρ ¯ 2 d ¯
where q 1 and q 2 are material constants. d ¯ is the normalized grain size equals to d / d 0 , with d the current grain size and d 0 the initial grain size. A critical dislocation density, ρ ¯ c , beyond which recrystallization occurs, is also introduced as a function ofplastic strain rate [29],
ρ ¯ c = q 3 ( ε ˙ p ) q 4
where q 3 and q 4 are material constants.
The evolution of normalized average grain size, d ¯ , takes the rate form:
d ¯ ˙ = w 1 d ¯ γ 1 + w 2 ε ˙ p d ¯ γ 2 w 3 S ˙ γ 3 ( d ¯ ) γ 4
where w 1 is a material constant relates to grain mobility and grain boundary energy density, w 2 and w 3 are material constants relates to the original average grain sizes. In addition, γ 1 , γ 2 , γ 3 and γ 4 are also material constants, where γ 3 and γ 4 are temperature dependent constants, and γ 1 and γ 2 are temperature independent constants.This equation enables a description of the completion between grain growth and grain refinement due to recrystallisation.

3.1.4. Modelling of Damage

At a forming temperature higher than 0.4 T m and a strain rate of 0.1–1/s, plasticity induced damage may occur around inclusions and hard particles. The damage includes void nucleation and growth around particles, either at grain boundaries or within grains. Theoretically, the damage is a function of the flow stress and the plastic strain rate, where higher strain rates and higher flow stress result in more micro-cracks. Hence, the damage is expressed as:
ω ˙ = η 1 f ( ω ) σ ε ˙ p
where η 1 is a temperature-dependent material constant, f ( ω ) is the damage related parameter, σ is the flow stress and ε ˙ p is the plastic strain rate.
A damage model based on continuum damage mechanism and high temperature creep damage model [30,31] is used with a factor ω representing the damage is introduced. The factor is defined as the area fraction of damaged material, therefore, the value of ω lies in a range from 0 to 1. A value of ω 1 D = 0 means the material is undamaged, while a value of ω 1 D = 1 represents a completely disintegrated material, which is practically impossible. The rate form of such a damage factor is given as follows:
ω ˙ 1 D = η 1 σ ε ˙ p η 2 ( 1 ω 1 D ) η 3
where η 2 and η 3 are material constants.

3.2. Extension to Plane Stress State

Using the plastic flow rule for isotropic hardening, the stress–strain relationship under multi-axial states could be described as:
ε ˙ i j p = 3 2 ( S i j σ e ) ε ˙ e p
where ε i j p is the plastic strain tensor, S i j the deviatoric stress tensor. For uniaxial case, σ e equals to the flow stress, σ , ε e p equals to the applied plastic strain, ε p . Therefore, substituting Equation(2) into Equation (12) yields.
ε ˙ i j p = 3 2 ( S i j σ e ) A ε σ e / ( 1 ω ) R k K n 1 ( d ¯ ) u
Lin et al. (2014) established a multiaxial damage equation based on the uniaxial form considering the multiaxial stress-state effect [32].
ω ˙ 2 D = ( α 1 + α 2 + α 3 ) φ α 1 σ 1 + 3 α 2 σ H + α 3 σ e σ e φ ω ˙ 1 D
where α 1 , α 2 , α 3 ,   and φ are material constants. σ 1 is the maximum principal stress and σ H is the hydrostatic stress.
The 1D Hooke law σ = E ( ε T ε p ) is extended to a full tensor type taking into account the damaging effect on the stress.
σ i j = ( 1 ω ) D i j k l ( ε i j ε i j p )
where D i j k l is the elastic matrix of the material.

3.3. Plane Stress Dislocation Mechanics-Dominant Constitutive Model

The complete set of plane stress dislocation mechanics-dominant model is summarized in Table 2, and the corresponding temperature dependent material constants are given in Table 3.Note that the general accepted Arrhenius relations was used in this work to capture the temperature effects on the temperature-dependent constants. The pre-constants, such as K 0 , k 0 , u 0 , etc. in Table 3, are pre-exponential rate factors to enable temperature effects to be successfully described.

4. Microstructure Examination Results

In this section, EBSD images were provided for samples under typical hot deformation conditions to quantify the statistically meaning average grain size and the resolved geometrical necessary dislocation (GND), which are used as fitting data for the material model. Various techniques, such as transmission electron microscopy (TEM), pitting, and X-ray, could be used to examine the dislocation densities. However, TEM technique is prohibitive for a statistical study due to extremely small observation area. X-ray technique is lacking visualization of the dislocation structures. EBSD resolved GND distributions could provide both statistically meaningful average GND values under different conditions with distinguishable structures, and are increasingly used for metal forming field [33].
Figure 4 shows the EBSD observations of specimens directly after heating before deformation to provide initial microstructure data for the material. Compared to the as-received grain size in Figure 1, the grain sizes after heating are similar, all having an average grain area of ~ 1000 μ m 2 , indicating negligible grain growth during heating. The resolved average GND densities are also similar and stay low in value, all round 5 × 10 11 / m 2 . These grain sizes and GND values are used as the initial values for the material model.
Figure 5 shows the microstructures of the samples after deformation at 300 °C, 350 °C and 400 °C to a true strain of 0.3. In general, the average grain sizes of the deformed samples are slightly smaller than that of the original grains. The hot forming temperatures in this study are above the recrystallisation temperature, hence, dynamic recrystallisation may occur during deformation. Xiao et al. [18] and Fan et al. [34] have found recrystallization occurred under different hot forming conditions for high strength aluminium alloys. Though it is not apparent to visually distinguish these smaller grain size, the statistical calculation using MTEX shows that the average grain size for 450 °C is 31 μ m , which is smaller than that for 300 °C (37 μ m ). The presence of small grain sizes indicates the occurrence of dynamic recrystallization during deformation, and the calculated average grain size and area are used for model calibration.
The GND distributions are resolved from the EBSD maps and given in Figure 5d–f. Higher temperature results in lower GND densities, where the average GND density reduced from 5.9 × 10 13 / m 2 to 3.8 × 10 13 / m 2 when the deformation temperature increased from 300 °C to 400 °C. Existing research [33,35,36] showed that GND density evolutions could representatively describe the total dislocation density evolutions using appropriate fitting parameters. The microstructural internal state variable in the proposed model is the normalized dislocation density trends. After normalization, the trends estimated from the GND density are expected to be similar to that from the total dislocation density. Hence, these quantitative GND densities are normalized by their initial values and used for model calibration.

5. Results of Material Model Prediction

5.1. Determination of Material Model Constants

Using the quantified grain size, GNDs and the experimental macroscopic stress-strain curves, the material constants are determined for the proposed physical-based constitutive equations and list in Table 4. The unit for each parameter is also provided to ensure the consistency of unit for equations mathematically. The calculation of model parameters was performed using trial and error preliminarily, with an evolutionary algorithm (EA)-based optimization. Comparisons of the microstructures between experimental and computed results are given in Figure 6.
Figure 6a compares the experimental and computed evolutions of the average grain areas, A d . Note that the experimental average grain area is extracted from the EBSD maps. The computed grain area is calculated by A d = 1 4 π ( d ¯ · d 0 ) 2 , where A d is the grain area, d ¯ is the predicted normalised grain size in Equation (18), d o is the initial average grain size from Figure 1, assuming the grains are approximate to circular shapes. Acceptable predictions are achieved, where the average grain area reduces during deformation and drops faster at a higher deformation temperature. The normalized dislocation density evolutions are also well predicted in Figure 6b, where lower deformation temperatures result in a higher presence of dislocation densities.

5.2. Hot Flow Behavior

Figure 7 shows the comparisons of hot flow behavior between model predictions (solid lines) and experimental results (symbols) under uniaxial tensile stress. Excellent agreements were found with softening (recrystallisation and damage) and hardening (dislocation accumulation) of the stress-strain curves at different temperatures (i.e., Figure 7a), though slight differences are observed in the strain to failure levels. The slight differences in the strain to failure can be ignored. Firstly, measurement error exists when using C-gauge in the Gleeble for achieving the material strain to failure level. Secondly, accurate description of the strain to failure level is not necessary as normally straining in sheet metal forming is much smaller than the strain to failure. Considering the objective of this paper is to investigate the hardening and flow stress, such fitting results are considered acceptable. To further test the robustness of the developed material model, Figure 7b shows the comparisons at a broader strain rate range, from 0.1 s−1 to 5 s−1, for the temperature of 400 °C. Generally, the flow stress levels can be predicted. There exist greater differences for the slower strain rate. A temperature of 350 °C is approaching the nose temperature (most sensitive) for AA7075 and a longer soaking time (smaller strain rate) at this temperature may fast lead to coarsening of the precipitates. Micro-cracks and damage are more likely to occur around these hard particles, resulting in a softening behavior macroscopically. The enlarged difference at lower strain rate suggests future model to consider the effects of precipitations, which is neglected for simplicity of study, as the objective of this study is to evaluate the feasibility of investigating hardening using a characterized material model.
For sheet metal forming, it is inaccurate to use one-dimensional uniaxial data to reflect material flow behavior. The material normally experiences the plane stress state with the stress in the thickness direction approximate to zero ( σ t 0 ). Using the extended plane stress equations calibrated by the FLC data in the literature [37], Figure 8 shows the comparisons between model fitting from this study (solid lines) and typical experimental results (symbols). Good agreements were observed between experiments and computational results. In general, the limit strain increases with increasing the forming temperature and decreasing the strain rate, which is consistent with the forming limit of aluminum alloys at elevated temperatures determined through the cruciform specimen [38]. It should be noted that, to date, there still lacks a standard of quantifying the necking strains at hot forming conditions. However, the current forming limits still can provide reasonable predictions and are used to preliminarily investigate the strain and strain rate hardening behaviors.

5.3. Comparisons with Phenomeonlogical Models

Phenomenological models are widely to model constitutive relationships. In this section, two typical phenomenological models (i.e.,FB model and its improved version) are used to simulate the uniaxial stress-strain curves and compare with the developed physical mechanism-based model in this work. The FB model is given in Equation (16). An intrinsic disadvantage of this model is the lack of capability to model the softening behavior.
σ = K p ε n ε ˙ m
To address this limitation, an improved Field–Backofen model with consideration of material softening is developed Equation (17) [39]. For this model, the n and m values are numerically fitted using Equations (18) and (19)
σ = K p ε n ε ˙ m e x p ( b p T + s ε )
n = k 1 + A p l n ε ˙ + B p T
m = 1.08898 602.77 T
The material constants used in these two models are determined from the best fittings of the flow stress curves and provided in Table 5 and Table 6, respectively.
Figure 9 shows the comparisons of stress–strain curves between the experiments and phenomenological fittings. As indicated by the dash lines (FB model), the FBphenomenological model is only capable of predicting the hardening, where stress increases with proceeding deformations, while the softening phenomenon cannot be predicted. There are two disadvantages of the FB model: (1)only one set of n and m values could be used for one deformation condition, while n and m may change during the deformation. Hence, only the early stages of deformation could be well predicted. (2) this model requires different set of n and m values for the corresponding deformation conditions, making the fitting inefficient.
The predicted stress-strain curves using the improved FB model is shown as solid lines. The overall prediction is much better. However, the initial hardening stage is not well predicted as the n value is an overall numerical fitting for various conditions, which is not as accurate as individual fittings from the FB model. Comparing both phenomenological models to the physicallybased model in this work, though the improved FE model achieved a relatively well prediction of the stress-strain curves, the key disadvantage of the phenomenological models it the lack of mechanism-based meanings and the incapability of predicting the microstructures, which are also extremely important for property control of the formed parts.
Finally, the prediction accuracy of the proposed physical based plane stress model and the phenomenological models used are compared using the Equations (20) and (21). The calculated AASE and R-value of the comparison are listed in Table 7, which indicates a good numerical prediction accuracy of the developed models.
R =   i = 1 N ( σ E σ ¯ E ) ( σ P σ ¯ P )   i = 1 N ( σ E σ ¯ E ) 2   i = 1 N ( σ P σ ¯ P ) 2
A A R E ( % ) = 1 N i = 1 N | σ E σ P σ E | × 100 %
where σ E is experimental stress, σ P is predictable stress, σ ¯ E is the mean of experimentalstress, σ ¯ P is the mean of predictable stress and N is the number of data. Correlation coefficient R represents the linear relationship between experimental stress and predictable stress. The closer R is to 1, the more accurate the prediction of stress is. Furthermore, absolute value of the average error AARE is a statistical parameter, the smaller AARE is, the smaller the error of predicting stress is.

6. Conclusions

A set of physically based constitutive model is constructed to describe both the viscoplastic behavior and the concurrent evolved microstructures of high strength 7075 during deformation at high temperatures with various strain rates. The main delivery of this work includes:
EBSD technique was employed to visualize both the statistically meaningful grain sizes and the GND density evolutions during deformation. These microstructural data were for the first time used for model calibration, enabling reasonable descriptions of microstructure changes. Such a calibrated model could provide both reliable stress-strain relations and the microstructure outputs, which are useful for shape and property control of the metal forming parts.
The extended model application under plane stress conditions also provides acceptable forming limit curves and agree well with experiments, indicating its effectiveness in predicting forming limit diagram for the metal forming application cases. Higher forming temperatures and lower forming speed enable broader forming limits for 7075.
Compared with the traditional phenomenal models, the physicallybased model in this work show advantages in describingboth the material flow behavior and the microstructure evolutions. FB model could not predict the softening behavior during deformation, while its improved version gives much better prediction in terms of stress-strain curves.To ease the use of the proposed model in metal formingfield, future workto reduce the number of material constants, retaining its function for both material flow and microstructure prediction, would be a good direction.

Author Contributions

The research in this paper was performed as a collaboration between all the authors. F.C., J.-H.Z. and K.Z. designed the project and research theme, provided scientific guides and discussions. K.Z. and Y.H. performed the hot tensile tests. W.W. and H.Q. performed the microstructure observations. F.C., J.-H.Z., S.Q. and K.Z. wrote the manuscript. All authors analyzed results and established the material model. All authors have read and agreed to the published version of the manuscript.

Funding

The research in this paper was funded by the European Union’s Horizon 2020 research and innovation programme under Grant Agreement No. 723517 as part of the project “Low Cost Materials Processing Technologies for Mass Production of Lightweight Vehicles (LoCoMaTech)”, as well as the funding by National Natural Science Foundation of China (NSFC) (No. 5200052525).

Informed Consent Statement

Informed consent was obtained from all subjects involved in the study.

Data Availability Statement

The raw/processed data required to reproduce these findings cannot be shared at this time as the data also forms part of an ongoing study.

Acknowledgments

The authors would like to express sincere thanks to Fenggong Lv from Avic Manufacturing Technology Institute on the great support for the microstructure observation in this study.

Conflicts of Interest

The authors declare no conflict of interest.

References

  1. Zheng, K.; Politis, D.J.; Wang, L.; Lin, J. A review on forming techniques for manufacturing lightweight complex—shaped aluminium panel components. Int. J. Light. Mater. Manuf. 2018, 1, 55–80. [Google Scholar] [CrossRef]
  2. Wang, A.; Zhong, K.; El Fakir, O.; Liu, J.; Sun, C.; Wang, L.-L.; Lin, J.; Dean, T.A. Springback analysis of AA5754 after hot stamping: Experiments and FE modelling. Int. J. Adv. Manuf. Technol. 2017, 89, 1339–1352. [Google Scholar] [CrossRef] [Green Version]
  3. Yuan, S. Fundamentals and Processes of Fluid Pressure Forming Technology for Complex Thin-Walled Components. Engineering 2020. [Google Scholar] [CrossRef]
  4. Zheng, K.; Dong, Y.; Zheng, D.; Lin, J.; Dean, T.A. An experimental investigation on the deformation and post-formed strength of heat-treatable aluminium alloys using different elevated temperature forming processes. J. Mater. Process. Technol. 2019, 268, 87–96. [Google Scholar] [CrossRef]
  5. Toros, S.; Ozturk, F.; Kacar, I. Review of warm forming of aluminum-magnesium alloys. J. Mater. Process. Technol. 2008, 207, 1–12. [Google Scholar] [CrossRef]
  6. Bariani, P.F.; Bruschi, S.; Ghiotti, A.; Michieletto, F. Hot stamping of AA5083 aluminium alloy sheets. CIRP Ann.Manuf. Technol. 2013, 62, 251–254. [Google Scholar] [CrossRef]
  7. Smolej, A.; Gnamuš, M.; Slaček, E. The influence of the thermomechanical processing and forming parameters on superplastic behaviour of the 7475 aluminium alloy. J. Mater. Process. Technol. 2001, 118, 397–402. [Google Scholar] [CrossRef]
  8. Sellars, C.; Zhu, Q. Microstructural modelling of aluminium alloys during thermomechanical processing. Mater. Sci. Eng. A 2000, 280, 1–7. [Google Scholar] [CrossRef]
  9. Salvado, F.C.; Teixeira-Dias, F.; Walley, S.M.; Lea, L.J.; Cardoso, J.B. A review on the strain rate dependency of the dynamic viscoplastic response of FCC metals. Prog. Mater. Sci. 2017, 88, 186–231. [Google Scholar] [CrossRef] [Green Version]
  10. Zheng, K.; Politis, D.J.; Lin, J.; Dean, T.A. An experimental and numerical investigation of the effect of macro-textured tool surfaces in hot stamping. Int. J. Mater. Form. 2017, 10, 241–254. [Google Scholar] [CrossRef] [Green Version]
  11. Lin, Y.C.; Chen, X.-M.; Liu, G. A modified Johnson–Cook model for tensile behaviors of typical high-strength alloy steel. Mater. Sci. Eng. A 2010, 527, 6980–6986. [Google Scholar] [CrossRef]
  12. He, A.; Xie, G.; Zhang, H.; Wang, X. A comparative study on Johnson–Cook, modified Johnson–Cook and Arrhenius-type constitutive models to predict the high temperature flow stress in 20CrMo alloy steel. Mater. Des. 2013, 52, 677–685. [Google Scholar] [CrossRef]
  13. Lin, Y.C.; Chen, X.-M. A critical review of experimental results and constitutive descriptions for metals and alloys in hot working. Mater. Des. 2011, 32, 1733–1759. [Google Scholar] [CrossRef]
  14. Zhang, M.; Zhang, J.; McDowell, D.L. Microstructure-based crystal plasticity modeling of cyclic deformation of Ti–6Al–4V. Int. J. Plast. 2007, 23, 1328–1348. [Google Scholar] [CrossRef]
  15. Sun, Z.C.; Wu, H.L.; Cao, J.; Yin, Z.K. Modeling of continuous dynamic recrystallization of Al-Zn-Cu-Mg alloy during hot deformation based on the internal-state-variable (ISV) method. Int. J. Plast. 2018, 106, 73–87. [Google Scholar] [CrossRef]
  16. El Fakir, O.; Wang, L.; Balint, D.; Dear, J.P.; Lin, J.; Dean, T.A. Numerical study of the solution heat treatment, forming, and in-die quenching (HFQ) process on AA5754. Int. J. Mach. Tools Manuf. 2014, 87, 39–48. [Google Scholar] [CrossRef] [Green Version]
  17. Mohamed, M.S.; Foster, A.D.; Lin, J.; Balint, D.S.; Dean, T.A. Investigation of deformation and failure features in hot stamping of AA6082: Experimentation and modelling. Int. J. Mach. Tools Manuf. 2011, 53, 27–38. [Google Scholar] [CrossRef]
  18. Xiao, W.; Wang, B.; Wu, Y.; Yang, X. Constitutive modeling of flow behavior and microstructure evolution of AA7075 in hot tensile deformation. Mater. Sci. Eng. A 2018, 712, 704–713. [Google Scholar] [CrossRef]
  19. Zheng, K.; Zhu, L.; Lin, J.; Dean, T.A.; Li, N. An experimental investigation of the drawability of AA6082 sheet under different elevated temperature forming processes. J. Mater. Process. Technol. 2019, 273, 116225. [Google Scholar] [CrossRef]
  20. Zheng, K.; Li, Y.; Yang, S.; Fu, K.; Zheng, J.; He, Z.; Yuan, S. Investigation and Modeling of the Preheating Effects on Precipitation and Hot Flow Behavior for Forming High Strength AA7075 at Elevated Temperatures. J. Manuf. Mater. Process. 2020, 4, 76. [Google Scholar] [CrossRef]
  21. Pantleon, W. Resolving the geometrically necessary dislocation content by conventional electron backscattering diffraction. Scr. Mater. 2008, 58, 994–997. [Google Scholar] [CrossRef]
  22. Lin, J.; Liu, Y.; Dean, T.A. A Review on Damage Mechanisms, Models and Calibration Methods under Various Deformation Conditions. Int. J. Damage Mech. 2005, 14, 299–319. [Google Scholar] [CrossRef]
  23. Kocks, U.F. A statistical theory of flow stress and work-hardening. Philos. Mag. 1966, 13, 541–566. [Google Scholar] [CrossRef]
  24. Sakai, T.; Jonas, J.J. Overview no. 35 Dynamic recrystallization: Mechanical and microstructural considerations. Acta Metall. 1984, 32, 189–209. [Google Scholar] [CrossRef]
  25. Sandström, R.; Lagneborg, R. A model for hot working occurring by recrystallization. Acta Metall. 1975, 23, 387–398. [Google Scholar] [CrossRef]
  26. Humphreys, F.J.; Prangnell, P.B.; Bowen, J.R.; Gholinia, A.; Harris, C. Developing stable fine–grain microstructures by large strain deformation. Philos. Trans. R. Soc. Lond. Ser. A Math. Phys. Eng. Sci. 1999, 357, 1663–1681. [Google Scholar] [CrossRef]
  27. Roucoules, C.; Pietrzyk, M.; Hodgson, P. Analysis of work hardening and recrystallization during the hot working of steel using a statistically based internal variable model. Mater. Sci. Eng. A 2003, 339, 1–9. [Google Scholar] [CrossRef]
  28. Alabort, E.; Putman, D.; Reed, R.C. Superplasticity in Ti-6Al-4V: Characterisation, modelling and applications. Acta Mater. 2015, 95, 428–442. [Google Scholar] [CrossRef] [Green Version]
  29. Roberts, W.; Ahlblom, B. A nucleation criterion for dynamic recrystallization during hot working. Acta Metall. 1978, 26, 801–813. [Google Scholar] [CrossRef]
  30. Li, N.; Sun, C.; Guo, N.; Mohamed, M.; Lin, J.; Matsumoto, T.; Liu, C. Experimental investigation of boron steel at hot stamping conditions. J. Mater. Process. Technol. 2016, 228, 2–10. [Google Scholar] [CrossRef] [Green Version]
  31. Lin, J.; Mohamed, M.; Balint, D.; Dean, T.A. The development of continuum damage mechanics-based theories for predicting forming limit diagrams for hot stamping applications. Int. J. Damage Mech. 2014, 23, 684–701. [Google Scholar] [CrossRef]
  32. Hayhurst, D.R. Creep rupture under multi-axial states of stress. J. Mech. Phys. Solids 1972, 20, 381–382. [Google Scholar] [CrossRef]
  33. Jiang, J.; Britton, T.B.; Wilkinson, A.J. Evolution of dislocation density distributions in copper during tensile deformation. Acta Mater. 2013, 61, 7227–7239. [Google Scholar] [CrossRef]
  34. Fan, X.; He, Z.; Lin, P.; Yuan, S. Microstructure, texture and hardness of Al–Cu–Li alloy sheet during hot gas forming with integrated heat treatment. Mater. Des. 2016, 94, 449–456. [Google Scholar] [CrossRef]
  35. Jiang, J.; Britton, T.B.; Wilkinson, A.J. Measurement of geometrically necessary dislocation density with high resolution electron backscatter diffraction: Effects of detector binning and step size. Ultramicroscopy 2013, 125, 1–9. [Google Scholar] [CrossRef] [PubMed]
  36. Jiang, J.; Ben Britton, T.; Wilkinson, A.J. The orientation and strain dependence of dislocation structure evolution in monotonically deformed polycrystalline copper. Int. J. Plast. 2015, 69, 102–117. [Google Scholar] [CrossRef] [Green Version]
  37. Wang, N.; Ilinich, A.; Chen, M.; Luckey, G.; D’Amours, G. A comparison study on forming limit prediction methods for hot stamping of 7075 aluminum sheet. Int. J. Mech. Sci. 2019, 151, 444–460. [Google Scholar] [CrossRef]
  38. Shao, Z.; Li, N.; Lin, J.; Dean, T. Formability evaluation for sheet metals under hot stamping conditions by a novel biaxial testing system and a new materials model. Int. J. Mech. Sci. 2017, 120, 149–158. [Google Scholar] [CrossRef]
  39. Cheng, Y.Q.; Zhang, H.; Chen, Z.H.; Xian, K.F. Flow stress equation of AZ31 magnesium alloy sheet during warm tensile deformation. J. Mater. Process. Technol. 2008, 208, 29–34. [Google Scholar] [CrossRef]
Figure 1. EBSD morphology of as-received aluminium alloy 7075.
Metals 11 00314 g001
Figure 2. Hot uniaxial tensile test specimen (all dimensions are in mm) [20].
Metals 11 00314 g002
Figure 3. Test procedures of ① hot tensile test until failure and ② interrupted test under differenttest conditions.
Metals 11 00314 g003
Figure 4. EBSD IPFX images for samples heated to different temperatures: (a) 300 °C, (b) 350 °C and (c) 400 °C at a heating rate of 1 °C/s before deformation.
Metals 11 00314 g004
Figure 5. EBSD IPFX images for samples hot deformed to a true strain level of 0.3 at (a) 300 °C, (b) 350 °C and (c) 400 °C and the corresponding GND maps (df). The strain rate is 1/s.
Metals 11 00314 g005
Figure 6. Comparisons between experimental and CDM model computed results at various deformation temperatures with a strain rate of 1/s: (a) average grain area evolution, and (b) normalized dislocation evolutions. Solid symbols represent experimental results and solid lines represent numerical fittings.
Metals 11 00314 g006
Figure 7. Comparisons of hot flow results under uniaxial stress state between experimentation and model computations results at various deformation conditions: (a) temperature effect, (b) strain rate effect. Solid symbols represent experimental results and solid lines represent numerical fittings.
Metals 11 00314 g007
Figure 8. Comparisons of the forming limit curves (FLCs) between experimental results and 2D CDM model fittings.Solid symbols represent experimental results and solid lines represent numerical fittings.
Metals 11 00314 g008
Figure 9. Comparisons of stress-strain relationships between the experiments and phenomenological fittings at (a) 350 °C and (b) 400 °C with various strain rates. Model 1 represents the classic FB model, and Model 2 represents the improved FB model.
Metals 11 00314 g009
Table 1. Main chemical composition (in wt%) of aluminium alloy 7075.
ZnMgCuSiFeMnCrTiAl
5.1–6.12.1–2.91.2–2.00.40.50.30.18–0.280.2Remain
Table 2. The equation set of material model.
Uniaxial Equations
ε ˙ p = A ε σ / ( 1 ω ) R k K n 1 ( d ¯ ) u
R ˙ = 0.5 B ρ ¯ 0.5 ρ ¯ ˙
ρ ¯ ˙ = A ( 1 ρ ¯ ) | ε ˙ p | C 1 ρ ¯ n 2 [ C 2 ρ ¯ / ( 1 S ) ] S ˙
S ˙ = q 1 ( 0.1 + S ) q 2 ( 1 S ) ρ ¯ 2 d ¯
ρ ¯ c = q 3 ε ˙ q 4
d ¯ ˙ = w 1 d ¯ γ 1 + w 2 ε ˙ p d ¯ γ 2 w 3 S ˙ γ 3 ( d ¯ ) γ 4
ω ˙ 1 D = η 1 σ ε ˙ p η 2 ( 1 ω 1 D ) η 3
Plane Stress Extension
ε ˙ i j p = 3 2 ( S i j σ e ) ε ˙ e p
ω ˙ 2 D = ( α 1 + α 2 + α 3 ) φ α 1 σ 1 + 3 α 2 σ H + α 3 σ e σ e φ ω ˙ 1 D
σ i j = ( 1 ω ) D i j k l ( ε i j ε i j p )
Table 3. The equation set of temperature-dependent material constants.
k = k 0 e x p ( Q k R g T ) K = K 0 e x p ( Q K R g T ) u = u 0 e x p ( Q K R g T )
A = A 0 e x p ( Q A R g T ) B = B 0 e x p ( Q B R g T ) C 1 = C 10 e x p ( Q C 1 R g T )
C 2 = C 20 e x p ( Q C 2 R g T ) w 1 = w 10 e x p ( Q w 1 R g T ) w 2 = w 20 e x p ( Q w 2 R g T )
w 3 = w 30 e x p ( Q w 3 R g T ) γ 3 = γ 30 e x p ( Q γ 3 R g T ) γ 4 = γ 40 e x p ( Q γ 4 R g T )
q 1 = q 10 e x p ( Q q 1 R g T ) q 2 = q 20 e x p ( Q q 2 R g T ) q 3 = q 30 e x p ( Q q 3 R g T )
q 4 = q 40 e x p ( Q q 4 R g T ) E = E 0 e x p ( Q E R g T ) η 1 = η 10 e x p ( Q η 1 R g T )
η 2 = η 20 e x p ( Q η 2 R g T ) n 1 = n 10 e x p ( Q n 1 R g T ) -
Table 4. The determined material constants for the dislocation mechanics-dominant model.
ParametersValuesParametersValuesParametersValues
K 0 (MPa) 0.9765 k 0 (MPa) 0.07735 B 0 (MPa)0.2501
Q K (J/mol)2.347 × 104 Q k (J/mol)2.98 × 104 Q B (J/mol)2.2 × 104
A 0 (-)0.02059 C 20 (-) 267.2 E 0 (MPa) 414.2
Q A (J/mol)2.336 × 104 Q C 20 (J/mol)4.38 × 104 Q E (J/mol)1.25 × 104
η 10 (-) 0.001786 η 20 (-) 2.024 w 10 ( s 1 )1.31 × 10⁻⁴
Q η 1 (J/mol)2.046 × 104 Q η 2 (J/mol)3243 Q w 1 (J/mol)3490
w 30 (-) 4450 A ε ( s 1 ) 1 Q γ 3 (J/mol)1.38 × 104
Q w 3 ( J / mol ) 6795 γ 30 (-)0.08028 γ 40 (-)0.04528
Q u (J/mol)1.51 × 104 Q q 1 (J/mol)3.493 × 104 Q q 2 (J/mol) 30.93
q 10 ( s 1 )1.14 × 10⁴ q 20 (-)0.0497 q 30 (s)5.72 × 10⁻⁹
Q q 4 (J/mol)7.5 × 104 γ 1 (-) 3.073126 n 2 (-) 18
η 3 (-)20 γ 2 (-)2.088153 d 0 ( μ m )35
α 2 (-) 0.8 φ (-)6 α 3 (-)10
C 10 ( s 1 )800.49 Q w 2 (J/mol)5.0 × 104 Δ (-) 0.65
Q C 10 (J/mol)1.003 × 105 Q γ 4 (J/mol)2.18 × 104 α 1 (-)7.5
n 10 (-) 0.002466 u 0 (-)0.03086w20 (-) 0.3293
Q n 1 (J/mol)4.241 × 104 Q q 3 (J/mol)7.915 × 104 q 40 (-)2.08 × 10⁻⁷
Table 5. The determined n and m values for the FB phenomenological model.
n Value
Conditions ε ˙ =   0.1/s ε ˙ =   1/s ε ˙ =   5/s
350 °C0.013260.023820.5837
400 °C0.06820.014550.06062
mValue
Conditions ε =   0.1 ε =   0.2 ε =   0.3
350 °C0.094120.104170.11041
400 °C0.201780.191810.18821
Table 6. The determined material constants for the modified FB phenomenological model.
K p b p s
1015.67−0.00325−0.44101
k 1 A p B p
1.602760.00478−980.35
Table 7. The calculated AASE and R-value.
ModelRAARE
Physical plane-stress Model of Figure 7a0.980560.03081
Physical plane-stress Model of Figure 7b0.93060.07918
Phenomenological Model 10.966130.05652
Phenomenological Model 20.98160.03944
Publisher’s Note: MDPI stays neutral with regard to jurisdictional claims in published maps and institutional affiliations.

