Article

Effect of Processing Parameters on Mechanical Properties of Deformed and Partitioned (D&P) Medium Mn Steels

1
Department of Mechanical Engineering, The University of Hong Kong, Pokfulam Road, Hong Kong 999077, China
2
Shenzhen Institute of Research and Innovation, The University of Hong Kong, Shenzhen 518000, China
*
Author to whom correspondence should be addressed.
Metals 2021, 11(2), 356; https://doi.org/10.3390/met11020356
Submission received: 8 January 2021 / Revised: 7 February 2021 / Accepted: 18 February 2021 / Published: 20 February 2021
(This article belongs to the Special Issue Recent Developments in Medium and High Manganese Steels)

Abstract

:
Deformed and partitioned (D&P) medium Mn steels exhibiting high strength, large ductility, and excellent fracture toughness have been developed recently. The ultra-high dislocation density and transformation-induced plasticity (TRIP) effect are the main mechanisms for their exceptional mechanical properties. The simple processing route to manufacturing D&P steel makes it promising for large-scale industrial applications. However, the exact effect of each processing step on the final mechanical properties of D&P steel is not yet fully understood. In the present work, the effects of processing parameters on the mechanical properties of D&P steels are systematically investigated. The evolution of microstructure, tensile behavior and austenite fraction of warm rolled samples and D&P samples are revealed. Two D&P steels, with and without the intercritical annealing process, are both produced for comparison. It is revealed that the intercritical annealing process plays an insignificant role to the mechanical properties of D&P steel. The partitioning process is extremely important for obtaining large uniform elongation via slow but sustaining strain hardening by the TRIP effect in the partitioned austenite. The cold rolling process is also significant for acquiring high strength, and the cold rolling thickness reduction (CRTR) is extremely critical for the strength–ductility synergy of D&P steels.

1. Introduction

Structural materials with high strength and good ductility are highly desired for engineering applications to meet the demand of lightweight and energy-efficient materials in a wide variety of industries such as automotive, aerospace and marine engineering [1,2]. Unfortunately, for most metallic materials, improving strength or ductility is often at the expense of deteriorating the other property, which is well-known as the strength–ductility tradeoff [3,4,5]. In the past decades, unremitting efforts have been devoted to search strategies that can solve the strength–ductility tradeoff dilemma. Nanostructured engineering is a strategy that could realize the combination of high strength and good ductility [6,7,8]. By tailing the nanostructured grains or twins via various processing routes such as severe plastic deformation (SPD) [9,10], and overcoming the instabilities upon plastic deformation by miscellaneous methods such as grain boundary and twin boundary engineering, the goal of improving the ductility without sacrificing the strength could be realized [11,12,13,14,15]. A gradient hierarchical microstructure can also be used to circumvent the strength–ductility tradeoff [16,17,18,19]. It is reported that the gradient hierarchical nanotwinned structure can be obtained in a twinning-induced plasiticity (TWIP) steel via pre-torsion, which leads to doubled yield strength with no reduction of the ductility [18]. Nevertheless, the processing routes for obtaining and controlling the nanostructured grains, twins, or gradient structures is often very complicated, which is difficult for large-scale industrial manufacturing at present.
Alloying is another alternative way to overcome the strength–ductility tradeoff. For example, large amounts of nickel, cobalt, titanium, or molybdenum are often alloyed in the high-strength maraging steel to improve the strength and ductility, usually by nanoscale precipitations and solid solutions [20,21,22]. This way is feasible but not sustainable and cost-effective [23]. Low-alloy high-carbon martensitic steel is another high-strength material [24,25]. However, the high-carbon martensitic steel is usually very brittle in the as-quenched or low-temperature-tempered state. Recently, a super-strong dislocation-structured high-carbon martensite steel possessing 2.5 GPa tensile strength and 10% total elongation has been developed by a new temforming (tempering and deforming of a quenched steel) thermomechanical process. The drastic enhancement of ductility in this high-carbon martensitic steel is found to arise from the martensite with a dislocation microstructure instead of a conventional twin microstructure [24].
Quenching and partitioning (Q&P) steel is a third-generation advanced high-strength steel (AHSS) exhibiting outstanding combination of high strength and good ductility [26,27,28]. In Q&P steels, the martensite matrix provides the high strength, while the retained austenite provides the high work hardening rate and ductility by transformation-induced plasticity (TRIP) effect [29,30,31]. The carbon partitioning from martensite or ferrite to retained austenite is quite critical to the mechanical properties of Q&P steels. This process increases the mechanical stability of retained austenite with enriched carbon concentration, which is of benefit to the work hardening and ductility owing to the TRIP effect [32,33,34]. By optimizing the fraction and stability of retained austenite, the best mechanical properties of Q&P steel could be achieved [35]. Recently, a two-step Q–P treatment with a prolonged partitioning stage has been proposed to tailor the strength–ductility combination of a Si-alloyed middle-carbon steel. The combination of 2374 MPa ultimate tensile strength (UTS) with 9% total elongation (TEL) or combination of 1743–1830 MPa UTS with 20–21% TEL could be achieved [36].
Carbide-free bainitic (CFB) steel is another high-strength steel, comprising of ultrafine lamellae (20–40 nm) of bainitic ferrites with thin retained austenite films or coarse austenite blocks [37,38]. This mixed microstructure results in an extraordinary balance of the mechanical properties of CFB steels. The ultrafine bainitic ferrite provides the high strength while the retained austenite provides the high strain hardening rate and ductility by the TRIP effect [39,40,41]. It has been reported that the combination of 2172 MPa UTS and 8.8% uniform elongation (UE) can be achieved in CFB steels [42]. Medium Mn steel is another promising third-generation AHSS with Mn concentration ranging between approximately 3–12 wt.% [43,44]. The excellent balance between the strength and ductility is also mainly due to the TRIP effect occurring in retained austenite. Intercritical annealing is a critical process in general medium Mn steels, in order to obtain large amounts of retained austenite, which is the main source for the high mechanical performance of medium Mn steel [45,46]. It can be found that the retained austenite grains are the common components in Q&P steels, CFB steels, and medium Mn steels, which increases the strength and ductility simultaneously by the TRIP effect.
Heterogeneous lamellar microstructures, with soft micro-grained lamellae embedded in hard ultrafine-grained lamellar matrix, can also avoid the strength–ductility tradeoff via combining the ultrafine-grained strength and the coarse-grain ductility [47,48]. Such a heterogeneous lamellar microstructure can be easily obtained through a simple rolling and annealing process, which is very common in the metal industry. Martensite and austenite are the most common hard and soft phases in steel, respectively, which are perfect for making a heterogeneous microstructure. Recently, it has been reported that medium Mn steels subjected to deformed and partitioned (D&P) processes possess a heterogeneous lamellar microstructure and exhibit ultra-high strength, large ductility, and excellent fracture toughness [49,50]. The processing route is quite simple, including hot rolling, warm rolling, intercritical annealing, cold rolling, and partitioning. The corresponding steel is defined as D&P steel. The heterogeneous lamellar microstructure is produced by the deforming process, with the soft austenite lamella embedded in the hard martensite lamellar matrix. The hard martensite lamellar is produced in the cold rolling process via deformation-induced martensitic transformation [51,52]. Due to the large plastic deformation and displacive shear transformation, the martensite matrix has an unprecedented high dislocation density, which results in ultra-high strength. Meanwhile, the steel also has a large uniform elongation, which is contributed by the high mobile dislocation density. The controllable high mobile dislocation density, introduced by the warm rolling process, is the key mechanism for obtaining such an ultra-strong yet ductile steel. Different from nanostructured engineering mentioned before, D&P steel circumvents the strength–ductility tradeoff by dislocation engineering. In addition to the dislocation engineering, the TRIP effect is also a very crucial mechanism for the excellent uniform elongation during deformation. The strain hardening by the TRIP effect postpones the necking initiation, which is greatly significant to the increased uniform elongation.
The ultra-strong and ductile D&P steel is produced by sequential hot rolling, warm rolling, intercritical annealing, cold rolling, and partitioning processes, via playing the dislocation engineering and the TRIP effect. In the present paper, the effect of each process on the mechanical properties of D&P steel is systematically investigated. The evolution of microstructure, tensile behavior and austenite fraction of warm rolling samples and D&P samples are investigated. Two D&P steels, with and without the intercritical annealing process, are both produced for comparison. It is found that the intercritical annealing process is not necessary for producing D&P steel, which further simplifies the processing route for industrial manufacturing. Samples with different processing routes are studied. The partitioning process is very important in achieving high uniform elongation due to the sustaining strain hardening by the TRIP effect in the partitioned retained austenite. The effects of different partitioning temperatures on the mechanical properties of D&P steel are also elucidated. Cold rolling is also highly important, and the cold rolling thickness reduction is extremely critical for the strength–ductility combination.

2. Materials and Methods

A medium Mn steel with a chemical composition of Fe-10.13 Mn-0.39 C-2.05 Al-0.26 V (wt.%) is employed for the present investigation. The equilibrium phase fraction of the steel at different temperatures is calculated by using Thermo-Calc software (version 2017b, Stockholm, Sweden) with the TCFE8 database, as shown in Figure 1. It is indicated that (i) the A3 point is 730 °C; (ii) the fractions of ferrite and austenite are equal at 620 °C; (iii) the cementite and vanadium carbide are completely dissoluted at 640 °C and 960 °C, respectively.
The steel ingots were casted using a vacuum induction melting furnace (Nabertherm GmbH, Lilienthal, Germany) and then hot forged into billets with a thickness of 20 mm. The billets were homogenized at 1150 °C for 2 h, and then were subjected hot rolling (HR) to a thickness of 4 mm, with a finishing temperature of about 850 °C. The HR strips were reheated to 700 °C for 10 min, and then were further subjected to warm rolling (WR) to a thickness of 2 mm (i.e., 50% thickness reduction), with a finishing temperature of about 350 °C. Then an intercritical annealing (IA) process was applied to the WR strips, or this IA process was skipped. The IA process was performed at 620 °C for 5 h. The mechanical properties of HR + WR samples with and without the IA process were both tested, to determine whether IA is a significant process to produce the D&P steel. The strips were further subjected to cold rolling (CR) with different thickness reductions, which varied from 0% to 35%, to investigate the effect of cold rolling reduction to the mechanical properties of the D&P steel. The tensile samples were partitioned at different temperatures, varying from 350 °C to 500 °C for 6 min, to investigate the influence of the partitioning temperature on the mechanical properties of the D&P steel. The above thermomechanical process of the D&P steel is summarized in Figure 2.
The room temperature mechanical properties of the HR + WR samples and D&P samples were evaluated by qusi-static tensile tests. The dog-bone tensile samples with a gauge length of 10 mm were wire cut from strips along the rolling direction. All the tensile tests were carried out using a MTS 810 machine (MTS Systems Corporation, Bellevue, WA, USA) equipped with an extensometer of a 10 mm gauge at a strain rate of 10−3 s−1. The HR + WR samples and D&P samples with and without the IA process were tested. D&P samples with and without the partitioning process were tested. D&P samples with different partitioning temperatures, varying from 350 °C to 500 °C were tested. D&P samples with different cold rolling thickness reductions, which varied from 0% to 35% were tested. Tensile tests for each sample were repeated at least twice. The mean values and standard deviations of the yield strength and uniform elongation of samples at each condition were calculated for comparison.
The initial microstructures of the HR + WR and D&P samples were observed by optical microscopy (ContourX-100, Bruker, Billerica, MA, USA). The OM samples were prepared by etching using a solution of 10% perchloric acid and 90% acetic acid (vol.%) for 90 s after mechanical polishing to 1 μm. The electron backscatter diffraction (EBSD) characterization of HR + WR and D&P samples were conducted using the Sigma 300 scanning electron microscope (Zeiss, Jena, Germany) equipped with a Symmetry EBSD detector (Oxford Instruments, Oxfordshire, UK), performed at 20 kV. The step size of the EBSD measurement was 0.2 μm. The EBSD data were analyzed using HKL CHANNEL5 software (Oxford Instruments, Oxfordshire, UK). The EBSD samples were prepared by electro-polishing using a solution of 10% perchloric acid and 90% acetic acid (vol.%) at room temperature after mechanical polishing to 1 μm. To determine the austenite volume fraction, conventional X-ray diffraction (XRD) measurements were carried out on the electro-polishing samples using Cu Kα radiation with a wavelength of 0.154 nm using a Smartlab diffractometer (Rigaku, Tokyo, Japan). The 2θ Bragg angle was scanned from 30° to 100° with a counting rate of 0.02° s−1. The volume fraction of martensite (α′) and austenite (γ) was calculated by considering the integrated intensities of (110) α′, (200) α′, (211) α′, (111) γ, (200) γ, (220) γ, (311) γ diffraction reflections according to the ASTM E975 standard [53,54]. In addition to the XRD tests, the austenite volume fractions of all samples before and after the tensile test were also measured using a Feritscope (FMP30, Helmut Fischer, Stuttgart, Germany), which was calibrated in advance with the volume fraction of retained austenite measured by XRD before and after the tensile test [55,56]. The detector of the Feritscope was tightly adhered to the middle of the gauge portion of the tensile samples during the measurement. For each sample, the measurement of Feritscope were repeated five times, and the mean values and standard deviations of the retained austenite were calculated for comparison.

3. Results

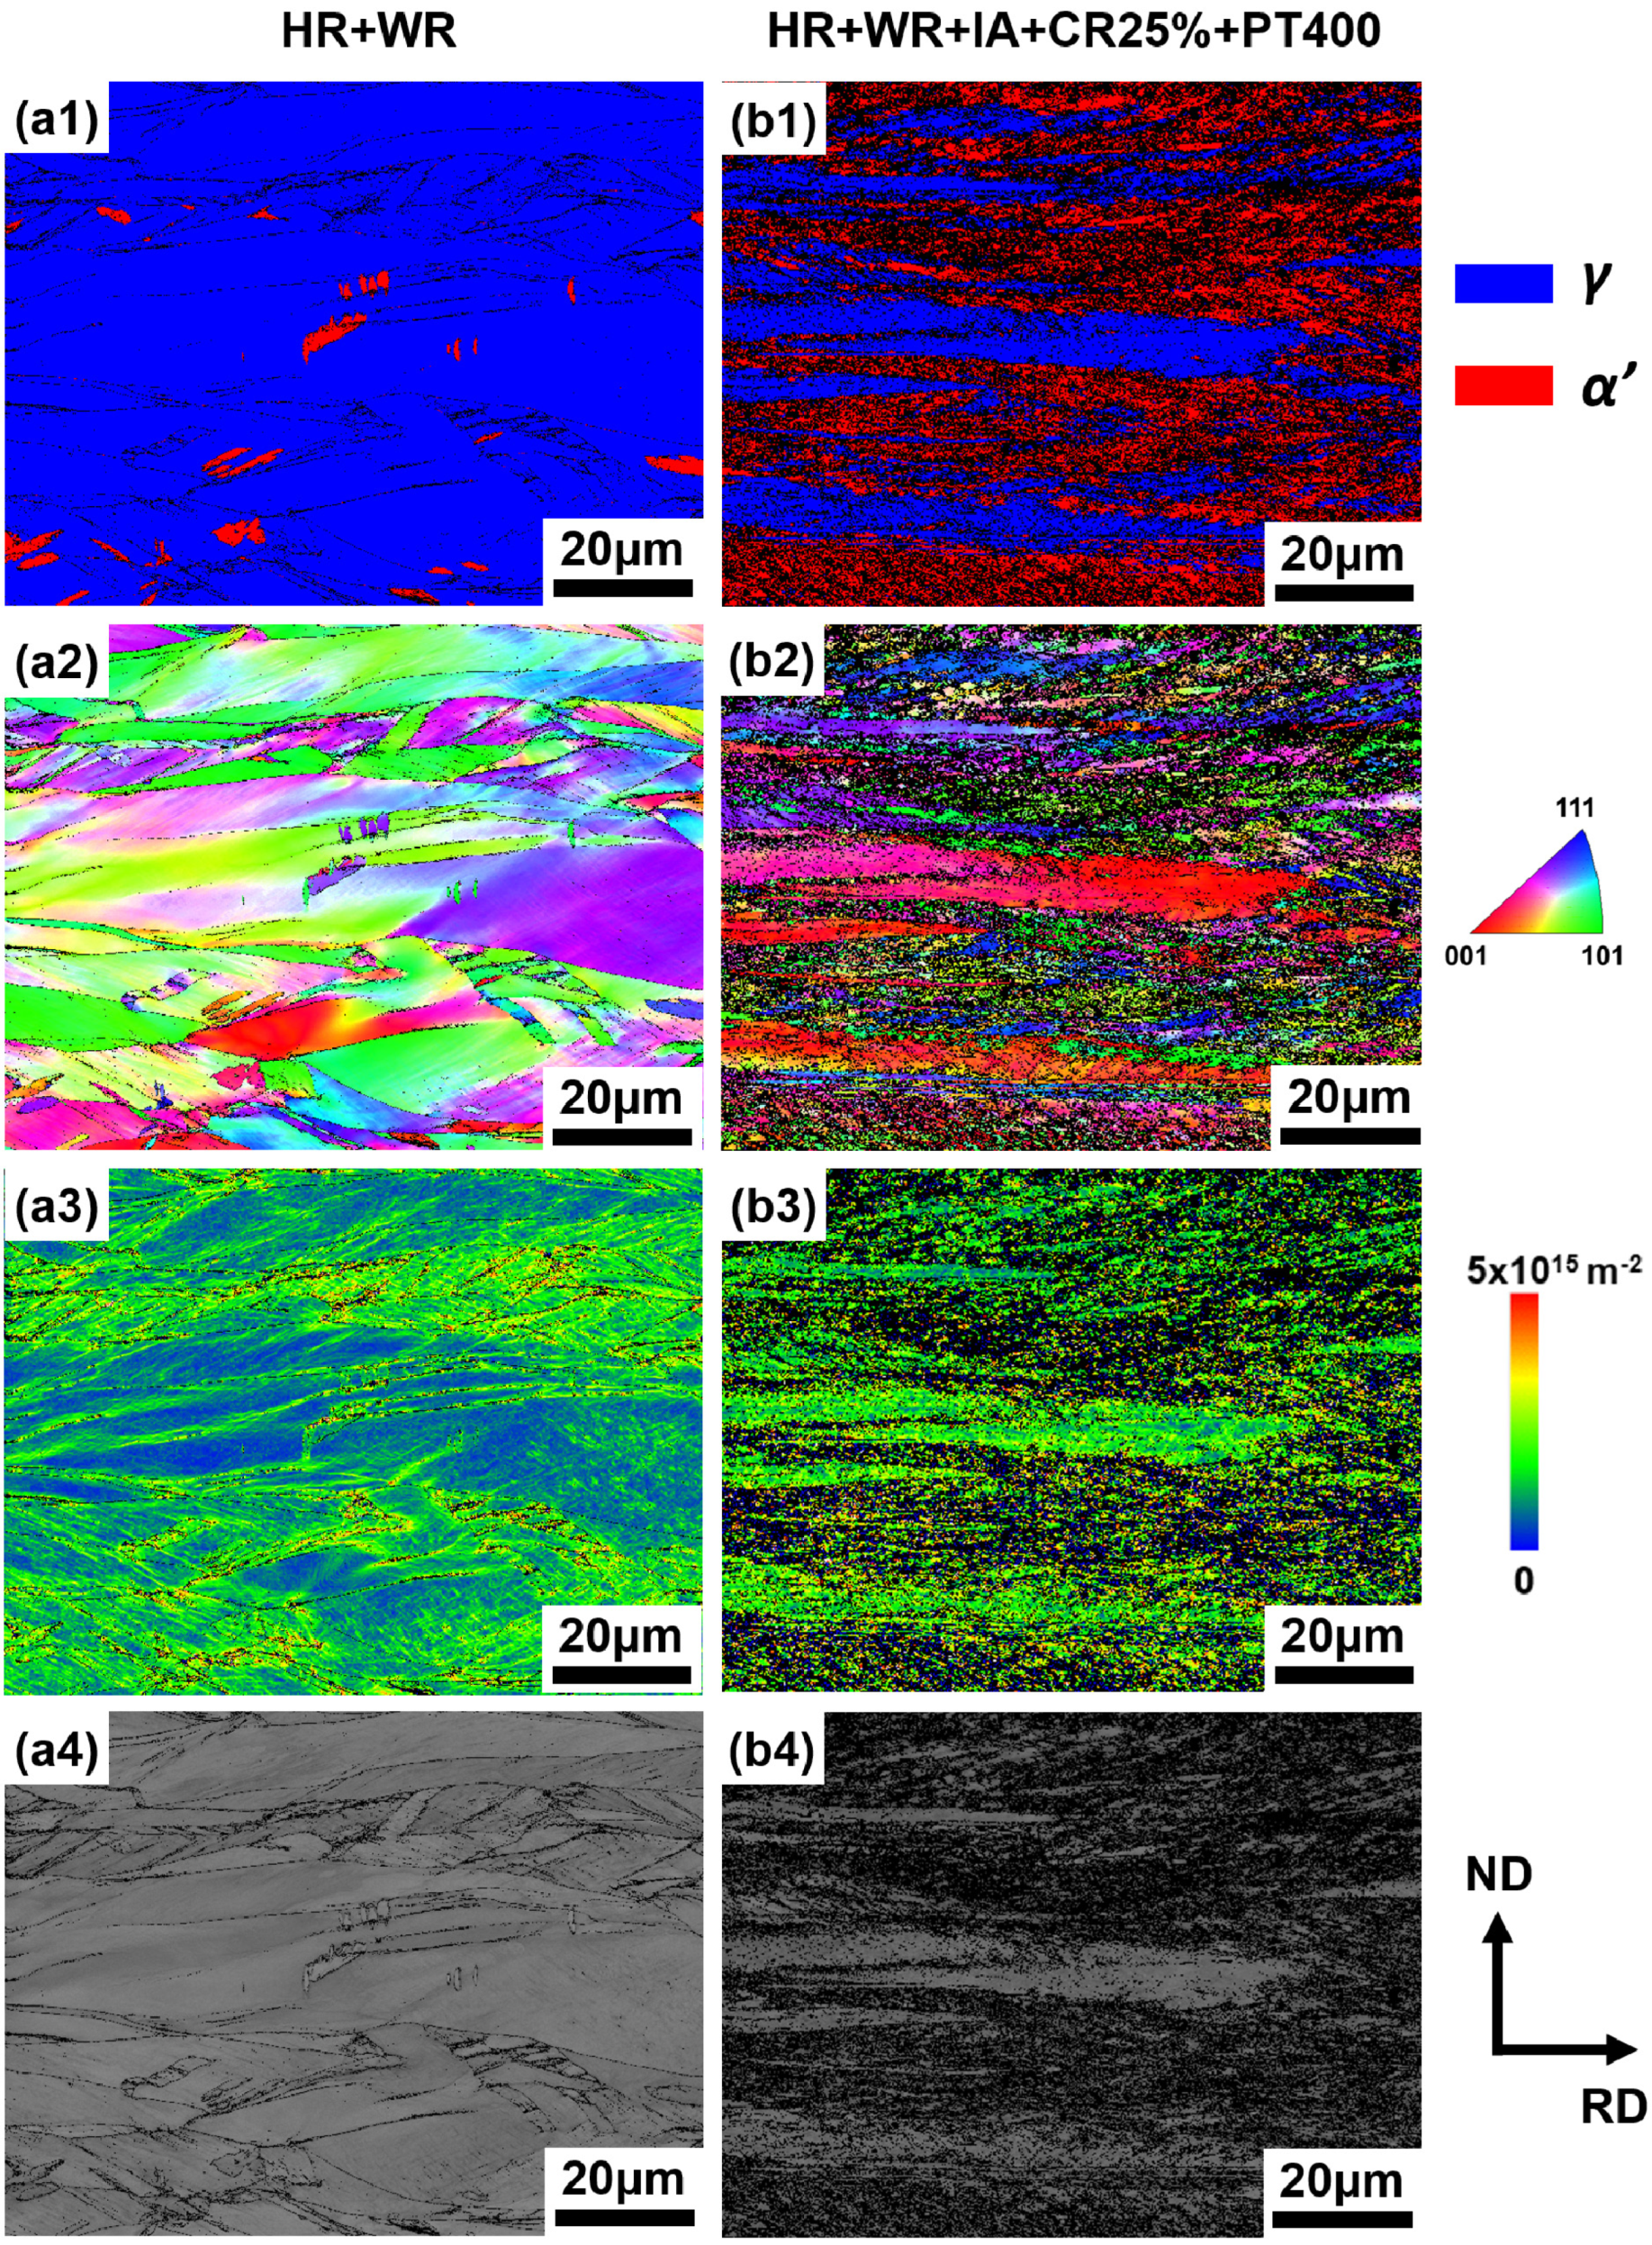
3.1. Microstructure Characterization

The initial microstructures of two typical samples examined by optical microscope are shown in Figure 3. The first sample is a medium product only subjected to the HR and WR process, denoted as the HR + WR sample. The second sample is a D&P product, which was subjected to HR, WR, IA, CR with 25% thickness reduction (CR25%), and partitioning at 400 °C for 6 min (PT400), denoted as the HR + WR + IA + CR25% + PT400 sample.
It can be seen that both samples exhibit banded microstructures. For the HR + WR sample, martensite bands consisting of small martensite grains are sparsely decorated in the austenite matrix, as shown in Figure 3(a1,a2). For the HR + WR + IA + CR25% + PT400 sample, a typical heterogeneous dual-phase lamellar microstructure is observed, as shown in Figure 3(b1,b2). The martensite matrix exhibits heterogeneous grain morphologies, consisting of large lenticular martensite grains and small lath martensite grains. The retained austenite also possesses a heterogeneous microstructure, including coarse lenticular grains and ultrafine lamellar films embedded in large martensite grains.
The initial microstructures of these two typical samples are also characterized by EBSD and XRD, as shown in Figure 4 and Figure 5, respectively. The HR + WR sample has an almost full austenite microstructure decorated with very few small martensite grains, as shown in Figure 4(a1), which is further confirmed by the XRD result that the volume fraction of austenite in the HR + WR sample is 96.9% (Figure 5a). The austenite grains are obviously elongated along the rolling direction (RD) and are observed to exhibit two morphologies, i.e., most are large lenticular grains, and a band structure consists of small austenite grains parallel to the rolling direction. The HR + WR + IA + CR25% + PT400 sample has a heterogeneous dual-phase lamellar microstructure (Figure 4(b1)). It can be seen that, after cold rolling, about half of the austenite is transformed to fresh martensite. The prior austenite grain boundaries can be distinguished according to the inverse pole figure (IPF) maps (Figure 4(b2)). The volume fractions of retained austenite in this D&P sample measured by XRD is 53.5% (Figure 5b). Because of cold rolling, the austenite and martensite lamellae are much thinner compared to that in the HR + WR sample. The austenite grain is further elongated along the rolling direction after cold rolling.
The densities of the geometrically necessary dislocations (GND) of the two samples are shown in Figure 4(a3,b3), which are estimated based on the kernel average misorientation (KAM). The estimated average GND densities of austenite and martensite in the two samples are summarized in Table 1. It is reported that the average total dislocation density of the martensite in D&P steel is around 1016 m−2, which is two orders higher than thermally transformed martensite [49,57]. Table 1 shows that the average GND density of martensite in D&P steel is around 2 × 10¹⁵ m−2, which coincides with the reported value, without regard to the statically stored dislocations (SSD). It is found that the GND densities of both austenite and martensite in D&P sample are much higher than in the HR + WR sample. The GND density of austenite is massively increased in the D&P sample compared to the HR + WR sample, owing to the additional large plastic deformation during the cold rolling process. It is notable that, in the D&P sample, the GND density of austenite is very close to the GND density of martensite. The GND density of martensite is also slightly increased in the D&P sample, caused by cold rolling. In the D&P sample, the higher GND density in fresh martensite than in the retained austenite is due to the displacive martensitic transformation induced by cold rolling. The band contrast maps in Figure 4(a4,b4) also reflect the GND magnitude of the three samples from another perspective.

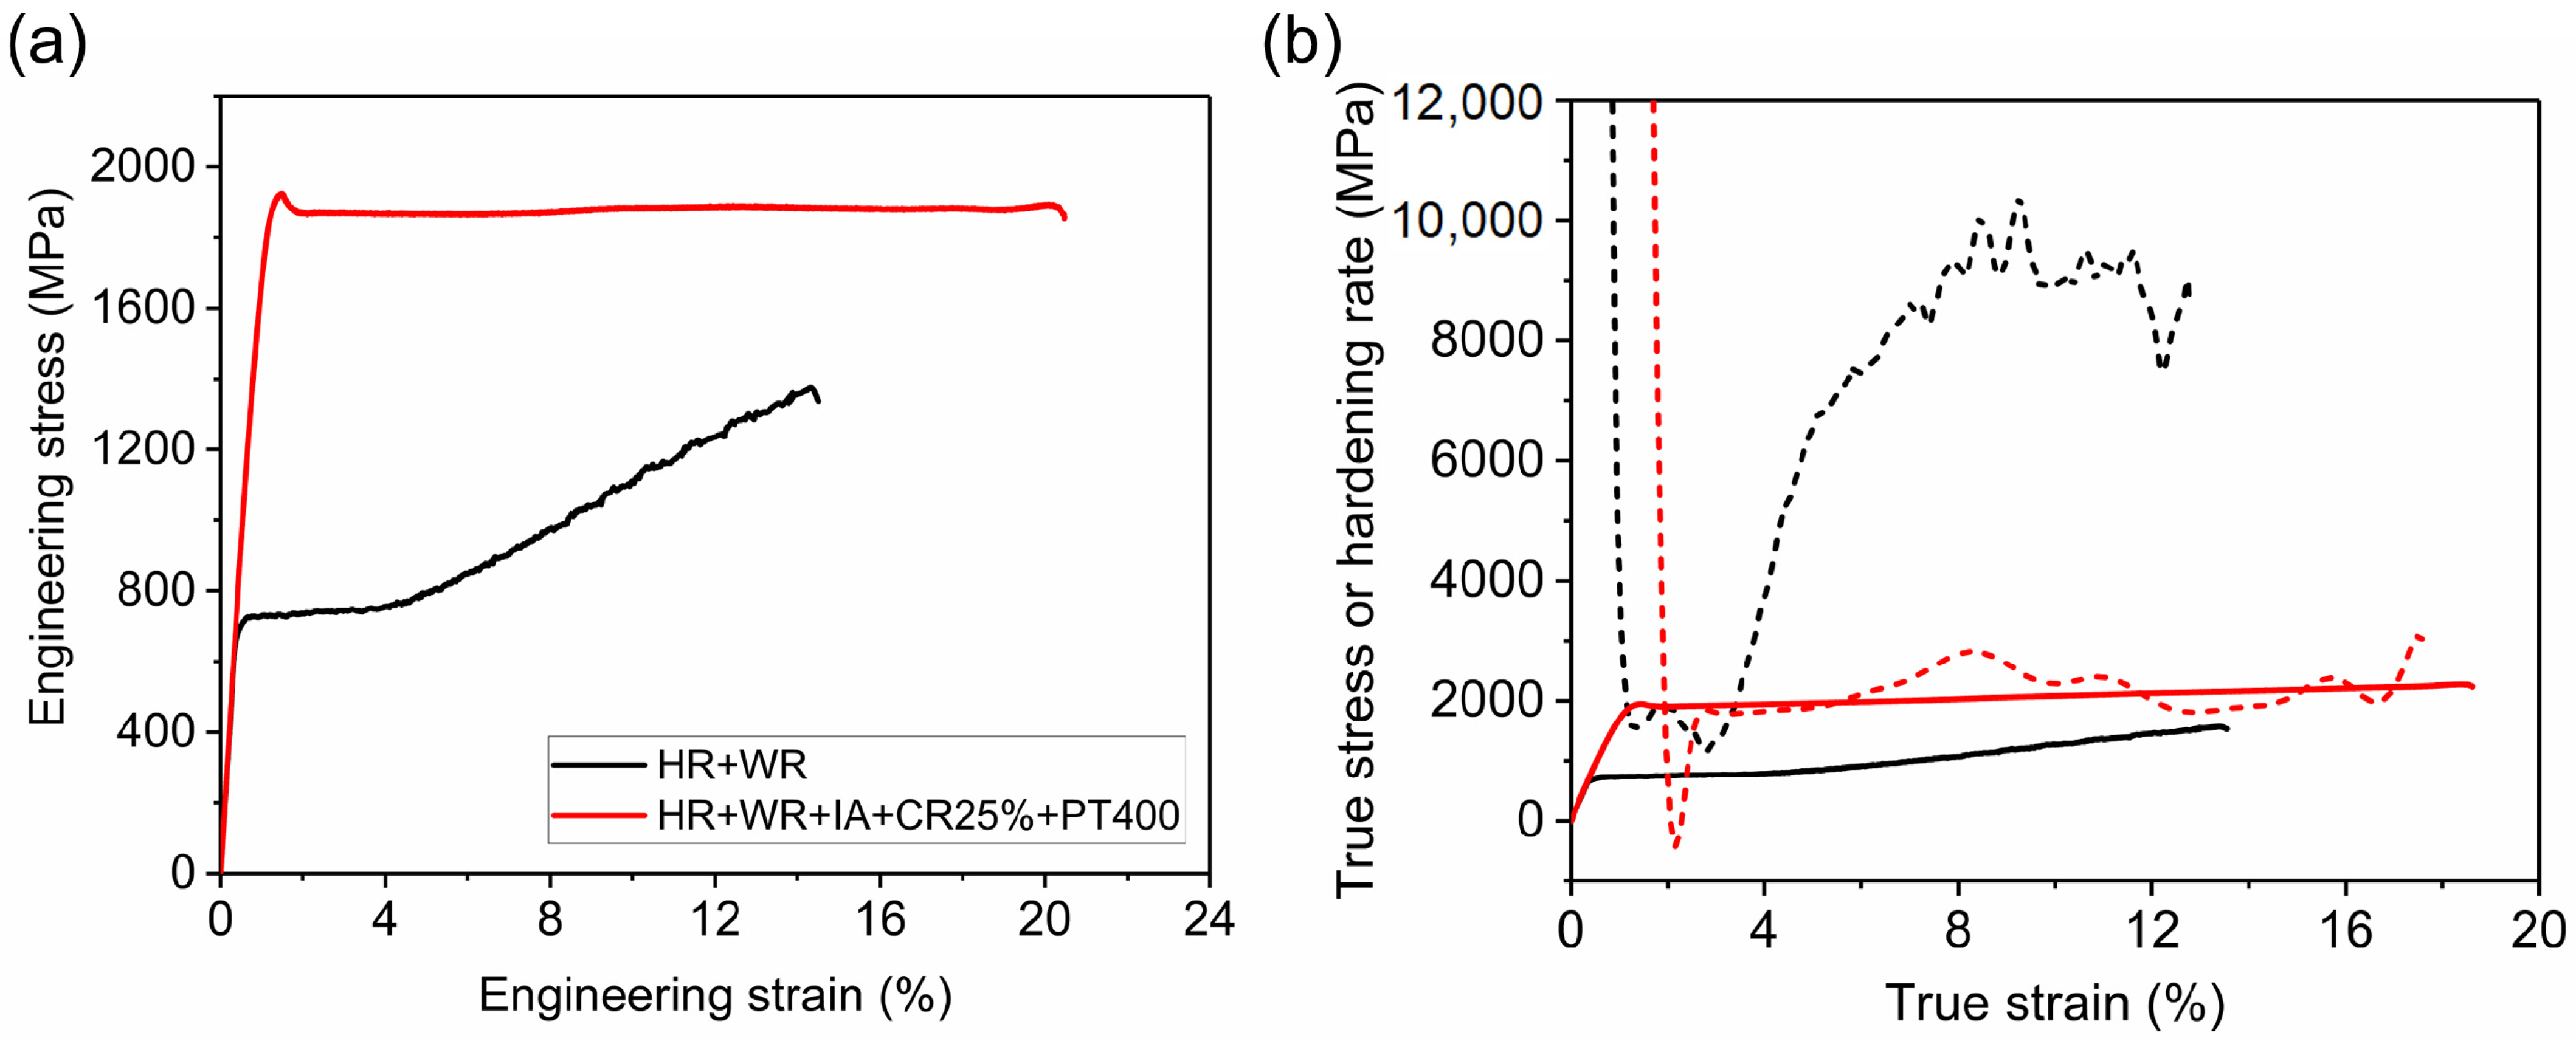
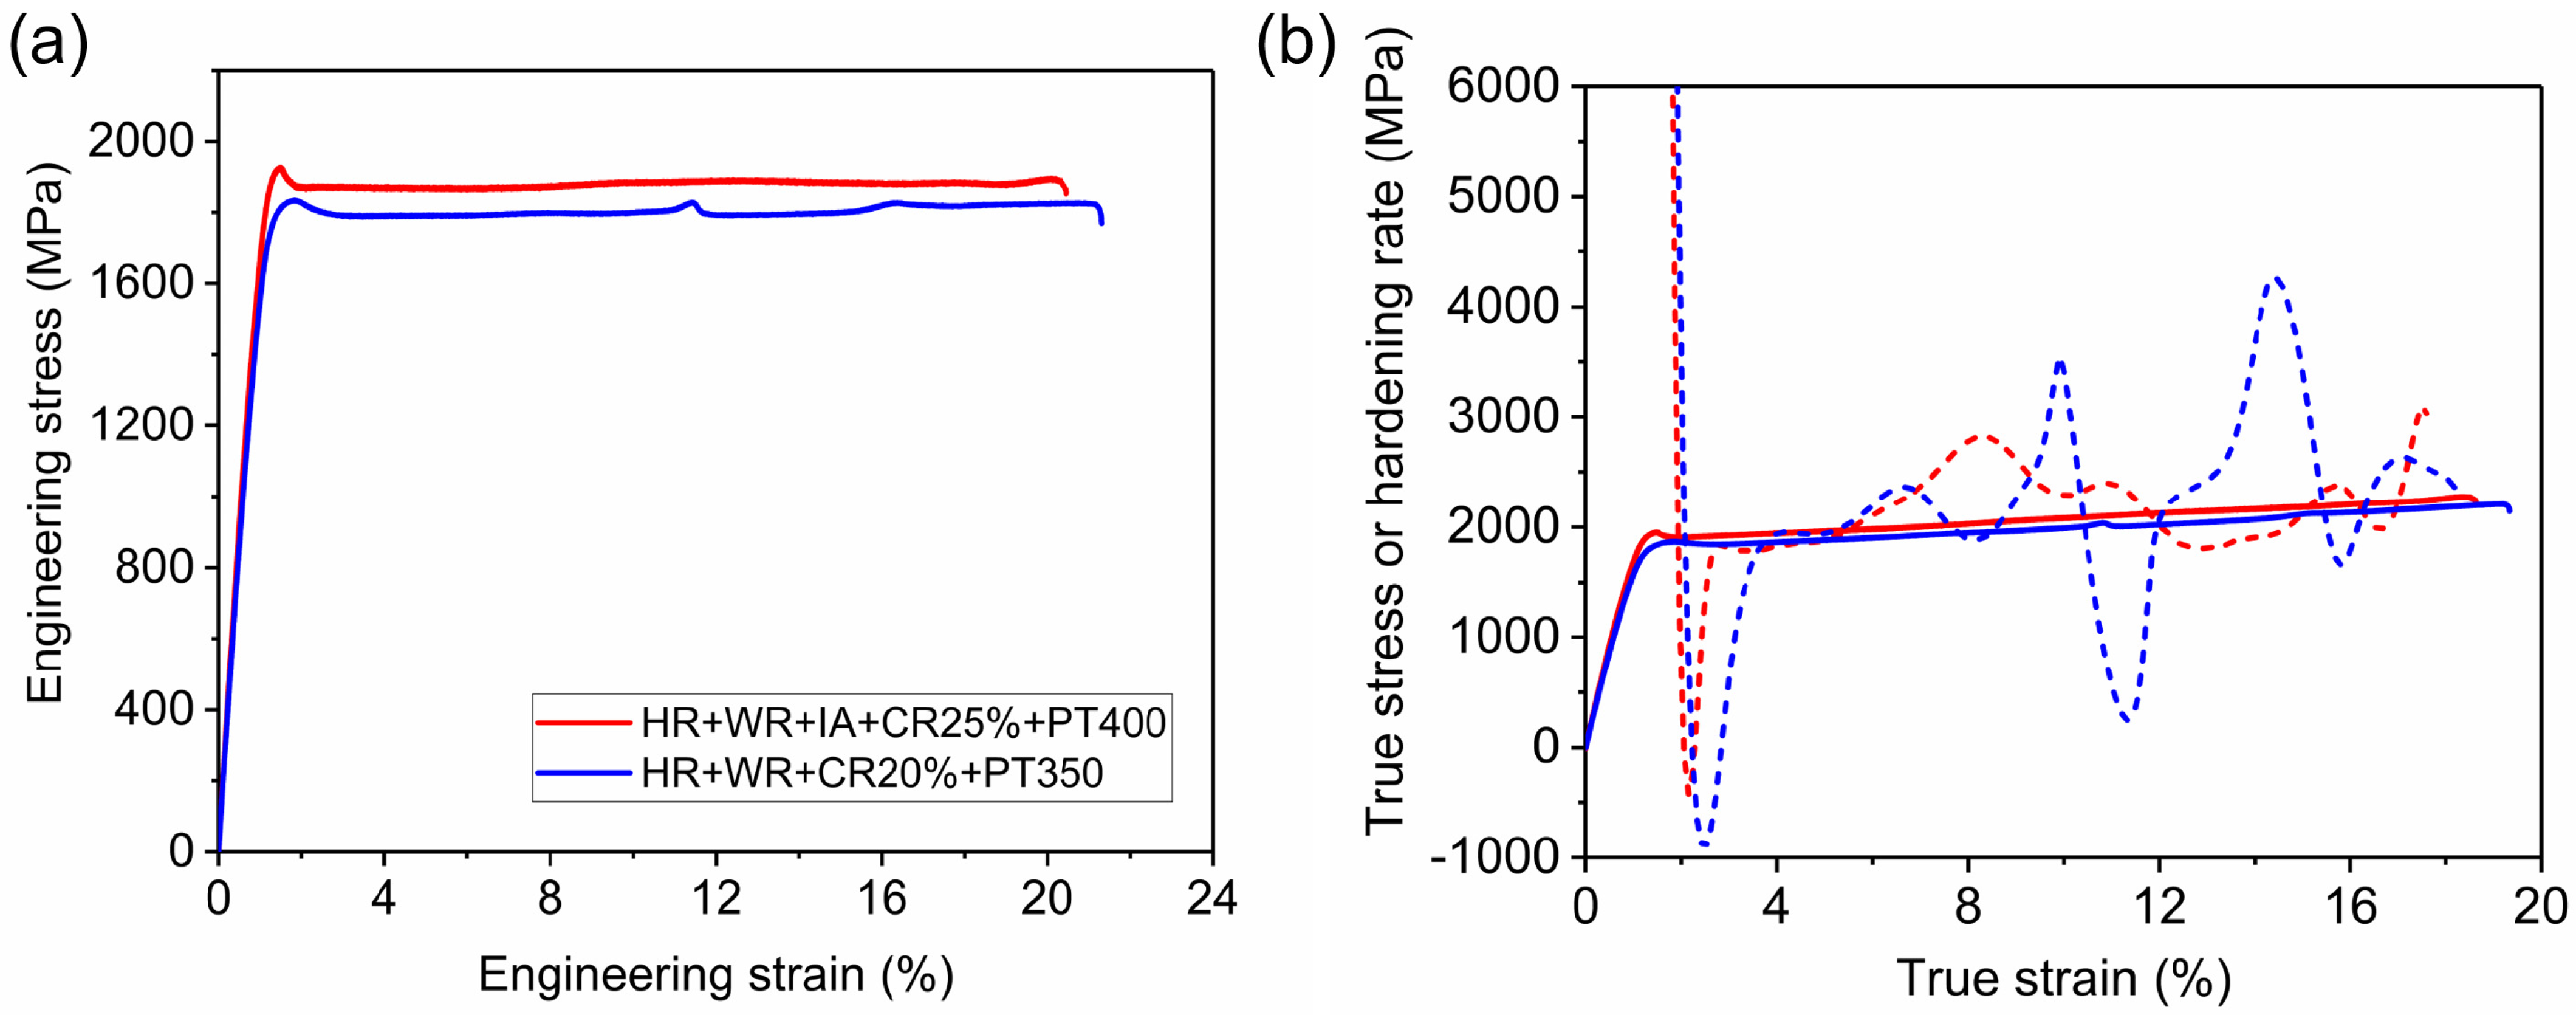
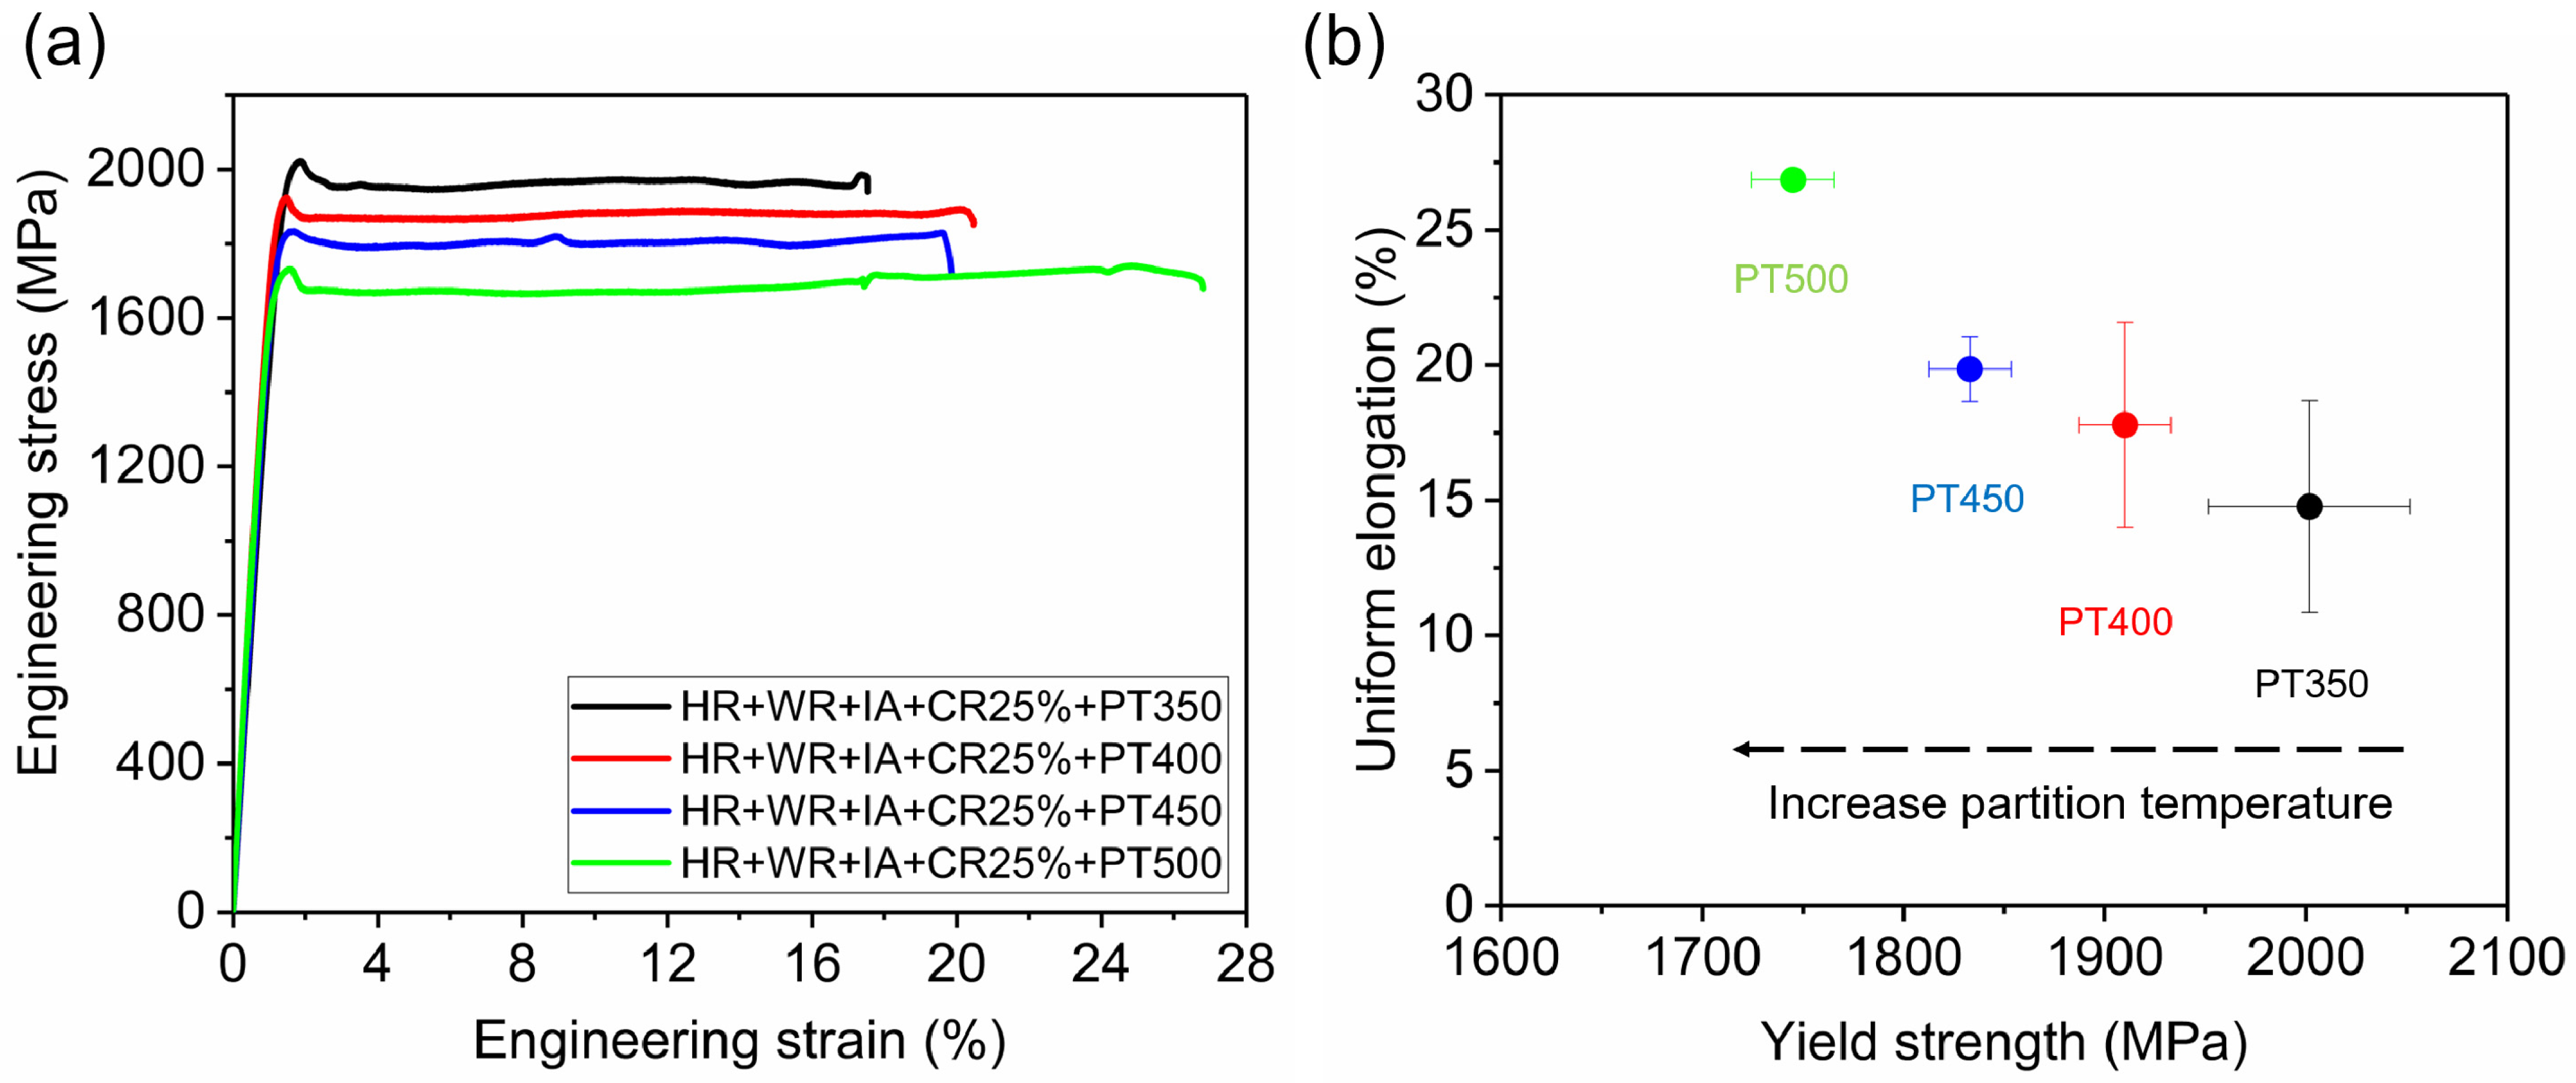
3.2. Mechanical Properties

The engineering stress–strain curves of the HR + WR and HR + WR + IA + CR25% + PT400 samples are shown in Figure 6a. Figure 6b shows the corresponding true stress–strain curves and the work hardening rate curves of these two samples.
The HR + WR sample shows a relatively low yield point (722 MPa), followed by a Lüders strain of about 3% and a 10% uniform strain, finally fractured at an engineering strain of 14.5% with an ultimate tensile strength of 1373 MPa (Figure 6a). The volume fraction of austenite is 96.9% before deformation, and turns into 52.4% after fracture (Figure 5a,c). The high work hardening rate after the Lüders band is shown, which could be ascribed to the impetuous martensitic transformation during the tensile test, and consequently the strong TRIP effect.
The HR + WR + IA + CR25% + PT400 sample has an ultra-high yield strength, i.e., 1924 MPa (Figure 6a). A pronounced yield drop phenomenon is shown in the sample. This phenomenon is caused by the partitioning process, which will promote carbon atoms diffusing to the dislocations, and forming a Cottrell atmosphere [58,59]. It is noted that the yield strength of the D&P sample in the present paper is determined as the upper yield point. After yielding, the samples show a Lüders strain of about 17%, which accounts for almost 95% of the total plastic deformation. A small hardening trend is initiated after the Lüders strain, but the sample breaks down immediately. Finally, the total elongation of the HR + WR + IA + CR25% + PT400 sample is 20.5%. There is almost no work hardening during the Lüders strain, as shown in Figure 6b. Since the deformation behavior at the Lüders band area is non-homogeneous, the Considère criterion is not applicable here.
The volume fraction of retained austenite in HR + WR + IA + CR25% + PT400 sample is 53.5% before deformation, and becomes 20.4% after fracture (Figure 5b,c). It is noticeable that the martensitic transformation rate in the HR + WR + IA + CR25% + PT400 sample is severely slower than that in the HR + WR sample. This could be contributed to by the markedly higher dislocation density in retained austenite in the HR + WR + IA + CR25% + PT400 sample (Figure 4(a3,a4,b3,b4)), which makes the retained austenite much more stable.
The ultra-high strength and ductility of the D&P steel are mainly due to the high dislocation densities, both in martensite and austenite. The warm rolling process remarkably produces large amounts of dislocations in austenite. For a nearly full austenite microstructure, the yield strength of the present steel after warm rolling (743 MPa) is largely improved by the high dislocation density, compared to other fully austenitic steels, such as fully recrystallized twinning-induced plasticity (TWIP) steel (500 MPa) [60]. The cold rolling (CR) process produces a large fraction of martensite through martensitic transformation. The fresh martensite resulting from martensitic transformation inherits the high dislocation density of prior warm rolled austenite. Meanwhile, further plastic deformation by cold rolling and martensitic transformation continues to increase the dislocation density of austenite and martensite. The final D&P steel has a microstructure of about half martensite and half austenite, and both phases possess ultra-high dislocation densities, resulting in an extremely high yield strength.

4. Discussion

4.1. Insignificant Role of the Intercritical Annealing Process

In order to determine whether the intercritical annealing process is a significant process for producing D&P steel, the mechanical properties of the HR + WR + IA sample were also tested, and compared with the HR + WR sample (Figure 7). The result shows that the yield and ultimate strengths, as well as the work hardening response of samples with and without the IA process are almost the same, which implies that the IA process has no significant effect on the mechanical properties of D&P steel. Note that the only difference is that the sample with the IA process exhibits a discontinuous yielding (i.e., showing upper and lower yield points) due to the carbon pinning effect introduced by the IA process [58], while the sample without the IA process shows a continuous yielding (Figure 5b). Although it has been reported that after the IA process, the dislocation density of the sample would slightly decrease [57], the comparison of the mechanical behavior between the HR + WR sample and the HR + WR + IA sample here shows that the IA process does not play a significant role in tailoring the mechanical performance of the warm rolled samples.
In order to further illustrate that the IA process plays an insignificant role in manufacturing D&P steel, another D&P steel without IA process is produced. The cold rolling thickness reduction is 20%, and the partitioning temperature is 350 °C. This D&P sample is denoted as the HR + WR + CR20% + PT350 sample. Note that the cold rolling thickness reduction and the partitioning temperature of the HR + WR + CR20% + PT350 sample are slightly different from the previous HR + WR + IA + CR25% + PT400 sample, in order to obtain the optimal mechanical properties.
The initial microstructure of the HR + WR + CR20% + PT350 sample is characterized by EBSD, as shown in Figure 8. It is found that the heterogeneous dual-phase lamellar microstructure of this D&P steel without the IA process is almost the same as the previous D&P steel including the IA process. The comparison of the tensile properties of the two D&P steels with and without the IA process is shown in Figure 9. It is found that the tensile behaviors of the two D&P samples are also very similar. The retained austenite fraction of the HR + WR + CR20% + PT350 sample is 56.1% before deformation, and 22% after fracture, according to XRD and Feritscope measurements, which is also very close to the HR + WR + IA + CR25% + PT400 sample.
In conclusion, the ultra-strong and ductile D&P steel can be produced without the IA process. The IA process does not play a significant role in tailoring the mechanical performance of D&P steels. On this basis, removing the IA step is possible, which greatly simplifies the total manufacturing procedures, and makes it more attractive for the industrial manufacturing of D&P steel.

4.2. Significance of the Partitioning Process

The influence of the partitioning process on the mechanical properties of D&P steel is shown in Figure 10. The tensile behavior of samples with and without partitioning are tested, and samples with and without the IA process are both tested. Figure 10a shows that the samples without the partitioning process are very brittle, with uniform elongation less than 4.5%. After a simple partitioning at 350 °C or 400 °C for 6 min, the samples then exhibit large elongation (about 20%). Meanwhile, the yield strength of samples (determined as upper yield point) do not decrease after the partitioning process. Figure 10b shows the map of uniform elongation versus the yield strength of samples with and without the partitioning process, which exhibits the great significance of the partitioning process for improving the final mechanical properties of D&P steel.
The partitioning process brings several benefits to the steel. According to previous research, the partitioning process of D&P steel does not change the fraction of austenite [57]. The yield strength of the steel has nearly no change since the phase fraction remains unchanged. The low temperature tempering releases the stress concentration introduced by cold rolling, making the tempered martensite not so brittle. The carbon atoms diffuse from martensite to the austenite during the partitioning process. This carbon partitioning, on one hand, decreases the carbon content in martensite, further making the martensite more ductile, and on the other hand, enhances the stability of austenite by increasing its carbon concentration. The more stable austenite leads to a slower TRIP effect during the deformation. The slow but sustaining TRIP effect makes the strain hardening lasting for a larger strain and therefore delays the initiation of necking and leads to a larger uniform elongation.

4.3. Influence of Partitioning Temperature

The partitioning process is extremely important to the extraordinary mechanical performance of the D&P steel. In order to find the best partitioning temperature, samples subjected to different partitioning temperatures (350 °C, 400 °C, 450 °C, 500 °C) are tested. Note all the samples in this test have been subjected to the IA process. The influence of different partitioning temperatures on the tensile behavior of D&P steel is shown in Figure 11. With the increase of the partitioning temperature, the yield strength decreases, and the total elongation increases. When the partitioning temperature is increased from 350 °C to 500 °C, the yield strength drops from 2020 MPa to 1730 MPa, and the total elongation rises from 17.5% to 26.8%. Note that the post-elongation appears in the sample with partitioning at 500 °C, which do not exist in samples with lower partitioning temperatures.
The higher partitioning temperature leads to more dislocation recovery, resulting in lower dislocation density [57]. This is the reason for the decline of yield strength when increasing the partitioning temperature, according to the Taylor hardening law [61]. The decreasing yield strength is also part of the reason for the increase of total elongation, according to the strength–ductility tradeoff. Another reason for the increasing total elongation is that the carbon concentration in austenite is higher at higher temperatures. Thus, the austenite becomes more stable, leading to a better TRIP effect.

4.4. Critical Thickness Reduction in Cold Rolling Process

The martensite matrix with high dislocation density produced by the cold rolling process is the main reason for the ultra-high strength. In order to seek out the most appropriate cold rolling parameter for realizing the best strength–ductility synergy in D&P steels, cold rolling with different thickness reductions is performed. Note that all samples in this section have not been subjected to the IA process. The samples subjected to different CR thickness reductions (both with and without partitioning process) are all tested.
Figure 12a shows the engineering stress–strain curves of all samples. Figure 12b shows the map of uniform elongation versus yield strength of all samples. Comparing the mechanical properties of samples with and without partitioning (for all CR thickness reduction except CR0%), the importance of the partitioning process for improving the performance of D&P steel is once again illuminated. The partitioning process improves the uniform elongation but does not affect the yield strength of D&P steel, as discussed in Section 4.2.
For samples with different cold rolling thickness reductions (CRTRs), the yield strength rises with increasing CRTR (for both with and without the partitioning process), as shown in Figure 12c. The yield strength increases from 743 MPa to as high as 2195 MPa when the CRTR increases from 0% to 35%. Two reasons are accounted for this phenomenon. Firstly, the larger CRTR produces more dislocations. According to the Taylor hardening law [61], the high dislocation density results in higher yield strength. Secondly, the larger CRTR also produces more martensite, as shown in Figure 12d. Since the martensite phase is much harder than austenite phase, the higher martensite volume fraction also contributes to the higher yield strength.
As for the uniform elongation, for samples without partitioning, it decreases with increasing CRTR (or yield strength). This is the strength–ductility tradeoff phenomenon, which is common in most metallic materials. However, for samples with partitioning, the results are different. An unexpected peak appears in Figure 12b. It is found that, when the CRTR is 20%, the uniform elongation can surprisingly rise to 21.3%, which is much larger than the samples with 0% and 15% CRTR. The mechanism of breaking through the strength–ductility tradeoff rule could be attributed to the high mobile dislocation density in D&P steel with 20% CRTR. It can be seen that the large Lüders strain (about 13%) is the major contribution to the total elongation. The glide of intensive mobile dislocations is accounted for with the large Lüders strain [49]. Meanwhile, the slow and continuous TRIP effect delays the onset of necking and thus also contributes to the high uniform elongation.
It is shown in Figure 12c that, although the yield strength of the steel constantly increases with the increasing CRTR, the increasing rate slows down obviously with the rising CRTR, especially when the CRTR is larger than 20%. It shows that when the CRTR increases from 0% to 15%, or 15% to 20%, or 20% to 25%, or 25% to 35%, the yield strength increments are 453 MPa, 654 MPa, 238 MPa and 125 MPa, respectively. The evolution of the volume fraction of austenite in D&P steel with respect to CRTR is shown in Figure 12d. It is found that the volume fraction of austenite decreases greatly with the increasing CRTR, when the CRTR is lower than 20%. It means the deformation-induced martensitic transformation (DIMT) occurs dramatically in the cold rolling process when the CRTR is lower than 20%. However, further increasing the CRTR from 20% to 35%, the fraction of austenite almost keeps stable, with an extremely small decreasing trend. It means that martensitic transformation almost no longer happens by further increasing CRTR when it is higher than 20%.
When CRTR is lower than 20%, the rise of yield strength by increasing CRTR is mainly caused by the rising martensite fraction (Figure 12c,d). Since the martensite is the harder phase and austenite is the softer phase, the larger fraction of martensite enhances the contribution of the martensite phase and thus increases the macro yield strength of D&P steel pronouncedly. Meanwhile, the higher stress lever also promotes more dislocations to become mobile dislocations, which leads to a larger uniform elongation. This mechanism of evading the strength–ductility tradeoff is reflected by comparing the D&P steels with 15% and 20% CRTR.
When the CRTR is larger than 20%, the yield strength still increases with the increasing CRTR, but the increasing rate slows down sharply. Meanwhile, the uniform elongation drops down substantially with the increasing CRTR. The fraction of martensite almost does not increase with the rising CRTR, which is responsible for the slower increasing rate of yield strength. That means, at this moment, when increasing the CRTR, almost all the strength increment comes from the slightly increasing dislocation density induced by further cold rolling. At this large CRTR, the dislocation density of both martensite and austenite is very high. More and more mobile dislocations are entangled and hindered, and become stationary dislocations. It is suspected that the ratio of mobile dislocations drops down dramatically. In short, when the CRTR is larger than 20%, further increasing the CRTR may increase the total dislocation density slightly, but decrease the mobile dislocation density intensively, which results in a small increase in yield strength but greatly decreased uniform elongation.
Thus, in order to produce the ultra-strong yet ductile D&P steel, the choosing of cold rolling thickness reduction is critically important. For the present D&P steel, 20% CRTR is the best for the strength–ductility synergy.

5. Conclusions

In the present work, the effects of processing parameters on the final mechanical properties of D&P steels are systematically investigated. Two D&P steels, with and without the IA process, are both produced for comparison. By conducting EBSD, XRD and quasi-static tensile tests, the evolution of microstructure, austenite fraction and mechanical behavior from the WR sample to the D&P sample are revealed, demonstrating that the heterogeneous lamellar microstructure, high dislocation density and continuous TRIP effect in D&P steel are responsible for the excellent mechanical properties. Tensile tests of samples with and without the IA process shows that the IA process is insignificant and can be removed. The partitioning process is very important to D&P steels for obtaining large uniform elongation via slow but sustaining hardening by the TRIP effect in more stable retained austenite with higher carbon content. The cold rolling process is also critical for realizing such a high strength of D&P steel. Furthermore, the cold rolling thickness reduction plays a critical role on the strength–ductility synergy.

Author Contributions

Conceptualization, C.H. and M.H.; methodology, C.H.; validation, C.H. and M.H.; formal analysis, C.H.; investigation, C.H.; resources, M.H.; data curation, C.H.; writing—original draft preparation, C.H.; writing—review and editing, M.H.; visualization, C.H.; supervision, M.H.; project administration, M.H.; funding acquisition, M.H. All authors have read and agreed to the published version of the manuscript.

Funding

This research received funding from the National Natural Science Foundation of China (No. U1764252), the National Key Research and Development Program of China (No. 2019YFA0209900, 2017YFB0304401), the Research Grants Council of Hong Kong (No. R7066-18, 17255016, 17210418) and the Guangzhou Municipal Science and Technology Project (No. 202007020007, 201907010011, 201807010079).

Institutional Review Board Statement

Not applicable.

Informed Consent Statement

Not applicable.

Data Availability Statement

Data available on request.

Conflicts of Interest

The authors declare no conflict of interest.

References

  1. Lu, K. The Future of Metals. Science 2010, 328, 319–320. [Google Scholar] [CrossRef] [PubMed]
  2. Bouaziz, O.; Zurob, H.; Huang, M. Driving Force and Logic of Development of Advanced High Strength Steels for Automotive Applications. Steel Res. Int. 2013, 84, 937–947. [Google Scholar] [CrossRef]
  3. Li, Z.; Pradeep, K.G.; Deng, Y.; Raabe, D.; Tasan, C.C. Metastable high-entropy dual-phase alloys overcome the strength-ductility trade-off. Nature 2016, 534, 227–230. [Google Scholar] [CrossRef] [PubMed]
  4. Jiang, S.; Wang, H.; Wu, Y.; Liu, X.; Chen, H.; Yao, M.; Gault, B.; Ponge, D.; Raabe, D.; Hirata, A.; et al. Ultrastrong steel via minimal lattice misfit and high-density nanoprecipitation. Nature 2017, 544, 460–464. [Google Scholar] [CrossRef] [PubMed]
  5. Ma, E. Instabilities and ductility of nanocrystalline and ultrafine-grained metals. Scr. Mater. 2003, 49, 663–668. [Google Scholar] [CrossRef]
  6. Ma, E. Eight routes to improve the tensile ductility of bulk nanostructured metals and alloys. JOM 2006, 58, 49–53. [Google Scholar] [CrossRef]
  7. Sun, L.G.; Wu, G.; Wang, Q.; Lu, J. Nanostructural metallic materials: Structures and mechanical properties. Mater. Today 2020, 38, 114–135. [Google Scholar] [CrossRef]
  8. Ovid’ko, I.A.; Valiev, R.Z.; Zhu, Y.T. Review on superior strength and enhanced ductility of metallic nanomaterials. Prog. Mater. Sci. 2018, 94, 462–540. [Google Scholar] [CrossRef]
  9. Wang, Y.M.; Ma, E.; Chen, M.W. Enhanced tensile ductility and toughness in nanostructured Cu. Appl. Phys. Lett. 2002, 80, 2395–2397. [Google Scholar] [CrossRef]
  10. Zhu, Y.T.; Huang, J.Y.; Gubicza, J.; Ungár, T.; Wang, Y.M.; Ma, E.; Valiev, R.Z. Nanostructures in Ti processed by severe plastic deformation. J. Mater. Res. 2003, 18, 1908–1917. [Google Scholar] [CrossRef] [Green Version]
  11. Lu, K.; Lu, L.; Suresh, S. Strengthening Materials by Engineering Coherent Internal Boundaries at the Nanoscale. Science 2009, 324, 349–352. [Google Scholar] [CrossRef] [Green Version]
  12. Lu, K. Stabilizing nanostructures in metals using grain and twin boundary architectures. Nat. Rev. Mater. 2016, 1, 1–13. [Google Scholar] [CrossRef]
  13. Wang, Y.; Chen, M.; Zhou, F.; Ma, E. High tensile ductility in a nanostructured metal. Nature 2002, 419, 912–915. [Google Scholar] [CrossRef]
  14. Sun, L.; He, X.; Lu, J. Nanotwinned and hierarchical nanotwinned metals: A review of experimental, computational and theoretical efforts. Npj Comput. Mater. 2018, 4, 1–8. [Google Scholar] [CrossRef]
  15. Lu, K. Grain boundary stability governs hardening and softening in extremely fine nanograined metals. Science 2017, 355, 1292–1296. [Google Scholar]
  16. Cheng, Z.; Zhou, H.; Lu, Q.; Gao, H.; Lu, L. Extra strengthening and work hardening in gradient nanotwinned metals. Science 2018, 362. [Google Scholar] [CrossRef] [Green Version]
  17. Fang, T.H.; Li, W.L.; Tao, N.R.; Lu, K. Revealing Extraordinary Intrinsic Tensile Plasticity in Gradient Nano-Grained Copper. Science 2011, 331, 1587–1590. [Google Scholar] [CrossRef] [PubMed] [Green Version]
  18. Wei, Y.; Li, Y.; Zhu, L.; Liu, Y.; Lei, X.; Wang, G.; Wu, Y.; Mi, Z.; Liu, J.; Wang, H.; et al. Evading the strength-ductility trade-off dilemma in steel through gradient hierarchical nanotwins. Nat. Commun. 2014, 5, 1–8. [Google Scholar] [CrossRef] [Green Version]
  19. Suresh, S. Graded Materials for Resistance to Contact Deformation and Damage. Science 2001, 292, 2447–2451. [Google Scholar] [CrossRef] [PubMed] [Green Version]
  20. Rawlings, M.J.S.; Liebscher, C.H.; Asta, M.; Dunand, D.C. Effect of titanium additions upon microstructure and properties of precipitation-strengthened Fe-Ni-Al-Cr ferritic alloys. Acta Mater. 2017, 128, 103–112. [Google Scholar] [CrossRef] [Green Version]
  21. Sun, L.; Simm, T.H.; Martin, T.L.; McAdam, S.; Galvin, D.R.; Perkins, K.M.; Bagot, P.A.J.; Moody, M.P.; Ooi, S.W.; Hill, P.; et al. A novel ultra-high strength maraging steel with balanced ductility and creep resistance achieved by nanoscale β-NiAl and Laves phase precipitates. Acta Mater. 2018, 149, 285–301. [Google Scholar] [CrossRef] [Green Version]
  22. Pan, D.; Zhao, Y.; Xu, X.; Wang, Y.; Jiang, W.; Chong, X. A novel strengthening and toughening strategy for T250 maraging steel: Cluster-orientation governed higher strength-ductility combination induced by electropulsing. Mater. Des. 2019, 169, 107686. [Google Scholar] [CrossRef]
  23. Li, X.; Lu, K. Improving sustainability with simpler alloys. Science 2019, 364, 733–734. [Google Scholar] [CrossRef]
  24. Sun, J.J.; Liu, Y.N.; Zhu, Y.T.; Lian, F.L.; Liu, H.J.; Jiang, T.; Guo, S.W.; Liu, W.Q.; Ren, X.B. Super-strong dislocation-structured high-carbon martensite steel. Sci. Rep. 2017, 7, 1–7. [Google Scholar] [CrossRef] [PubMed]
  25. Wang, Y.; Sun, J.; Jiang, T.; Sun, Y.; Guo, S.; Liu, Y. A low-alloy high-carbon martensite steel with 2.6 GPa tensile strength and good ductility. Acta Mater. 2018, 158, 247–256. [Google Scholar] [CrossRef]
  26. Wang, L.; Speer, J.G. Quenching and Partitioning Steel Heat Treatment. Metallogr. Microstruct. Anal. 2013, 2, 268–281. [Google Scholar] [CrossRef] [Green Version]
  27. Speer, J.G.; De Moor, E.; Clarke, A.J. Critical Assessment 7: Quenching and partitioning. Mater. Sci. Technol. 2014, 31, 3–9. [Google Scholar] [CrossRef]
  28. He, B.B.; Liu, L.; Huang, M.X. Room-Temperature Quenching and Partitioning Steel. Metall. Mater. Trans. A 2018, 49, 3167–3172. [Google Scholar] [CrossRef]
  29. Gouné, M.; Danoix, F.; Allain, S.; Bouaziz, O. Unambiguous carbon partitioning from martensite to austenite in Fe–C–Ni alloys during quenching and partitioning. Scr. Mater. 2013, 68, 1004–1007. [Google Scholar] [CrossRef]
  30. Speer, J.G.; Edmonds, D.V.; Rizzo, F.C.; Matlock, D.K. Partitioning of carbon from supersaturated plates of ferrite, with application to steel processing and fundamentals of the bainite transformation. Curr. Opin. Solid State Mater. Sci. 2004, 8, 219–237. [Google Scholar] [CrossRef]
  31. Pierce, D.T.; Coughlin, D.R.; Clarke, K.D.; De Moor, E.; Poplawsky, J.; Williamson, D.L.; Mazumder, B.; Speer, J.G.; Hood, A.; Clarke, A.J. Microstructural evolution during quenching and partitioning of 0.2C-1.5Mn-1.3Si steels with Cr or Ni additions. Acta Mater. 2018, 151, 454–469. [Google Scholar] [CrossRef]
  32. Edmonds, D.V.; He, K.; Rizzo, F.C.; De Cooman, B.C.; Matlock, D.K.; Speer, J.G. Quenching and partitioning martensite—A novel steel heat treatment. Mater. Sci. Eng. A 2006, 438–440, 25–34. [Google Scholar] [CrossRef]
  33. Speer, J.; Matlock, D.K.; De Cooman, B.C.; Schroth, J.G. Carbon partitioning into austenite after martensite transformation. Acta Mater. 2003, 51, 2611–2622. [Google Scholar] [CrossRef]
  34. Arlazarov, A.; Ollat, M.; Masse, J.P.; Bouzat, M. Influence of partitioning on mechanical behavior of Q&P steels. Mater. Sci. Eng. A 2016, 661, 79–86. [Google Scholar] [CrossRef]
  35. Liu, L.; He, B.B.; Cheng, G.J.; Yen, H.W.; Huang, M.X. Optimum properties of quenching and partitioning steels achieved by balancing fraction and stability of retained austenite. Scr. Mater. 2018, 150, 1–6. [Google Scholar] [CrossRef]
  36. Zurnadzhy, V.I.; Efremenko, V.G.; Wu, K.M.; Petryshynets, I.; Shimizu, K.; Zusin, A.M.; Brykov, M.N.; Andilakhai, V.A. Tailoring strength/ductility combination in 2.5 wt% Si-alloyed middle carbon steel produced by the two-step Q-P treatment with a prolonged partitioning stage. Mater. Sci. Eng. A 2020, 791, 139721. [Google Scholar] [CrossRef]
  37. Chang, L.C.; Bhadeshia, H.K.D.H. Austenite films in bainitic microstructures. Mater. Sci. Technol. 1995, 11, 874–882. [Google Scholar] [CrossRef]
  38. Caballero, F.G.; Bhadeshia, H.K.D.H. Very strong bainite. Curr. Opin. Solid State Mater. Sci. 2004, 8, 251–257. [Google Scholar] [CrossRef] [Green Version]
  39. Duong, V.T.; Song, Y.Y.; Park, K.-S.; Bhadeshia, H.K.D.H.; Suh, D.-W. Austenite in Transformation-Induced Plasticity Steel Subjected to Multiple Isothermal Heat Treatments. Metall. Mater. Trans. A 2014, 45, 4201–4209. [Google Scholar] [CrossRef] [Green Version]
  40. Sugimoto, K.-i.; Hojo, T.; Kobayashi, J. Critical assessment 29: TRIP-aided bainitic ferrite steels. Mater. Sci. Technol. 2017, 33, 2005–2009. [Google Scholar] [CrossRef]
  41. Hasan, S.M.; Ghosh, M.; Chakrabarti, D.; Singh, S.B. Development of continuously cooled low-carbon, low-alloy, high strength carbide-free bainitic rail steels. Mater. Sci. Eng. A 2020, 771, 138590. [Google Scholar] [CrossRef]
  42. Morales-Rivas, L.; Garcia-Mateo, C.; Kuntz, M.; Sourmail, T.; Caballero, F.G. Induced martensitic transformation during tensile test in nanostructured bainitic steels. Mater. Sci. Eng. A 2016, 662, 169–177. [Google Scholar] [CrossRef] [Green Version]
  43. Lee, Y.K.; Han, J. Current opinion in medium manganese steel. Mater. Sci. Technol. 2014, 31, 843–856. [Google Scholar] [CrossRef]
  44. Hu, B.; Luo, H.; Yang, F.; Dong, H. Recent progress in medium-Mn steels made with new designing strategies, a review. J. Mater. Sci. Technol. 2017, 33, 1457–1464. [Google Scholar] [CrossRef]
  45. Luo, H.; Shi, J.; Wang, C.; Cao, W.; Sun, X.; Dong, H. Experimental and numerical analysis on formation of stable austenite during the intercritical annealing of 5Mn steel. Acta Mater. 2011, 59, 4002–4014. [Google Scholar] [CrossRef]
  46. Yang, F.; Luo, H.; Hu, C.; Pu, E.; Dong, H. Effects of intercritical annealing process on microstructures and tensile properties of cold-rolled 7Mn steel. Mater. Sci. Eng. A 2017, 685, 115–122. [Google Scholar] [CrossRef]
  47. Wu, X.; Yang, M.; Yuan, F.; Wu, G.; Wei, Y.; Huang, X.; Zhu, Y. Heterogeneous lamella structure unites ultrafine-grain strength with coarse-grain ductility. Proc. Natl. Acad. Sci. USA 2015, 112, 14501–14505. [Google Scholar] [CrossRef] [Green Version]
  48. Koyama, M.; Zhang, Z.; Wang, M.; Ponge, D.; Raabe, D.; Tsuzaki, K.; Noguchi, H.; Tasan, C.C. Bone-like crack resistance in hierarchical metastable nanolaminate steels. Science 2017, 355, 1055–1057. [Google Scholar] [CrossRef]
  49. He, B.B.; Hu, B.; Yen, H.W.; Cheng, G.J.; Wang, Z.K.; Luo, H.W.; Huang, M.X. High dislocation density–induced large ductility in deformed and partitioned steels. Science 2017, 357, 1029–1032. [Google Scholar] [CrossRef] [PubMed] [Green Version]
  50. Liu, L.; Yu, Q.; Wang, Z.; Ell, J.; Huang, M.X.; Ritchie, R.O. Making ultrastrong steel tough by grain-boundary delamination. Science 2020, 368, 1347–1352. [Google Scholar] [CrossRef]
  51. Tamura, I. Deformation-induced martensitic transformation and transformation-induced plasticity in steels. Met. Sci. 1982, 16, 245–253. [Google Scholar] [CrossRef]
  52. Nagy, E.; Mertinger, V.; Tranta, F.; Sólyom, J. Deformation induced martensitic transformation in stainless steels. Mater. Sci. Eng. A 2004, 378, 308–313. [Google Scholar] [CrossRef]
  53. Vandijk, N.; Butt, A.; Zhao, L.; Sietsma, J.; Offerman, S.; Wright, J.; Vanderzwaag, S. Thermal stability of retained austenite in TRIP steels studied by synchrotron X-ray diffraction during cooling. Acta Mater. 2005, 53, 5439–5447. [Google Scholar] [CrossRef]
  54. Standard, A. E975-03: Standard Practice for X-Ray Determination of Retained Austenite in Steel with Near Random Crystallographic Orientation; ASTM: West Conshohocken, PA, USA, 2003. [Google Scholar] [CrossRef]
  55. Talonen, J.; Aspegren, P.; Hänninen, H. Comparison of different methods for measuring strain induced α-martensite content in austenitic steels. Mater. Sci. Technol. 2013, 20, 1506–1512. [Google Scholar] [CrossRef]
  56. Zhang, J.; Huang, M.; Sun, B.; Zhang, B.; Ding, R.; Luo, C.; Zeng, W.; Zhang, C.; Yang, Z.; van der Zwaag, S.; et al. Critical role of Lüders banding in hydrogen embrittlement susceptibility of medium Mn steels. Scr. Mater. 2021, 190, 32–37. [Google Scholar] [CrossRef]
  57. Liu, L.; He, B.; Huang, M. Processing–Microstructure Relation of Deformed and Partitioned (D&P) Steels. Metals 2019, 9, 695. [Google Scholar] [CrossRef] [Green Version]
  58. Cottrell, A.H.; Bilby, B.A. Dislocation Theory of Yielding and Strain Ageing of Iron. Proc. Phys. Soc. Sect. A 1949, 62, 49–62. [Google Scholar] [CrossRef]
  59. Wilde, J.; Cerezo, A.; Smith, G.D.W. Three-dimensional atomic-scale mapping of a cottrell atmosphere around a dislocation in iron. Scr. Mater. 2000, 43, 39–48. [Google Scholar] [CrossRef]
  60. Li, Y.Z.; Luo, Z.C.; Liang, Z.Y.; Huang, M.X. Effect of carbon on strain-rate and temperature sensitivity of twinning-induced plasticity steels: Modeling and experiments. Acta Mater. 2019, 165, 278–293. [Google Scholar] [CrossRef]
  61. Taylor, G.I. The mechanism of plastic deformation of crystals. Part I.—Theoretical. Proc. R. Soc. Lond. Ser. A Contain. Pap. Math. Phys. Character 1934, 145, 362–387. [Google Scholar] [CrossRef]
Figure 1. Equilibrium phase fraction of studied steel at different temperatures calculated by Thermo-Calc.
Metals 11 00356 g001
Figure 2. Schematic illustration of the thermomechanical process for producing deformed and partitioned (D&P) steel.
Metals 11 00356 g002
Figure 3. Optical micrographs showing the initial microstructures of the hot rolling (HR) + warm rolling (WR) sample (a1,a2) and the HR + WR + intercritical annealing (IA) + cold rolling with 25% thickness reduction (CR25%) + partitioning at 400 °C (PT400) sample (b1,b2). RD: rolling direction, ND: normal direction. M: martensite, RA: retained austenite.
Metals 11 00356 g003
Figure 4. Electron backscatter diffraction (EBSD) maps showing the initial microstructures of the HR + WR sample (a1a4) and HR + WR + IA + CR25% + PT400 sample (b1b4). Therein, (a1,b1) are the phase maps showing the phase distribution of the two samples. (a2,b2) are the inverse pole figure (IPF) maps showing the grains orientations of the two samples. (a3,b3) are the maps of geometrically necessary dislocation (GND) density, estimated based on the kernel average misorientation. (a4,b4) are the band contrast maps showing image quality of the mapping. RD: rolling direction, ND: normal direction. γ: austenite, α′: martensite.
Metals 11 00356 g004
Figure 5. (a) XRD profiles of the HR + WR sample before deformation and after fracture, normalized to (111) γ. (b) XRD profiles of the HR + WR + IA + CR25% + PT400 sample before deformation and after fracture, normalized to (220) γ. (c) Volume fraction of austenite of HR + WR sample and HR + WR + IA + CR25% + PT400 sample before deformation and after fracture.
Metals 11 00356 g005
Figure 6. (a) Engineering stress–strain curves of HR + WR sample and HR + WR + IA + CR25% + PT400 sample. (b) The corresponding true stress–strain curves (solid line) and the work hardening rate curves (dotted line).
Metals 11 00356 g006
Figure 7. (a) Engineering stress–strain curves of the HR + WR sample and HR + WR + IA sample. (b) The enlarged engineering stressstrain curve of the rectangle in (a).
Metals 11 00356 g007
Figure 8. EBSD maps showing the initial microstructures of the HR + WR + CR20% + PT350 sample. (a) Phase map showing the distribution of martensite phase (red color) and retained austenite phase (blue color). (b) IPF map showing the grains orientations of the sample. (c) The map of GND density estimated based on the kernel average misorientation. (d) Band contrast map showing image quality of the mapping. RD: rolling direction, ND: normal direction. γ: austenite, α′: martensite.
Metals 11 00356 g008
Figure 9. (a) Engineering stress–strain curves of the HR + WR + IA + CR25% + PT400 sample and the HR + WR + CR20% + PT350 sample. (b) The corresponding true stress–strain curves (solid line) and work hardening rate curves (dotted line).
Metals 11 00356 g009
Figure 10. (a) Engineering stress–strain curves of HR + WR + IA + CR25% + PT400 sample, HR + WR + CR20% + PT350 sample, and corresponding samples without the partitioning process. (b) Uniform elongation versus yield strength for samples in (a), the yield strength is determined as the upper yield point for D&P samples, the square dots represent samples without partitioning process, the circular dots represent samples with partitioning process, the colors in (b) are in consistent with colors in (a).
Metals 11 00356 g010
Figure 11. (a) Engineering stress–strain curves of the HR + WR + IA + CR25% + PT samples with the partitioning temperatures (PT) set as 350 °C, 400 °C, 450 °C, 500 °C, respectively. (b) Uniform elongation versus yield strength for samples in (a), the yield strength is determined as the upper yield point for D&P samples, the colors in (b) are in consistent with colors in (a).
Metals 11 00356 g011
Figure 12. (a) Engineering stress–strain curves of the HR + WR + CR samples with different cold rolling thickness reductions (0% to 35%), with and without the partitioning process. (b) Uniform elongation versus yield strength for samples in (a), the square dots represent samples without partitioning process, the circular dots represent samples with partitioning process, the colors in (b) are in consistent with colors in (a). (c) The evolution of yield strength with the cold rolling thickness reduction. (d) The evolution of the volume fraction of austenite with the cold rolling thickness reduction. (The yield strength is determined as the upper yield point for D&P samples).
Metals 11 00356 g012
Table 1. The average GND densities of austenite and martensite in three typical samples.
SampleAusteniteMartensite
HR + WR0.9 × 1015 m−21.6 × 10¹⁵ m−2
HR + WR + IA + CR25% + PT4001.5 × 1015 m−22.0 × 10¹⁵ m−2
Publisher’s Note: MDPI stays neutral with regard to jurisdictional claims in published maps and institutional affiliations.

