Abstract
In vertical continuous casting machines the liquid steel from the tundish is poured into the mold through the Submerged Entry Nozzle (SEN). The shape and direction of the SEN exit jets affect the liquid steel dynamics inside the mold. This work quantifies the effect of the SEN pool on the principal characteristics of the jets emerging from it, precisely, the shape, the spread angles, and the mold impact point. Experimental and numerical simulations were carried out using a SEN simplified model, a square-shaped bore nozzle with square-shaped outlet ports whose length is minimal. These experiments showed two well-defined behaviors. When a single vortex dominates the hydrodynamics inside the simplified SEN, the exit jets spread out and are misaligned about the mold’s central plane. On the contrary, when the inner flow pattern shows two vortexes, the exit jets are compact and parallel to the mold wide walls. The measured difference on the jet’s falling angles is 5°, approximately, which implies that in an actual casting machine, the impingement point at the narrow mold wall would have a variation of 0.150 m. This hydrodynamic analysis would help design new SENs for continuous casting machines that improve steel quality.
1. Introduction
Many authors have studied the hydrodynamic behavior of the continuous casting process for standard slabs for several decades. Most of the studies focus on measuring the flow pattern within the mold since the thermodynamic properties of the slab are determined by the solidification process’s homogeneity. Solidification, in turn, is influenced by the shapes of the jets exiting the Submerged Entry Nozzle (SEN). Some of these authors have recently proposed methodologies to improve the visualization of phenomena and measure important physical variables of the process [1]. For example, to explore the influence of the SEN immersion depth on the surface oscillations in a 1:1 scaled model of the mold, Saldaña-Salas et al. [2] used vegetable oil as a surface tracer and colorant dispersion technique. In some cases, physical experiment and numerical simulation results could be compared and validated with plant measured quantities [3]. To understand the internal hydrodynamic behavior of the flow exiting the nozzle into the mold numerous experiments used air bubbles injected into the water stream of scaled models [4]. The air bubbles trajectories and their distribution were compared with argon bubbles inside the continuous casting slab mold and show consistent results between experiments and numerical simulations [5].
The majority of the physical experiments and numerical simulations are made using scaled models of the continuous casting machines. Particularly, numerical simulations require many mesh elements to reproduce both SEN and the mold because of the system’s size.
An essential part of the continuous casting machines is the submerged entry nozzle (SEN), whose purpose is to supply liquid steel into the mold continuously. The SEN has a peculiar geometric design to produce a desired liquid steel flow behavior inside the mold [6,7]. The useful life of these nozzles is relatively short. In some cases, the SEN must be changed up to four times per every casting cycle [8]. The high temperature of the liquid steel circulating inside the tundish induces non-metallic impurities accumulation on the nozzle’s inner walls and gradually clogs it [9,10]. Also, liquid steel flowing at high-velocity induces vortices inside the SEN that intensify shear stresses over its interior walls. This flow erodes the walls, causing the SEN deformation. Clogging and erosion phenomena change the internal flow of the SEN, which in turn modifies the hydrodynamic pattern inside the mold of continuous casting [11].
Several experimental and numerical techniques have been used for studying hydrodynamics inside the SEN. For example, Fang et al. [7] investigated through simulations of turbulent thermal flow the solidification process inside the SEN with two and four exit ports. They found that the four ports SEN oriented to the corners of the mold produce minimal level oscillations, and the solidified shell-thinning phenomenon was eliminated. The importance of the turbulence model on the numerical reconstruction of the flow behavior in the SEN was explored by Real et al. [12], showing that the Large Eddy Simulations (LES) model can reproduce the quasi-periodic vortex interaction observed in the experiments by Real et al. [13]. Furthermore, in order to produce a more homogeneous steel in bloom casting some modifications to the internal geometry of the SEN have been proposed to promote a swirling flow of the liquid steel ejected from the nozzle [14,15]. Moreover, studies have been carried out to analyze the effects of the angle of the exit port of the nozzle and the submergence depth of the SEN on the surface level fluctuations [16]. Special attention has been paid to developing different internal forms of nozzles and the configurations of the exit ports such as investigated by Chatterjee [17] and Xu and Zhu [18]. Gonzalez et al. [19] showed that bottom well depth is the main factor that defines the zones of reverse flows for a simplified model of the SEN. These authors showed that their SEN with a bottom well forms a single pronounced vortex occupying a large area of the exit orifices, while the SEN without a bottom well develops a dynamic flow behavior with two counter-rotating vortices.
This work extends the study presented in Reference [19] by analyzing the influence of the SEN inner flow hydrodynamics on the shape and characteristics of jets emerging from it. The SEN considered in this work is a simplified model, named Nozzle Internal Prototype (NIP), which has geometrical dimensions that satisfy the Froude similarity criterion. This prototype is based on a bifurcated nozzle employed in typical vertical continuous casting machines of steel slabs. Two NIP inner designs were studied under the assumption that the presence of a bottom well induces different SEN hydrodynamic behaviors. We found that each NIP design produces output jets with distinct characteristics. When a single vortex dominates the NIP inner flow pattern, the exit jets are spread and misaligned from the mold central plane. On the contrary, the NIP with two vortices inner flow pattern produces exit jets that are compact and parallel to the mold wide walls. The difference in the shape of the SEN outlet jets has several repercussions, for instance: the positions or zones where each jet impacts inside the mold; uneven mold heat redistribution; and undesirable reduction of the semi-solidified steel shell thickness and excessive trapping of the slag floating on the top of the mold. Therefore, it is of the utmost importance to design a SEN that provides smooth, regular, and narrow liquid steel jets at the exit of their ports that contribute to better steel quality and reduce operational costs.
2. Experimental Setup and Mathematical Model
2.1. NIP Geometry and Dimensions
The analysis presented in this work is accomplished through numerical and physical simulations using scaled models whose geometric dimensions were defined according to similarity criteria that guarantee coincidence between the liquid steel dynamics in current steel making plants and the hydrodynamics of the cold water model. In the continuous casting process, the fluid flow pattern inside the mold is dominated mainly by inertial and gravitational forces. Therefore, the fluid flow behavior inside both the current system and the scaled model will be comparable when Reynolds and Froude similarity criteria are simultaneously satisfied. Nevertheless, the Reynolds similarity criterion can be obviated given that the flow regime inside the nozzle is considered fully turbulent.
The Froude similarity criterion requires equality of the ratios of momentum and gravity forces for the real system and the scaled model, i.e.,
In the equation above, Fr is the Froude number, U is the characteristic velocity, L is the characteristic length, and g is the gravitational constant. The subindexes W and S refer to the cold water scaled model and the actual steel slab continuous casting nozzle, respectively.
In typical continuous casting machines, the mold width ranges from 2.0 m to 2.5 m, and its thickness ranges from 0.16 m to 0.30 m. Based on the Froude similarity criterion, the NIP models studied in this work were designed by scaling down an actual SEN, and its volumetric inlet flow is set as 4.0 × 10⁻⁴ m3/s. Therefore, the casting speed is 1.2 m/min for a 0.50 m × 0.04 m cross-section scaled mold.
Table 1 summarizes the main geometric features and dimensions of the two models analyzed in this work. As a reference point, this table also describes the models previously reported in the literature.

Table 1.
Geometric characteristics and volumetric flow comparison between different nozzle scaled models.
Figure 1 sketches the geometric features of the two nozzles studied in this work. The NIP is a box-type nozzle whose internal bore has a square cross-section that remains constant throughout its entire length. The NIP has two square-shaped outlet ports whose length is minimal. This figure also outlines the internal structure of each NIP through blue lines, and gray-filled surfaces depict the walls of their corresponding physical model. The shape of the nozzles’ bottom wall is flat. The sum of areas of the exit ports is equal to the nozzle bore area. The bottom well depth is half the height of the exit ports for a type A NIP. In this figure, the NIP exit ports, inlet, and pool zone are colored, respectively, in green, red, and yellow. This figure also includes the NIP dimensions.
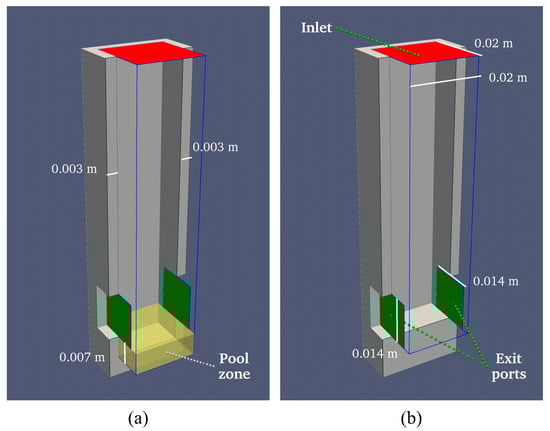
Figure 1.
Geometry of the models studied in this work: (a) Nozzle with a bottom well, type A Nozzle Internal Prototype (NIP) and (b) Nozzle without a bottom well, type B NIP.
2.2. Physical Simulations Setup and Operating Conditions
Figure 2 sketches the two experimental configurations employed to investigate how the presence of the bottom well affects the hydrodynamic behavior inside the NIP and, consequently, its influence in the mold recirculation zones. The NIP was placed inside a water scaled model of a continuous casting mold to characterize the exit jets main properties. Additionally, the NIP was operated inside a visualization cell to record the water flow pattern inside it.
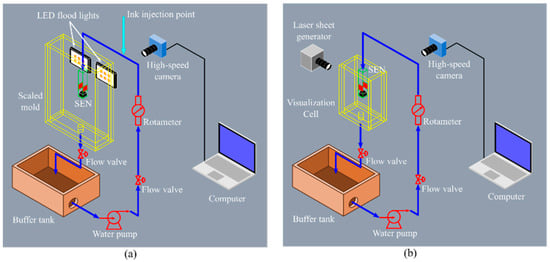
Figure 2.
Schematic representation on the two experimental configurations studied in this work: (a) NIP operating inside a scaled mold model and (b) NIP operating inside a visualization cell.
The cold water scaled model of the continuous casting mold is a brick with a cross-section 0.500 m × 0.070 m and 1.1 m of height built with Plexiglas (see Figure 2a). Two operation modes were employed in this configuration. In the first one, the NIP discharges freely to the atmosphere. Following Gupta and Lahiri [21], this configuration allows visualizing with the naked eye crucial process phenomena, such as the shape, size, and direction of the outlet jets. In the other operation mode, the NIP discharges into the scaled model filled with water. The visualization of the NIP exit jets features was done employing ink injections. Tests with different NIP submergence depths were carried out in a range from 0.070 to 0.011 m. The NIP outlet jets were recorded using a 9501AZ High-Speed Camera (AZ Instrument Corp., Taichung City, Taiwan), with a Computar M6Z1212-3S lens (Computar, Tokyo, Japan). Considering the focal length of the lens, the distance between the NIP central plane and camera external lens was 1.1 m. Each one of the NIP exit jets was illuminated with an LED floodlight of 2700 lumens. Based on the Froude similarity criterion, NIP dimensions, and NIP inlet velocity, the required mold thickness to attain a casting speed of 1.2 m/s is 0.04 m. This experimental configuration is mainly intended to measure jets fall angles and jets spread angles. Therefore, we used a thicker mold to ensure that the zones where jets hit the mold’s wide walls are as far away as possible from the nozzle.
The visualization cell employed in this work is a prism with a square-shaped section of 0.15 m per side and a height of 0.5 m built with Plexiglass (see Figure 2b). In this configuration, the NIP discharges into the cell filled with liquid, and the submergence depth was 0.15 m. The fluid flow pattern inside the cell is recorded by employing a CASIO EX-F1 camera (CASIO, Tokyo, Japan). through the “light painting” approach, a photography technique that records the movement of a light source by taking a long exposure photo. In this case, hollow glass particles designed for PIV studies were illuminated by a green laser of 3 W continuous wave power, which generates a plane with a thickness of 0.001 m [19].
2.3. Numerical Simulations Setup
The governing equations of the fluid flow motion for incompressible fluid flow are the Navier–Stokes equations:
where is the fluid velocity vector, is the pressure, is the density, is the kinematic viscosity of the fluid, is the gravity and is the turbulent viscosity of the fluid.
Previously, Real et al. [12] compared the predictions of the fluid flow patterns inside a bifurcated SEN using the and the Large Eddy Simulations (LES) turbulence models. The authors found that the model fails to recover the transient behavior observed experimentally inside the SEN. On the other hand, Shukla and Dewan [22] found that WALE and dynamic -equation SGS models showed the best results in complex flow regions. Based on the preceding arguments, the transient numerical simulations presented in this work were carried out with an LES turbulence model including the dynamic -equation SGS model as scale filtering. The OpenFOAM CFD toolbox was employed to solve the governing equations. The toolbox offers several methods to address the pressure-velocity coupling. In this work the PISO (Pressure Implicit with Split Operator) method was employed. Table 2 reports the boundary conditions for the mathematical model along with the thermophysical properties of the employed fluid.
Table 2.
Mathematical model boundary conditions and fluid thermophysical properties.
The convergence criterion is fulfilled when residuals for all the modeled variables reached values equal or smaller than 1.000 × 10⁻⁵ at the same time step. Numerical simulations were conducted for several seconds such that they fully capture different flow timescales. These transient simulations reveal random fluctuations around a nominal hydrodynamic behavior established after 3 s from the beginning of the simulation. Therefore, the results presented in the Results section are temporal averages of transient simulations over a two seconds period.
3. Results
Figure 3 reports the fluid flow pattern inside the two NIP types obtained through physical and numerical simulations. Figure 3a–c belongs to type A NIP, the design with a bottom well, whereas Figure 3d–f corresponds to type B NIP.
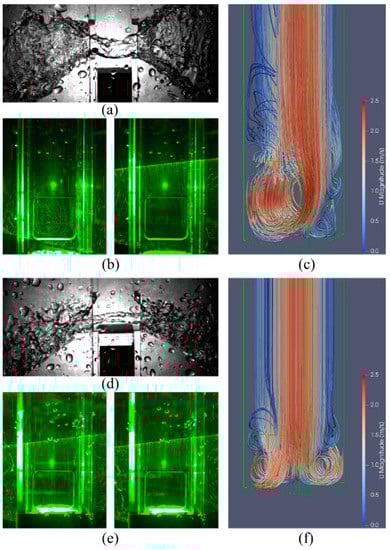
Figure 3.
Hydrodynamic behavior inside the nozzle: (a,b) Physical simulations of type A NIP; (c) Numerical simulations of type A NIP; (d,e) Physical simulations of type B NIP; and (f) Numerical simulations of type B NIP.
Figure 3a,d is representative experimental results when the two NIP designs operate inside the scaled mold and freely discharge the liquid to the atmosphere. These images also show the jets emerging from the NIP at the initial stage. A detailed analysis of the jets will be carried out later, but it can be observed that the presence of the pool at the bottom of the NIP induces a noteworthy change in the initial shape of the exit jets.
Figure 3b,e shows two photographs of each of the streamlines on the NIP central plane generated using the light painting technique. These figures were taken operating each NIP inside the visualization cell filled with water. Glass particles illuminated by the laser sheet depicts the fluid flow pattern at the NIP bottom zone and in the zone above the NIP outlet ports.
Physical simulations show that the fluid flow patterns generated inside both NIP types promote well-defined fluid rotation zones. The fluid motion associated with a rotation zone (vortex) creates a dynamic pressure that is lowest in the core region. Therefore, the low-pressure zone near the vortex core could allow fluid surrounding the NIP to enter through this zone. Consequently, when the two NIP designs freely discharged the liquid to the atmosphere, the air entering into the NIP makes visible the rotation zones. The type A NIP promotes a fluid flow pattern characterized by one large recirculation zone, whereas, two small recirculation zones characterize the hydrodynamics inside the type B NIP. High-speed video recording of physical simulations reveals that the shape of each of the recirculation zones continually changes, however, the presence of the recirculation zones is always distinguishable.
The hydrodynamic behavior inside both NIP designs obtained through numerical simulations is shown in Figure 3c,f. This figure shows several streamlines of the liquid flowing through the NIP. The NIP inner volume corresponding with the quarter closest to the reader was erased to visualize the nozzle hydrodynamics better. With this approach for presenting numerical simulation results, the fluid rotation zones become visible. The streamline color is proportional to the velocity magnitude at that point.
Figure 3c shows that for type A NIP, the vortex core is located between the middle and one of the outlet ports’ lateral edges. Several works report that this misalignment induces an asymmetric fluid flow pattern inside the mold due to the way jets impact the wide walls. Transient numerical simulations showed that, rarely, the vortex forms at the same height but on the opposite side. The vortex remains only briefly in this position, for just 0.2 s or less. Additional aspects of the hydrodynamic behavior inside the NIP can be consulted in [19].
Results presented in Figure 3 and their discussion constitute a qualitative analysis of the hydrodynamics in the zone near the NIP exit ports. We proceed now with a quantitative analysis of the fluid velocity vector field inside the NIP presented in Figure 4.
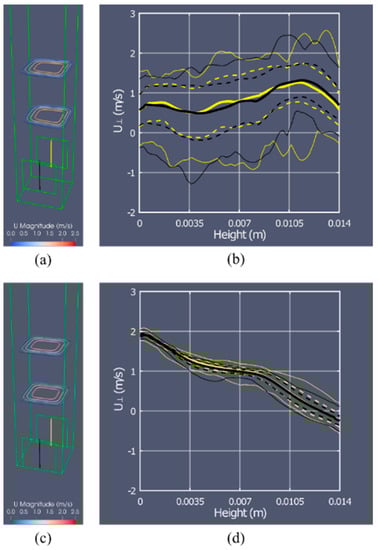
Figure 4.
Fluid velocity structure inside the nozzle: (a) Velocity magnitude contours for type A NIP; (b) Time averaged port-perpendicular velocity components along both ports for type A NIP; (c) Velocity magnitude contours for type B NIP; (d) Time averaged port-perpendicular velocity components along both ports for type B NIP. Panels (a,c) also show the paths (black and yellow lines) along which the velocity profiles shown in panels (b,d) were extracted. See the text for details.
Figure 4a,b reports the results for type A NIP, whereas Figure 4c,d shows type B NIP results. Figure 4a,c has the same structure. Each figure plots some velocity magnitude contours on two planes parallel to the NIP bottom wall. Let us define the height of the outlet port bottom edge as 0.000 m. With this reference, the heights of the two planes are, respectively, 0.040 and 0.060 m. The planes are then located, respectively, at one and two equivalent diameters above the outlet ports. Comparison of the velocity magnitude contours shows that the velocity profiles are similar at these two heights. Figure 4a shows that, for type A NIP, the velocity profile is asymmetric with respect the axis perpendicular to the outlet ports and is symmetric on the other axis. On the other hand, the velocity profile is symmetric with respect to both axes for the NIP without a bottom well (type B).
Figure 4a,c also shows two trajectories (black line and yellow line) along which statistical analysis of the liquid velocity at the outlet ports was made. The analysis results are reported in Figure 4b for type A NIP and in Figure 4d for type B NIP.
Figure 4b,d has the same structure and show the velocity components perpendicular to port along the paths defined by the black and yellow lines in Figure 4a,b. The velocity component sign is positive for the flow leaving the NIP, whereas the negative sign indicates the flow entering the NIP. Thick curves represent the time-averaged velocity components. Dashed and thin curves show, respectively, one-sigma deviations from the mean values and the maximum and the minimum reached values. As expected, the behavior of the liquid at the outlet ports is entirely dissimilar for types A and B nozzles.
The velocity values calculated numerically have a large dispersion for type A NIP. The band defined by the minimum and maximum values and the band defined by the standard deviation are too broad. The results do not show a clear dependence between average transverse speed and height. Average values are always positive, which would imply that the liquid flow always points out of the NIP in the middle of the port. However, the minimum values and the standard deviation suggest a reverse flow zone at a height close to 0.0035 m, a quarter of the port’s height.
Figure 4d shows that the statistical dispersion of the velocity values at the middle of the NIP type B outlet ports is low. This figure also exposes several trends. The statistical dispersion of the velocity magnitudes increases as the height increases too. The dependence of the perpendicular velocity magnitude and the height is almost linear. Higher values for the outflow velocity are located near the NIP bottom and decrease as the height increases. This figure also reveals a reverse flow zone near the outlet port upper edge, which coincides with physical simulation observations.
The flow behavior shown in Figure 4 has significant implications for the casting process where the SEN wall erosion is critical. The upper and bottom edges of the outlet ports will be eroded evenly for the type A NIP. For the NIP without a bottom well, the erosion on the lower edge of the outlet port will be more significant than the erosion on the other edges due to induced stresses.
As it was shown above, vortices modify the outflow structure and determine the jet’s shape. Since our numerical models do not explicitly simulate the jets we compute their features indirectly. In order to quantify the flow structure near the exit ports we calculated the time-averaged velocity components and turbulent kinetic energy for each mesh element along two planes. These planes are placed 0.500 mm from the exits toward the interior of the NIP. The averaging was done using Equation (4), where the time instances considered in two seconds were m = 40.
The averaged values are then used to construct the corresponding velocity vector field and values which are shown in Figure 5. The vectors length is proportional to the velocity magnitude and their color is mapped by value. The analysis of this figure provides several hints on the flow behavior.
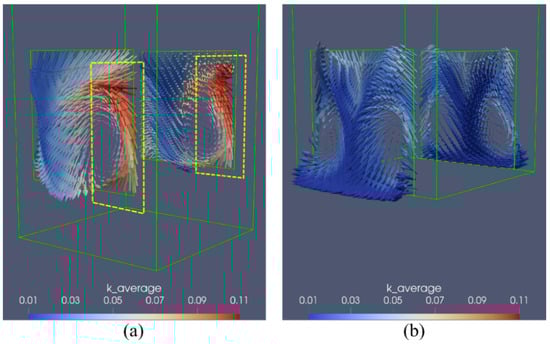
Figure 5.
Hydrodynamic behavior at the exit ports. (a) Type A NIP and (b) Type A NIP. The length of the vectors is proportional to the velocity magnitude and their color is given by value of average . Yellow dashed boxes outline highly turbulent regions of the flow directed upwards.
For the type A NIP (with a bottom well), the single vortex promotes two distinct flow directions on each outlet port. The flow is predominantly directed downwards, but a highly turbulent flow is directed upwards in a zone near a lateral edge. The zone where the flow is directed upwards was outlined as a yellow dashed rectangle. The bottom well causes strong stresses on the NIP’s bottom that reflect the flow upwards and against the main descending flow, causing strong momentum mixing and turbulent flow.
On the other hand, Figure 5b shows that the fluid flow pattern at the outlet ports is characterized by much symmetric and less turbulent flow for the type B NIP. Also, it can be observed that high-velocity vectors outline two vortex cones along which the main outflow happens. The downward flow occurs in the middle of the ports, while upward directed flow is observed on the borders. These findings agree with the averaged velocity profiles shown in Figure 4.
Another experiment was carried out to investigate the nozzle outlet jets’ properties. In these experiments, the nozzles operated inside the scaled mold discharging the water into the air. Analysis of the flow outside the NIP is made by taking high-speed video recordings of the emanating jets along a time-lapse of 4.5 s. Figure 6 and Figure 7 show the captures of the jets for type A and B nozzles, respectively. These two figures have the same structure. The panel at the bottom of the figures shows the superposition of the ten frames above it. This approach allows us to outline the exterior shape and measure the aperture of the jet. The shape and the transient dynamic behavior (oscillations) of the jets may be related to the NIP’s inner hydrodynamics.
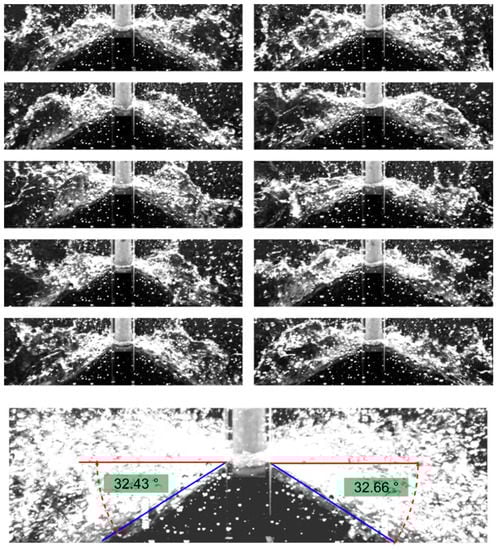
Figure 6.
The top panels show photographs of water jets discharged (ejected) from the type A NIP taken at 0.5 s intervals. The bottom panel shows the superposition of the ten photographs above it and also shows the angles formed between the jets inferior contour (blue) and the line perpendicular to the ports (red).
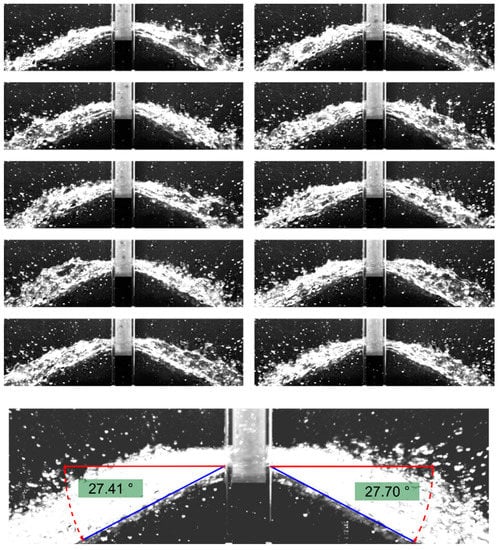
Figure 7.
The top panels show photographs of water jets discharged (ejected) from the type B NIP taken at 0.5 s intervals. The bottom panel shows the superposition of the ten photographs above it and also shows the angles formed between the jets inferior contour (blue) and the line perpendicular to the ports (red).
The jets produced by type A NIP are very irregular, wide open, and disruptive on its upper section. In contrast, for the type B NIP, the jets are narrow, regular, and with little scattering. Quantifying the difference in the jets’ apertures is accomplished by measuring the angle between the jets’ lower part and a horizontal baseline. The resulting angles shown in Figure 6 and Figure 7 differ by roughly 5°, being steeper for the type A NIP.
In order to find the correspondence between the velocity field inside the NIP and jets’ aperture angles measured in the experiments, we calculated weighted average velocity components over the same plane used for time averaging in Equation (4). In addition, we calculated the average turbulent kinetic energy that characterizes the outflow turbulence [23,24]. The weighted average is performed over all elements with surfaces dS on the plane S as given by Equation (5).
The mean vertical and horizontal jet spread angles and , defined in Figure 8, are calculated using Equation (6).
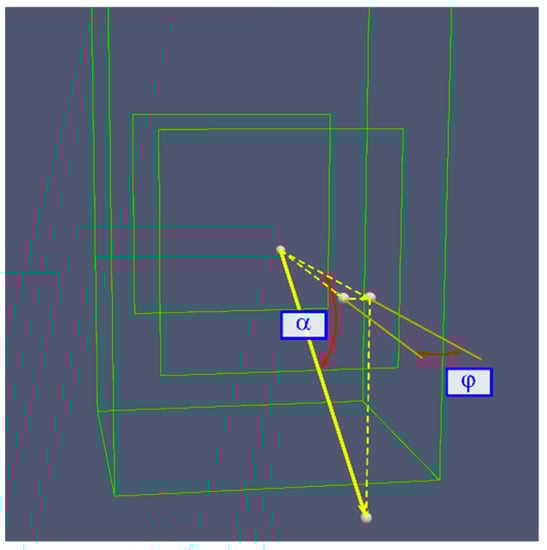
Figure 8.
The angles used to characterize the outflow spread in vertical () and horizontal () directions. These are measured with respect to the port normal vector which is parallel to the x axis.
Table 3 summarizes the computed quantities. As can be noted, the horizontal spread of the jets is quite small, especially for the type A NIP, where the jets are almost parallel to the NIP walls. The downward spreading angles in both cases coincides very well with those measured in Figure 6 and Figure 7.
Table 3.
Average turbulent kinetic energy and velocity direction angles for the two different nozzles.
A first analysis of the jets emerging from the NIP was carried out in the experiment described previously. An additional experiment was carried out in order to extend the analysis of the jets produced by the NIP. In this new experiment, the scaled mold is now filled with water to a certain level above the NIP outlet ports. A certain amount of ink is injected into the stream entering the NIP to make visible the jets emerging from the NIP. A colored screen was placed on the back of the mold to improve the visual definition of the jets. Two combinations were used, white ink with a black screen and black ink with a white screen.
Figure 9 presents some results of these experiments for the type A NIP. The specialized software, PIVlab [25], was used to estimate the fluid velocity vector field around the NIP. PIVlab is a Matlab toolbox that calculates velocities in image data. The recorded images of the initial stage of ink entry into the mold were used to estimate the velocity vector field. We found that the combination of white ink and a black screen provides the most realistic estimates.
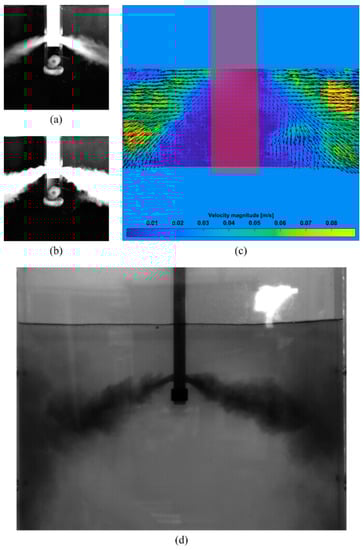
Figure 9.
Visualization of the hydrodynamic behavior inside the mold by using ink injections. Panels (a,b) show the initial stages of ink entry into the mold for the type A NIP. Panel (c) shows the estimated velocity vector field for the test presented in panels (a,b). Panel (d) shows the entire shape of the jets emerging from the type A NIP.
Figure 9a,b has two representative samples of the processed images, whereas Figure 9c shows the estimated velocity vector field. The submergence depth is defined as the distance measured from the outlet port bottom edge to the water surface level. The submergence depth in this experiment was 0.07 m. The fluid flow pattern and the liquid velocity magnitudes shown in Figure 9c agree with the expected behavior. The submergence depth for the test presented in Figure 9d was increased to 0.11 m. The combination of black ink and a white screen was used because it improves the visualization of the jets’ features and the zones where jets hit the mold’s narrow walls. Figure 9b,c show that jets produced by type A NIP are not symmetric. Likewise, these figures confirm that the jets’ amplitude decreases when the NIP discharges into the water instead of discharging into the atmosphere.
Another surprising result arises from the analysis of Figure 9b,d. The jet in the right-hand side of these figures depicts a jagged fluid flow pattern named “staircase-shaped”, widely studied in the literature. Those works affirm that the flow distortion caused by the sliding gate between the tundish and the SEN causes this pattern (see Thomas et al. [1] for example). These authors conclude that the staircase-shaped pattern promotes inclusion of slag particles and bubble entrapment, both of which are responsible for defects in the final product.
4. Conclusions
This research presents experimental falling angle measurements of the jets emerging from two prototypes of a Submerged Entry Nozzle, named NIP. The difference between the two prototypes is the presence of a pool at the bottom of the nozzle. The type A NIP (with the bottom well) jets’ falling angle is about −32.5°, whereas the falling angle for the type B NIP is −27.6°, approximately. The difference between these angles is small, about 5°. However, the difference between the jets’ falling angles could modify the height at which the exit jets impact the mold’s narrow face. For example, consider a 2.5 m wide industrial mold. The difference between the impact heights of the jets with the mold narrow faces could be approximately 0.150 m. The exit jets experimental analysis shows that the upwards component is bigger for the nozzle with the bottom well. This behavior could intensify two undesirable phenomena: slag entrapment and meniscus level oscillations. The exit jets’ characteristics were analyzed by operating the nozzles inside the mold and discharging the liquid freely into the atmosphere. When nozzles operate inside the mold filled with fluid, we observe a reduction in the jets’ spread. However, the observed behavior agrees with the angles estimated with numerical simulations.
Characterization of flow dynamics inside the SEN and the jet features has important implications for the metallurgic industry. For example, high-velocity vortexes inside the SEN intensify shear stresses on the interior walls and reduce the nozzle lifetime. On the other hand, the shape and direction of the SEN jets strongly affect the liquid steel dynamics inside the mold. In particular, the degree of collimation of the jet influences the distance it can reach without dissipation, and its asymmetry induces shear stresses on the mold wide walls. Furthermore, the horizontal jet aperture angle, , determines the zone where jets hit the mold’s narrow walls. In summary, operating the continuous casting process effectively requires smooth, narrow, and symmetric jets, which, as we showed in the present work, is mostly determined by the flow dynamics inside the SEN.
Author Contributions
Conceptualization, J.G.-T., C.A.R.-R., and J.R.M.-T.; methodology, J.G.-T., C.A.R.-R., J.R.M.-T., and I.C.-M.; physical simulations, J.G.-T., F.C.-d.-l.-T., F.S.-S., and J.R.M.-T.; numerical simulations, J.G.-T., F.C.-d.-l.-T., and R.G.; writing—original draft preparation, J.G.-T., C.A.R.-R., J.R.M.-T., R.G., and I.C.-M.; supervision, J.G.-T., C.A.R.-R., and I.C.-M.; funding acquisition, C.A.R.-R., I.C.-M., F.S.-S., and J.R.M.-T. All authors have read and agreed to the published version of the manuscript.
Funding
This work was partially supported by Universidad Autonoma Metropolitana, grant number 22703022, PRODEP, grant number 22711777, and Instituto Politecnico Nacional, grant number SIP-20201315.
Institutional Review Board Statement
Not applicable.
Informed Consent Statement
Not applicable.
Data Availability Statement
The data presented in this study are available on request from the corresponding author.
Acknowledgments
Numerical simulations were done using OpenFOAM v6, the OpenFOAM Foundation. Visualizations of numerical simulations were done using ParaView v5.6.1.
Conflicts of Interest
The authors declare no conflict of interest.
References
- Thomas, B.G.; Yuan, Q.; Sivaramakrishnan, S.; Shi, T.; Vanka, S.P.; Assar, M.B. Mathematical Modeling of Iron and Steel Making Processes. Comparison of Four Methods to Evaluate Fluid Velocities in a Continuous Slab Casting Mold. ISIJ Int. 2001, 41, 1262–1271. [Google Scholar] [CrossRef]
- Saldaña-Salas, F.; Torres-Alonso, E.; Ramos-Banderas, J.; Solorio-Díaz, G.; Hernández-Bocanegra, C. Analysis of the Depth of Immersion of the Submerged Entry Nozzle on the Oscillations of the Meniscus in a Continuous Casting Mold. Metals 2019, 9, 596. [Google Scholar] [CrossRef]
- Yang, W.; Luo, Z.; Gu, Y.; Liu, Z.; Zou, Z. Simulation of bubbles behavior in steel continuous casting mold using an Euler-Lagrange framework with modified bubble coalescence and breakup models. Powder Technol. 2020, 361, 769–781. [Google Scholar] [CrossRef]
- Chen, W.; Zhang, L. Effects of Interphase Forces on Multiphase Flow and Bubble Distribution in Continuous Casting Strands. Metall. Mater. Trans. B 2021, 52, 528–547. [Google Scholar] [CrossRef]
- Wang, Y.; Fang, Q.; Zhang, H.; Zhou, J.; Liu, C.; Ni, H. Effect of Argon Blowing Rate on Multiphase Flow and Initial Solidification in a Slab Mold. Metall. Mater. Trans. A 2020, 51, 1088–1100. [Google Scholar] [CrossRef]
- Cho, S.-M.; Thomas, B.G.; Kim, S.-H. Effect of Nozzle Port Angle on Transient Flow and Surface Slag Behavior During Continuous Steel-Slab Casting. Metall. Mater. Trans. B 2018, 50, 52–76. [Google Scholar] [CrossRef]
- Fang, Q.; Ni, H.; Zhang, H.; Wang, B.; Song, X.; Liu, C. Influence of SEN on Flow, Solidification, and Solute Transport in Bloom Casting Mold. JOM 2018, 70, 719–725. [Google Scholar] [CrossRef]
- Zhang, J.; Wang, L.; Han, M.-R.; Hwang, W.-S. Automatic Control of Slag Line for Submerged Entry Nozzle (SEN). Metallurgist 2017, 60, 916–922. [Google Scholar] [CrossRef]
- Mohammadi-Ghaleni, M.; Zaeem, M.A.; Smith, J.D.; O’Malley, R. Computational Fluid Dynamics Study of Molten Steel Flow Patterns and Particle–Wall Interactions Inside a Slide-Gate Nozzle by a Hybrid Turbulent Model. Metall. Mater. Trans. B 2016, 47, 3056–3065. [Google Scholar] [CrossRef]
- Barati, H.; Wu, M.; Kharicha, A.; Ludwig, A. A transient model for nozzle clogging. Powder Technol. 2018, 329, 181–198. [Google Scholar] [CrossRef]
- Srinivas, P.S.; Singh, A.; Korath, J.M.; Jana, A.K. A water-model experimental study of vortex characteristics due to nozzle clogging in slab caster mould. Ironmak. Steelmak. 2017, 44, 473–485. [Google Scholar] [CrossRef]
- Real, C.; Miranda, R.; Vilchis, C.; Barron, M.; Hoyos, L.; Gonzalez, J. Transient Internal Flow Characterization of a Bifurcated Submerged Entry Nozzle. ISIJ Int. 2006, 46, 1183–1191. [Google Scholar] [CrossRef][Green Version]
- Real-Ramirez, C.A.; Carvajal-Mariscal, I.; Sanchez-Silva, F.; Cervantes-De-La-Torre, F.; Diaz-Montes, J.; Gonzalez-Trejo, J. Three-Dimensional Flow Behavior Inside the Submerged Entry Nozzle. Metall. Mater. Trans. B 2018, 49, 1644–1657. [Google Scholar] [CrossRef]
- Schurmann, D.; Willers, B.; Hackl, G.; Tang, Y.; Eckert, S. Experimental Study of the Mold Flow Induced by a Swirling Flow Nozzle and Electromagnetic Stirring for Continuous Casting of Round Blooms. Metall. Mater. Trans. B 2019, 50, 716–731. [Google Scholar] [CrossRef]
- Sun, H.; Zhang, J. Macrosegregation Improvement by Swirling Flow Nozzle for Bloom Continuous Castings. Metall. Mater. Trans. B 2014, 45, 936–946. [Google Scholar] [CrossRef]
- Li, Z.; Wang, E.; Xu, Y.; Xu, L. Influence of SEN depth and port angle on vertical electromagnetic brake effects in continuous casting mould. COMPEL Int. J. Comput. Math. Electr. Electron. Eng. 2017, 36, 445–457. [Google Scholar] [CrossRef]
- Chatterjee, D. CFD Model Study of a New Four-Port Submerged Entry Nozzle for Decreasing the Turbulence in Slab Casting Mold. ISRN Metall. 2013, 2013, 1–6. [Google Scholar] [CrossRef]
- Xu, M.; Zhu, M. Transport Phenomena in a Beam-Blank Continuous Casting Mold with Two Types of Submerged Entry Nozzle. ISIJ Int. 2015, 55, 791–798. [Google Scholar] [CrossRef]
- Gonzalez-Trejo, J.; Real-Ramirez, C.A.; Carvajal-Mariscal, I.; Sanchez-Silva, F.; Cervantes-De-La-Torre, F.; Miranda-Tello, R.; Gabbasov, R. Hydrodynamic Analysis of the Flow inside the Submerged Entry Nozzle. Math. Probl. Eng. 2020, 2020, 1–14. [Google Scholar] [CrossRef]
- Kalter, R.; Tummers, M.; Kenjereš, S.; Righolt, B.; Kleijn, C. Oscillations of the fluid flow and the free surface in a cavity with a submerged bifurcated nozzle. Int. J. Heat Fluid Flow 2013, 44, 365–374. [Google Scholar] [CrossRef]
- Gupta, D.; Lahiri, A.K. Water modelling study of the jet characteristics in a continuous casting mould. Steel Res. 1992, 63, 201–204. [Google Scholar] [CrossRef]
- Shukla, A.K.; Dewan, A. OpenFOAM based LES of slot jet impingement heat transfer at low nozzle to plate spacing using four SGS models. Heat Mass Transf. 2019, 55, 911–931. [Google Scholar] [CrossRef]
- Hershey, D.E.; Thomas, B.G.; Najjar, F.M. Turbulent flow through bifurcated nozzles. Int. J. Numer. Methods Fluids 1993, 17, 23–47. [Google Scholar] [CrossRef]
- Najjar, F.M.; Thomas, B.G.; Hershey, D.E. Numerical study of steady turbulent flow through bifurcated nozzles in continuous casting. Metall. Mater. Trans. B 1995, 26, 749–765. [Google Scholar] [CrossRef]
- Thielicke, W.; Stamhuis, E.J. PIVlab—Towards User-Friendly, Affordable and Accurate Digital Particle Image Velocimetry in MATLAB. J. Open Res. Softw. 2014, 2, e30. [Google Scholar] [CrossRef]


Publisher’s Note: MDPI stays neutral with regard to jurisdictional claims in published maps and institutional affiliations. |
© 2021 by the authors. Licensee MDPI, Basel, Switzerland. This article is an open access article distributed under the terms and conditions of the Creative Commons Attribution (CC BY) license (http://creativecommons.org/licenses/by/4.0/).