Abstract
The electronic structures and optical properties of pure, Ag-doped and S-doped α-Fe2O3 were studied using density functional theory (DFT). The calculation results show that the structure of α-Fe2O3 crystal changes after Ag and S doping, which leads to the different points of the high symmetry of Ag-doped and S-doped α-Fe2O3 with that of pure α-Fe2O3 in the energy band, as well as different Brillouin paths. In addition, the band gap of α-Fe2O3 becomes smaller after Ag and S doping, and the optical absorption peak shifts slightly toward the short wavelength, with the increased peak strength of S/α-Fe2O3 and the decreased peak strength of Ag/α-Fe2O3. However, the optical absorption in the visible range is enhanced after Ag and S doping compared with that of pure α-Fe2O3 when the wavelength is greater than 380 nm, and the optical absorption of S-doped α-Fe2O3 is stronger than that of Ag-doped α-Fe2O3.
1. Introduction
Nowadays, all human beings are facing a serious shortage of resources because of the overconsumption of limited natural resources, such as oil, coal, mineral resources and natural gas [1]. Thus, we should find some methods to resolve the resource crisis as soon as possible. As we know, solar energy is a resource that is reliable, clean and endless. However, there is a problem: how can we make full use of solar energy? Semiconductor photocatalysts can effectively improve the utilization ratio of solar energy. Since Fujishima et al. [2] found that semiconductors could decompose water into hydrogen as a photocatalyst, more and more scientists joined the research of the photocatalytic field. In past decades, people usually used TiO2 or other common semiconductors to realize water splitting [3,4,5,6]. Researchers improved the sunlight utilization of TiO2 photocatalysts by using various methods. However, research on TiO2 tends to be saturated, and its utilization rate is not high enough, so it is necessary to find other effects of semiconductor photocatalysts.
After a long period of research, Al-Kuhaili et al. [7] found that hematite α-Fe2O3 had a 2.18 eV direct band gap, which theoretically allows the utilization of approximately 40% of the solar spectrum. However, the actual conversion efficiency of solar energy is not ideal due to poor performance, such as a very short excited-state lifetime [8,9,10], relatively poor absorptivity [11,12] and poor oxygen evolution reaction kinetics [13]. Therefore, improving the properties of α-Fe2O3 becomes hard work.
The principle of photocatalysis can be explained by the semiconductor energy band theory. The band structure of semiconductors is composed of a low-energy valence band filled with electrons and a high-energy conduction band filled with holes. When the radiation energy is higher than the band gap, the electrons in the valence band are stimulated to transfer into the conduction band, forming photogenerated electrons in the conduction band and photogenerated holes in the valence band [14]. These photogenerated electrons and holes will recombine in the semiconductor or on the surface of the semiconductor, becoming so-called electron–hole pairs. The holes in the valence band can be used for oxidants to react with H2O and OH- to form -OH. Similarly, the electrons in the conduction band can be used for reductants to react with O2 absorbed on the semiconductor surface to form O2-. The -OH and O2- with strong oxidation can converse organics into inorganics, such as CO2 and H2O. The biggest bottleneck for α-Fe2O3 in the application of photocatalysis is the rapid recombination speed of photogenerated electron–hole pairs, which reduces the photocatalytic activity of α-Fe2O3. Nowadays, doping modification is commonly used to enhance the photocatalytic activity of α-Fe2O3. For example, Cong et al. [15] found that tantalum and aluminum codoped with α-Fe2O3 greatly reduce the effect of anodic overpotential on water oxidation and charge transfer. In brief, tantalum and aluminum codoping is beneficial for α-Fe2O3 to separate and transfer photogenerated electron–hole pairs.
We know that the most typical feature of noble metal nanoparticles (such as Au, Ag, Pt and so on) is their strong absorption peaks in the visible light range [16]. Noble metal doping can also promote the transportation of carriers in photocatalysts because of the special electronic structure of noble metal nanoparticles, which includes a large number of free-conducting electrons that can respond to incident light. Ag-doping modification has considerable application potential in the future. Zhang et al. [17] proved that Ag could improve the photocatalytic performance of TiO2 by doping modification, but there is a lack of research for Ag-doped α-Fe2O3 at present, especially regarding its theoretical study. In addition, the study showed that nonmetal doping can enhance electron mobility and consequently photoelectric performance. For example, Zhang et al. [18] prepared P-doped α-Fe2O3 and found that it has high photoelectrochemical performance due to electron mobility caused by P doping. Carraro et al. [19] synthesized F-doped α-Fe2O3 nanomaterials by plasma-enhanced chemical vapor deposition and showed enhanced photocatalytic H2 production. Although a lot of research work has been undertaken on the metal and nonmetal doping of α-Fe2O3, the mechanism of metal and nonmetal doping changing the optical properties of α-Fe2O3 is still unclear. In this paper, the electronic structures and optical properties of Ag- and S-doped α-Fe2O3 were studied by using density functional theory, including the band structure, density of states, Mulliken population, electron density and optical absorption property, with a special emphasis on the comparative study of Ag and S doping. This study will establish a certain theoretical foundation for developing a new doping modification system of hematite, with better properties and production applications in different fields.
2. Computational Methods and Models
2.1. Computational Methods
Calculations of bulk α-Fe2O3 were carried out using first-principle methods based on density functional theory (DFT) in the CASTEP program module developed by Payne et al. [20], and plane-wave basis sets were also used in this paper [21]. To express the interactions between valence electrons and the ionic core, ultrasoft pseudopotential methods were used. The plane-wave cutoff energy of all calculations was set to 340 eV, which was tested as the most stable value. In order to choose the calculation parameters suitable for the α-Fe2O3 system, the test data of two main parameters (correlation function and k-point) for bulk α-Fe2O3 were shown in Table 1 and Table 2. By analyzing the data of Table 1 and Table 2 (system energies and lattice parameters), the generalized gradient approximation (GGA) developed by Perdew and Wang (PW91) [22] was selected as the exchange–correlation functional, and a Monkhorst-Pack k-point sampling density of 3 × 3 × 1 was used in all calculations. The system energy is the lowest, and the lattice parameters calculated under these parameters are a = b = 5.088 Å and c = 14.138 Å, respectively, which are very close to the experimental results (a = b = 5.036 Å, c = 13.747 Å), showing that the calculation is reliable. This study used the BFGS (Broy-den C.G., Fletcher R., Goldforb D. and Shanno D.F.) algorithm to achieve geometry optimization calculations. In the BFGS algorithm, the maximum energy change was set to 2.0 × 10⁻⁵ eV·atom−1, the maximum force was set to 0.05 eV·Å−1, the maximum stress was set to 0.1 GPa, the maximum displacement was set to 0.002 Å and the self-consistent field was set to 2.0 × 10⁻⁶ eV·atom−1. These were the convergence tolerances settings for the geometry optimization calculations, as shown in Table 3. In addition, spin-polarization calculations were conducted to consider the magnetic moments of the individual Fe atoms.

Table 1.
Optimization results of different k-points (exchange–correlation functional: GGA-PW91; cutoff energy: 340 eV).
Table 2.
Optimization results of different exchange–correlation functionals (cutoff energy: 340 eV; k-points: 3 × 3 × 1).
Table 3.
Convergence tolerances for geometry optimization calculations.
2.2. Computational Models
α-Fe2O3 possesses a hexagonal crystal structure with a space group of R3/c [23,24], which consists of 18 oxygen atoms and 12 iron atoms. Each Fe atom coordinates with six adjacent O atoms, and each O atom coordinates with four adjacent Fe atoms, as shown in Figure 1a. The lattice constants of pure optimized α-Fe2O3 are a = 5.088 Å, b = 5.088 Å and c = 14.138 Å, respectively, and the lattice angles are α = β = 90° and γ = 120°. The model of Ag-doped α-Fe2O3 was obtained by replacing one iron atom of α-Fe2O3 with one silver atom (Figure 1b). Obviously, there is a difference between the pure and Ag-doped α-Fe2O3 models. The lattice constants of Ag/α-Fe2O3 are a = 5.282 Å, b = 5.320 Å and c = 14.218 Å, respectively, and the lattice angles are α = 92.16°, β = 88.52° and γ = 121.84°, respectively. The model of S-doped α-Fe2O3 was obtained by replacing one oxygen atom of α-Fe2O3 with one sulfur atom (Figure 1c), and its lattice constants are 5.234 Å, 5.234 Å and 14.189 Å with the lattice angles of α = 88.44°, β = 91.56° and γ = 120.41°. The formation energies of Ag/α-Fe2O3 and S/α-Fe2O3 were calculated, and their values are −6.73 and −3.82 eV, respectively, suggesting that the models of Ag/α-Fe2O3 and S/α-Fe2O3 are stable, and Ag/α-Fe2O3 is more stable than S/α-Fe2O3. The calculated magnetic moment of every iron atom for pure α-Fe2O3 is 4.16 µB, which is the same as the result of Pozum [23] but lower than the experimental value (4.6 µB) [25]. After Ag and S doping, the magnetic moments of different iron atoms are different; however, the values become small, and the magnetic moments of iron atoms for S/α-Fe2O3 are smaller than those for Ag/α-Fe2O3, suggesting that the magnetic property of S/α-Fe2O3 is weaker than that of Ag/α-Fe2O3.
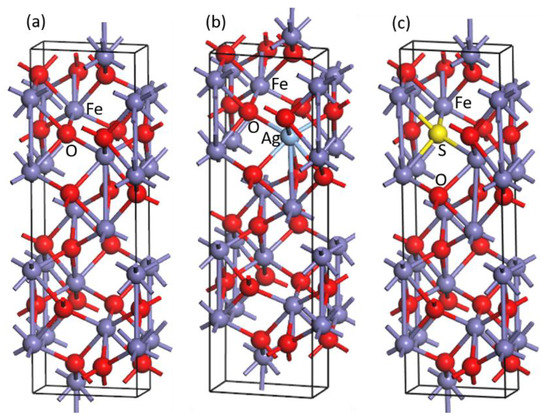
Figure 1.
Model of pure (a), Ag-doped (b) and S-doped (c) α-Fe2O3.
3. Results and Discussion
3.1. Structural Changes of Ag- and S-Doped α-Fe2O3
Figure 2a–c shows the structural changes of α-Fe2O3 before (Figure 2a) and after Ag doping (Figure 2b) and S doping (Figure 2c). It is observed that there are two types of bond length for pure α-Fe2O3. One is 2.022 Å (O-Fe, O-Fe1, O5-Fe, O4-Fe), and the other is 2.186 Å (O-Fe2, O-Fe3, O1-Fe, O2-Fe, O3-Fe). After the Ag atom replaces the Fe atom of α-Fe2O3, the lengths of all Ag-O bonds (O-Ag, O1-Ag, O2-Ag, O3-Ag, O4-Ag, O5-Ag) are larger than those of corresponding O-Fe bonds, and the bond lengths of two O-Ag bonds close to the vertical direction are the largest (O2-Ag: 2.515 Å; O5-Ag: 2.397 Å). For S-doped α-Fe2O3, it is seen that the bond lengths of all S-Fe bonds (S-Fe, S-Fe1, S-Fe2, S-Fe3) are also larger than those of corresponding O-Fe bonds, and the bond lengths of S-Fe2 and S-Fe3 are larger than those of S-Fe and S-Fe1. The larger bond lengths of Ag-O and S-Fe after doping than corresponding to Fe-O and O-Fe bonds of α-Fe2O3 before doping may be due to the larger covalent radius of Ag and S than Fe and O, respectively.
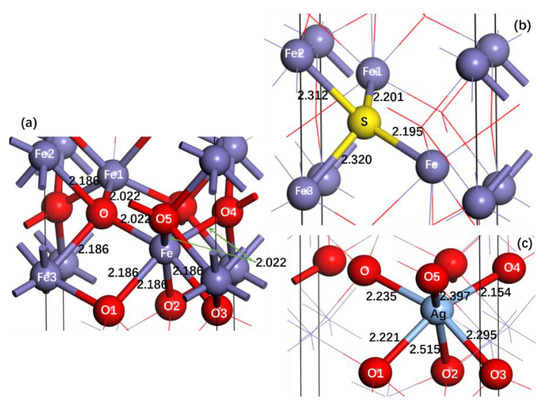
Figure 2.
Bond lengths between Fe and O atoms with surrounding atoms for pure α-Fe2O3 (a) and between doping atoms and surrounding atoms for Ag-doped (b) and S-doped α-Fe2O3 (c). Numbers represent bond lengths in Å.
3.2. Electronic Structures of Pure, Ag- Doped and S-Doped α-Fe2O3
Figure 3 shows the energy band and the corresponding partial density of states (PDOSs) of upspin and downspin for pure α-Fe2O3. It is observed that the energy gap of the spin-up band is 4.823 eV, while that of the spin-down band is 3.244 eV. However, the energy gap of α-Fe2O3 depends on the top of the valence band of the spin-up band and the bottom of the conduction band of the spin-down band. Therefore, it is found that the energy gap value of α-Fe2O3 is 2.265 eV. The result also shows a large electronic polarization for α-Fe2O3. For the spin-up band, the band between −8 and −5.182 eV is mainly from Fe 3d and O 2p, only with a few contributions from Fe 4s, Fe 4p and O 2s, while that between −5.182 and 0 eV below the valence band maximum is from O 2p and Fe 3d, with a few contributions from Fe 4s and Fe 4p. The band in the conduction band is mainly from Fe 4s, Fe 4p, O 2p and O 2s. The bonding is in the range of −5.182 to 0 eV in the valence band, while the antibonding is in the conduction band. As for the spin-down band, the group in the range from −6 to −1 eV is mainly from O 2p and Fe 3d, with a few contributions from Fe 4p and Fe 4s. The band between 2 and 5 eV in the conduction band is mainly Fe 3d and O 2p, with a few contributions from Fe 4p, O 2s and Fe 4s, while that in the range of 5.5 to 13 eV is mainly from Fe 4p and Fe 4s, with a few contributions from O 2p and O 2s. The bonding is located at the valence band, while antibonding is in the conduction band.
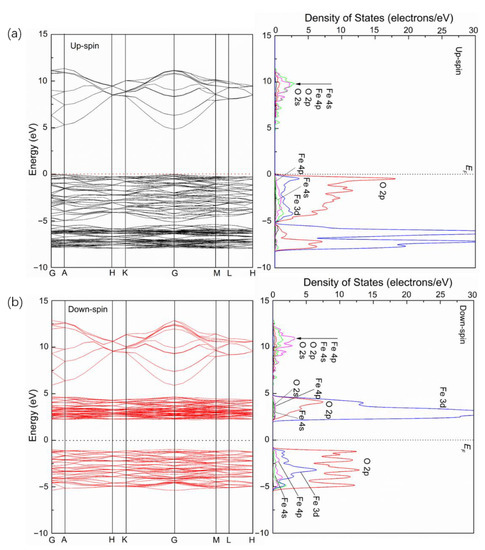
Figure 3.
Energy band and partial density of states (PDOSs) of upspin (a) and downspin (b) for pure α-Fe2O3.
Figure 4 shows the energy band and PDOS of upspin (Figure 4a) and downspin (Figure 4b) for Ag/α-Fe2O3. It is observed that the high symmetry point in the energy band of Ag/α-Fe2O3 is different from that of pure α-Fe2O3, which shows that Ag doping induces the change of the symmetry of α-Fe2O3 and leads to the change of the Brillouin path. Generally, the unit cell type cannot be changed with a low doping concentration. However, it is seen from Figure 2c that there is a large change of the crystal structure of α-Fe2O3 after Ag doping, which may be because more Ag-O bonds are formed (six O-Ag bonds). Though the concentration of Ag is very low, O-Ag bonds account for a large proportion in the whole α-Fe2O3 crystal, and the lengths of O-Ag bonds are much larger than those of the corresponding bonds of pure α-Fe2O3, which may lead to the change of α-Fe2O3 crystal structure. In addition, the doping of Ag greatly changes the band structure of α-Fe2O3 and makes it have a specific character. For the upspin band of Ag/α-Fe2O3, it is metallic with electronic states overlapping the Fermi level, while it possesses a semiconducting nature with a forbidden energy range for the downspin band. The materials with this property are called half-metals. Thus, Ag doping makes α-Fe2O3 become half-metal from the semiconductor.
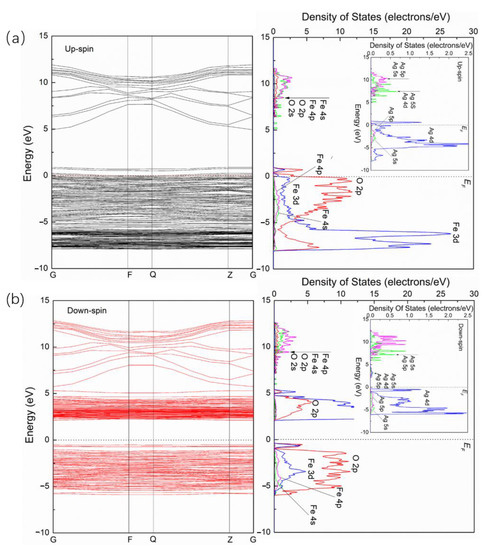
Figure 4.
Energy band and PDOS of upspin (a) and downspin (b) for Ag/α-Fe2O3.
For the upspin band and PDOS of Ag/α-Fe2O3 (Figure 4a), the energy level in the conduction band with the corresponding PDOS curve extends slightly toward high energy. The main contribution is from Fe 4p and Fe 4s, with a few contributions from O 2p and O 2s. The energy level near the Fermi level in the valence band is split and forms a small DOS peak, which corresponds to a hybrid peak of the O 2p and Fe 3d orbitals. In addition, the localizations of the DOSs of Fe 3d and O 2p in the valence band are weakened after Ag doping. The doping energy level of Ag appears by accompanying those of the Fe and O orbitals of α-Fe2O3 (Figure 4a). The main contribution in the conduction band is from Ag 5p and Ag 5s orbitals, while from the Ag 4d orbital in the valence band. As for the downspin band and PDOS of Ag/α-Fe2O3 (Figure 4b), it is observed that the energy level between 5 and 13 eV in the conduction band extends to low energy, while that between 2 and 5 eV extends to high energy, and the energy level at about 5 eV is split and forms a small peak from Fe 3d and O 2p in the DOS curve. The energy level in the valence band is broadened, which means that the localization of the DOS of Fe 3d and O 2p is weakened after Ag doping. In addition, it is also seen that the energy level at the top of the valence band is split, forming a peak from Fe 3d and O 2p in the DOS curve, in which the DOSs of Fe 3d and O 2p are almost the same in this peak. Like the upspin band, the doping energy level of Ag in the downspin band and corresponding PDOS appear by accompanying those of the Fe and O orbitals of α-Fe2O3 (Figure 4b). The main contribution in the conduction band is also from the Ag 5p and Ag 5s orbitals and the Ag 4d orbital in the valence band.
Figure 5a,b shows the energy band and PDOS of upspin (Figure 5a) and downspin (Figure 5b) for S/α-Fe2O3. Like Ag/α-Fe2O3, the symmetry of α-Fe2O3 changes after S doping, and the high symmetry point in the energy band of Ag/α-Fe2O3 and S/α-Fe2O3 is the same; that is, Ag/α-Fe2O3 and S/α-Fe2O3 have the same Brillouin paths. In addition, the doping of S also makes it become a half-metal. For the upspin band and PDOS of S/α-Fe2O3, the energy level of the conduction band extends to high energy compared with that of pure α-Fe2O3, suggesting that the nonlocality of corresponding DOS after S doping is enhanced. The main contribution in the range of 16 to 22 eV is from Fe 4p, while that between 5 and 16 eV is from Fe 4p and Fe 4s, with a few contributions from O 2p. The energy level in the valence band shifts to high energy and some of the energy levels pass through the Fermi level. The energy level near the Fermi level is split (energy band of Figure 5a) and forms two DOS peaks (PDOS of Figure 5a), which are from the contributions of Fe 3d and O 2p. In addition, the DOS curve in the valence band changes a lot. In the range of −7 to 0 eV, there is only an energy level group, which is mainly composed of Fe 3d and O 2p, with a few contributions from Fe 4p and Fe 4s, while for pure α-Fe2O3, the valence band is divided into two groups. The group in the range of −8 to −5 eV is mainly from Fe 3d and O 2p, while that between −5 and 0 eV is mainly from O 2p and Fe 3d, with a few contributions from Fe 4p and Fe 4s. The doping energy level of S appears by accompanying the Fe and O levels of α-Fe2O3 (Figure 5a). However, the main contribution of S is from S 3p, with a few contributions of S 3s. Furthermore, the contribution of S in the range of 5 to 23 eV is very small. For the downspin band and PDOS of S/α-Fe2O3, the energy level larger than 5 eV extends toward high energy and leads to its broadening, suggesting a strong nonlocality of the corresponding DOS, which is similar to that of the upspin band and DOS of S/α-Fe2O3. The energy level between 0 and 5 eV extends to low energy and is split into two groups, which are both from Fe 3d and O 2p, with a few contributions from Fe 4p and Fe 4s. The energy level in the valence band shifts to low energy and its nonlocality is weakened. Like the upspin band, the doping energy level of S for the downspin band and corresponding PDOSs appear by accompanying those of the Fe and O orbitals of α-Fe2O3 (Figure 5b). The main contribution in the conduction band is also from S 3p, with a few contributions of S 3s, and from the S 3p orbital in the valence band.
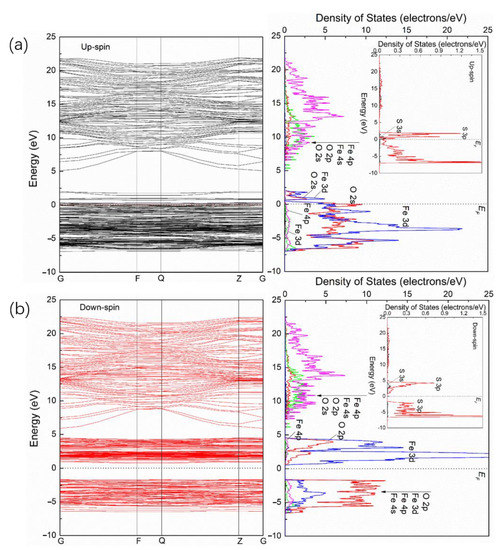
Figure 5.
Energy band and PDOS of upspin (a) and downspin (b) for S/α-Fe2O3.
Figure 6a–d shows the electron density differences of pure (Figure 6a,b), Ag-doped (Figure 6c) and S-doped α-Fe2O3 (Figure 6d). It is observed from Figure 6a,c that the Ag atom loses more electrons (Figure 6c) compared with the Fe atom replaced by Ag (Figure 6a), while oxygen atoms (O1 and O2) bonded to Ag after doping seem to obtain fewer electrons relative to those before doping. For S-doped α-Fe2O3, the S atom obtains fewer electrons (Figure 6d) than the O atom replaced by the S atom (Figure 6b), while Fe atoms bonded to the S atom lose fewer electrons than that before S doping. These results are in good agreement with the Mulliken atomic charge (Table 4). It is seen that the charge of the Ag atom for Ag-doped α-Fe2O3 is 1.730 e, which is larger than that of the Fe atom for pure α-Fe2O3 (1.140 e), while the charges of the O atom bonded to the Ag atom for Ag-doped α-Fe2O3 are smaller than those of O atom bonded to the Fe atom for pure α-Fe2O3 (−0.760 e) (a positive sign indicates a loss of an electron, a negative sign indicates a gain of an electron). In S-doped pure α-Fe2O3, the charge of the S atom is −0.23 e, which is smaller than that of the O atom for pure α-Fe2O3, while the charges of the Fe atoms bonded to the S atom are smaller than those of the Fe atoms bonded to the O atom for pure α-Fe2O3.
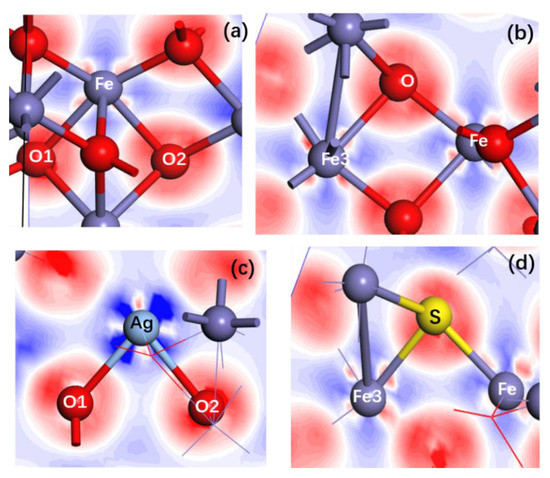
Figure 6.
Electron density differences of pure (a,b), Ag-doped (c) and S-doped (d) α-Fe2O3.
Table 4.
Mulliken atomic charges of pure, Ag- and S-doped α-Fe2O3.
3.3. Optical Property of Pure, Ag-Doped and S-Doped α-Fe2O3
Figure 7 shows the absorption spectra of α-Fe2O3, Ag/α-Fe2O3 and S/α-Fe2O3. There is an obvious absorption peak at about 230 nm for pure α-Fe2O3. After Ag and S doping, the absorption peaks of α-Fe2O3 shift slightly to a short wavelength, and the peak strength of S/α-Fe2O3 increases, while that of Ag/α-Fe2O3 decreases. However, the optical absorption in the visible range is enhanced after Ag and S doping. It is seen that the optical absorptions of Ag/α-Fe2O3 and S/α-Fe2O3 are much stronger than that of pure α-Fe2O3 when the wavelength is greater than 380 nm, and that of S-doped α-Fe2O3 is stronger than Ag-doped α-Fe2O3. The result shows that the doping of metal and nonmetal improves significantly the optical absorption in the visible range, which is beneficial for the photocatalytic reaction.
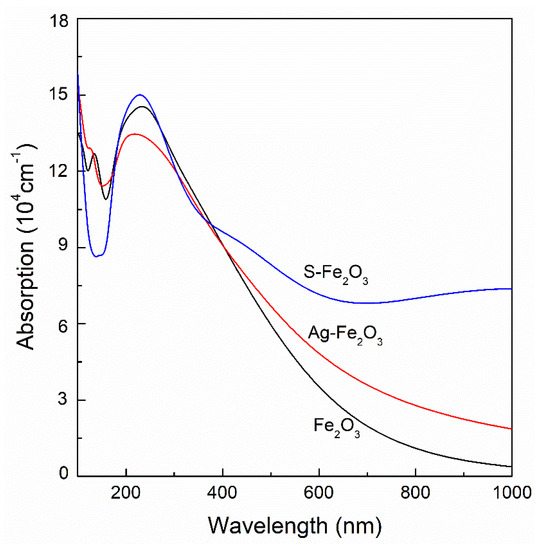
Figure 7.
Absorption spectra of pure α-Fe2O3, Ag/α-Fe2O3 and S/α-Fe2O3.
As we know, the light with the photon energy larger than the band gap can excite electrons into the conduction band. A photocatalyst is characterized by its ability to simultaneously adsorb two reactants, which can be reduced and oxidized by the electron and hole. However, the photogenerated electrons and holes will recombine quickly in the semiconductor, which reduces the photocatalytic efficiency. After substitutional doping, the charges of Ag and S are 1.730 and −0.230 e, which are larger than those of corresponding Fe (1.140 e) and O (−0.760 e) for pure α-Fe2O3, suggesting that Ag and S may capture the holes in the valence band of α-Fe2O3, thus preventing the recombination of electrons and holes. According to the absorption spectra (Figure 7), the optical absorption of the doped α-Fe2O3 in the visible range increases greatly, which means that the photocatalytic activity of α-Fe2O3 is enhanced. In addition, it is seen from Figure 7 that the optical absorption of α-Fe2O3 in the visible light is enhanced greatly after Ag and S doping. Therefore, metal and nonmetal doping can significantly improve the utilization of sunlight of α-Fe2O3 when used as a photocatalyst. According to our previous analysis, the doping of Ag and S makes α-Fe2O3 become a half-metal, which is suitable for applications in spintronic devices, such as the spin-tunnel junctions, spin vale and giant magnetoresistant (GMR) devices. As a result, the doping of Ag and S makes α-Fe2O3 have a much wider application.
4. Conclusions
In this study, the electronic structure and optical properties of pure, Ag- and S-doped α-Fe2O3 were studied by using density functional calculation. The main results are as follows:
- (1)
- The doping of Ag and S results in a large change of the crystal structure of α-Fe2O3. The lengths of all Ag-O and S-Fe bonds are larger than those of corresponding O-Fe bonds before Ag and S doping, which induces the expansion of the α-Fe2O3 crystal.
- (2)
- The band gaps of α-Fe2O3 decrease after Ag and S doping. For Ag/α-Fe2O3, the energy levels near the Fermi level for the upspin and downspin bands are split and form small DOS peaks, respectively. The main contribution of Ag in the conduction band is from Ag 5p and Ag 5s orbitals and from Ag 4d orbital in the valence band. For S/α-Fe2O3, the energy levels near the Fermi level for the upspin and downspin bands are also split; however, two DOS peaks are formed, respectively. The main contribution of S is from S 3p with a few contributions of S 3s.
- (3)
- The absorption peaks of Ag-doped and S-doped α-Fe2O3 shift slightly to a short wavelength accompanying the increased peak intensity of S/α-Fe2O3 and decreased peak intensity of Ag/α-Fe2O3. When the wavelength is greater than 380 nm, the optical absorptions of Ag- and S-doped α-Fe2O3 in the visible range are stronger than that of pure α-Fe2O3, and the optical absorption of S-doped α-Fe2O3 is stronger than that of Ag-doped α-Fe2O3.
Author Contributions
Conceptualization, C.Z., B.L. and J.C.; methodology: J.C.; software: J.C.; formal analysis: C.Z.; Resources: J.C.; data curation: J.C.; X.Z. and H.T.; writing–original draft preparation: C.Z.; writing—review and editing: J.C. and H.T.; writing–manuscript finalization: C.Z. and X.Z.; supervision: C.Z. and J.C.; project administration: C.Z. and J.C.; funding acquisition: C.Z. All authors have read and agreed to the published version of the manuscript.
Funding
This work was financially supported by the Guangxi Natural Science Foundation (No. 2017GXNSFAA198247), the National Science Foundation of China (No. 51964004) and the high-performance computing platform of Guangxi University.
Institutional Review Board Statement
Not applicable.
Informed Consent Statement
Not applicable.
Data Availability Statement
Data sharing not applicable.
Conflicts of Interest
The authors declare no conflict of interest.
References
- Ewing, T.; Ha, P.T.; Beyenal, H. Evaluation of long-term performance of sediment microbial fuel cells and the role of natural resources. Appl. Energy 2017, 192, 490–497. [Google Scholar] [CrossRef]
- Fujishima, A.; Honda, K. Electrochemical Photolysis of Water at a Semiconductor Electrode. Nature 1972, 238, 37–38. [Google Scholar] [CrossRef] [PubMed]
- Wei, T.; Zhu, Y.N.; An, X.; Liu, L.M.; Cao, X.; Liu, H.; Qu, J. Defect modulation of z-scheme TiO2/Cu2O photocatalysts for durable water splitting. ACS Catal. 2019, 9, 8346–8354. [Google Scholar] [CrossRef]
- Dong, Z.; Ding, D.; Li, T.; Ning, C. Ni-doped TiO2 nanotubes photoanode for enhanced photoelectrochemical water splitting, Appl. Surf. Sci. 2018, 443, 321–328. [Google Scholar] [CrossRef]
- Wei, Y.; Wang, J.; Yu, R.; Wan, J.; Wang, D. Constructing SrTiO3-TiO2 heterogeneous hollow multi-shelled structures for enhanced solar water splitting. Angew. Chem. Int. Ed. 2019, 58, 1422–1426. [Google Scholar] [CrossRef]
- Barroso, M.; Mesa, C.A.; Pendlebury, S.R.; Cowan, A.J.; Hisatomi, T.; Sivula, K.; Graetzel, M.; Klug, D.R.; Durrant, J.R. Dynamics of photogenerated holes in surface modified α-Fe2O3 photoanodes for solar water splitting. Proc. Natl. Acad. Sci. USA 2019, 109, 15640–15645. [Google Scholar] [CrossRef] [PubMed]
- Al-Ku Haili, M.F.; Saleem, M.; Durrani, S.M.A. Optical properties of iron oxide (α-Fe2O3) thin films deposited by the reactive evaporation of iron. J. Alloy. Compd. 2012, 521, 178–182. [Google Scholar] [CrossRef]
- Hung, W.H.; Peng, C.J.; Yang, C.R.; Li, C.J.; Shyue, J.J.; Chang, P.C.; Tseng, C.M.; Juan, P.C. Exploitation of a spontaneous spatial charge separation effect in plasmonic polyhedral α-Fe2O3 nanocrystal photoelectrodes for hydrogen production. Nano Energy 2016, 30, 523–530. [Google Scholar] [CrossRef]
- Leduc, J.; Goenuellue, Y.; Ghamgosar, P.; You, S.; Mouzon, J.; Choi, H.; Vomiero, A.; Grosch, M.; Mathur, S. Electronically-coupled phase boundaries in α-Fe2O3/Fe3O4 nanocomposite photoanodes for enhanced water oxidation. ACS Appl. Nano Mater. 2019, 2, 334–342. [Google Scholar] [CrossRef]
- Wanaguru, P.; An, J.; Zhang, Q. DFT+U study of ultrathin α-Fe2O3 nanoribbons from (110) and (104) surfaces. J. Appl. Phys. 2016, 119, 084302. [Google Scholar] [CrossRef]
- Li, L.; Liu, C.; Qiu, Y.; Mitsuzak, N.; Chen, Z. The influence of the hydrothermal temperature and time on morphology and photoelectrochemical response of α-Fe2O3 photoanode. J. Alloy. Compd. 2017, 969, 980–987. [Google Scholar] [CrossRef]
- Balbuena, J.; Cruz-yusta, M.; Pastor, A.; Sánchez, L. α-Fe2O3/SiO2 composites for the enhanced photocatalytic NO oxidation. J. Alloy. Compd. 2018, 735, 1553–1561. [Google Scholar] [CrossRef]
- Dare-Edwards, M.P.; Goodenough, J.B.; Hamnett, A.; Trevellick, P.R. Electrochemistry and photoelectrochemistry of iron(III) oxide. J. Chem. Soc. Faraday Trans. 1983, 79, 2027–2041. [Google Scholar] [CrossRef]
- Marschall, R. Semiconductor composites: Strategies for enhancing charge carrier separation to improve photocatalytic activity. Adv. Funct. Mater. 2014, 24, 2421–2440. [Google Scholar] [CrossRef]
- Cong, Y.; Chen, M.; Xu, T.; Zhang, Y.; Wang, Q. Tantalum and aluminum co-doped iron oxide as a robust photocatalyst for water oxidation. Appl. Catal. B Environ. 2014, 147, 733–740. [Google Scholar] [CrossRef]
- Ordal, M.A.; Long, L.L.; Bell, R.J.; Bell, S.E.; Bell, R.R. Optical properties of the metals Al, Co, Cu, Au, Fe, Pb, Ni, Pd, Pt, Ag, Ti, and W in the infrared and far infrared. Appl. Opt. 1983, 22, 1099–1119. [Google Scholar] [CrossRef] [PubMed]
- Zhang, H.; Wang, G.; Chen, D.; Lv, X.; Li, J. Tuning photoelectrochemical performances of Ag-TiO2 nanocomposites via reduction/oxidation of Ag. Chem. Mater. 2008, 77, 87–95. [Google Scholar]
- Zhang, Y.; Jiang, S.; Song, W.; Zhou, P.; Ji, H.; Ma, W.; Hao, W.; Chen, C.; Zhao, J. Nonmetal P-doped hematite photoanode with enhanced electron morbility and high water oxidation activity. Energy Environ. Sci. 2015, 8, 1231–1236. [Google Scholar] [CrossRef]
- Carraro, G.; Barreca, D.; Bekermann, D.; Montini, T.; Gasparotto, A.; Gombac, V.; Maccato, C.; Fornasiero, P. Supported F-doped α-Fe2O3 nanomaterials: Synthesis, characterization and photo-assisted H2 production. J. Nanosci. Nanotechnol. 2013, 13, 4962–4968. [Google Scholar] [CrossRef] [PubMed]
- Payne, M.C.; Teter, M.P.; Allan, D.C.; Arias, T.A.; Joannopoulos, J.D. Iterative minimization techniques for ab initio total-energy calculations: Molecular dynamics and conjugate gradients. Rev. Mod. Phys. 1992, 64, 1045–1097. [Google Scholar] [CrossRef]
- Kresse, G.; Furthmüller, J. Efficiency of ab-initio total energy calculations for metals and semiconductors using a plane-wave basis set. Comput. Mater. Sci. 1995, 6, 15–50. [Google Scholar] [CrossRef]
- Perdew, J.P.; Burke, K.; Ernzerhof, M. Generalized gradient approximation made simple. Phys. Rev. Lett. 1996, 77, 3865–3868. [Google Scholar] [CrossRef]
- Pozun, Z.D.; Henkelman, G. Hybrid density functional theory band structure engineering in hematite. J. Chem. Phys. 2011, 134, 224706. [Google Scholar] [CrossRef] [PubMed]
- Paterson, E. Iron oxides in the laboratory. Preparation and characterization. Clay Miner. 1992, 27, 393. [Google Scholar] [CrossRef]
- Krén, E.; Szabó, P.; Konczos, G. Neutron diffraction studies on the (1−x) Fe2O3−xRh2O3 system. Phys. Lett. 1965, 19, 103–104. [Google Scholar] [CrossRef]
Publisher’s Note: MDPI stays neutral with regard to jurisdictional claims in published maps and institutional affiliations. |
© 2021 by the authors. Licensee MDPI, Basel, Switzerland. This article is an open access article distributed under the terms and conditions of the Creative Commons Attribution (CC BY) license (http://creativecommons.org/licenses/by/4.0/).