Article

Effects of Salt Tracer Volume and Concentration on Residence Time Distribution Curves for Characterization of Liquid Steel Behavior in Metallurgical Tundish

1
Key Laboratory of Electromagnetic Processing of Materials, Ministry of Education, Northeastern University, Shenyang 110819, China
2
School of Metallurgy, Northeastern University, Shenyang 110819, China
3
School of Materials and Metallurgy, University of Science and Technology Liaoning, Anshan 114051, China
*
Author to whom correspondence should be addressed.
Metals 2021, 11(3), 430; https://doi.org/10.3390/met11030430
Submission received: 6 February 2021 / Revised: 28 February 2021 / Accepted: 1 March 2021 / Published: 5 March 2021

Abstract

:
The residence time distribution (RTD) curve is widely applied to describe the fluid flow in a tundish, different tracer mass concentrations and different tracer volumes give different residence time distribution curves for the same flow field. Thus, it is necessary to have a deep insight into the effects of the mass concentration and the volume of tracer solution on the residence time distribution curve. In order to describe the interaction between the tracer and the fluid, solute buoyancy is considered in the Navier–Stokes equation. Numerical results show that, with the increase of the mass concentration and the volume of the tracer, the shape of the residence time distribution curve changes from single flat peak to single sharp peak and then to double peaks. This change comes from the stratified flow of the tracer. Furthermore, the velocity difference number is introduced to demonstrate the importance of the density difference between the tracer and the fluid.

Graphical Abstract

1. Introduction

The residence time distribution (RTD) curve in continuous flow systems was firstly proposed by Danckwerts [1]. The RTD curve obtained by the tracer techniques is vitally significant in order to understand the flow behavior in chemical reactors [2,3]. In metallurgical industry, the tundish is an important reactor for connecting the ladle and the mold. It’s necessary to have a deep insight into the fluid flow in the tundish because the flow field in the tundish affects the inclusion removal [4,5,6] and the tundish optimization design [7,8,9]. The metallurgists usually obtain the RTD curves by water model or numerical simulation [10,11,12,13,14]. Because of cheapness and convenience, the saturated NaCl or KCl solution is injected in the incoming water stream as the tracer in the water model. In addition, the continuity equation, the momentum equation, the turbulence model and the solute transport equation are solved to obtain the time varying tracer concentration at the exit. Compared to the water model, the numerical simulation has better data reproducibility.
In the textbook [15] and the past references [16,17], the RTD curves obtained by water model and numerical simulation usually have a single flat peak, single sharp peak or double peaks [18,19,20,21]. Maybe these three types of peaks have some relations with each other. The RTD curves with different peaks have a great influence on the characteristic values of the tundish. Especially, the double-peaks RTD curve implies that there is a short-circuit flow in the tundish. However, the short-circuit flow may be not the only cause for the double-peaks RTD curve.
When people conduct the water model, no matter what size the water model is, the salt tracer is usually the saturated solution, the volume is not fixed, such as 20 mL [22], 100 mL [23] and 200 mL [24]. In the numerical simulation, most metallurgists ignored the density difference between the tracer and the water [25,26,27]. They believed that the effect of the tracer parameters (concentration and volume) on the RTD curve is negligible. Actually, as early as in 1992, Vassilicos and Sinha [28] put forward the idea that the tracer density would affect the accuracy of RTD curve, and found that the results obtained by mathematical model and water model were contradictory. Moreover, they claimed that the tracer effect should be further investigated if larger volume of tracer were used. Thereupon, Damle and Sahai [29] studied the effect of the buoyancy caused by the density difference between the tracer (saturated KCl solution) and the water on the RTD curve in 1995, and pointed out that the mixture of tracer leads to a strong sink flow for water flow in the tundish.
For a deeper research and explanation about the effects of salt tracer on RTD curve, Chen et al. [30] conducted water model and numerical simulation. Based on the measured RTD curves and the predicted RTD curves (without density coupling), the RTD curves measured by water model are deviated to the left side of the calculated RTD curves, this deviation is more obvious when the tracer concentration and the tracer volume increase. For the predicted RTD curve, Chen et al. [31,32] introduced the mixed composition fluid model into the governing equation for RTD curve.
There are three highlights in present work.
(1)
Different tracer mass concentrations and different tracer volumes give different RTD curves for the same flow field. The effects of salt tracer amount and concentration on RTD curves will be investigated.
(2)
The dam without hole avoids the occurrence of the short-circuit flow, so stratified flow from the density difference between tracer and water results in the two peaks of RTD curves.
(3)
The velocity difference number is introduced to demonstrate the importance of the density difference between the tracer and the fluid.
In order to investigate the effects of the tracer on the fluid flow, water model for a single-strand tundish with a dam was developed to obtain the RTD curve at first. Secondly, a mathematical model based on Boussinesq approximation was developed to get the coupled solution for the flow field and the tracer concentration field by an open source software OpenFOAM (Section 2). Furthermore, the numerical result was validated by grid independence, water model and industrial experiment result (Section 3).

2. Research Methods

2.1. Water Model

A water model is used for validation. Figure 1 shows that the water model consists of water supply system, tundish system and drainage system. The water model is made of plexiglass. The tundish is a single-strand tundish with a dam. Because there is no hole in the dam, the short-circuit flow should not appear in the current case. Specifications of the water model can be found in Table 1.
In present work, NaCl solution is applied as the tracer in the water model. The pulse stimulus–response technique is used to measure the RTD curves. The experimental procedure is as follows: When the liquid level remains stable in the water model, the tracer is injected into the incoming water stream in the ladle shroud. At the same time, the electrical conductivity at the tundish exit is monitored and the related data are saved continuously in a personal computer. Because the electrical conductivity is linear with the tracer concentration, the electrical conductivity curve can be transformed into the tracer concentration curve. Consequently, the plot of the tracer concentration at the tundish exit against the time is the RTD curve.

2.2. Mathematical Model

2.2.1. Governing Equations and Assumptions

According to most widely applied approach to water model, some assumptions are applied in the mathematical model.
(1)
The fluid is an incompressible viscous fluid.
(2)
The fluid flow is an isothermal steady isotropic turbulent flow.
(3)
The free surface of fluid is flat in the tundish.
The fluid density is a function of tracer concentration. Based on Boussinesq approximation, the governing equations can be expressed as follows:
u = 0
ρ ref u t + ρ ref u u μ eff u = p + ρ ref 1 β C C ref g
where u is the velocity of fluid; C ref is the reference tracer mass concentration; ρ ref is the reference density, which is the density of fluid at the reference tracer mass concentration; g is the gravitational acceleration vector; β is the solute expansion coefficient of the tracer; μ eff is the effective viscosity; p is the pressure.
Equation (2) can be transformed into Equation (3):
u t + u u ν eff u = p ρ ref + ρ ref g ρ ref ρ ref β C C ref g ρ ref
Assigning ρ k as 1 β C C ref , Equation (3) can be reformulated as follows:
u t + u u ν eff u = p ρ ref + ρ k g
where the effective viscosity ν eff is determined by k ε turbulence model.
The scalar transport model is used to describe the convection and the diffusion of the tracer transport in the tundish.
C t + u C = D eff C
With
D eff = D 0 + μ t ρ ref S c t
where C is the tracer mass concentration; D eff and D 0 are the effective diffusion coefficient and the molecular diffusion coefficient, respectively. Sct = 1 is the turbulence Schmidt number. The turbulent viscosity μ t is given as follows:
μ t = ρ ref C μ k 2 ε
where C μ is a constant that equals to 0.09; k and ε are turbulent kinetic energy and turbulent energy dissipation rate respectively, which are calculated by the standard k-ε turbulence model written as follows:
ρ k t + ρ k u = μ + μ t σ k k + G k ρ ε
ρ ε t + ρ ε u = μ + μ t σ ε ε + C 1 ε k G k C 2 ρ ε 2 k
where G k is the production of turbulence kinetic energy due to the mean velocity gradients. C 1 , C 2 , σ k , σ ε are the constants that equal to 1.44, 1.92, 1.0, 1.3, respectively [33].

2.2.2. Gridsystem, Boundary Conditions and Initial Conditions

The mesh tool is ICEM CFD (Version 11.0, ANSYS, Pittsburgh, PA, USA, 2008). The calculation domain is covered by the non-uniform hexahedral grid. The number of grid is 136,068, as shown in Figure 2. By quality testing, the quality metrics criterion over 0.9 is close to 90%.
For the flow field, non-slip wall boundary condition is applied at the wall, the velocity at the inlet is a fixed value which is determined by the hydrodynamic experiment, the pressure-outlet boundary condition is applied at the tundish outlet. For the tracer concentration field, the zero-gradient boundary condition is applied at the wall, the free surface and the tundish outlet. The tracer concentration at the inlet is also a fixed value which is determined by the mass fraction of NaCl solution as follows:
C = C 0 if   0 t t 0 C = 0 if   t > t 0
The initial tracer concentration field is specified by zero, the initial velocity field is specified by a steady flow field in the case of no tracer.

2.2.3. Numerical Solution

The coupled solution (BoussinesqRTDFoam solver) for the fluid flow governing equation and the solute transport equation are implemented by using the open source CFD toolbox OpenFOAM (version 3.0.0) which is based on the finite volume method. Figure 3 gives the coupling calculation procedure for the velocity field and the NaCl concentration field by PISO algorithm [34]. The detailed calculation procedure is that discretization of partial differential equation −> velocity and concentration prediction by initial condition −> pressure correction based on pressure Poisson equation −> velocity and concentration correction. The convergence criterion for the velocity, concentration, turbulent kinetic energy and its dissipation rate is set to 10−6. In addition, the convergence criterion for the pressure is 10−8.
Table 2 lists the numerical schemes for BoussinesqRTDFoam solver. Table 3 shows the solvers used in BoussinesqRTDFoam solver calculation.

2.2.4. Simulation Parameters

The solute expansion coefficient is determined by the experiment. The solute expansion coefficient of NaCl can be obtained by Equation (11). The least square fitting method is carried out to get the linear relationship (Equation (12)) between the mass concentration and the density of NaCl solution in Figure 4. The Equation (12) gives the relation between the density and the mass concentration of NaCl solution. The linear coefficient of determination (R2) of fitting is 0.9874, which indicates the excellent degree of linear correlation between the density and the mass concentration of NaCl solution, the solute expansion coefficient β is −0.0071.
β = 1 ρ ref ρ C
ρ = 6.75 C + 952.95
NaCl is a strong electrolyte which can ionize Na+ and Cl completely in the water. The average diffusion coefficient of NaCl solution is usually used to describe the diffusion process. Cussler deduced Equation (13) to calculate the average diffusion coefficient of electrolyte [35].
D salt = z 1 + z 2 z 2 / D 1 + z 1 / D 2
where z i and D i refer to the charge of the ion and the diffusion coefficient of ion. The average diffusion coefficient of NaCl can be reformulated as Equation (14).
D NaCl = 2 1 / D Na + + 1 / D Cl
Based on Ghaffari’s calculation results, the average diffusion coefficients of NaCl solution with different mass fractions at 298.15 K (25 °C) are shown in Table 4 [36].

3. Validation of Numerical Results

3.1. Grid Independence

In order to ensure the accuracy and reliability of the numerical result, the grid sensitivity experiments were carried out for a RTD calculation case. In this case, the tracer is 100 mL saturated NaCl solution. The grid system consists of 84,072, 112,380, 136,068, 162,156 and 184,860 grids.
Table 5 gives the related analysis result. The peak concentration time is 111 s when the grid number increases from 84,072 mesh to 184,460 mesh. From the mesh 84,072 to 184,860, the variation of peak concentration (Cmax) is on the third digit (the maximum related error is only 0.89%). Therefore, the 136,068 mesh can be applied to obtain the next RTD curves.

3.2. Water Model and Industrial Validation

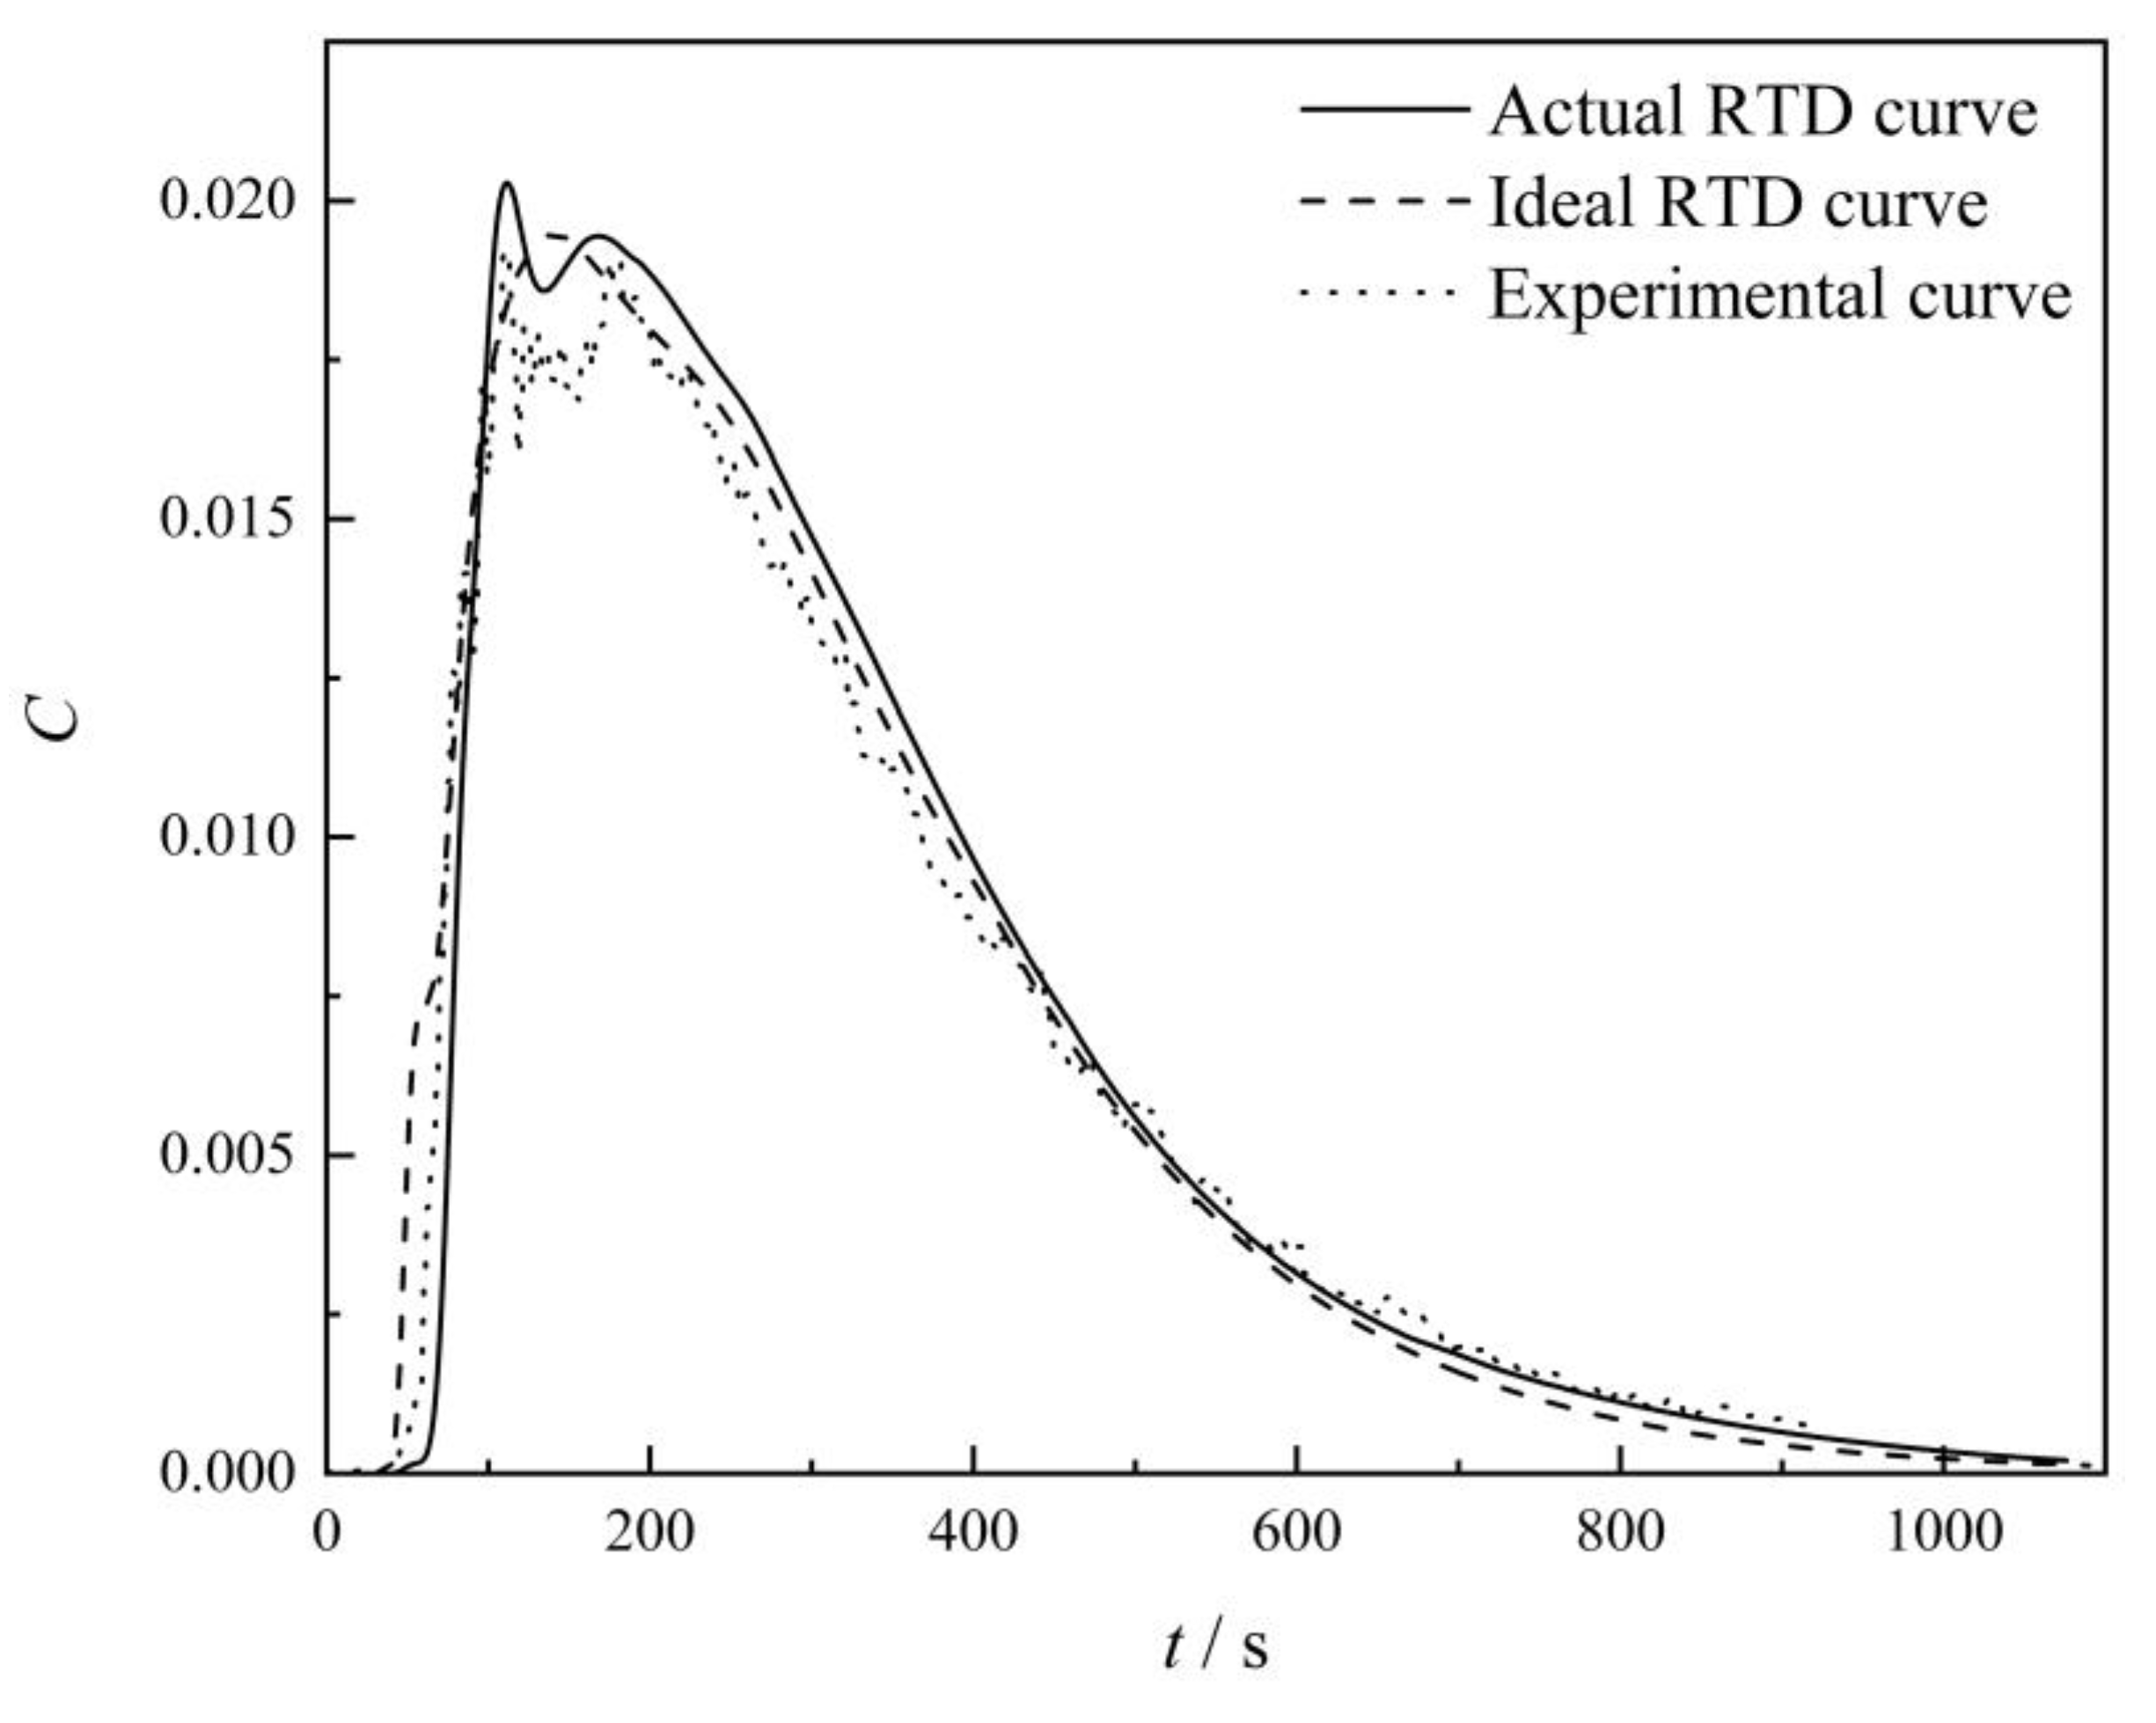
Figure 5 gives three RTD curves by water model and numerical simulation, the tracer is 100 mL saturated NaCl solution. The theoretical residence time is 301 s. The ideal RTD curve has one peak at 141 s. In this case, the tracer has the same physical parameters as the water, so there is no solute buoyancy. The actual RTD curve is calculated under the condition of solute buoyancy, it has two peaks at 111 s and 171 s. The experimental RTD curve from water model also has two peaks at 110 s and 176 s.
Table 6 lists the RTD curves analysis results which are obtained by the classic combined method [37]. The difference of the plug volume fraction, the dead volume fraction and the well-mixed volume fraction between the RTD curve with solute buoyancy and the RTD curve from water model are 7.88%, 9.94% and 2.27%, respectively. The difference of the plug volume fraction, the dead volume fraction and the well-mixed volume fraction between the ideal RTD curve and the RTD curve from the water model are 12.11%, 40.06% and 9.07%, respectively. Thus, the predicted RTD curve with solute buoyancy agrees well with the RTD curve from the water model, the ideal RTD curve is only an estimation for the RTD curve from water model.
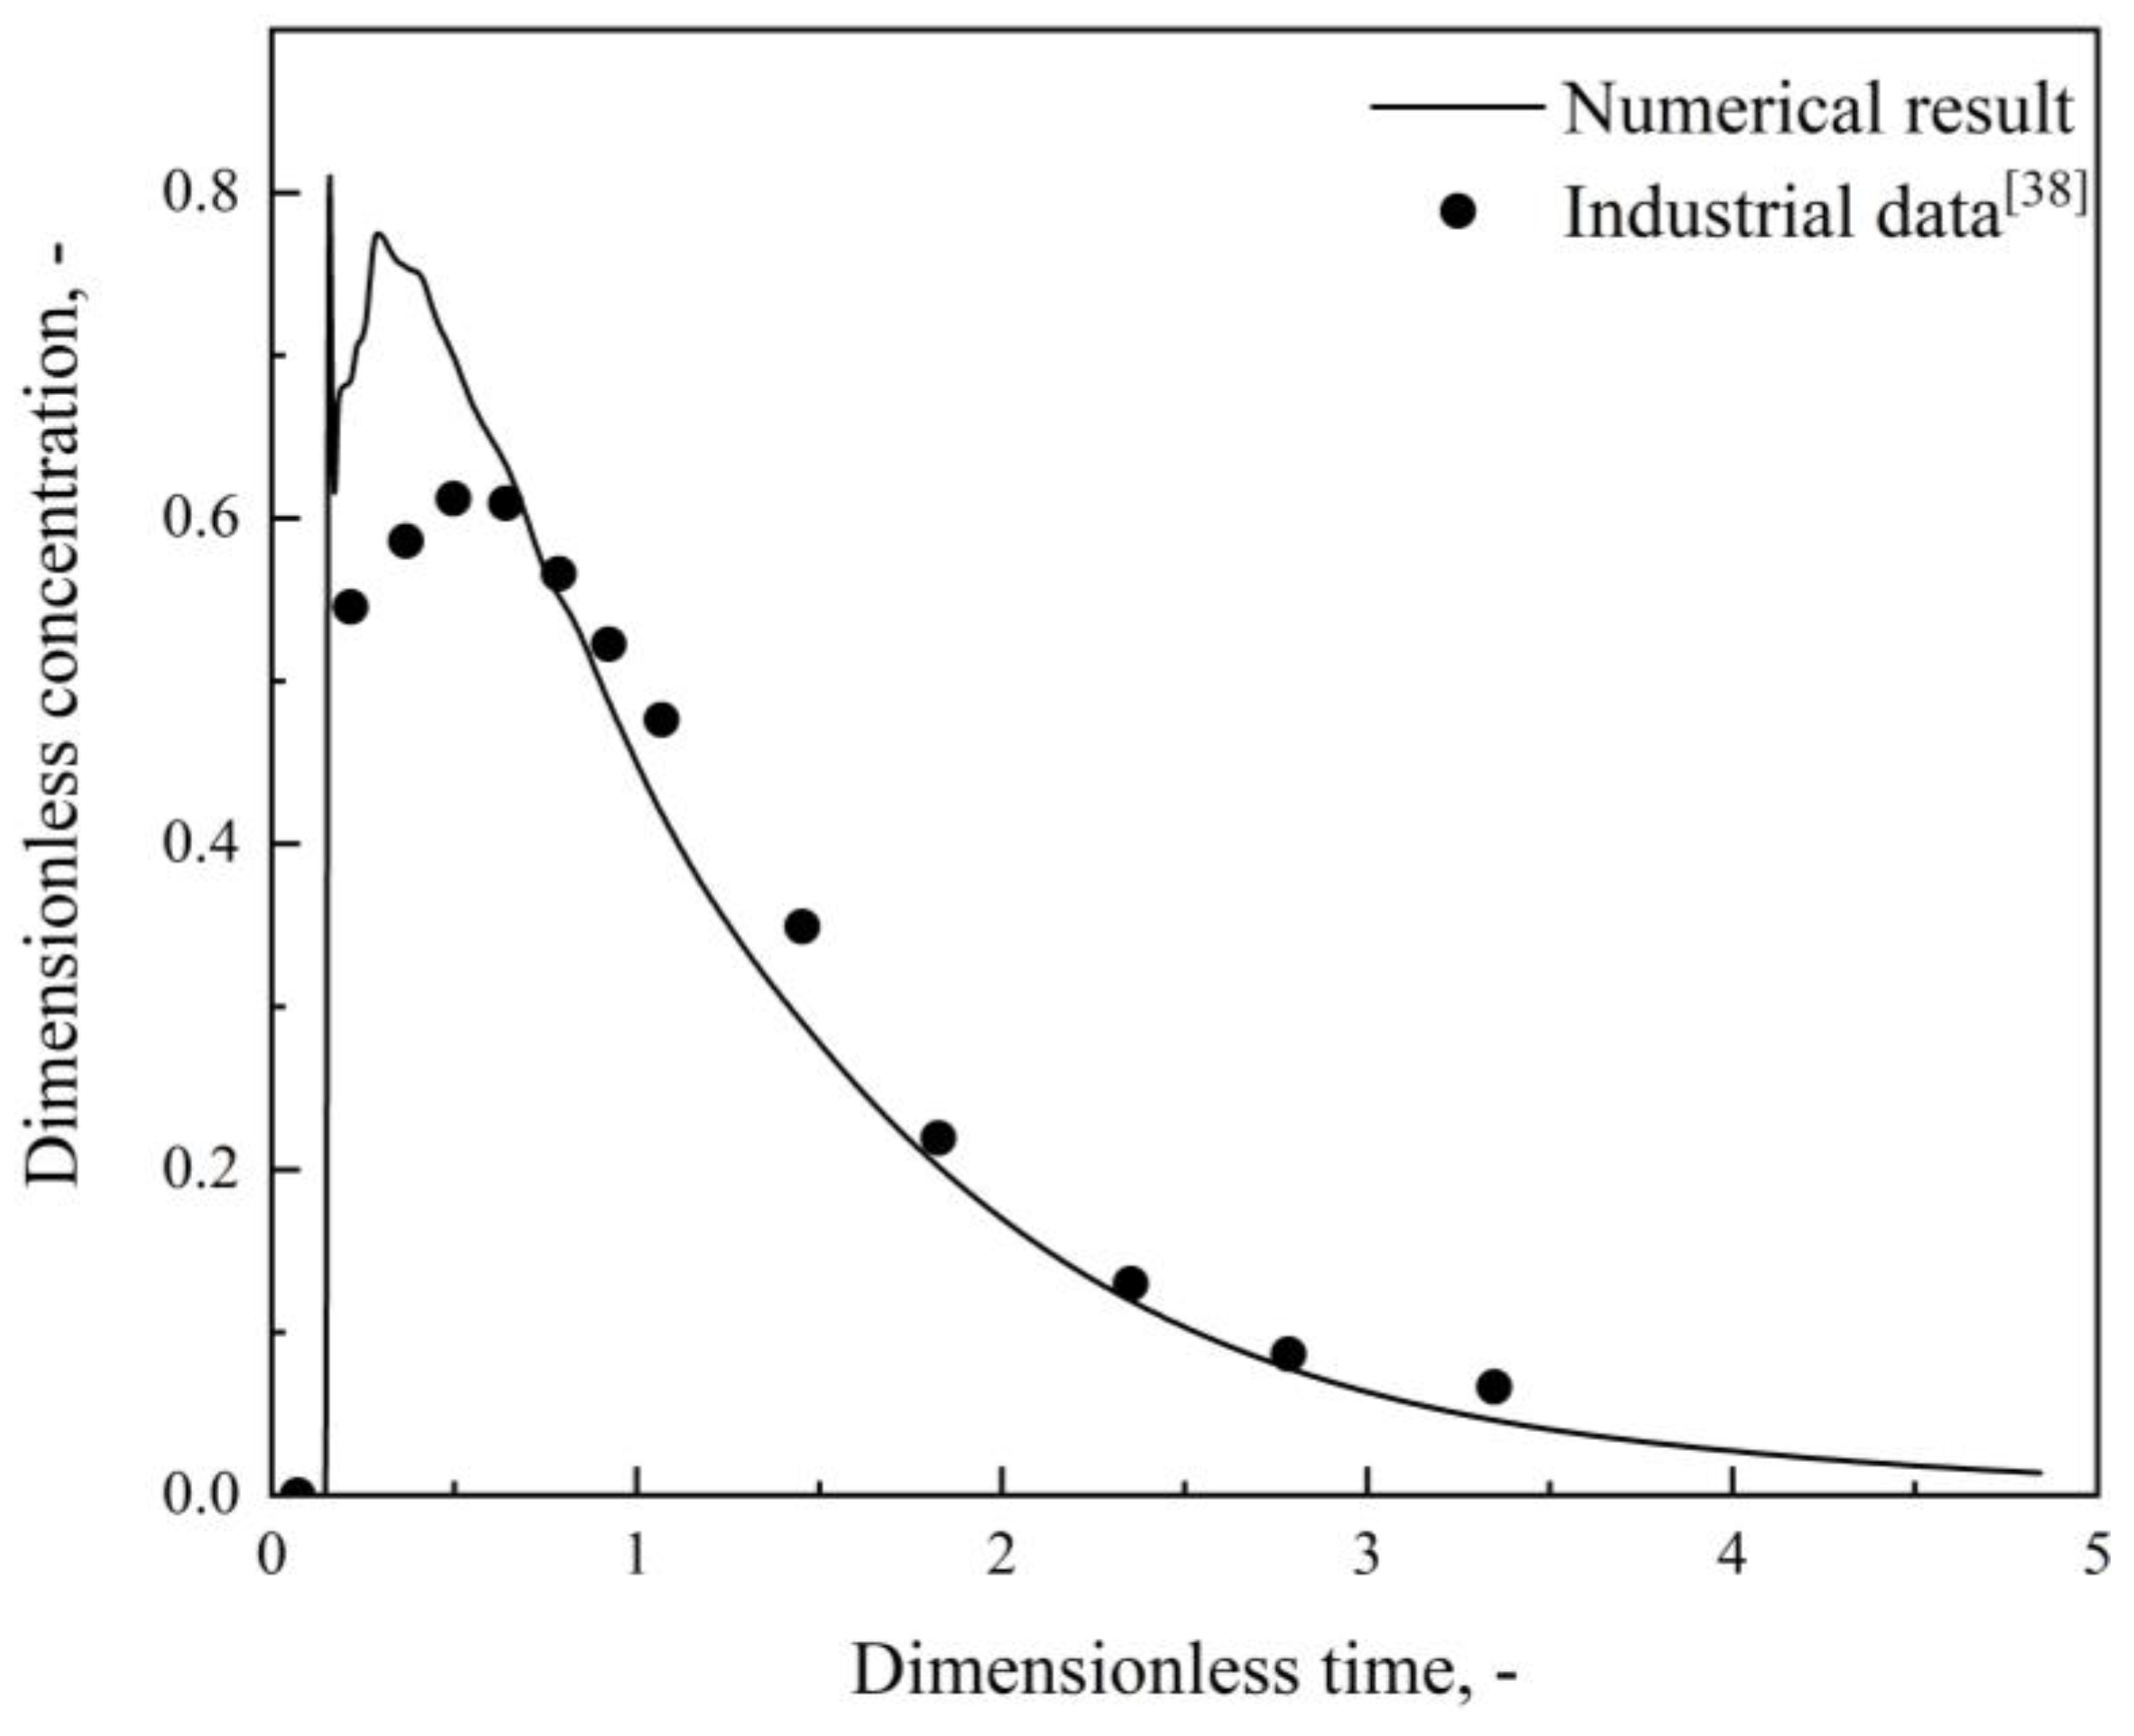
Figure 6 shows the numerical simulation results and industrial experiment data. The detailed description of the operating conditions and the size of the tundish is provided in Cwudzinski’s papers [38,39]. Compared with industrial experiment, a greater Ni concentration occurs in the tundish SEN based on numerical simulation. The chemical homogenization process from the industrial experiment correlates well with the RTD curve based on the mathematical model with solute buoyancy. Two factors lead to the difference between the industrial experiment and the numerical result. (1) The Ni alloy melting process is not considered in the mathematical model. (2) The temperature of molten steel in the tundish decreases gradually during one heat, but the current mathematical model doesn’t consider the thermal buoyancy.

4. Results and Discussion

4.1. Injected Tracer Mass Concentration

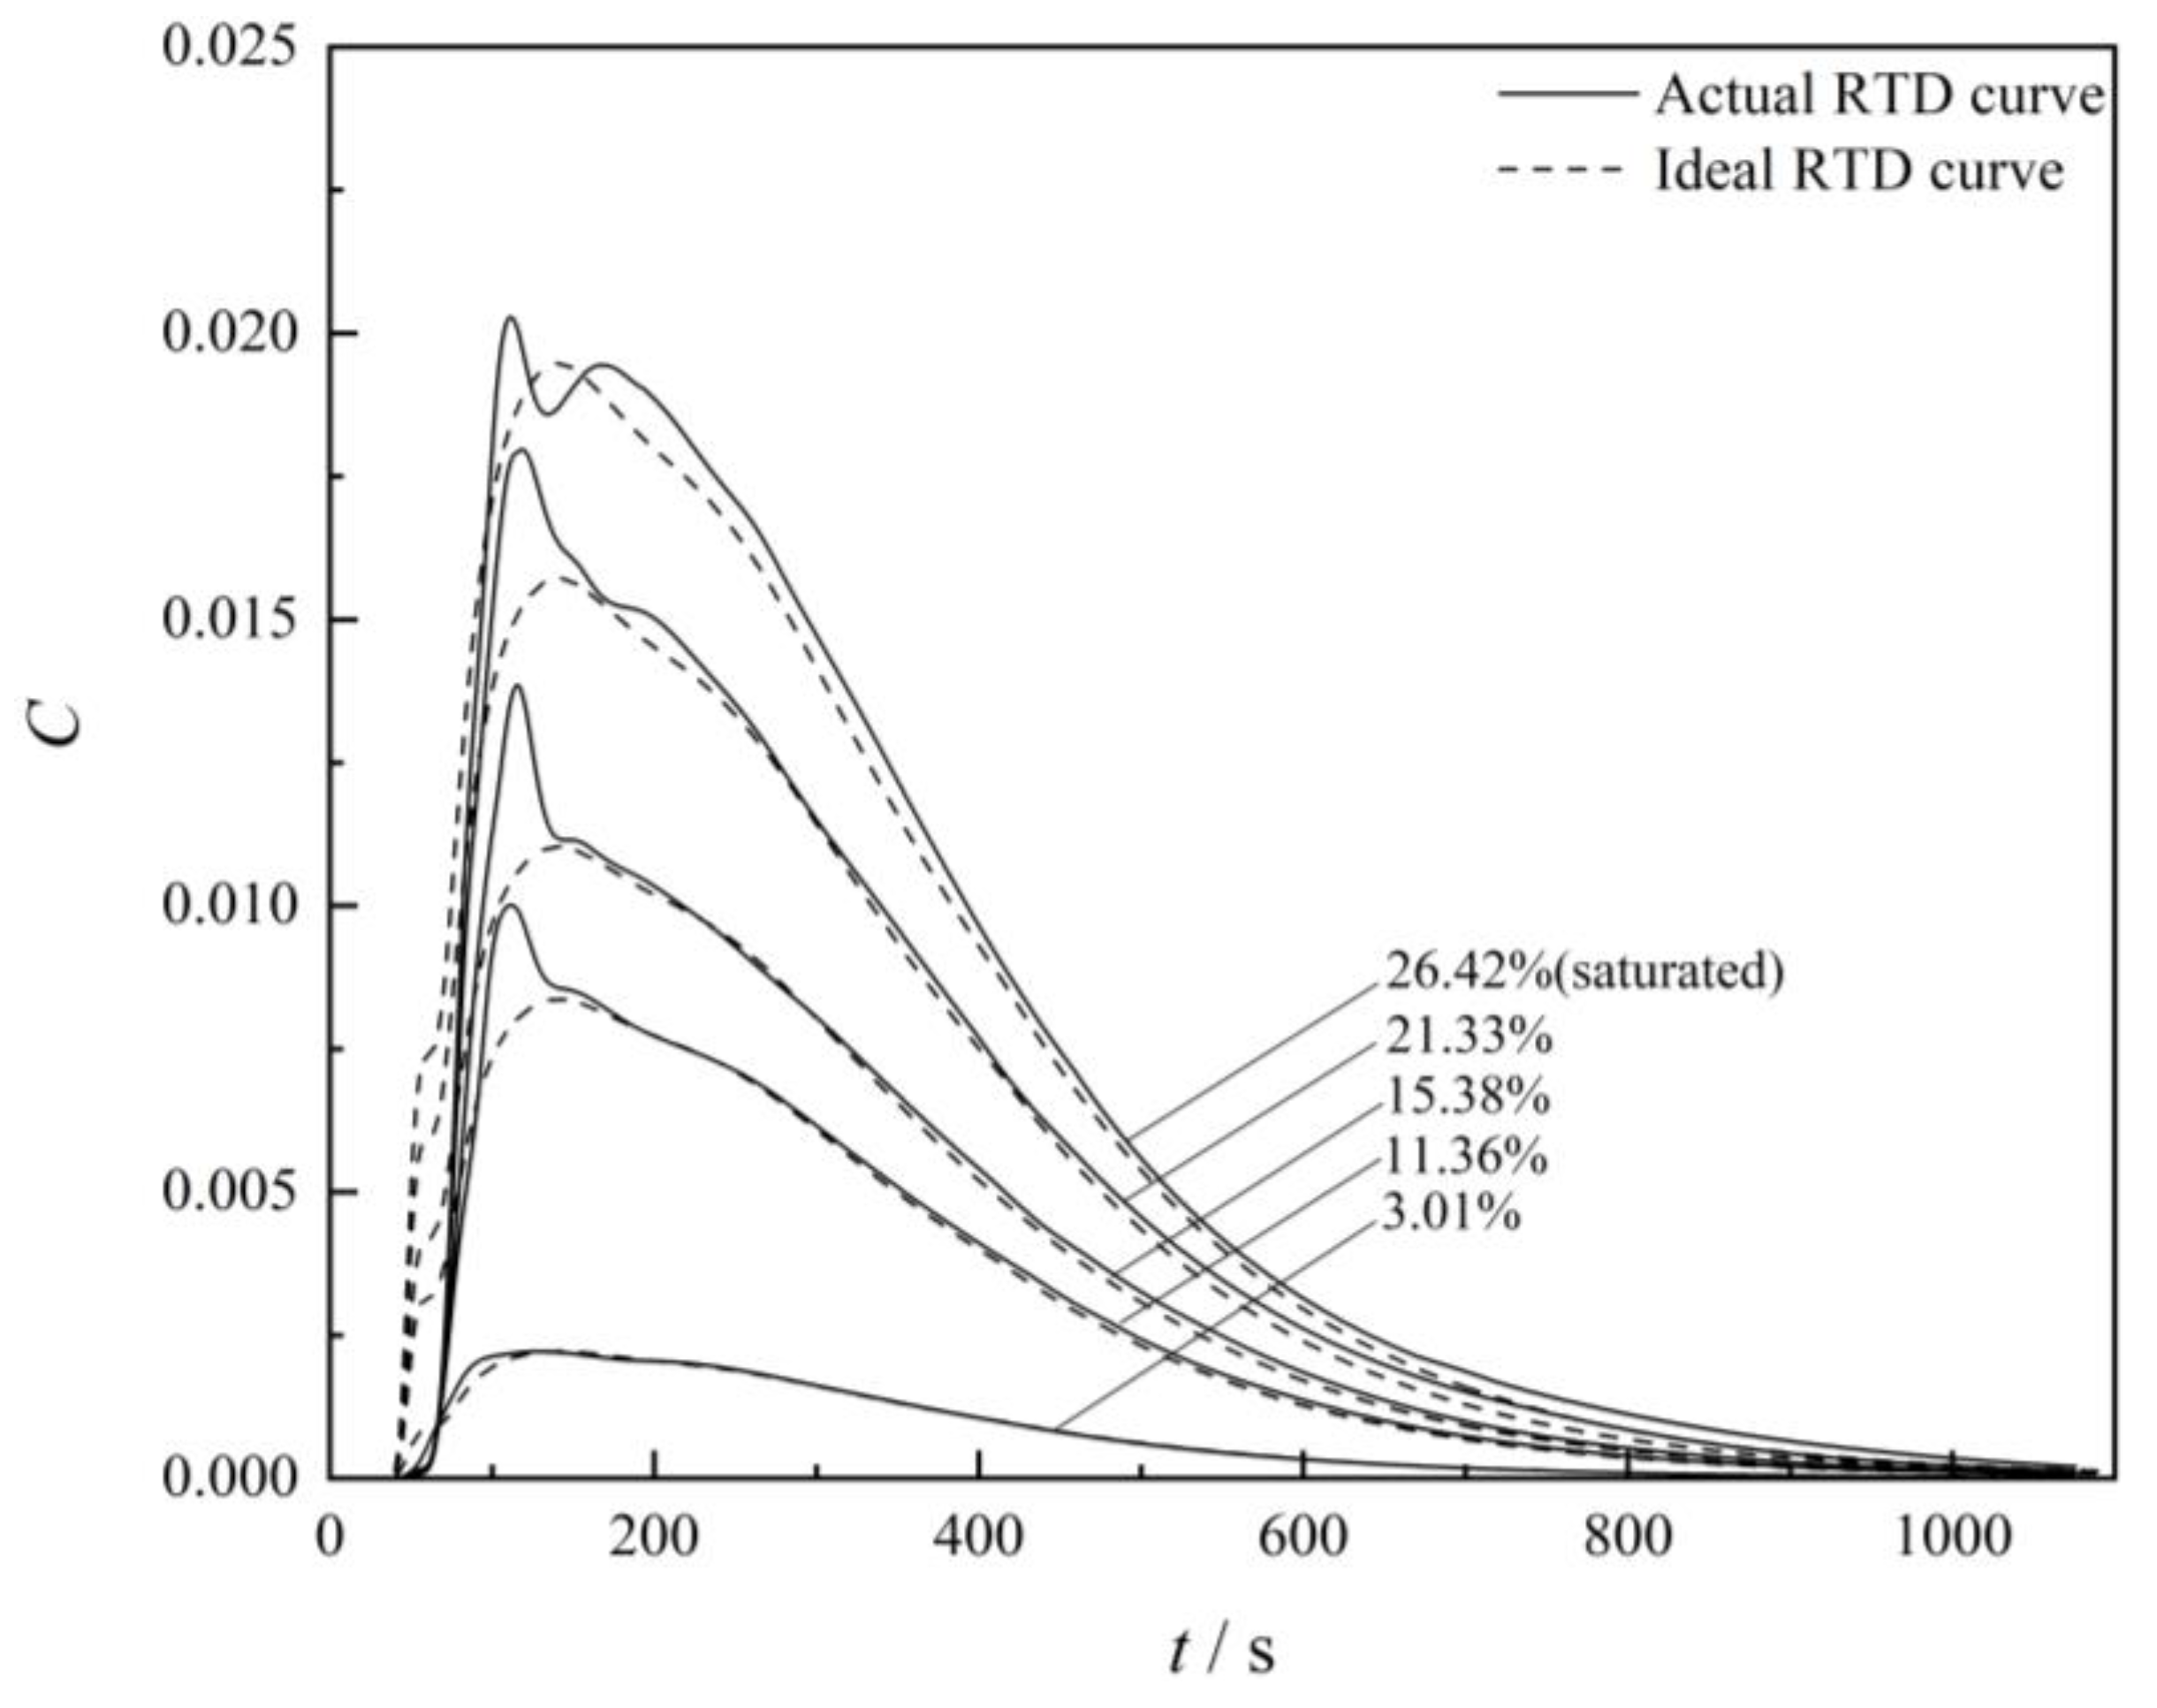
Figure 7 gives the numerical results of RTD curves in the case of different tracer mass concentrations and the same tracer solution volume (100 mL). When the tracer is the saturated NaCl solution, the RTD curve has double peaks. When the tracer mass concentration falls to 21.33%, 15.38% and 11.36%, the related RTD curves have a sharp peak. When the tracer mass concentration falls to 3.01%, the RTD curve is a flat RTD curve. In other words, with the decrease of the tracer concentration, the RTD curves change from the double peaks RTD curve to the sharp single peak RTD curve, then to the flat single RTD curve. Such a phenomenon comes from the fact that the density difference between the tracer and the fluid leads to the stratified flow. Consequently, there are two streams with the tracer reaching the tundish outlet at different moments. When the tracer concentration decreases gradually, the density difference decreases, and then the stratified flow phenomenon becomes weaker.
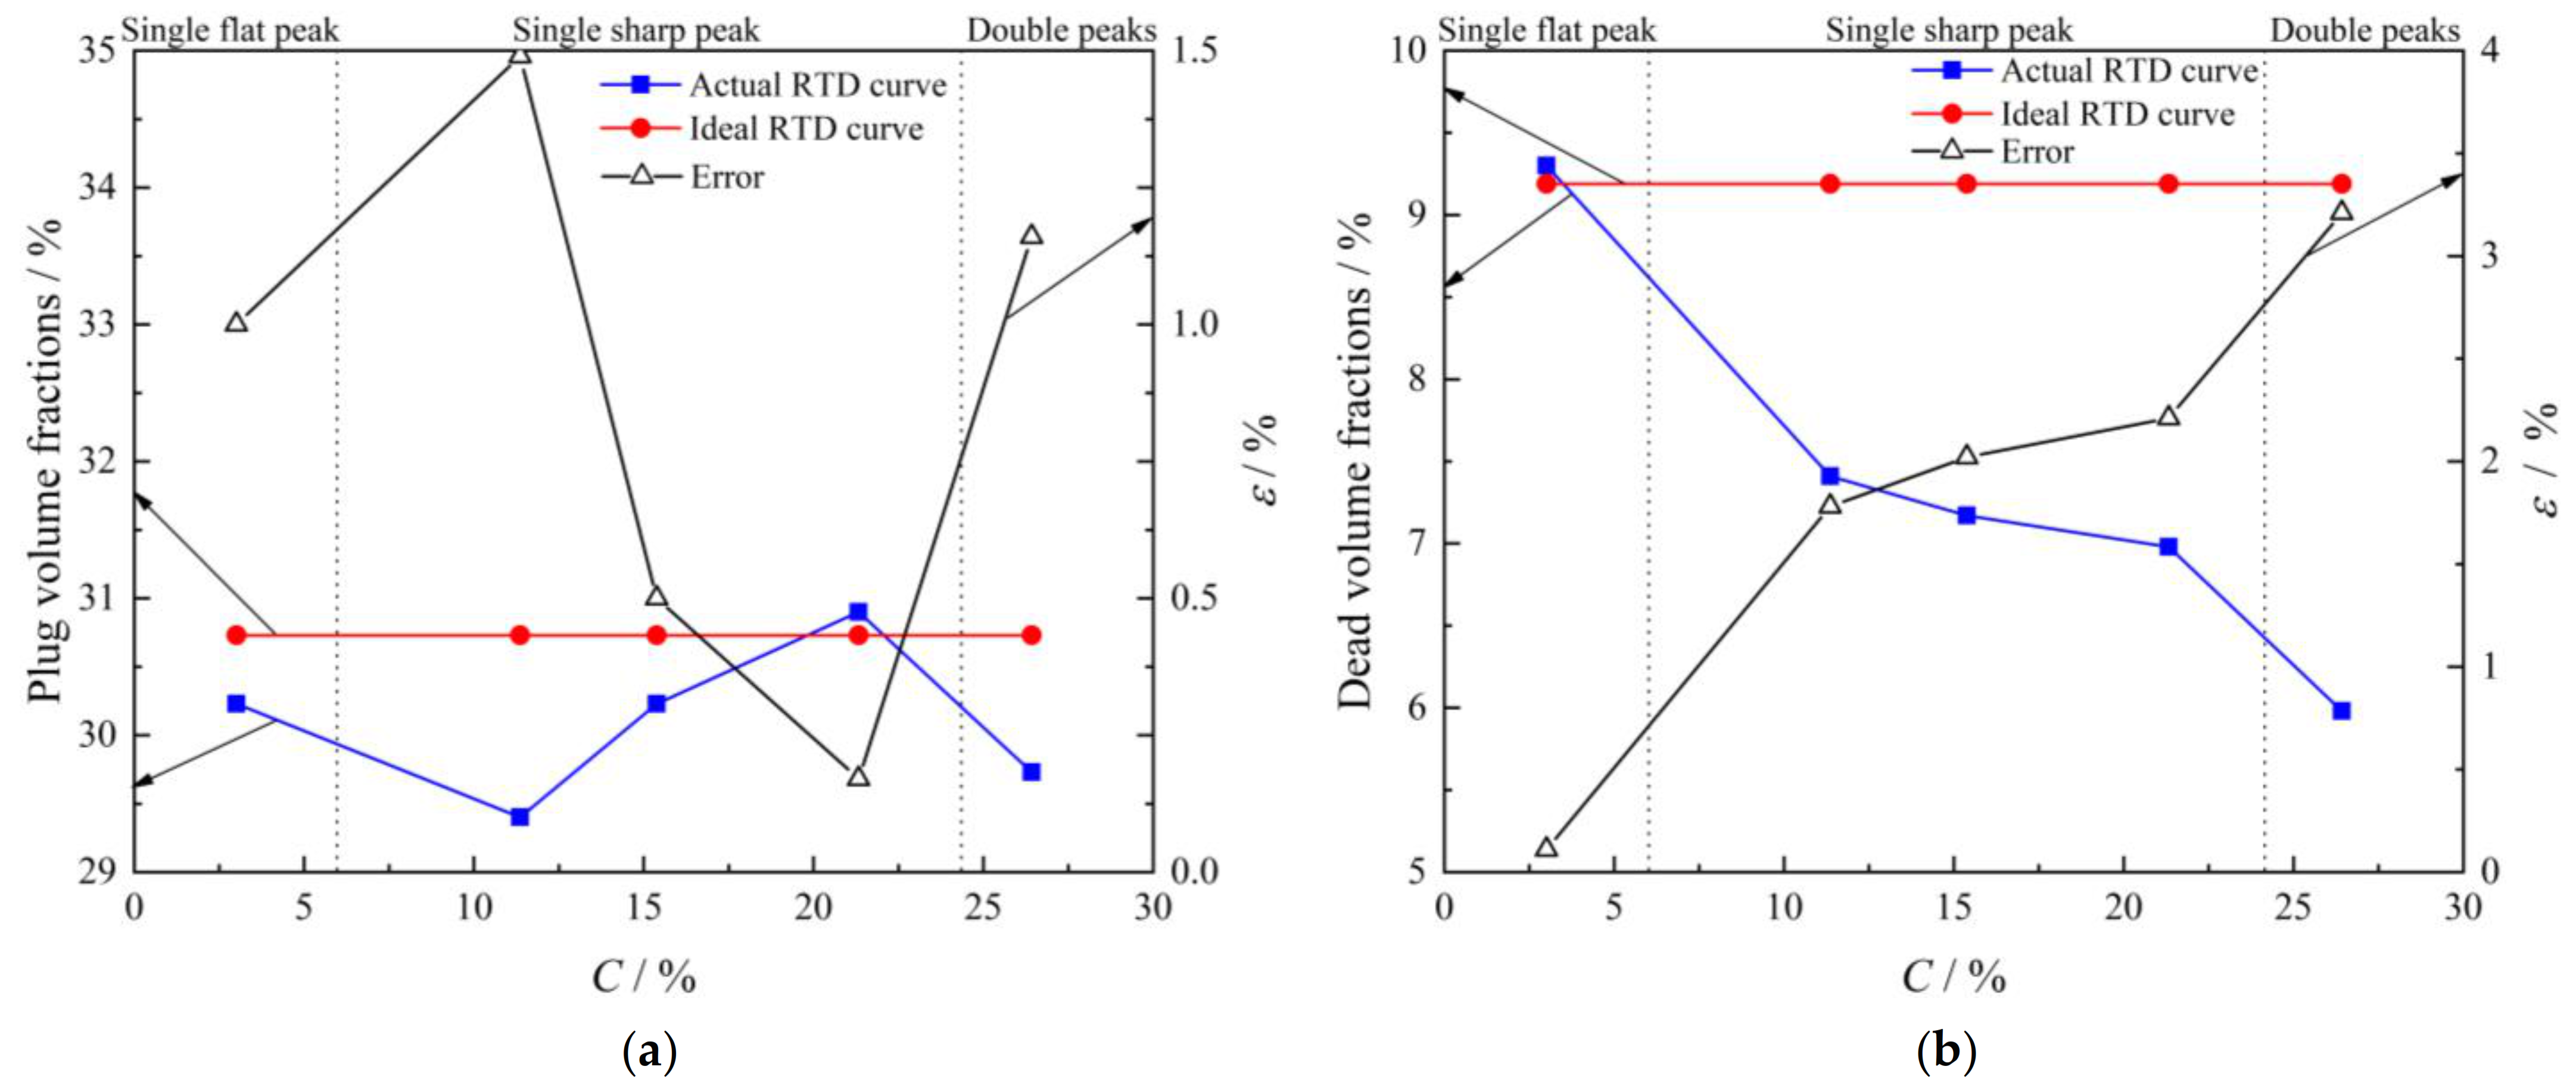
Figure 8 shows that, for the ideal RTD curve, with the increase of the tracer concentration, the plug volume fraction, the well-mixed fraction and the dead volume fraction remain the constant. The reason leads to such interesting phenomena: In the mathematical model of ideal RTD curve, the physical parameter of the tracer is equal to that of the water, so the analysis result of ideal RTD curve should be independent on the tracer mass concentration.
Figure 8a shows that, with the increase of the tracer concentration, the plug volume fraction of actual RTD curve follows the following rule: decrease → increase → decrease. Two reasons lead to such a phenomenon.
(1)
The change of the tracer concentration results in the change of flow field. With the increase of the tracer concentration, the actual RTD curve changes from the flat single peak RTD curve to the sharp single peak RTD curve, then to the double peaks RTD curve.
(2)
Table 7 shows that with the increase of tracer mass concentration, the sum of the minimum residence time and the peak concentration time follows the following rule: decrease → increase → decrease due to the relevant variation of flow field.
Figure 8b shows that the dead volume fraction of actual RTD curve decreases with the increase of the tracer concentration because the fact that the fluid with tracer flows along the tundish bottom results in the longer path from the ladle shroud to the tundish outlet.
Figure 8c shows that, with the increase of the tracer concentration, the well-mixed volume fraction of actual RTD curve follows the following rule: increase → decrease → increase. The well-mixed volume is closely related to the plug volume and the dead volume. In the classical combined model, the sum of three volume fractions should be 1. For the RTD curves with single sharp peak, the well-mixed volume fraction does not increase (or decrease) monotonically with the tracer concentration because there are two contradictory factors: the plug volume fraction increases with the increase of the tracer concentration, the dead volume fraction decreases with the increase of the tracer concentration.

4.2. Tracer Solution Volume

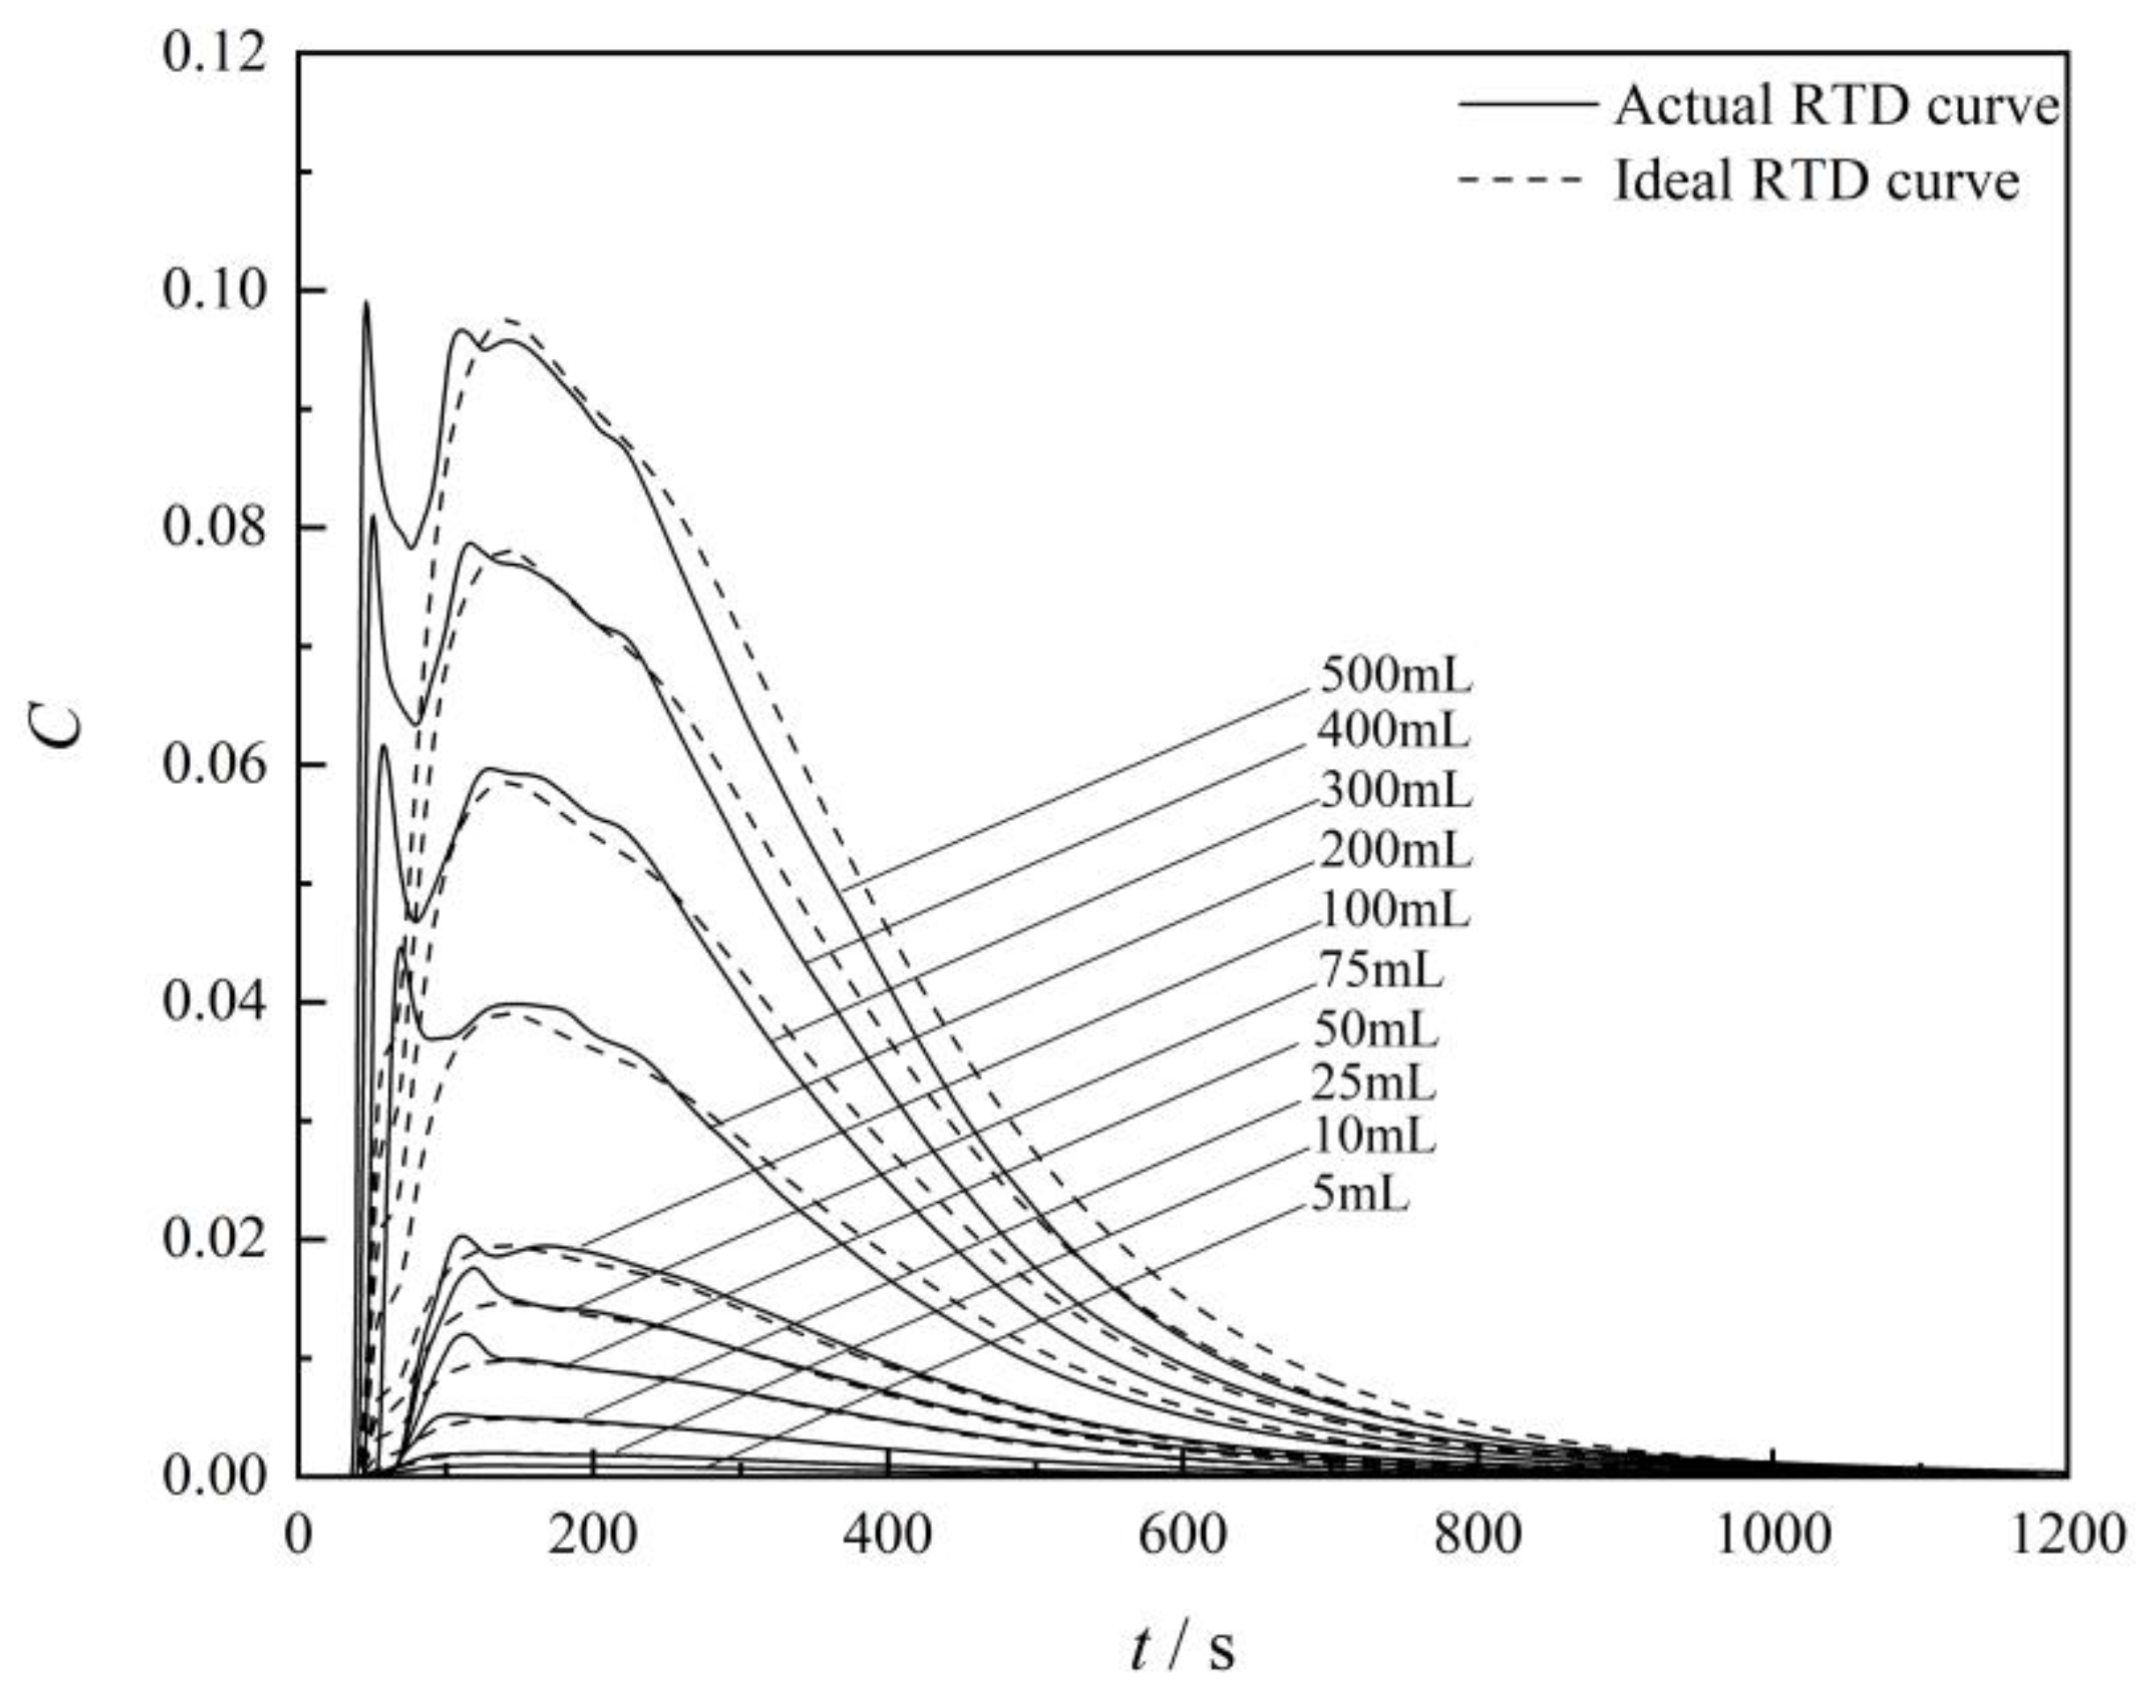
Figure 9 gives the numerical results of RTD curves in the case of different NaCl solution volumes and the saturated NaCl solution (26.42%). When the tracer solution volumes are 100 mL, 200 mL, 300 mL, 400 mL and 500 mL NaCl solution, double peaks appear. When the tracer solution volume falls to 75 mL, 50 mL and 25 mL, there is a sharp peak. When the tracer solution volume falls to 10 mL, there is a flat RTD curve. In other words, with the decrease of the tracer solution volume, the RTD curves change from the double peaks RTD curve to the sharp single peak RTD curve, then to the flat single peak RTD curve. The reason for this phenomenon is the same as the case of different concentrations.
Table 8 shows that the RTD curves in the case of different tracer solution volumes have the following characteristics:
(1)
The first peak concentration increases with the tracer solution volume, when the tracer solution volume increases from 100 mL to 500 mL, the first peak concentration is always greater than the second peak concentration.
(2)
With the increase of the tracer solution volume, the first peak time follows the following rule: decrease → increase → decrease. Because the RTD curves change from the single flat peak to the single sharp peak, then to the double peaks.
(3)
With the increase of the tracer solution volume, the second peak time decreases monotonously and the second peak concentration increases monotonously.
(4)
With the increase of the tracer solution volume, the average residence time follows the following rule: keep unchanged → increase → decrease because the RTD curves change from the single flat peak to the single sharp peak, then to the double peaks.
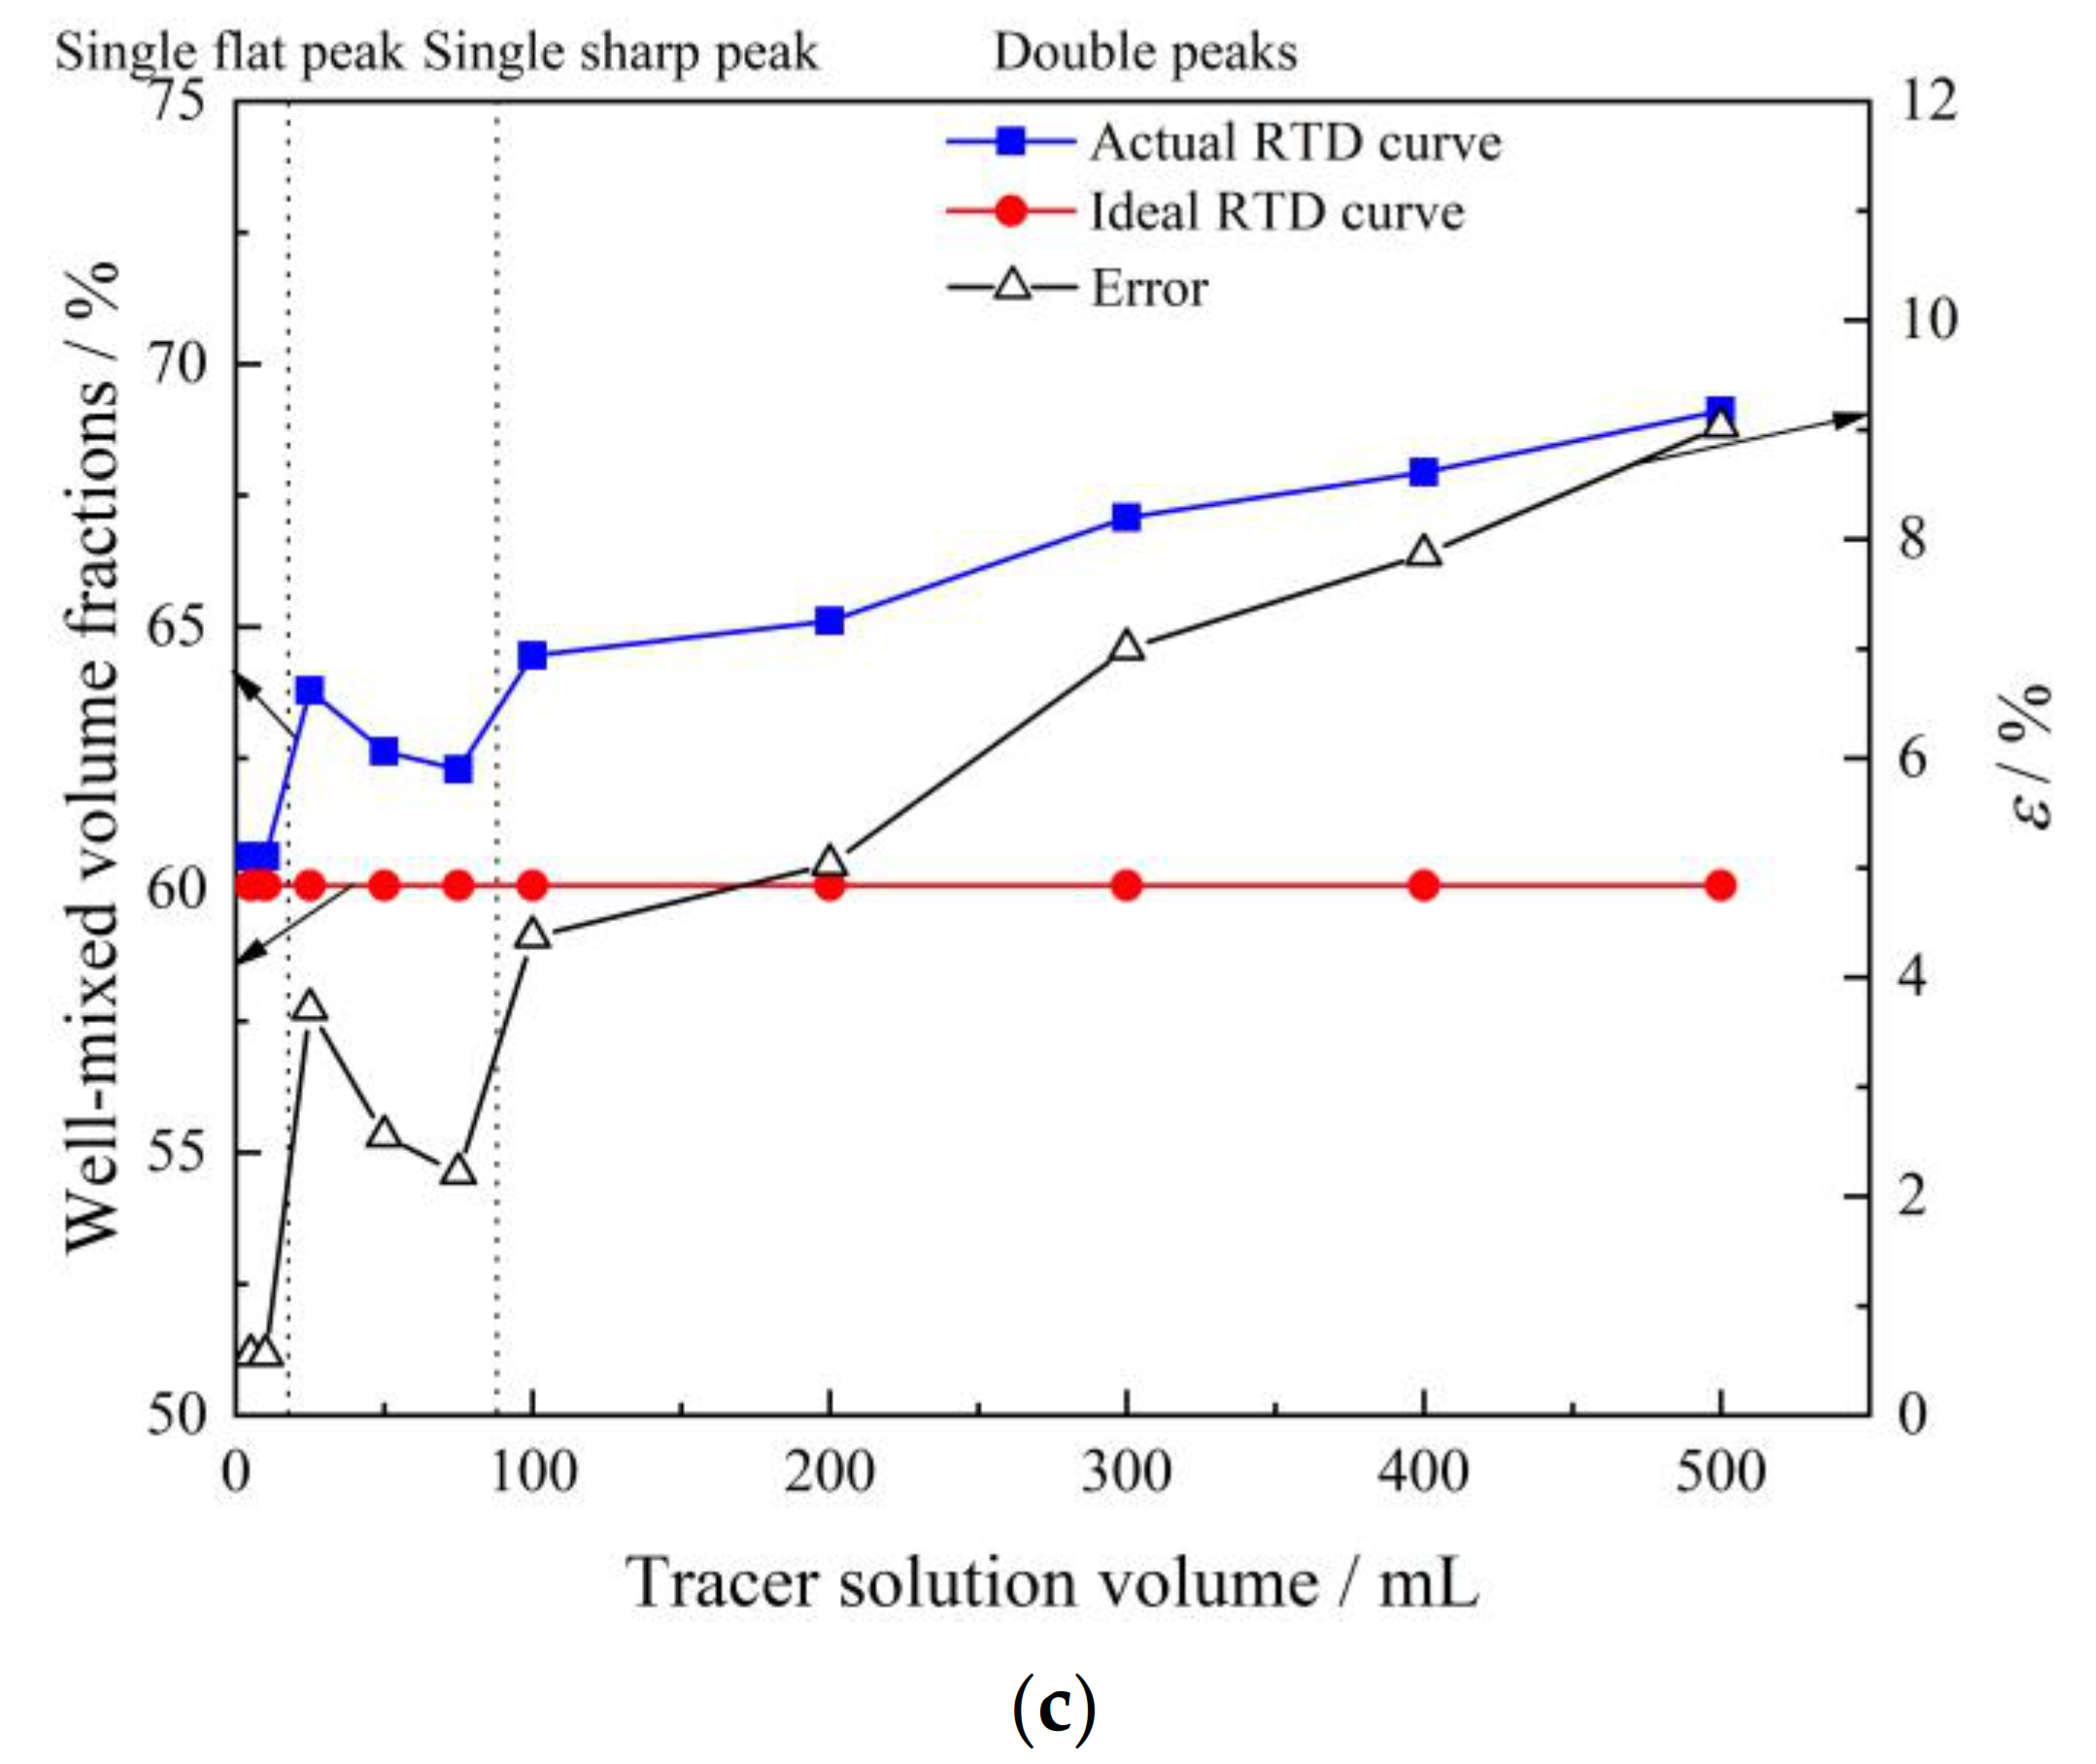
Figure 10 shows that the effect of the tracer solution volume on the RTD curve is similar to that of the tracer concentration on the RTD curve.
(1)
For the ideal RTD curve, the plug volume fraction, the dead volume fraction and the well-mixed volume fraction remain the constant.
(2)
If the tracer solution volume is less than 10 mL, the related plug volume fraction, dead volume fraction and well-mixed volume fraction are close to the analysis result of ideal RTD curve.
(3)
With the increase of the tracer solution volume, the plug volume fraction of actual RTD curve follows the following rule: decrease → increase → decrease. The rule is the same as the case of different mass concentrations. The volume of tracer has a great influence on the flow field in tundish. As a result, with the increase of the tracer volume, the actual RTD curve changes from the flat single peak RTD curve to the sharp single peak RTD curve, then to the double peaks RTD curve.
(4)
With the increase of the tracer solution volume, the dead volume fraction of actual RTD curve follows the following rule: decrease → increase. The reasons for the decrease of dead volume fraction is that the longer flow path of tracer leads to the longer average residence time in the tundish. The reasons for the increase is that the greater solute buoyancy leads to stronger fluid flow, then the average residence time of the fluid becomes shorter in the tundish.
(5)
With the increase of the tracer solution volume, the well-mixed volume fraction of actual RTD curve follows the following rule: increase → decrease → increase.

4.3. General Discussion

4.3.1. Tracer Transfer Behavior

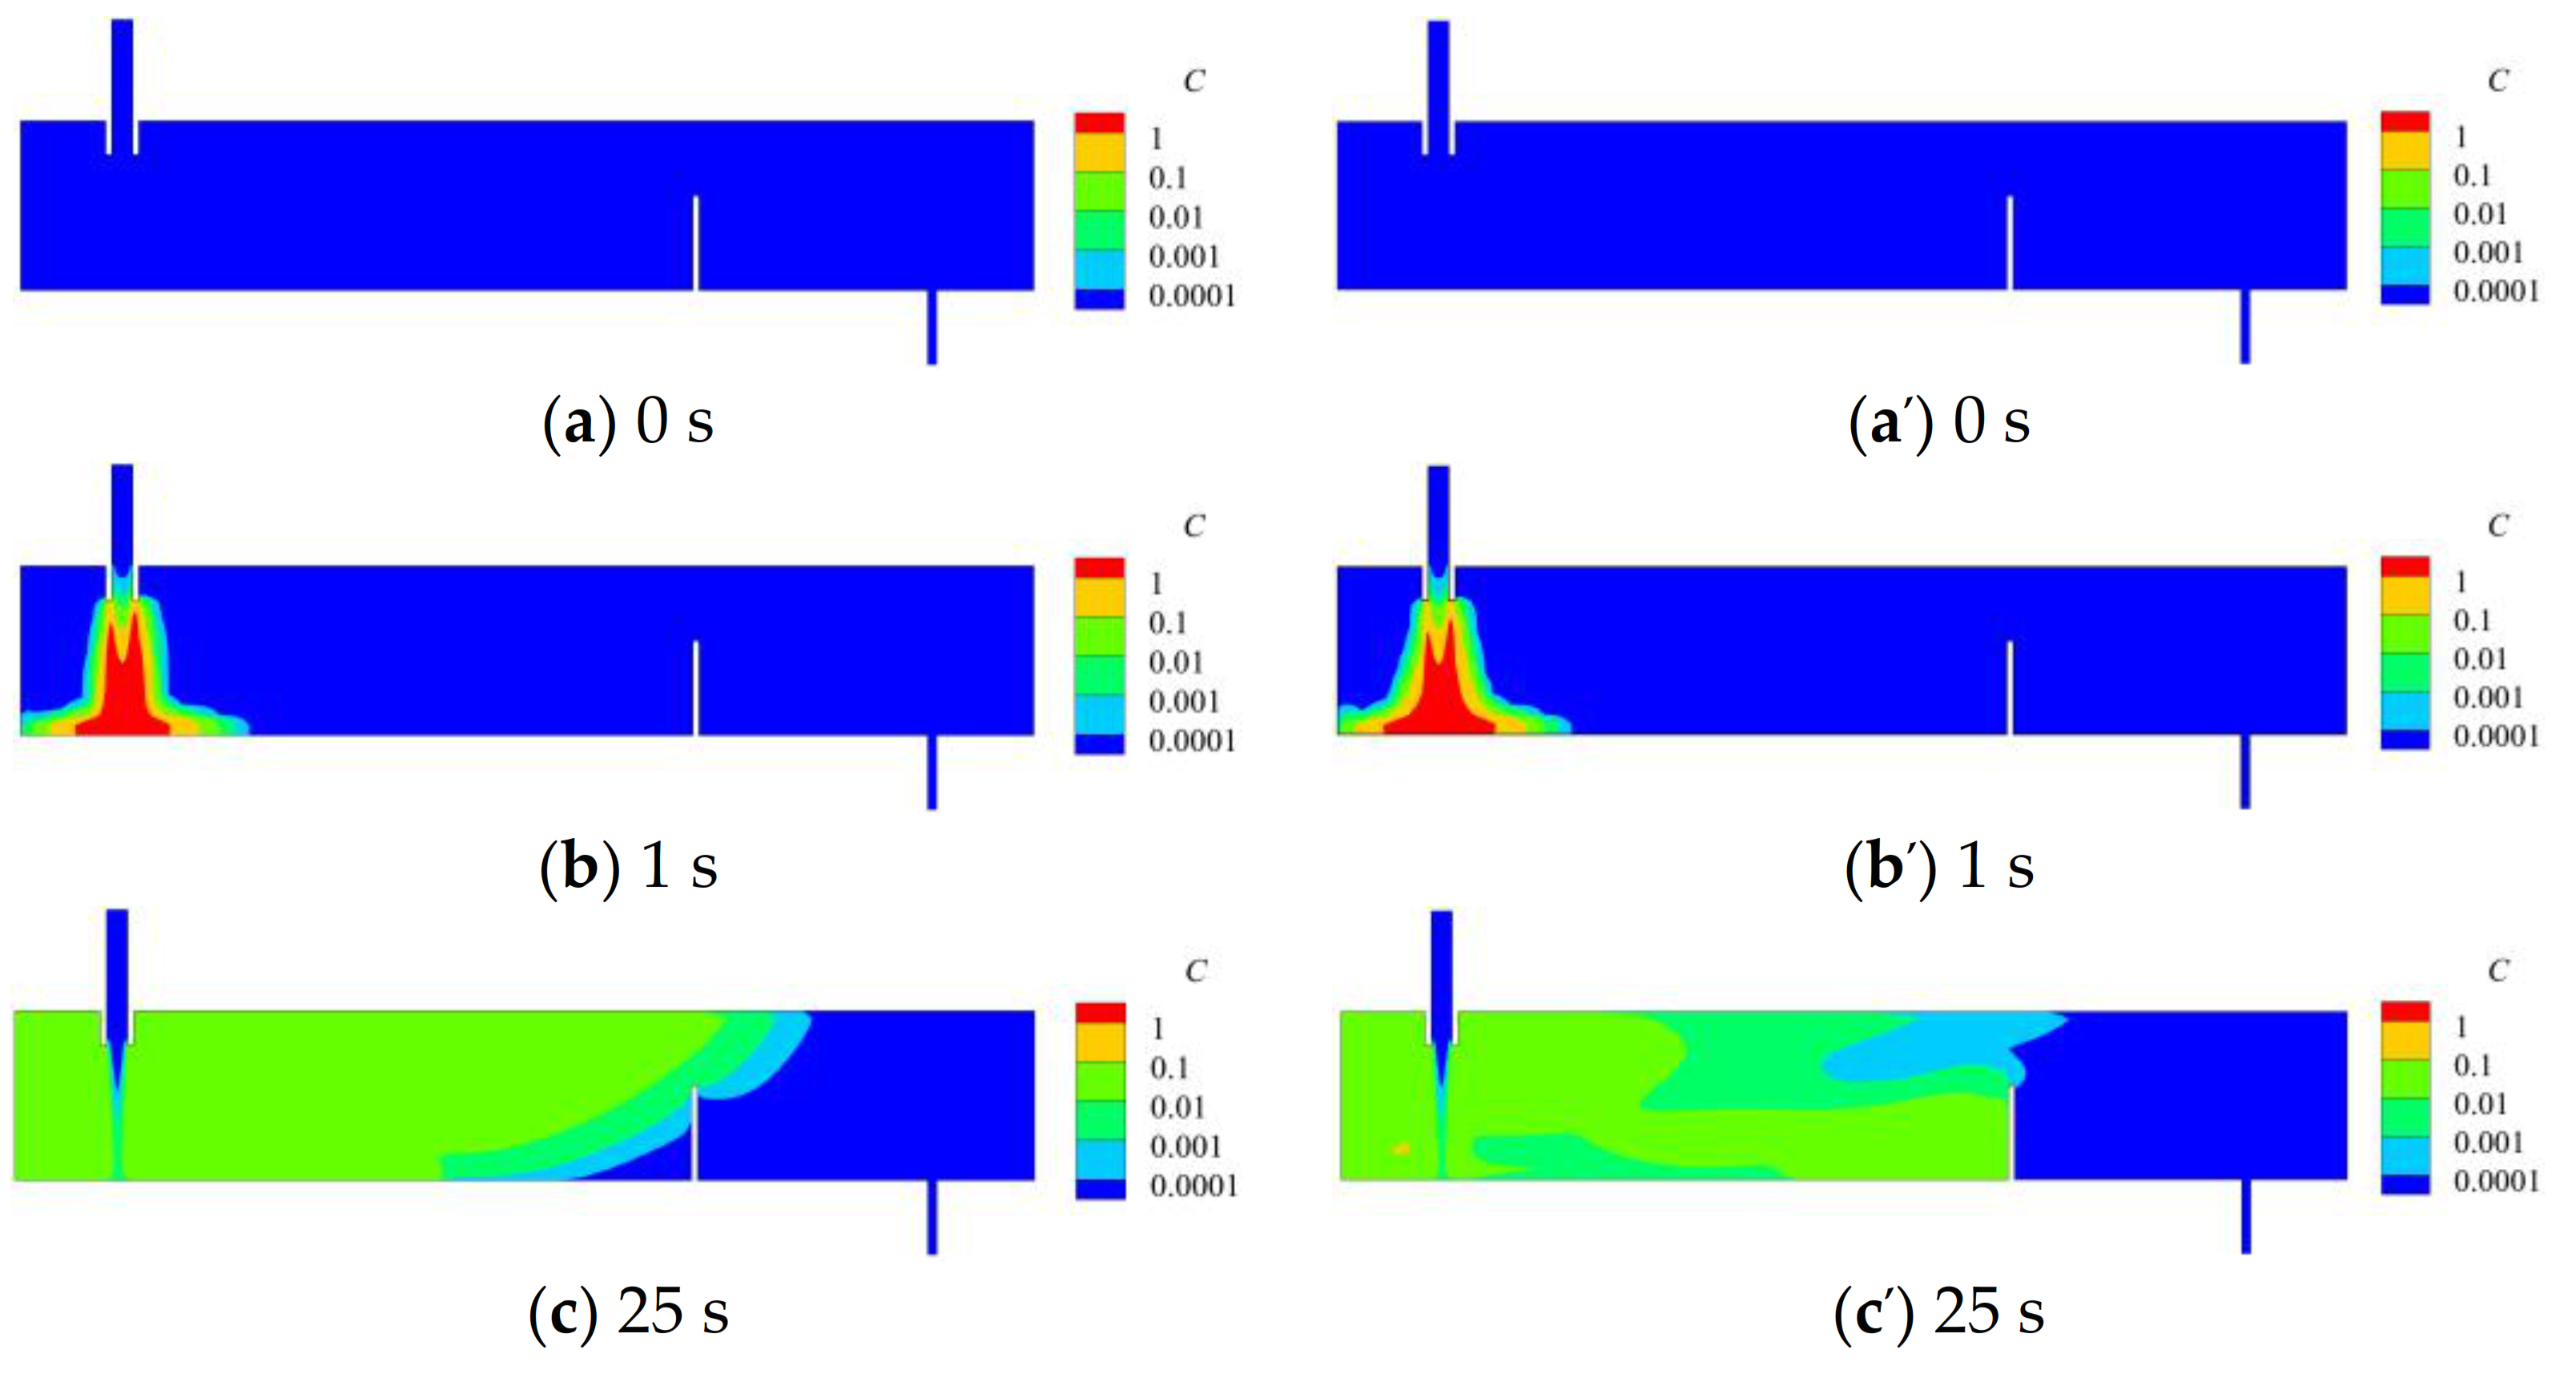
Figure 11 gives the tracer (100 mL saturated solution) transport process. First, the tracer leaves the ladle shroud and spreads out until it impinges the tundish bottom. Then, the tracer flows along the tundish bottom and spreads around. Next, some tracer climbs over the dam and flows toward the outlet. Finally, the tracer reaches the tundish outlet and flows out of the tundish. The difference of the tracer behavior between the ideal tracer and actual tracer comes from the density difference. The ideal tracer is considered to have the same density as water, while the actual tracer has the same density as the corresponding salt solution. The fluid is always affected by the solute buoyancy in the tundish. Therefore, the phenomenon of stratified flow occurs during the transport of tracer in tundish (shown in Figure 11c), which result in the two peaks of RTD curve (shown in Figure 5). The short-circuiting flow maybe also lead to the double-peaks RTD curve, but the tundish structure (dam without hole) selected in this paper has eliminated this situation.

4.3.2. Solute Buoyancy

In order to have a deep insight into the effect of tracer mass concentration on the flow field, a dimensionless number, δ (velocity difference number), is introduced to reveal the effect of the solute buoyancy. The velocity difference number represents the ratio of the velocity difference caused by the solute buoyancy to the velocity in the case of ideal tracer.
δ = u u I 2 + v v I 2 + w w I 2 u I 2 + v I 2 + w I 2
where u , v , w is the velocity at x, y, z direction in the case of actual tracer, u I , v I , w I is the velocity at x, y, z direction in the case of ideal tracer.
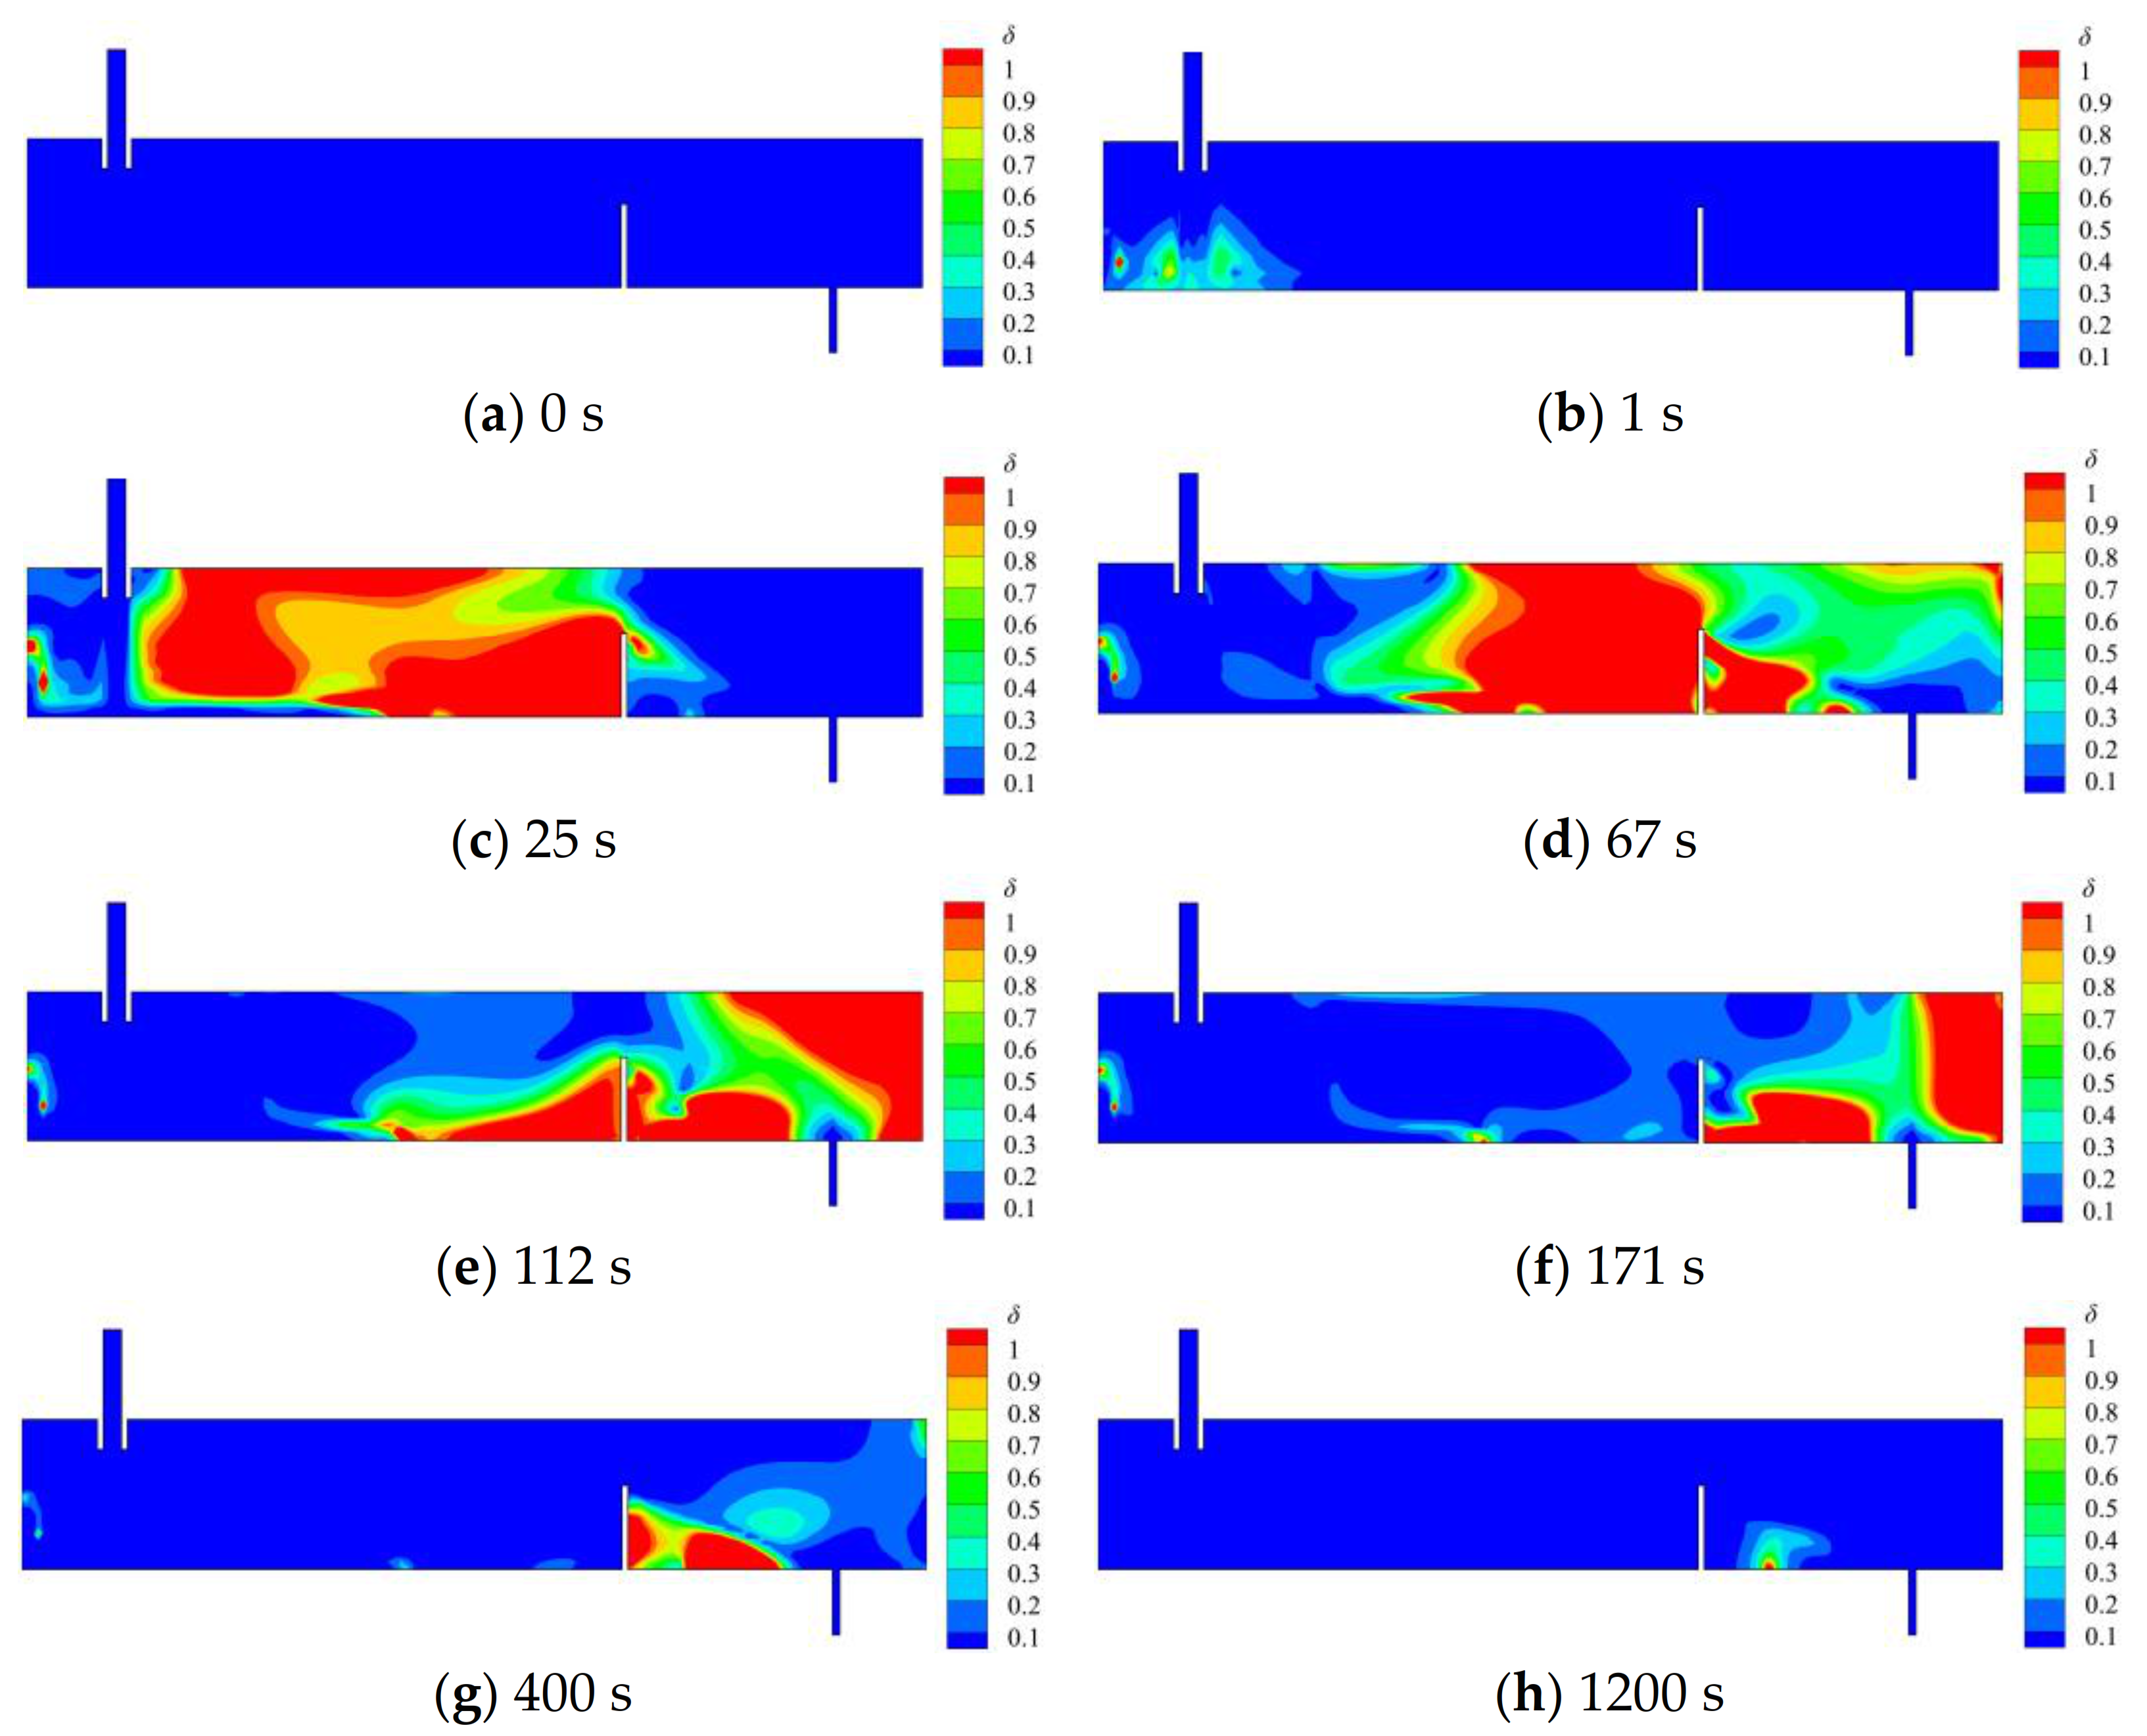
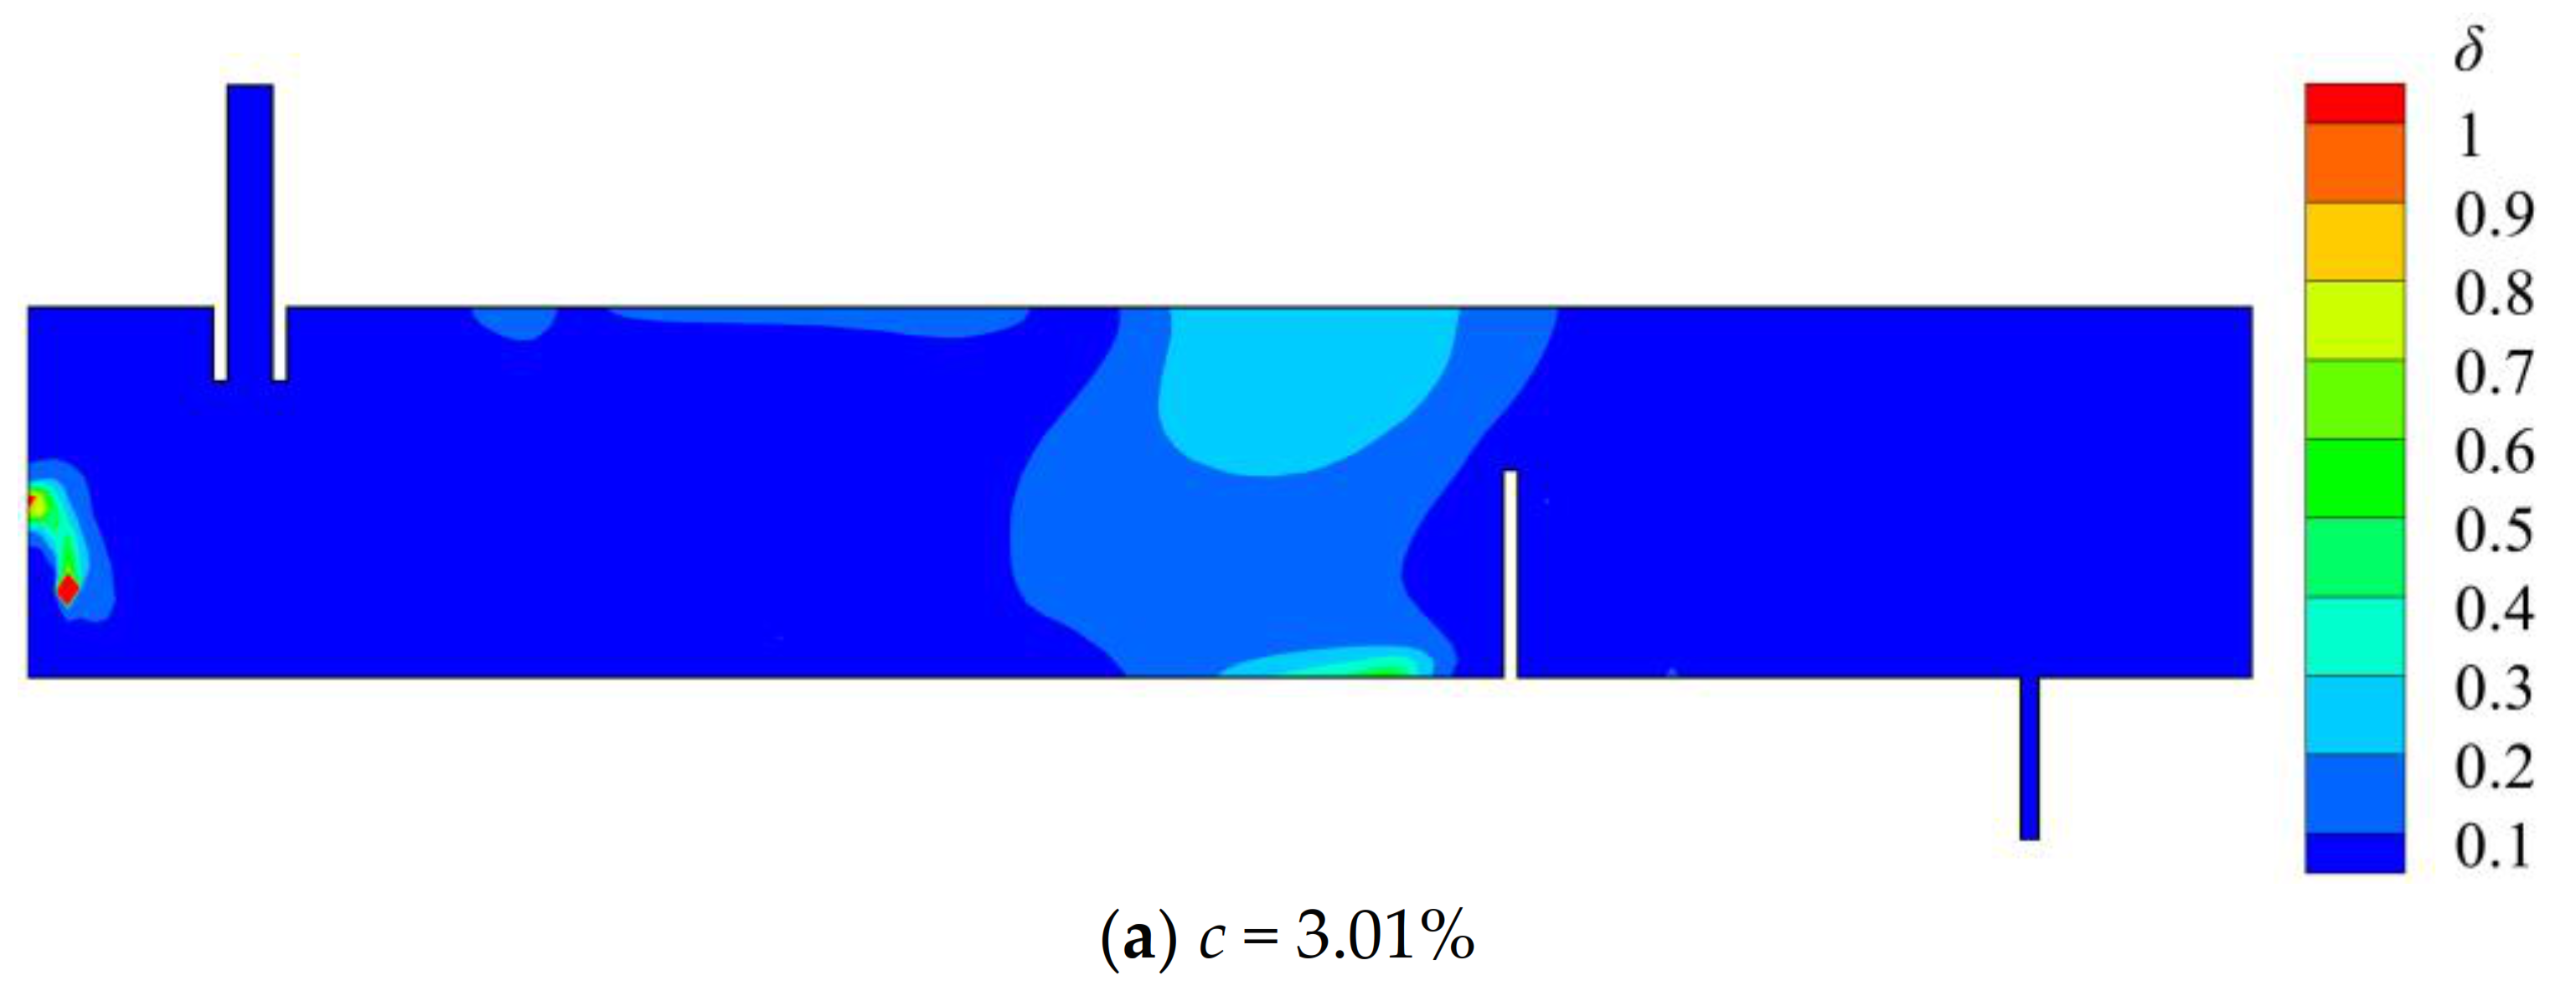
Figure 12 shows the distribution of δ (velocity difference number) in the central section of the tundish at different moments (tracer is 100 mL saturated NaCl solution).
(1)
The solute buoyancy has very little effect on the flow field at the initial stage of the tracer pulse (Figure 12a,b), because the tracer is in the region where the fluid flow fast.
(2)
With the help of the fluid flow, the tracer moves toward the outlet, the value of δ is big in the region (Figure 12c–f) where the tracer concentration is great (Figure 11c–f).
(3)
After 171 s, the tracer concentration in the tundish decreases with the time, the fluid flow in the case of actual tracer is closer to the fluid flow in the case of ideal tracer as shown in Figure 12g,h.
Figure 13 shows the effect of tracer mass concentration (volume is 100 mL) on the fluid flow in the tundish at 25 s. With the increase of tracer mass concentration, the stronger effect of solute buoyancy on the flow field leads to the differences among the RTD curves for different tracer mass concentrations. The value of δ becomes bigger in the region between the ladle shroud and the dam with the increase of the tracer mass concentration.
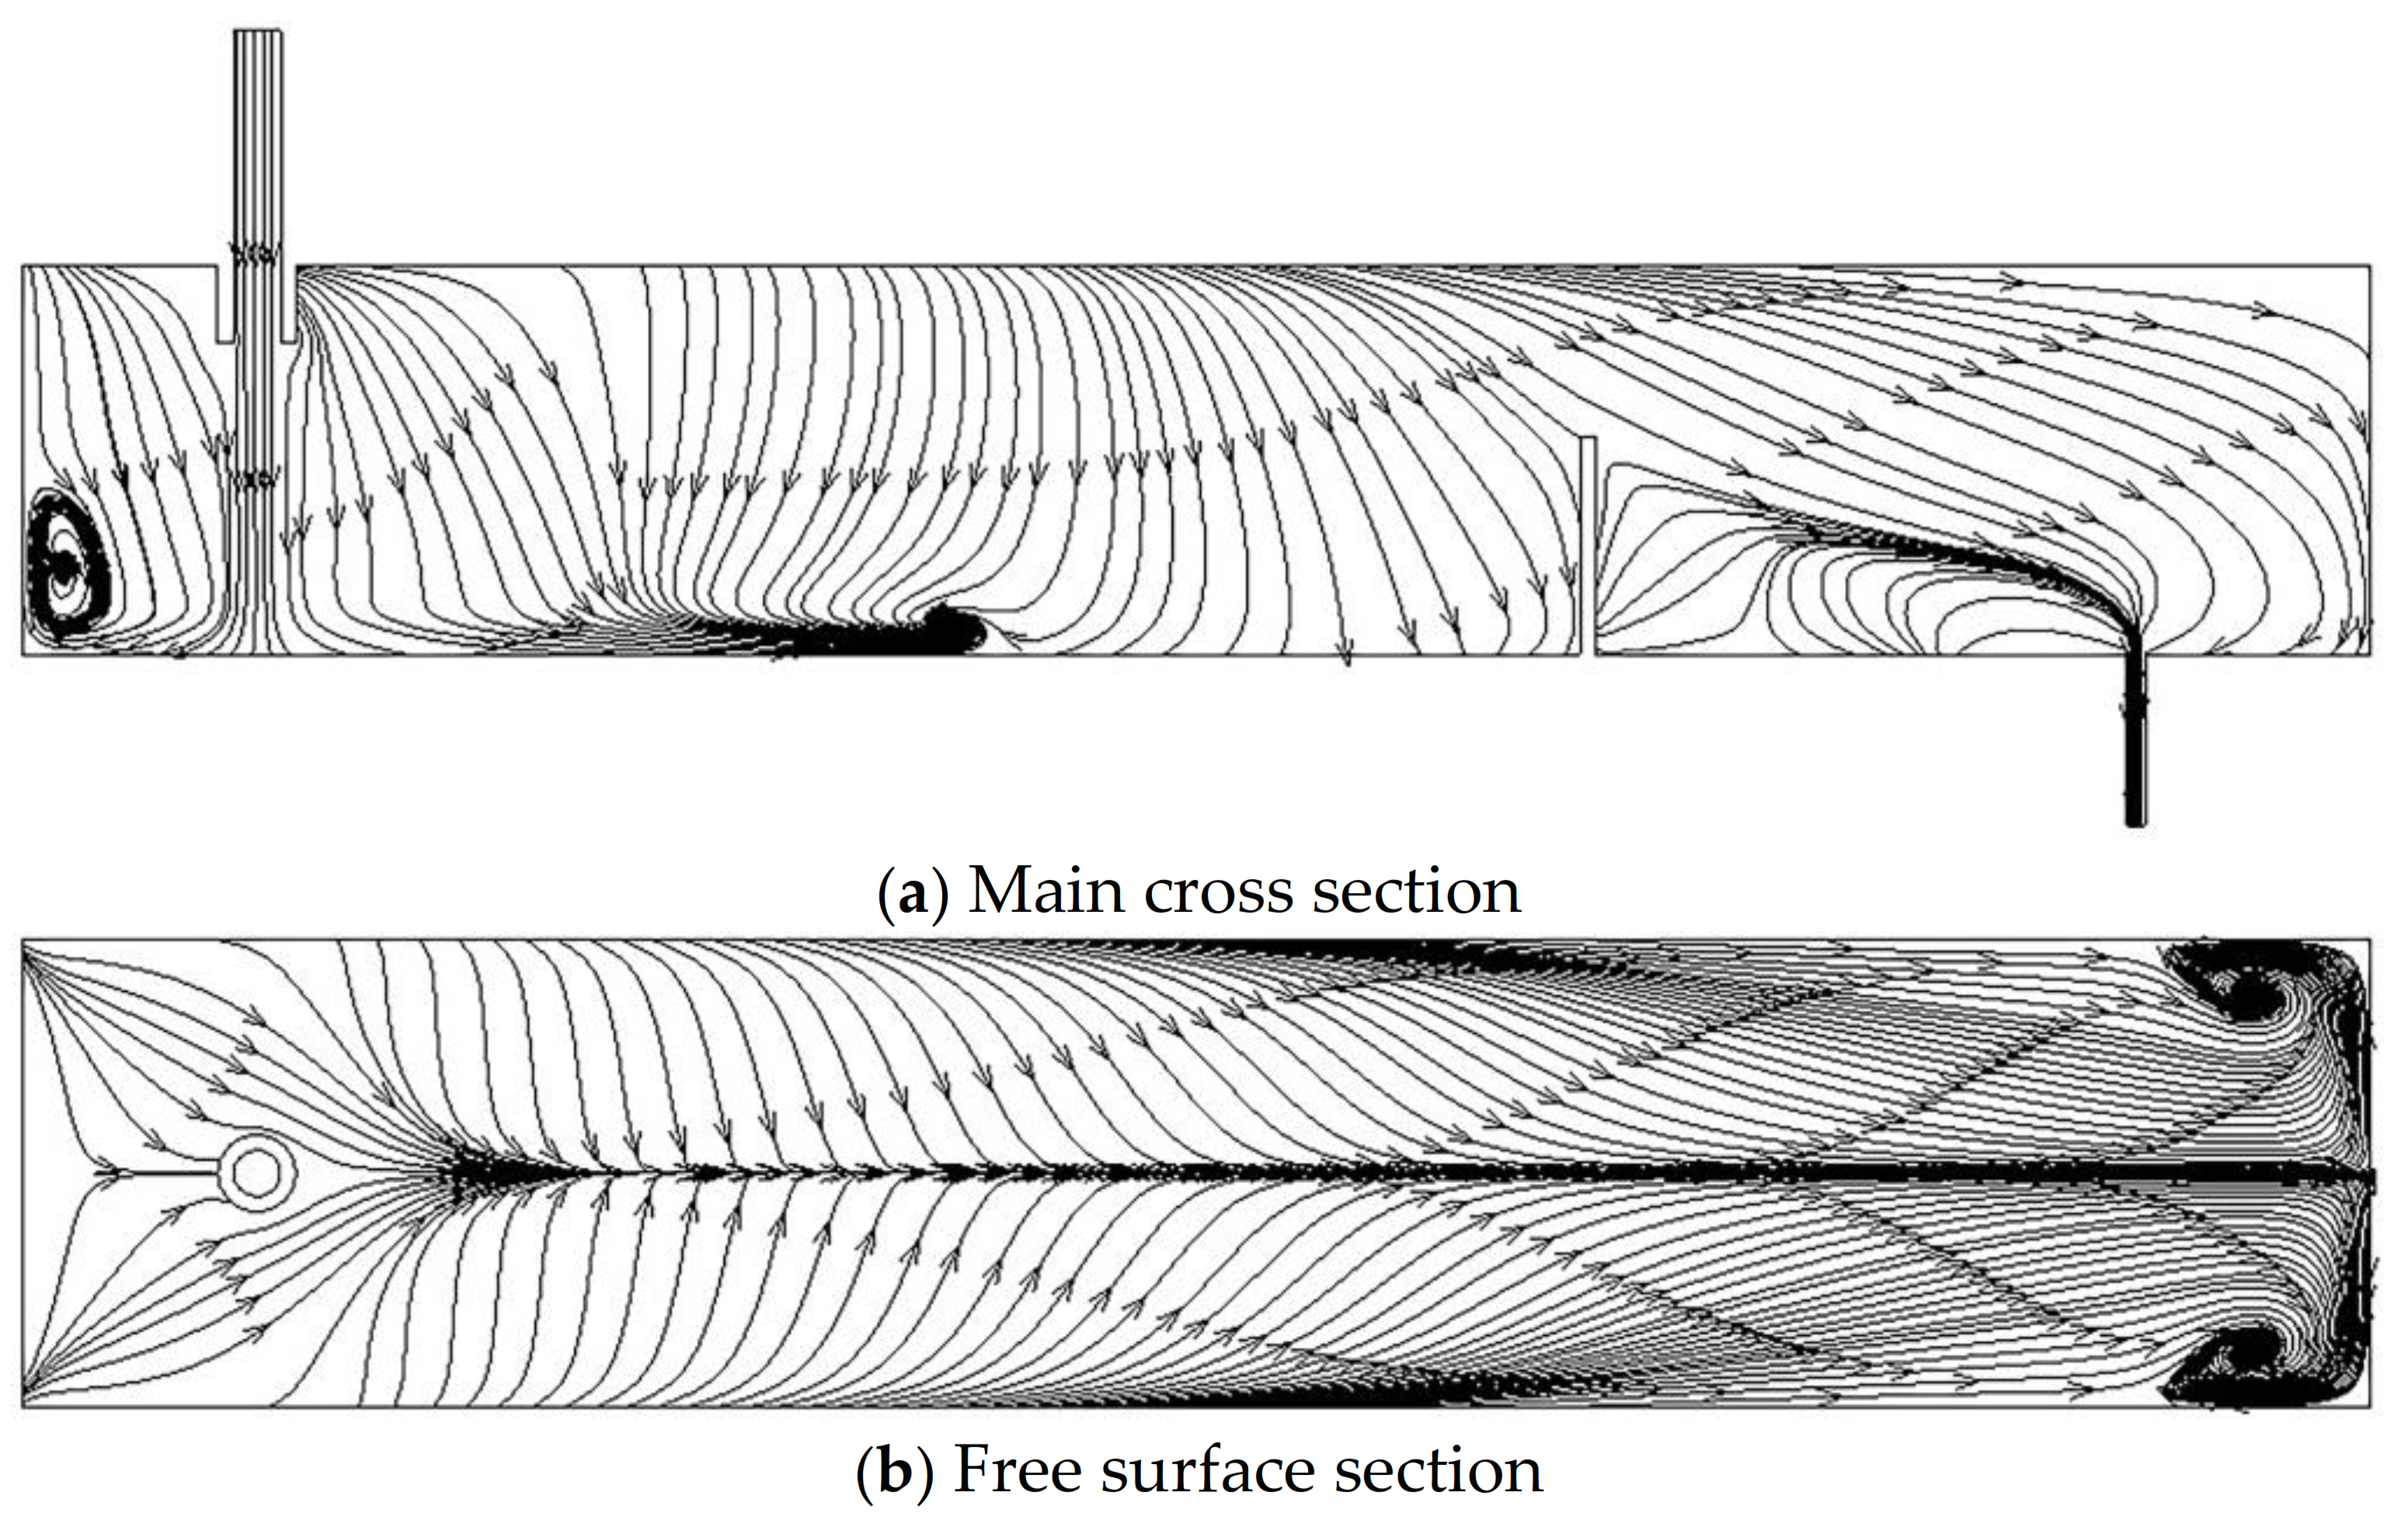
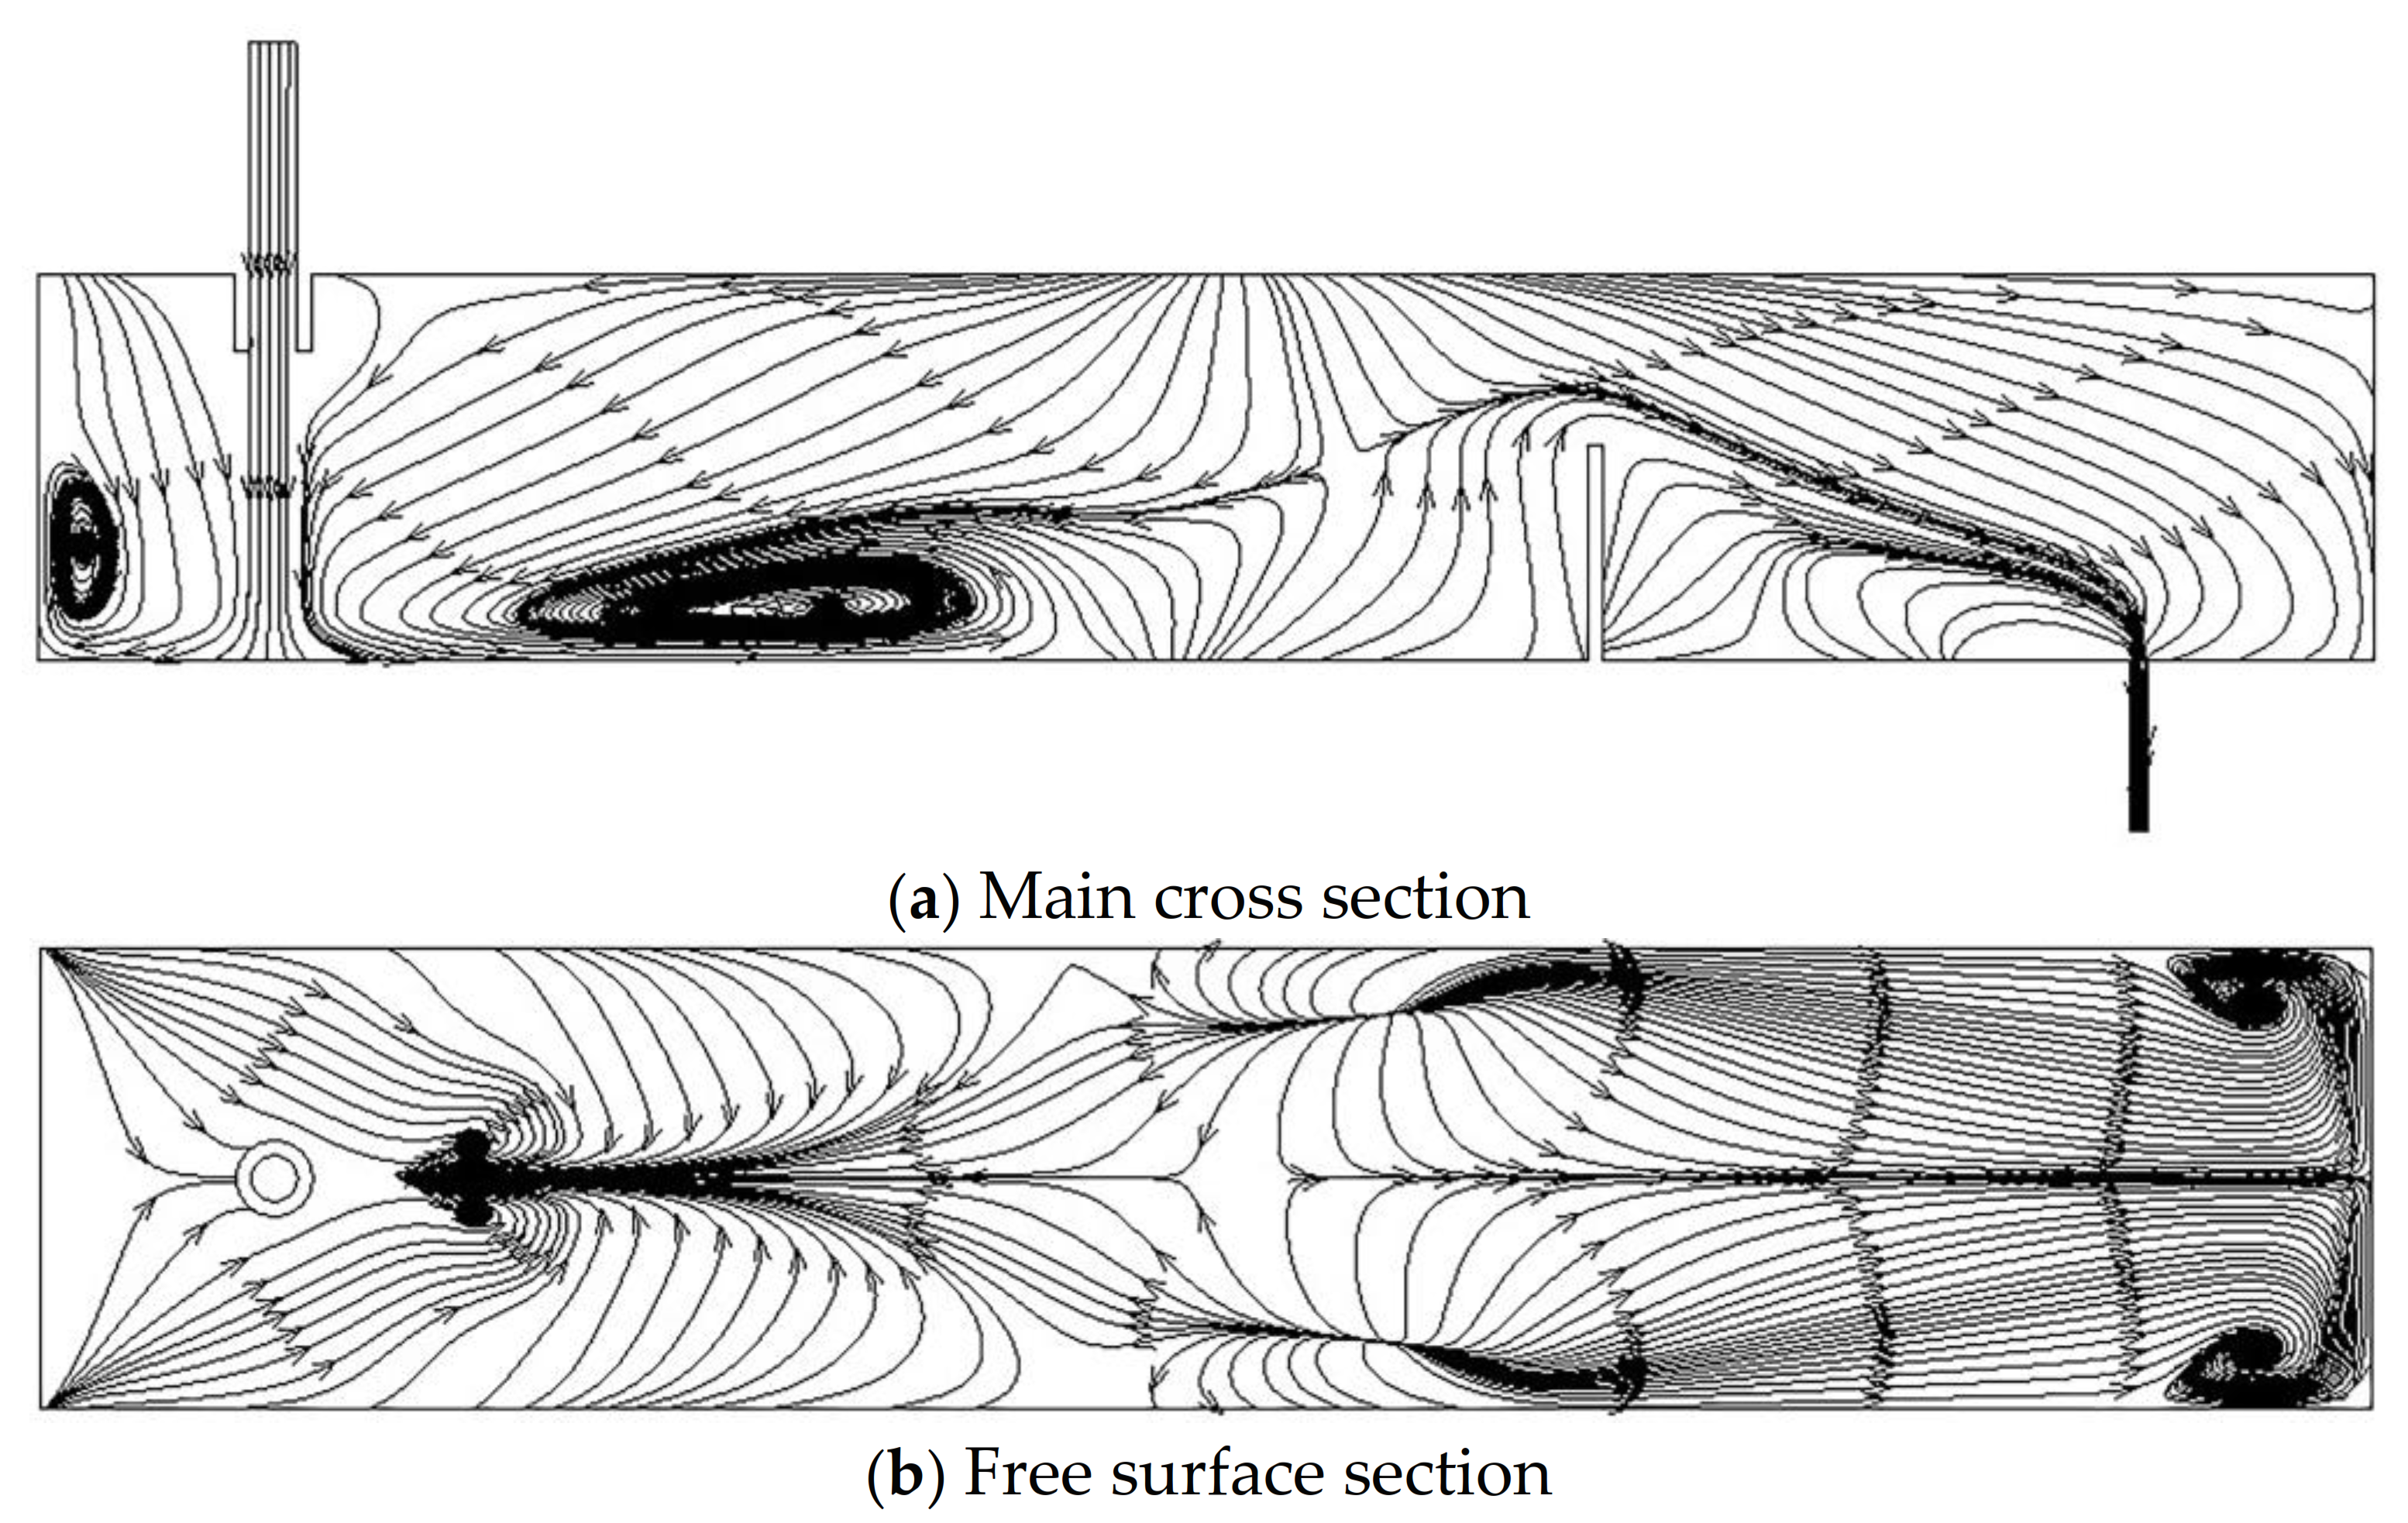
Figure 14 and Figure 15 give the flow field in the case of different tracer mass concentrations. They are similar flow fields at the left side of the ladle shroud and at the right side of the dam. However, there are different flow field between the ladle shroud and the dam. In the case of the ideal tracer, the fluid near the free surface flows from the ladle shroud to the dam. Some fluid impacts the dam and then flows along the tundish bottom, the other pass over the dam. In the case of the actual tracer, the velocity field is very complex. Some fluid near the free surface flows back to the ladle shroud. Near the tundish bottom, there is big vortex and some fluid climbs over the dam and then flow toward the outlet.
In summary, the tracer changes the flow behavior inside the tundish during the water model experiment. The reason leads to such an interesting phenomenon is the density difference between tracer and water. When water model experiment is used to restore the flow characteristics of molten steel. Double-peaks RTD curve usually appears in the current water model experiment. Based on the analysis of tracer transfer behavior, the stratified flow is a key fact to leads the double-peaks RTD curve. Therefore, the lower mass concentration and the smaller volume of the tracer can describe accurately the fluid flow behavior in the tundish.

5. Conclusions

In this paper, the momentum equations which involve the solute buoyancy is developed to investigate the effects of salt tracer amount and concentration on RTD curves. The numerical result is validated by water model experiment and industrial data. The conclusions are summarized as follows:
(1)
The predicted RTD curve in the case of solute buoyancy has the double-peaks shape, which is closer to the RTD curve by water model. However, the ideal RTD curve has the single flat peak shape, which is different from the RTD curve by water model.
(2)
With the increase of the mass concentration and the volume of the tracer, the shape of the RTD curve changes from single flat peak to single sharp peak and then to double peaks. However, the ideal RTD curves are always single flat peak. The phenomenon leads to an interesting fact. The plug volume fraction, dead volume fraction and well-mixed volume fraction change with the increase of the mass concentration and the volume of the tracer for the same flow field. In order to weaken this phenomenon, the low mass concentration and the small volume of the tracer are recommended for the water model experiment.
(3)
By comparing the tracer transfer behavior of ideal tracer with actual tracer, because of the difference of fluid density, there is a stratified flow phenomenon in the case of actual tracer. The stratified flow causes the tracer to split into two streams to reach the tundish outlet. Therefore, there are different RTD curves for the same flow field. In other words, the unreasonable tracer parameters maybe lead to the strange RTD curves.
(4)
For describing the effect of tracer on flow field, the velocity difference number (δ) is introduced to demonstrate the importance of the density difference between the tracer and the fluid. As time goes on, the effect of tracer on the fluid flow in the tundish first becomes stronger and then weakens gradually. With the decrease of tracer mass concentration, the effect of tracer on the fluid flow in the tundish weakens gradually.
In the future, we will focus on the following interesting issues:
(1)
The quantitative criterion should be proposed to determine the concentration and the volume of the tracer.
(2)
There are some RTD curve analysis models, and these model give different RTD analysis results, it is necessary to give the advantage and the disadvantage of these models.

Author Contributions

Conceptualization, Y.Z.; data curation, B.Y.; formal analysis, B.Y.; funding acquisition, H.L.; investigation, H.N. and Y.Z.; methodology, C.D. and H.L.; project administration, H.L.; software, H.N. and Y.Z.; supervision, H.L.; validation, H.Z. and B.Y.; visualization, H.Z.; writing—original draft, C.D.; writing—review & editing, C.D. All authors have read and agreed to the published version of the manuscript.

Funding

The research is supported by the National Natural Science Foundation of China and Shanghai Baosteel (No. U1460108).

Institutional Review Board Statement

Not applicable.

Informed Consent Statement

Not applicable.

Data Availability Statement

No new data were created or analyzed in this study. Data sharing is not applicable to this article.

Acknowledgments

The work is supported by National Natural Science Foundation of China and Shanghai Baosteel (No. U1460108)

Conflicts of Interest

The authors declare no conflict of interest.

Nomenclatures

u Velocity of fluid (m/s)
C ref Reference concentration (—)
g Gravitational acceleration vector (m/s2)
p Pressure (Pa)
C Tracer mass concentration (—)
k Turbulent kinetic energy (m2/s2)
ε Turbulence dissipation rate (m2/s3)
D eff Effective diffusion coefficient (m2/s)
S c t Turbulence Schmidt number (—)
z i Charge of the ion (—)
D i Diffusion coefficient of ion (m2/s)
Q Fluid flow rate at tundish exit (m3/s)
t m i n Minimum residence time (s)
t m a x Peak concentration time (s)
t ¯ Theoretical residence time (s)
t c ¯ Average residence time (s)
V p Plug volume fraction (—)
V d Dead volume fraction (—)
V m Well-mixed volume fraction (—)
V Volume of molten steel in the tundish (m3)
u Velocity at x direction in the case of actual tracer(m/s)
v Velocity at y direction in the case of actual tracer (m/s)
w Velocity at z direction in the case of actual tracer (m/s)
u I Velocity at x direction in the case of ideal tracer (m/s)
v I Velocity at y direction in the case of ideal tracer (m/s)
w I Velocity at z direction in the case of ideal tracer (m/s)
Greek Symbols
ρ ref Reference density (kg/m3)
β Solute expansion coefficient (—)
μ eff Dynamic viscosity (Pa·s)
ν eff Kinematic viscosity (m2/s)
δ Velocity difference number (—)

References

  1. Danckwerts, P.V. Continuous Flow Systems-Distribution of Residence Times. Chem. Eng. Sci. 1953, 2, 1–13. [Google Scholar] [CrossRef]
  2. Pour, M.A.S.; Hassanpour, S. Steel Cleanliness Depends on Inflow Turbulence Intensity (in Tundishes and Molds). Met. Mater. Trans. B 2020, 51, 2199–2210. [Google Scholar] [CrossRef]
  3. Nieves-Remacha, M.J.; Kukarni, A.A.; Jensen, K.F. OpenFOAM Computational Fluid Dynamic Simulations of Single-Phase Flows in an Advanced-Flow Reactor. Ind. Eng. Chem. Res. 2015, 54, 7543–7553. [Google Scholar] [CrossRef]
  4. Yang, B.; Lei, H.; Bi, Q.; Xiao, Y.Y.; Zhao, Y. Numerical Simulation of Collision-Coalescence and Removal of Inclusions in a Tundish. JOM 2018, 70, 2950–2957. [Google Scholar] [CrossRef]
  5. Wang, Q.; Qi, F.S.; Li, B.K.; Tsukihashi, F. Behavior of Non-metallic Inclusions in a Continuous Casting Tundish with Channel Type Induction Heating. Isij Int. 2014, 54, 2796–2805. [Google Scholar] [CrossRef] [Green Version]
  6. Rocha, J.R.D.; de Souza, E.E.B.; Marcondes, F.; Castro, J.A. Modeling and Computational Simulation of Fluid Flow, Heat Transfer and Inclusions Trajectories in a Tundish of a Steel Continuous Casting Machine. J. Mater. Res. Technol. 2019, 8, 4209–4220. [Google Scholar] [CrossRef]
  7. Yao, C.; Wang, M.; Zheng, R.X.; Pan, M.X.; Rao, J.Y.; Bao, Y.P. Effect of Turbulence Inhibitors on Molten Steel Flow in 66-ton T-Type Tundish with Large Impact Area. Metals 2020, 10, 1111. [Google Scholar] [CrossRef]
  8. Chang, S.; Zhong, L.C.; Zou, Z.S. Simulation of Flow and Heat Fields in a Seven-Strand Tundish with Gas Curtain for Molten Steel Continuous-Casting. Isij Int. 2015, 55, 837–844. [Google Scholar] [CrossRef] [Green Version]
  9. Chen, D.F.; Xie, X.; Long, M.J.; Zhang, M.; Zhang, L.L.; Liao, Q. Hydraulics and Mathematics Simulation on the Weir and Gas Curtain in Tundish of Ultrathick Slab Continuous Casting. Met. Mater. Trans. B 2014, 45, 392–398. [Google Scholar] [CrossRef]
  10. Sheng, D.Y.; Yue, Q. Modeling of Fluid Flow and Residence-Time Distribution in a Five-Strand Tundish. Metals 2020, 10, 1084. [Google Scholar] [CrossRef]
  11. Su, X.F.; Ji, Y.L.; Liu, J.H.; He, Y.; Shen, S.B.; Cui, H. Analysis on Residence Time Distribution Curve of Continuous Casting Tundish by Combined Model. Steel Res. Int. 2018, 89, 1800085. [Google Scholar] [CrossRef]
  12. Yang, B.; Lei, H.; Zhao, Y. Quasi-Symmetric Transfer Behavior in an Asymmetric Two-Strand Tundish with Different Turbulence Inhibitor. Metals 2019, 9, 855. [Google Scholar] [CrossRef] [Green Version]
  13. Tripathi, A.; Kumar, A.; Ajmani, S.; Singh, J.B.; Mahashabde, V. Numerical Investigation of Fluid Flow and Heat Transfer Phenomenon Inside a Single Strand Tundish of Slab Caster. Steel Res. Int. 2015, 86, 1558–1573. [Google Scholar] [CrossRef]
  14. Cui, H.; Liu, Y.; Li, D.X. Fluid Flow Characterization in Asymmetric Tundish. Isij Int. 2015, 55, 2604–2608. [Google Scholar] [CrossRef] [Green Version]
  15. Levenspiel, O. Chemical Reaction Engineering; Wiley: New York, NY, USA, 1962; pp. 243–255. [Google Scholar]
  16. Wang, G.C.; Yun, M.F.; Zhang, C.M.; Xiao, G.D. Flow Mechanism of Molten Steel in a Single-Strand Slab Caster Tundish Based on the Residence Time Distribution Curve and Data. Isij Int. 2015, 55, 984–992. [Google Scholar] [CrossRef] [Green Version]
  17. Sheng, D.Y. Design Optimization of a Single-Strand Tundish Based on CFD-Taguchi-Grey Relational Analysis Combined Method. Metals 2020, 10, 1539. [Google Scholar] [CrossRef]
  18. Neves, L.; Tavares, R.P. Analysis of the Mathematical Model of the Gas Bubbling Curtain Injection on the Bottom and the Walls of a Continuous Casting Tundish. Ironmak. Steelmak. 2017, 44, 559–567. [Google Scholar] [CrossRef]
  19. Cwudzinski, A. Numerical Prediction of Hydrodynamic Conditions in One Strand Tundish. Influence of Thermal Conditions and Casting Speed. Arch. Met. Mater. 2014, 55, 1249–1256. [Google Scholar] [CrossRef] [Green Version]
  20. Wang, X.Y.; Zhao, D.T.; Qiu, S.T.; Zou, Z.S. Effect of Tunnel Filters on Flow Characteristics in an Eight-Strand Tundish. Isij Int. 2017, 57, 1990–1999. [Google Scholar] [CrossRef] [Green Version]
  21. Merder, T. Modelling the Influence of Changing Constructive Parameters of Multi-Strand Tundish on Steel Flow and Heat Transfer. Ironmak. Steelmak. 2016, 43, 758–768. [Google Scholar] [CrossRef]
  22. Kumar, A.; Koria, S.C.; Mazumdar, D. Basis for Systematic Hydrodynamic Analysis of a Multi-Strand Tundish. Isij Int. 2007, 47, 1618–1624. [Google Scholar] [CrossRef] [Green Version]
  23. Yang, X.M.; Liu, S.X.; Jiao, J.S.; Zhang, M.; Duan, J.P.; Li, L.; Liu, C.Z. Hydrodynamic Modeling and Mathematical Simulation of Flow Field and Temperature Profile for Molten Stainless Steel in an Asymmetrical T-Type Single-Strand Continuous Casting Tundish with Arch or Round Hole(s) at Dam Bottom. Steel Res. Int. 2012, 83, 269–287. [Google Scholar] [CrossRef]
  24. Ding, N.; Bao, Y.P.; Sun, Q.S.; Wang, L.F. Optimization of Flow Control Devices in a Single-Strand Slab Continuous Casting Tundish. Int. J. Min. Met. Mater. 2011, 18, 292–296. [Google Scholar] [CrossRef]
  25. Cwudzinski, A. Numerical and Physical Prediction of Hydrodynamic Conditions in One Strand Slab Tundish. Met. Res. Technol. 2014, 111, 45–55. [Google Scholar] [CrossRef]
  26. Fang, Q.; Zhang, H.; Luo, R.H.; Liu, C.; Wang, Y.; Ni, H.W. Optimization of Flow, Heat Transfer and Inclusion Removal Behaviors in an Odd Multistrand Bloom Casting Tundish. J. Mater. Res. Technol. 2020, 9, 347–363. [Google Scholar] [CrossRef]
  27. Zhong, L.C.; Hao, R.C.; Li, J.Z.; Zhu, Y.X. Molten Steel Flow in a Slab Continuous-Casting Tundish. J. Iron Steel Res. Int. 2014, 21, 10–16. [Google Scholar] [CrossRef]
  28. Vassilicos, A.; Sinha, A.K. Physical Modeling Study of Thermal Effects on Steel Flow and Mixing in the Tundish. In Proceedings of the 10th Process Technology Conference, Toronto, ON, Canada, 5–8 April 1992. [Google Scholar]
  29. Damle, C.; Sahai, Y. The Effect of Tracer Density on Melt Flow Characterization in Continuous-Casting Tundishes—A Modeling Study. Isij Int. 1995, 35, 163–169. [Google Scholar] [CrossRef] [Green Version]
  30. Chen, C.; Cheng, G.G.; Sun, H.B.; Hou, Z.B.; Wang, X.C.; Zhang, J.Q. Effects of Salt Tracer Amount, Concentration and Kind on the Fluid Flow Behavior in a Hydrodynamic Model of Continuous Casting Tundish. Steel Res. Int. 2012, 83, 1141–1151. [Google Scholar] [CrossRef]
  31. Chen, C.; Jonsson, L.; Tilliander, A.; Cheng, G.G.; Jonsson, P. A Mathematical Modeling Study of Tracer Mixing in a Continuous Casting Tundish. Met. Mater. Trans. B 2015, 46, 169–190. [Google Scholar] [CrossRef]
  32. Chen, C.; Jonsson, L.; Tilliander, A.; Cheng, G.G.; Jonsson, P. A Mathematical Modeling Study of the Influence of Small Amounts of KCl Solution Tracers on Mixing in Water and Residence Time Distribution of Tracers in a Continuous Flow Reactor-Metallurgical Tundish. Chem. Eng. Sci. 2015, 137, 914–937. [Google Scholar] [CrossRef]
  33. Launder, B.E.; Spalding, D.B. Lectures in Mathematical Models of Turbulence; Academic Press: London, UK, 1972. [Google Scholar]
  34. Issa, R. Solution of the Implicitly Discretised Fluid Row Equations by Operator-Splitting. J. Comput. Phys. 1986, 62, 40–65. [Google Scholar] [CrossRef]
  35. Cussler, E. Diffusion: Mass Transfer in Fluid Systems; Cambridge University Press: New York, NY, USA, 2009. [Google Scholar]
  36. Ghaffari, A.; Rahbar-Kelishami, A. MD Simulation and Evaluation of the Self-Diffusion Coefficients in Aqueous NaCl Solutions at Different Temperatures and Concentrations. J. Mol. Liq. 2013, 187, 238–245. [Google Scholar] [CrossRef]
  37. Lei, H. New Insight into Combined Model and Revised Model for RTD Curves in a Multi-Strand Tundish. Met. Mater. Trans. B 2015, 46, 2408–2413. [Google Scholar] [CrossRef]
  38. Cwudzinski, A. Numerical, Physical, and Industrial Studies of Liquid Steel Chemical Homogenization in One Strand Tundish with Subflux Turbulence Controller. Steel Res. Int. 2015, 86, 972–983. [Google Scholar] [CrossRef]
  39. Cwudzinski, A. Numerical and Physical Modeling of Liquid Steel Active Flow in Tundish with Subflux Turbulence Controller and Dam. Steel Res. Int. 2014, 85, 902–917. [Google Scholar] [CrossRef]
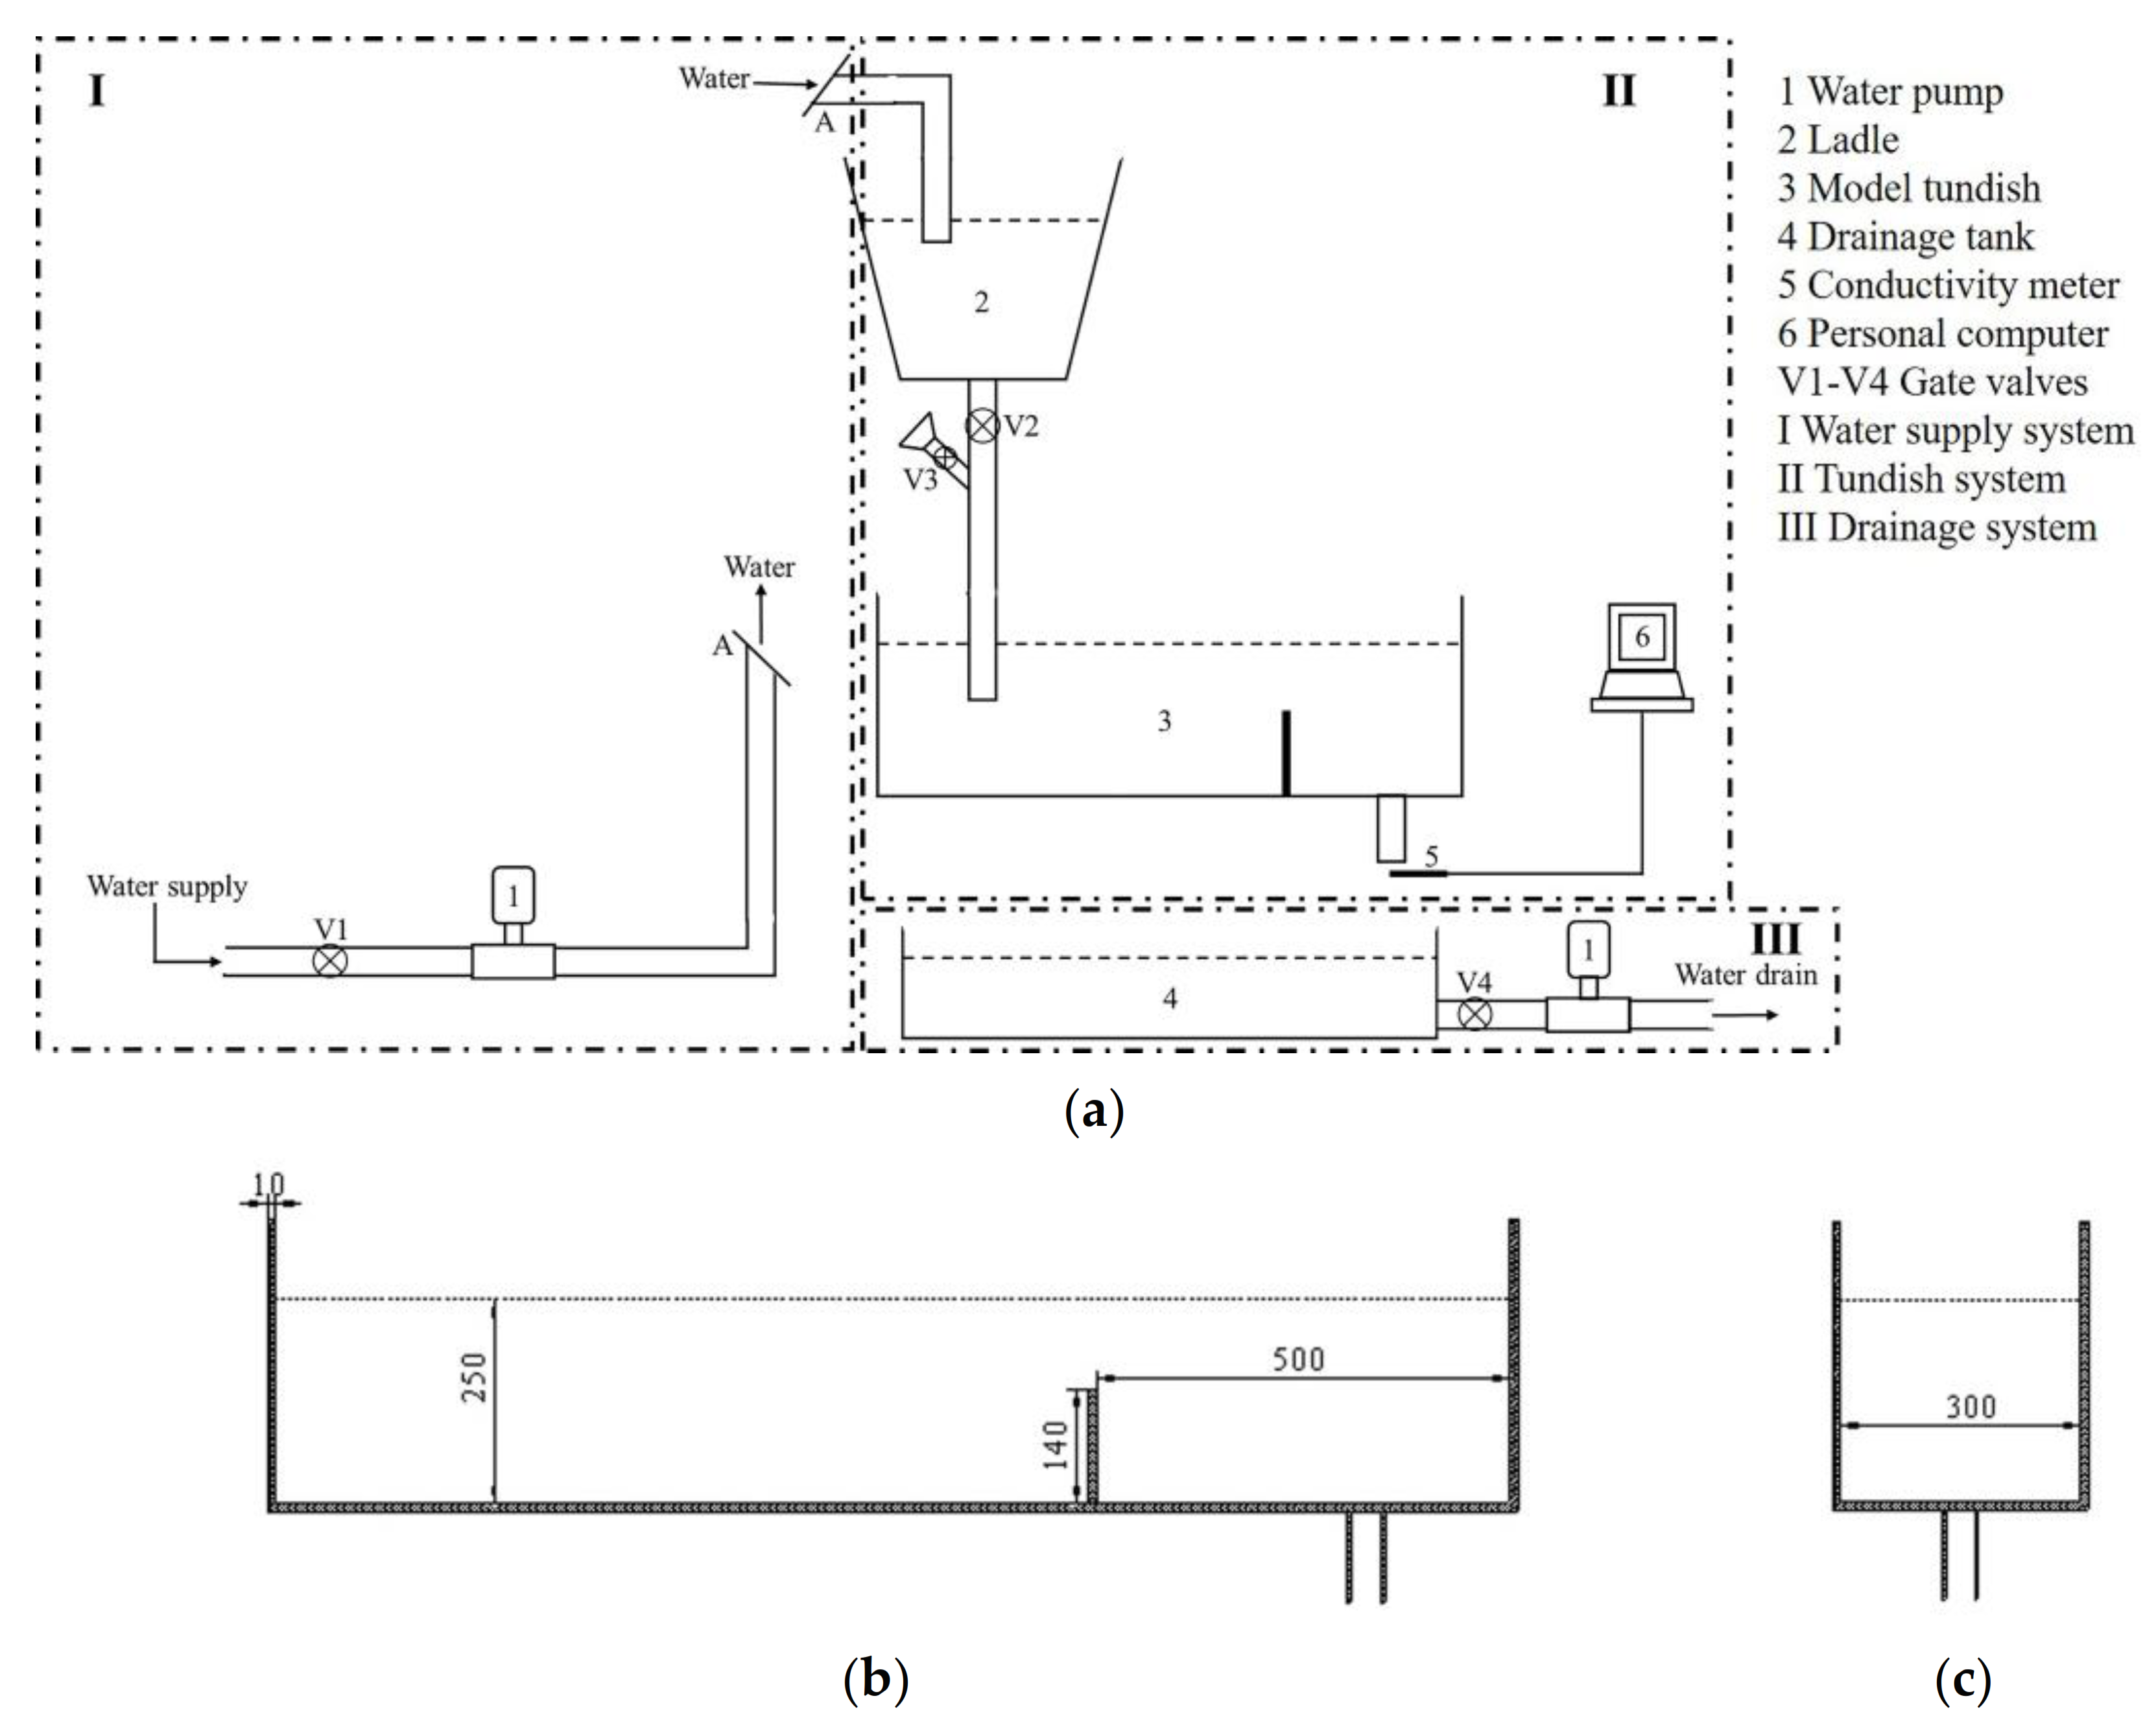
Figure 1. Water model of tundish: (a) Schematic diagram of experimental system; (b) Front view of tundish; (c) Side view of tundish
Metals 11 00430 g001
Figure 2. The structured mesh of single strand tundish.
Metals 11 00430 g002
Figure 3. Calculation flow chart.
Metals 11 00430 g003
Figure 4. Relationship between mass concentration and density of NaCl solution.
Metals 11 00430 g004
Figure 5. RTD curve results of numerical simulation and water model.
Metals 11 00430 g005
Figure 6. RTD curve results of numerical simulation and industrial experiment.
Metals 11 00430 g006
Figure 7. RTD curves for the different tracer mass concentrations.
Metals 11 00430 g007
Figure 8. RTD curves analysis result by different tracer mass concentrations: (a) plug volume; (b) dead volume; (c) well-mixed volume.
Metals 11 00430 g008aMetals 11 00430 g008b
Figure 9. RTD curves for the different tracer solution volumes.
Metals 11 00430 g009
Figure 10. RTD curves analysis result by different tracer solution volumes: (a) plug volume; (b) dead volume; (c) well-mixed volume.
Metals 11 00430 g010aMetals 11 00430 g010b
Figure 11. Tracer mass concentration distribution in tundish at different moments with solute buoyancy or not: Ideal tracer (a) 0 s; (b) 1 s; (c) 25 s; (d) 67 s; (e) 112 s; (f) 171 s; (g) 400 s; (h) 1200 s; Actual tracer (a) 0 s; (b) 1 s; (c) 25 s; (d) 67 s; (e) 112 s; (f) 171 s; (g) 400 s; (h) 1200 s.
Metals 11 00430 g011aMetals 11 00430 g011b
Figure 12. The distribution of velocity difference number δ in the tundish at different moments: (a) 0 s; (b) 1 s; (c) 25 s; (d) 67 s; (e) 112 s; (f) 171 s; (g) 400 s; (h) 1200 s.
Metals 11 00430 g012
Figure 13. The distribution of velocity difference number δ in tundish at 25 s: (a) c = 3.01%; (b) c = 15.38%; (c) saturated NaCl solution.
Metals 11 00430 g013aMetals 11 00430 g013b
Figure 14. Fluid flow in the case of ideal tracer at 25 s: (a) Main cross section; (b) Free surface section.
Metals 11 00430 g014
Figure 15. Fluid flow in the case of actual tracer (26.42%) at 25 s: (a) Main cross section; (b) Free surface section.
Metals 11 00430 g015
Table 1. Main dimensions and parameters for water model.
ParametersWater Model
LiquidWater
Number of strandsingle strand
Flow volume at the inlet373.97 mL/s
Height of dam140 mm
Diameter of inlet30 mm
Diameter of outlet12 mm
Height of liquid level250 mm
Length of tundish model1500 mm
Width of tundish model 300 mm
Height of tundish model350 mm
Table 2. Numerical methods applied in BoussinesqRTDFoam solver.
Solver OperatorMethod
Time derivativeEuler
GradientGauss linear
DivergenceGauss upwind
Gauss linear
LaplacianGauss linear uncorrected
Table 3. Numerical solvers applied in BoussinesqRTDFoam solver.
VariablesNumerical Solver
VelocityPreconditioned biconjugate gradient
Preconditioner diagonal-incomplete LU
PressurePreconditioned conjugate gradient
Preconditioner diagonal-incomplete Cholesky
ConcentrationPreconditioned biconjugate gradient
Preconditioner diagonal-incomplete LU
Table 4. The average diffusion coefficients of NaCl solution with different mass concentration.
Mass Concentration (%)3.0111.3615.3821.3326.42
Average diffusion coefficient (10−9m2/s)0.9140.9450.7250.660.551
Table 5. Analysis result of RTD curves for different grid numbers.
Grid Numbers84,072112,380136,068162,156184,860
tmax111111111111111
Cmax0.0202120.0203220.0203790.0202000.020097
Table 6. RTD analysis results of numerical simulation and water model.
Case V p V d V m
RTD curve with solute buoyancy effect29.57%5.98%64.45%
RTD curve from water model27.41%6.64%65.95%
Ideal RTD curve30.73%9.30%59.97%
Table 7. RTD curves analysis results in the case of different tracer concentration.
Tracer Mass Concentration/%Minimum Residence Time/sPeak Concentration Time/sAverage Residence Time/sTheoretical Residence Time/s
3.0150129273301
11.3665111278
15.3866116279
21.3367119280
26.4267111283
Table 8. RTD curves analysis results in the case of different tracer solution volumes.
Tracer Volume/mLFirst Peak Time/sFirst Peak ConcentrationSecond Peak Time/sSecond Peak ConcentrationAverage Residence Time/s
51350.0009--273
101320.0020--273
251050.0053--275
501130.0120--278
751190.0176--280
1001110.02031710.0194283
200690.04461470.0398258
300580.06171300.0597254
400510.08101160.0787251
500460.09901110.0966250
Publisher’s Note: MDPI stays neutral with regard to jurisdictional claims in published maps and institutional affiliations.