
Effects of Salt Tracer Volume and Concentration on Residence Time Distribution Curves for Characterization of Liquid Steel Behavior in Metallurgical Tundish

Abstract
:
1. Introduction
- (1)
- Different tracer mass concentrations and different tracer volumes give different RTD curves for the same flow field. The effects of salt tracer amount and concentration on RTD curves will be investigated.
- (2)
- The dam without hole avoids the occurrence of the short-circuit flow, so stratified flow from the density difference between tracer and water results in the two peaks of RTD curves.
- (3)
- The velocity difference number is introduced to demonstrate the importance of the density difference between the tracer and the fluid.
2. Research Methods
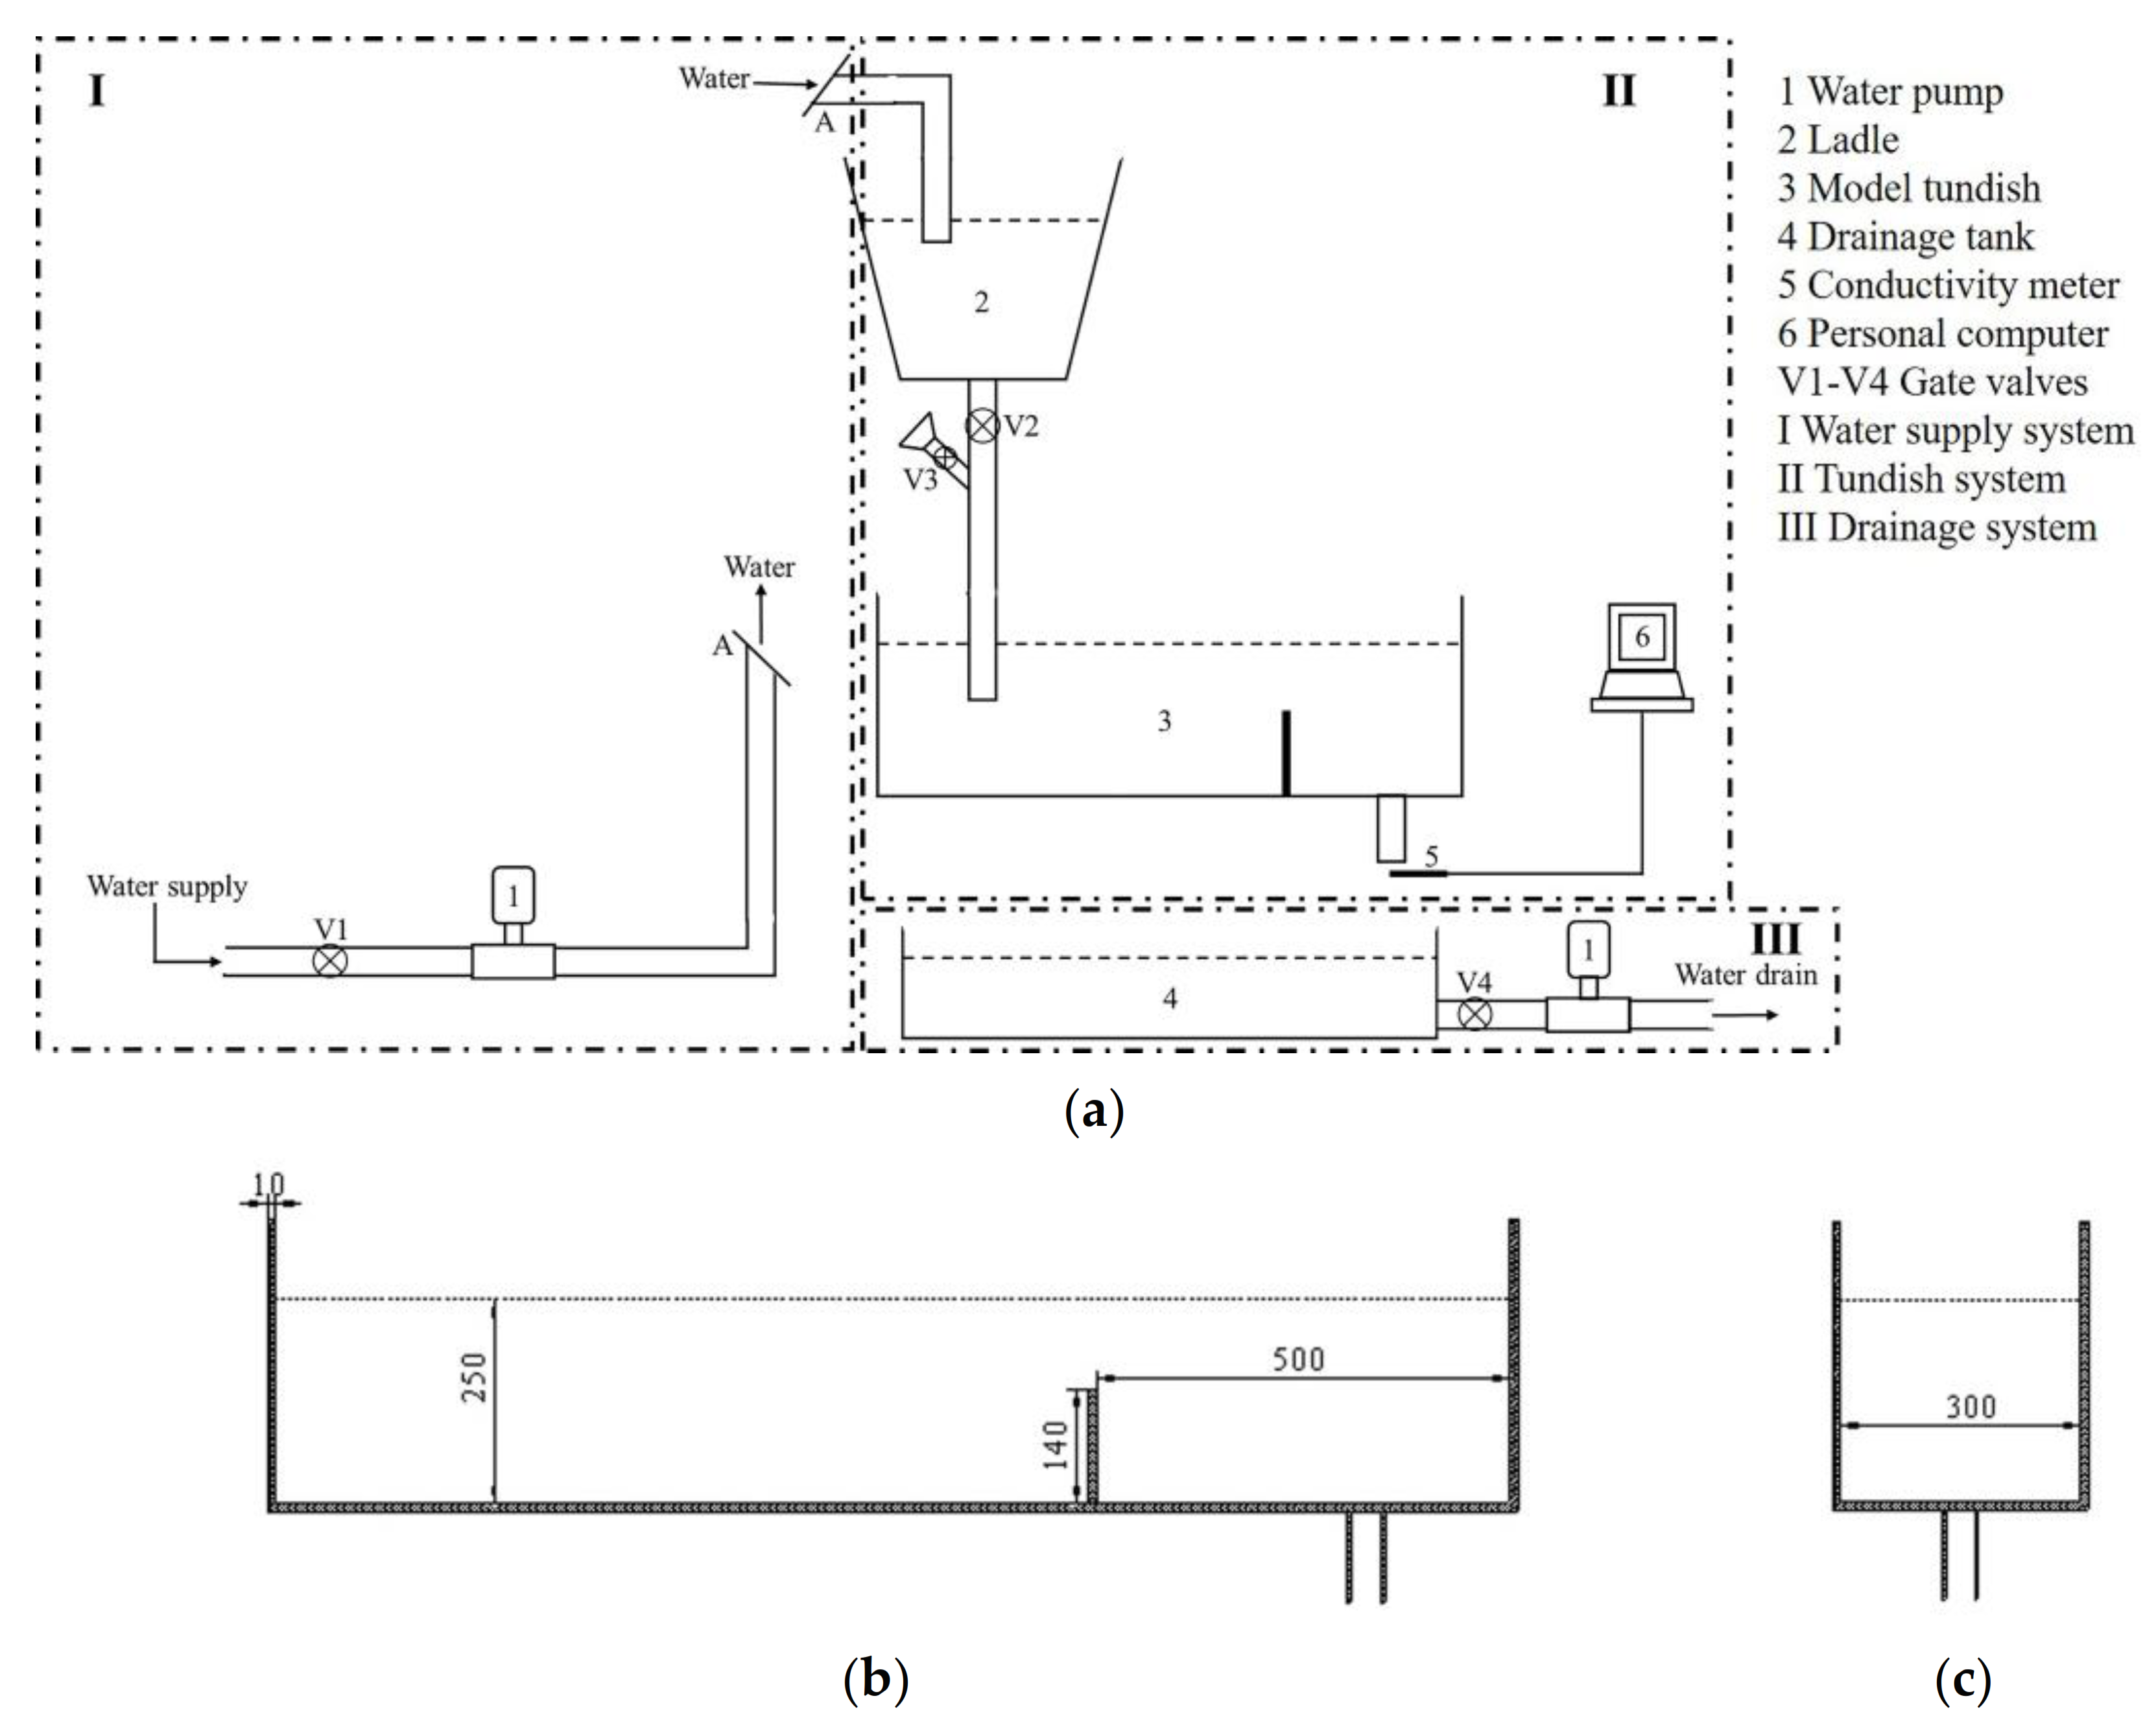
2.1. Water Model
2.2. Mathematical Model
2.2.1. Governing Equations and Assumptions
- (1)
- The fluid is an incompressible viscous fluid.
- (2)
- The fluid flow is an isothermal steady isotropic turbulent flow.
- (3)
- The free surface of fluid is flat in the tundish.
2.2.2. Gridsystem, Boundary Conditions and Initial Conditions
2.2.3. Numerical Solution
2.2.4. Simulation Parameters
3. Validation of Numerical Results
3.1. Grid Independence
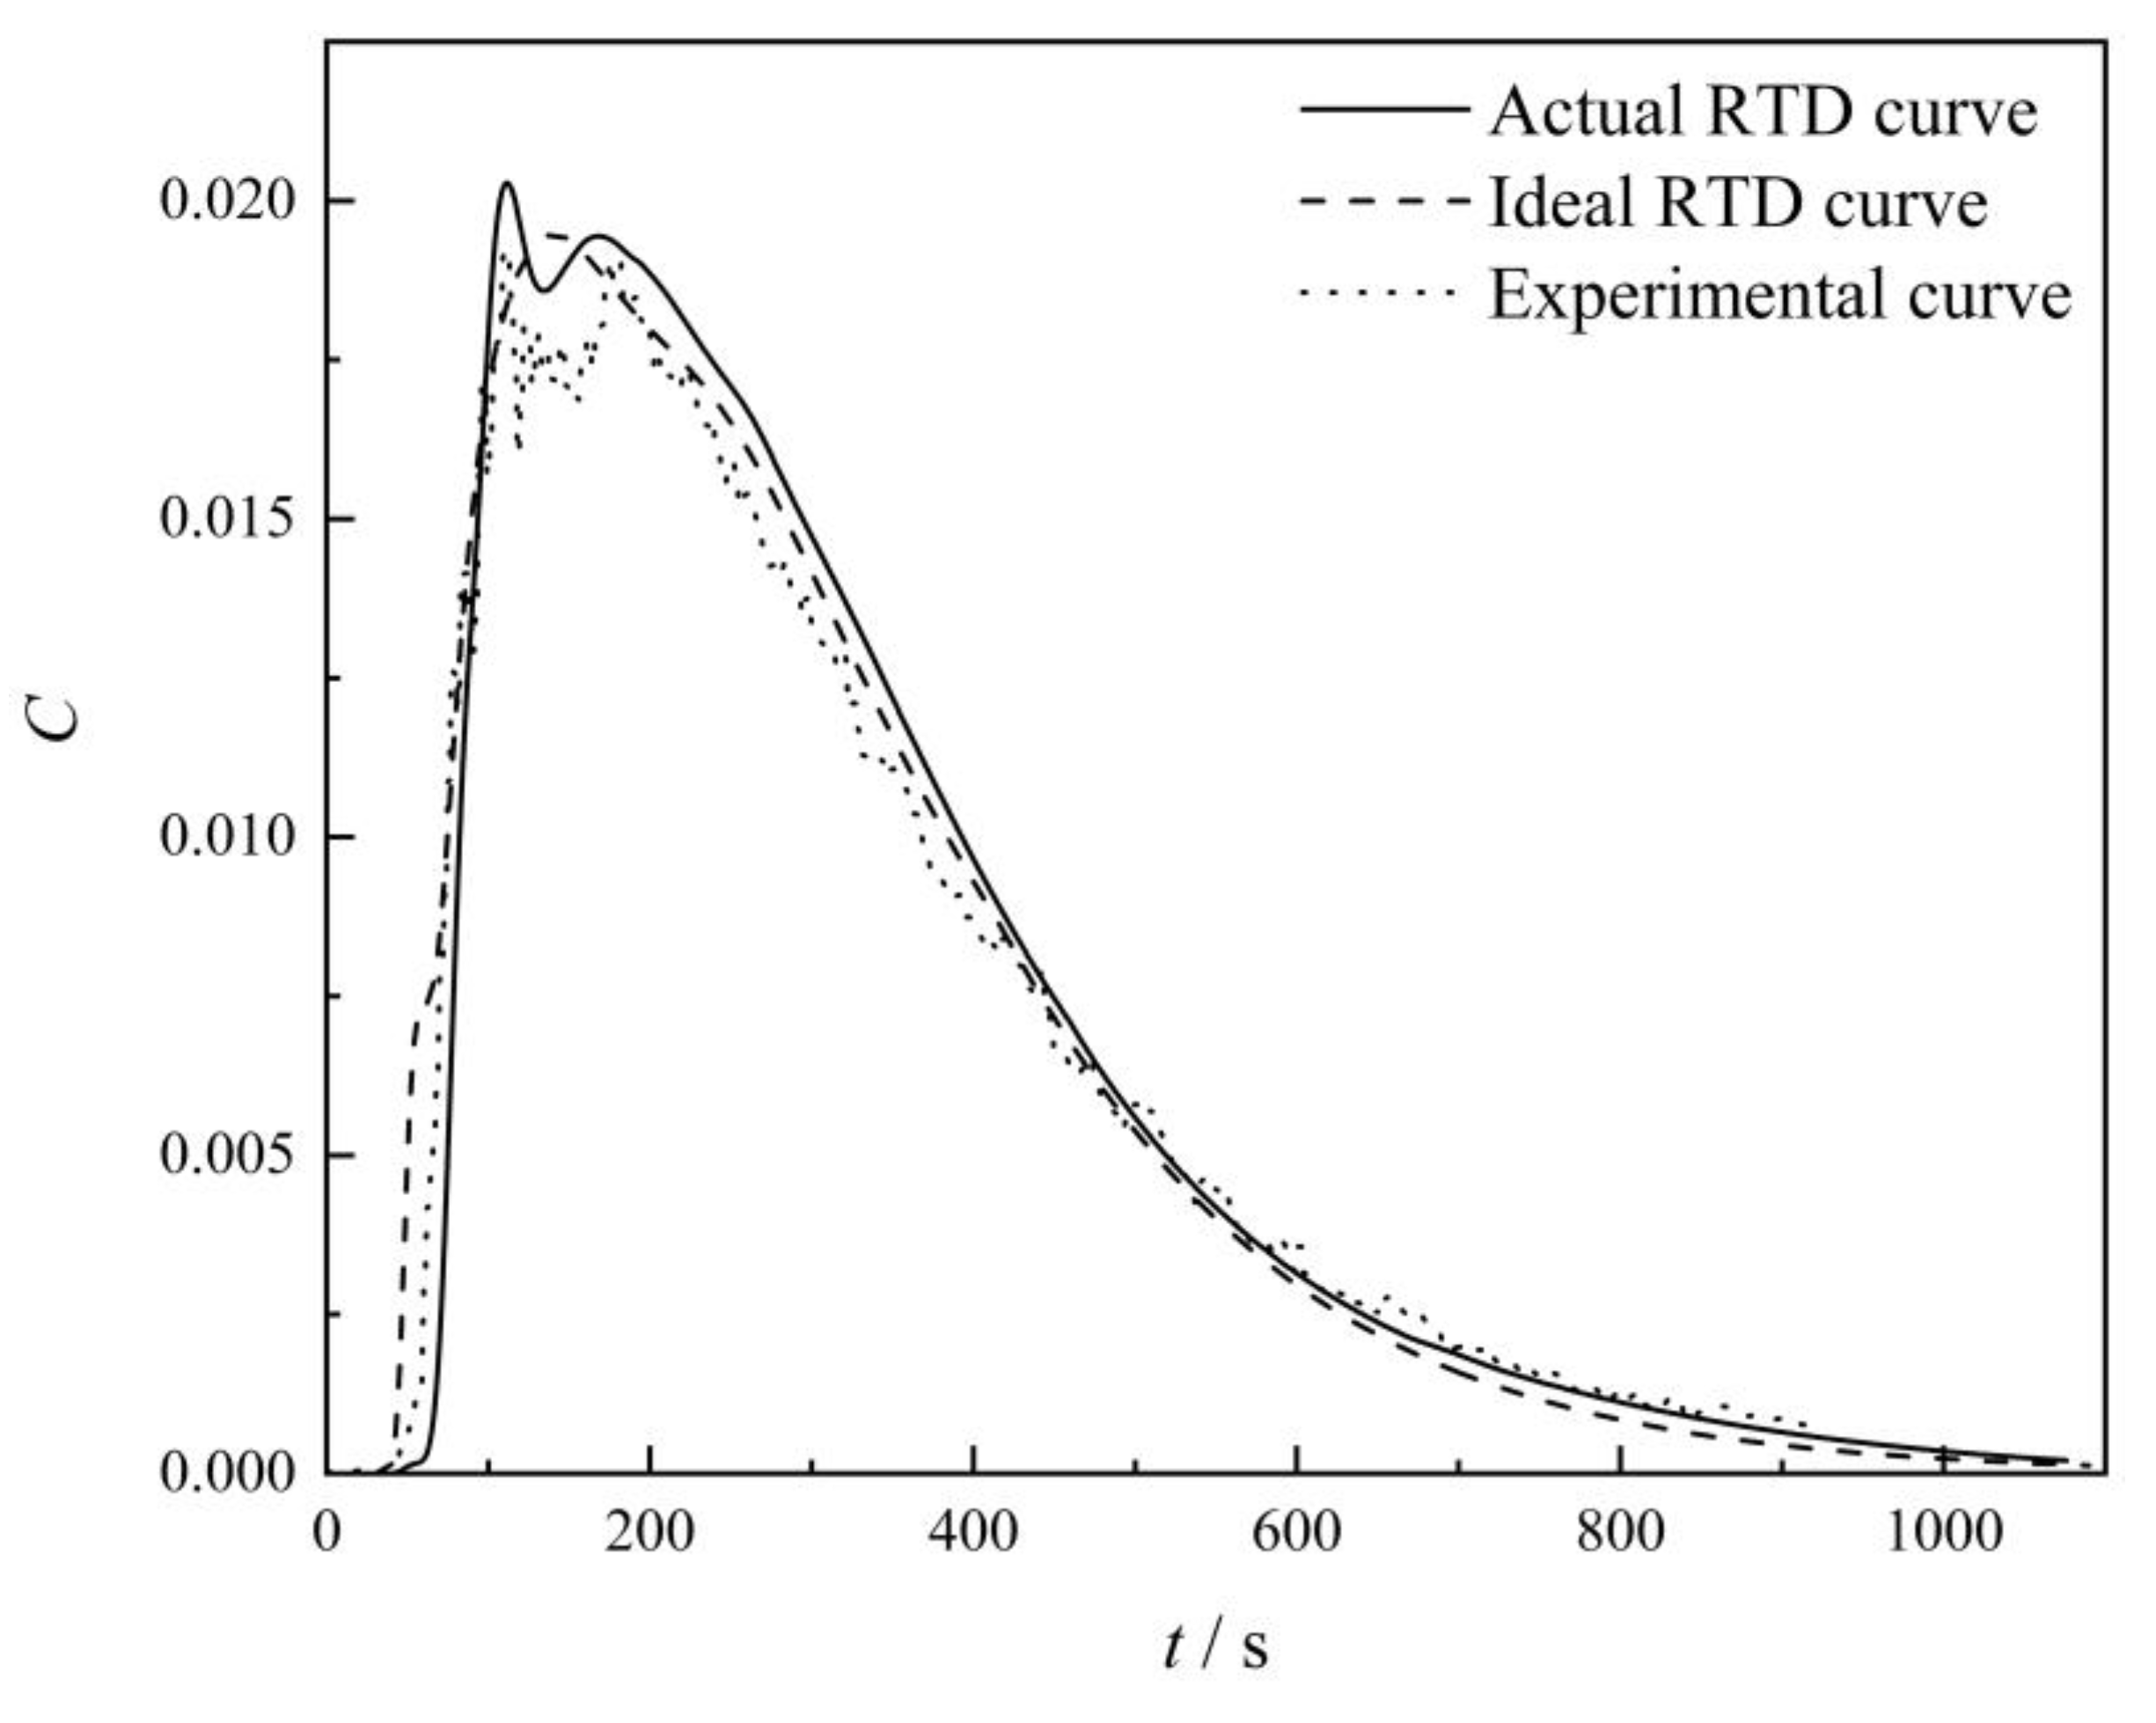
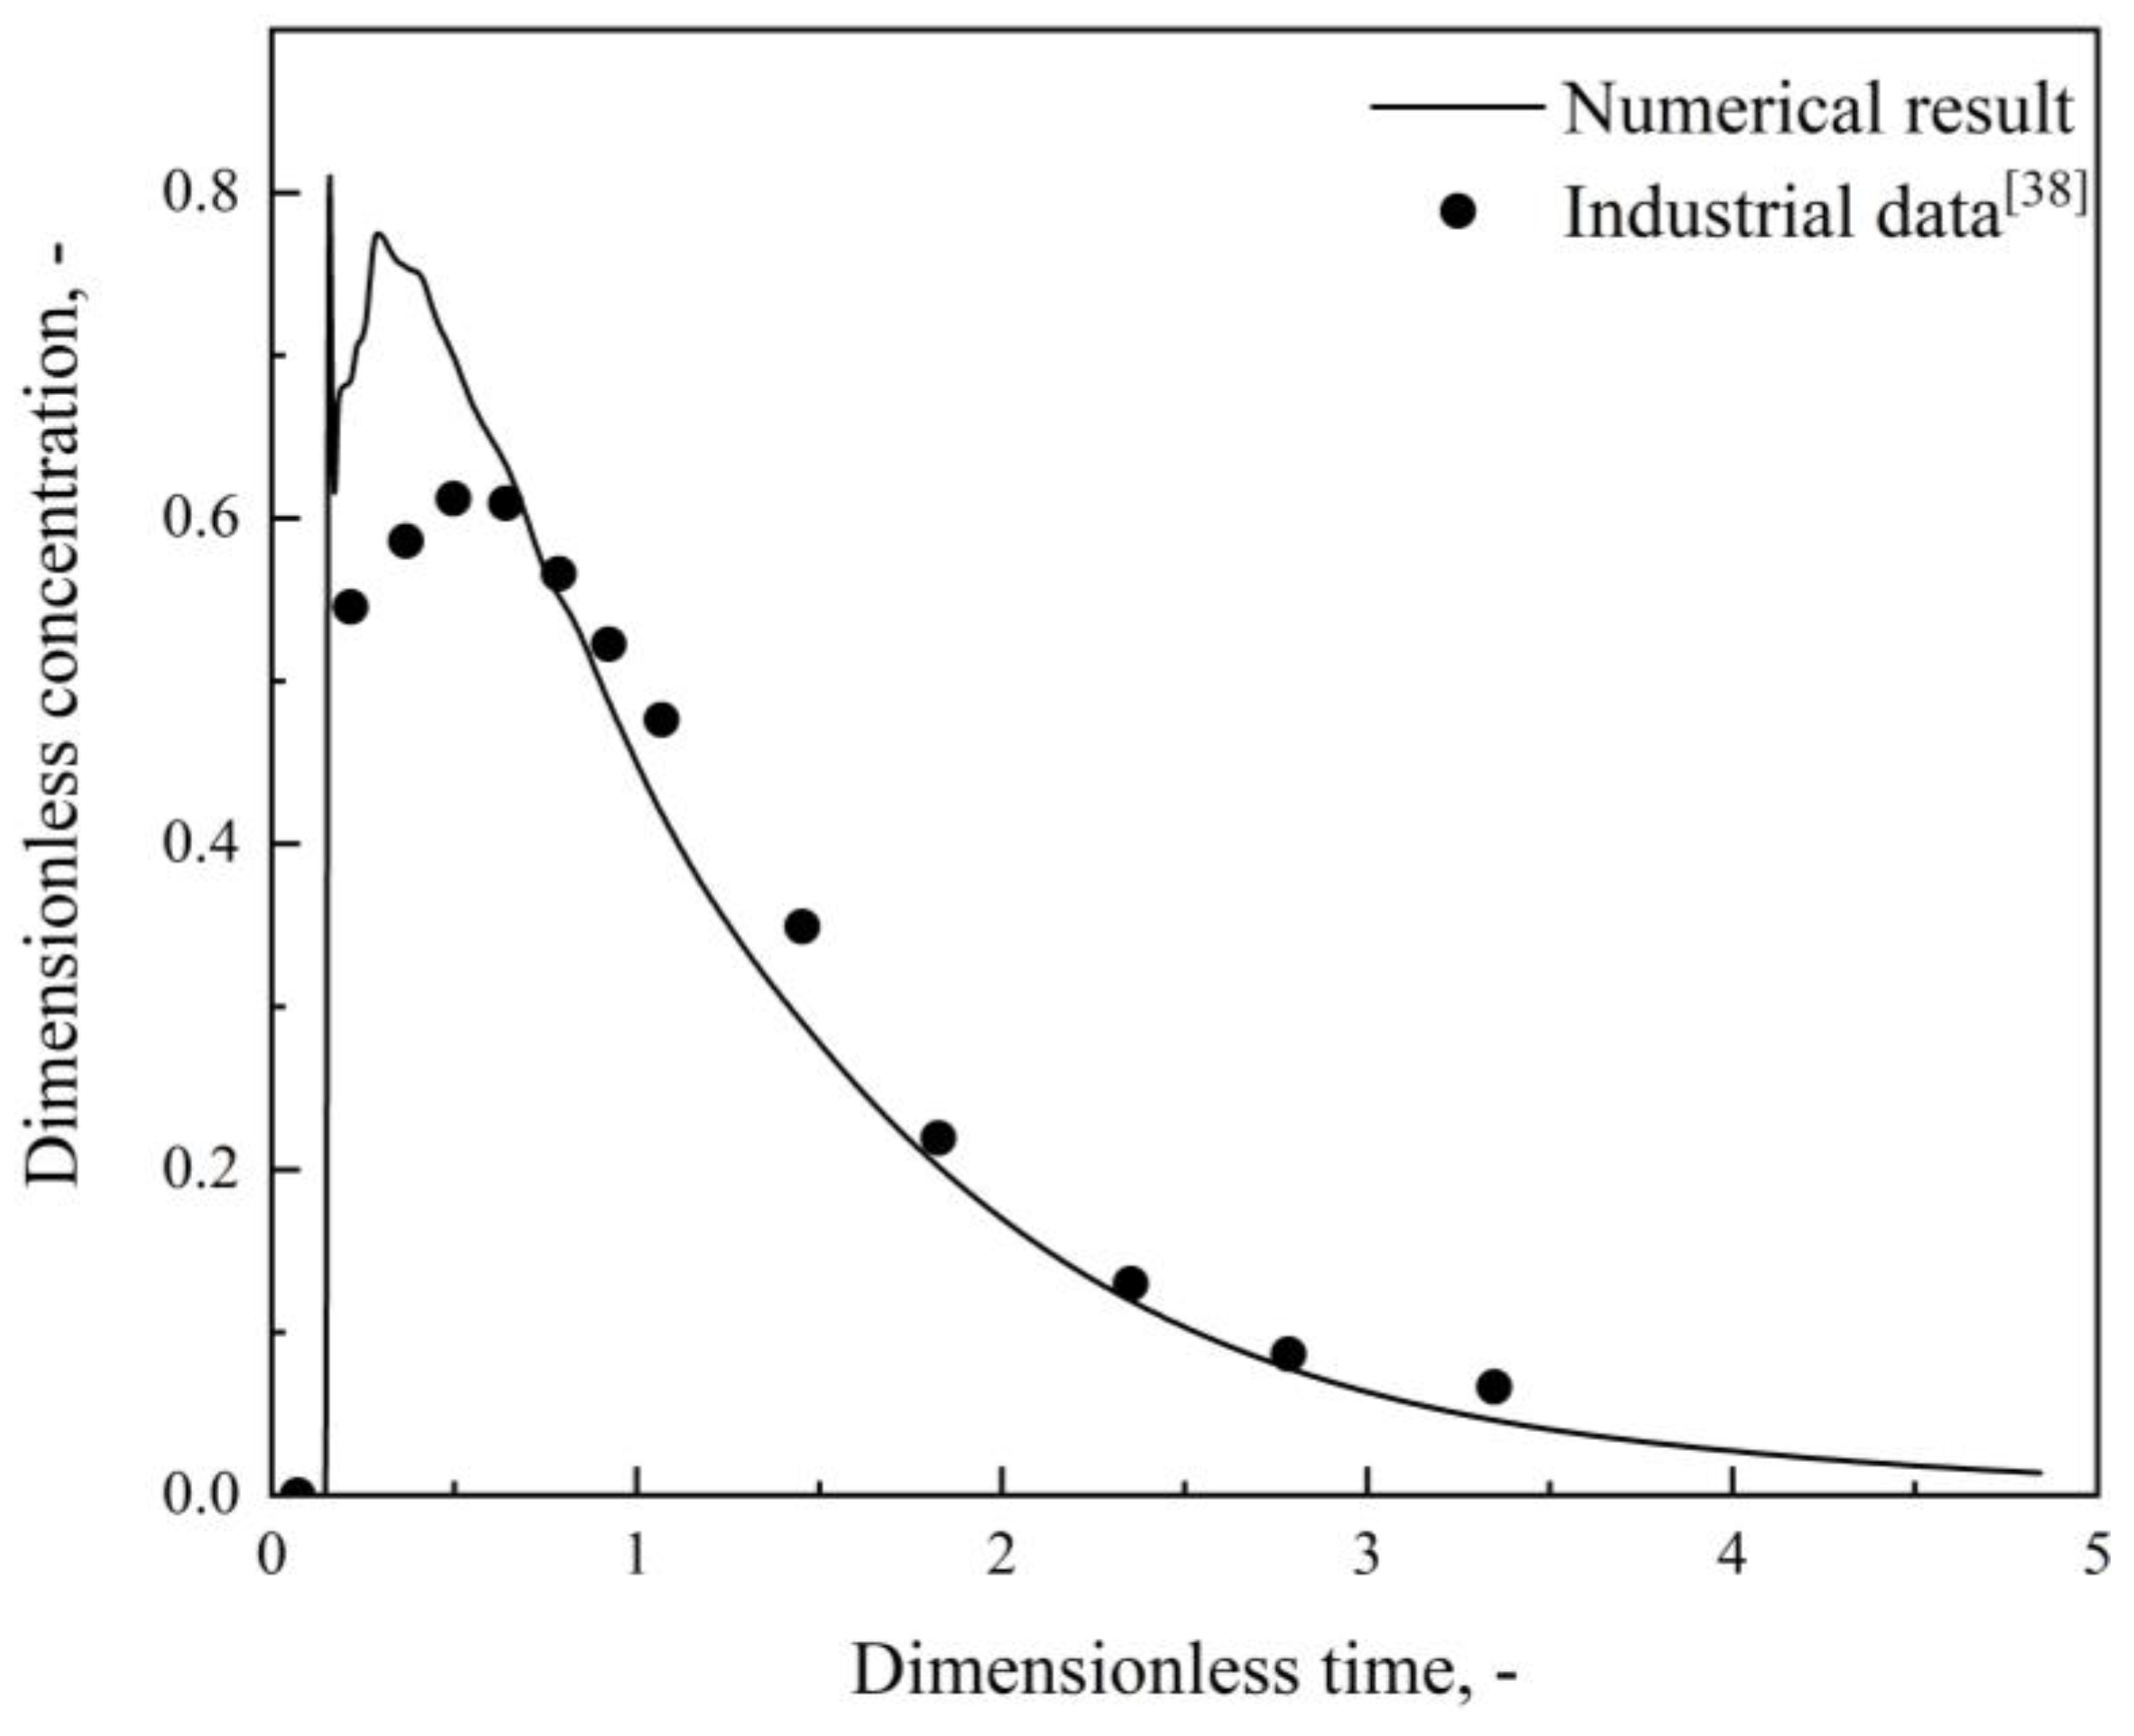
3.2. Water Model and Industrial Validation
4. Results and Discussion
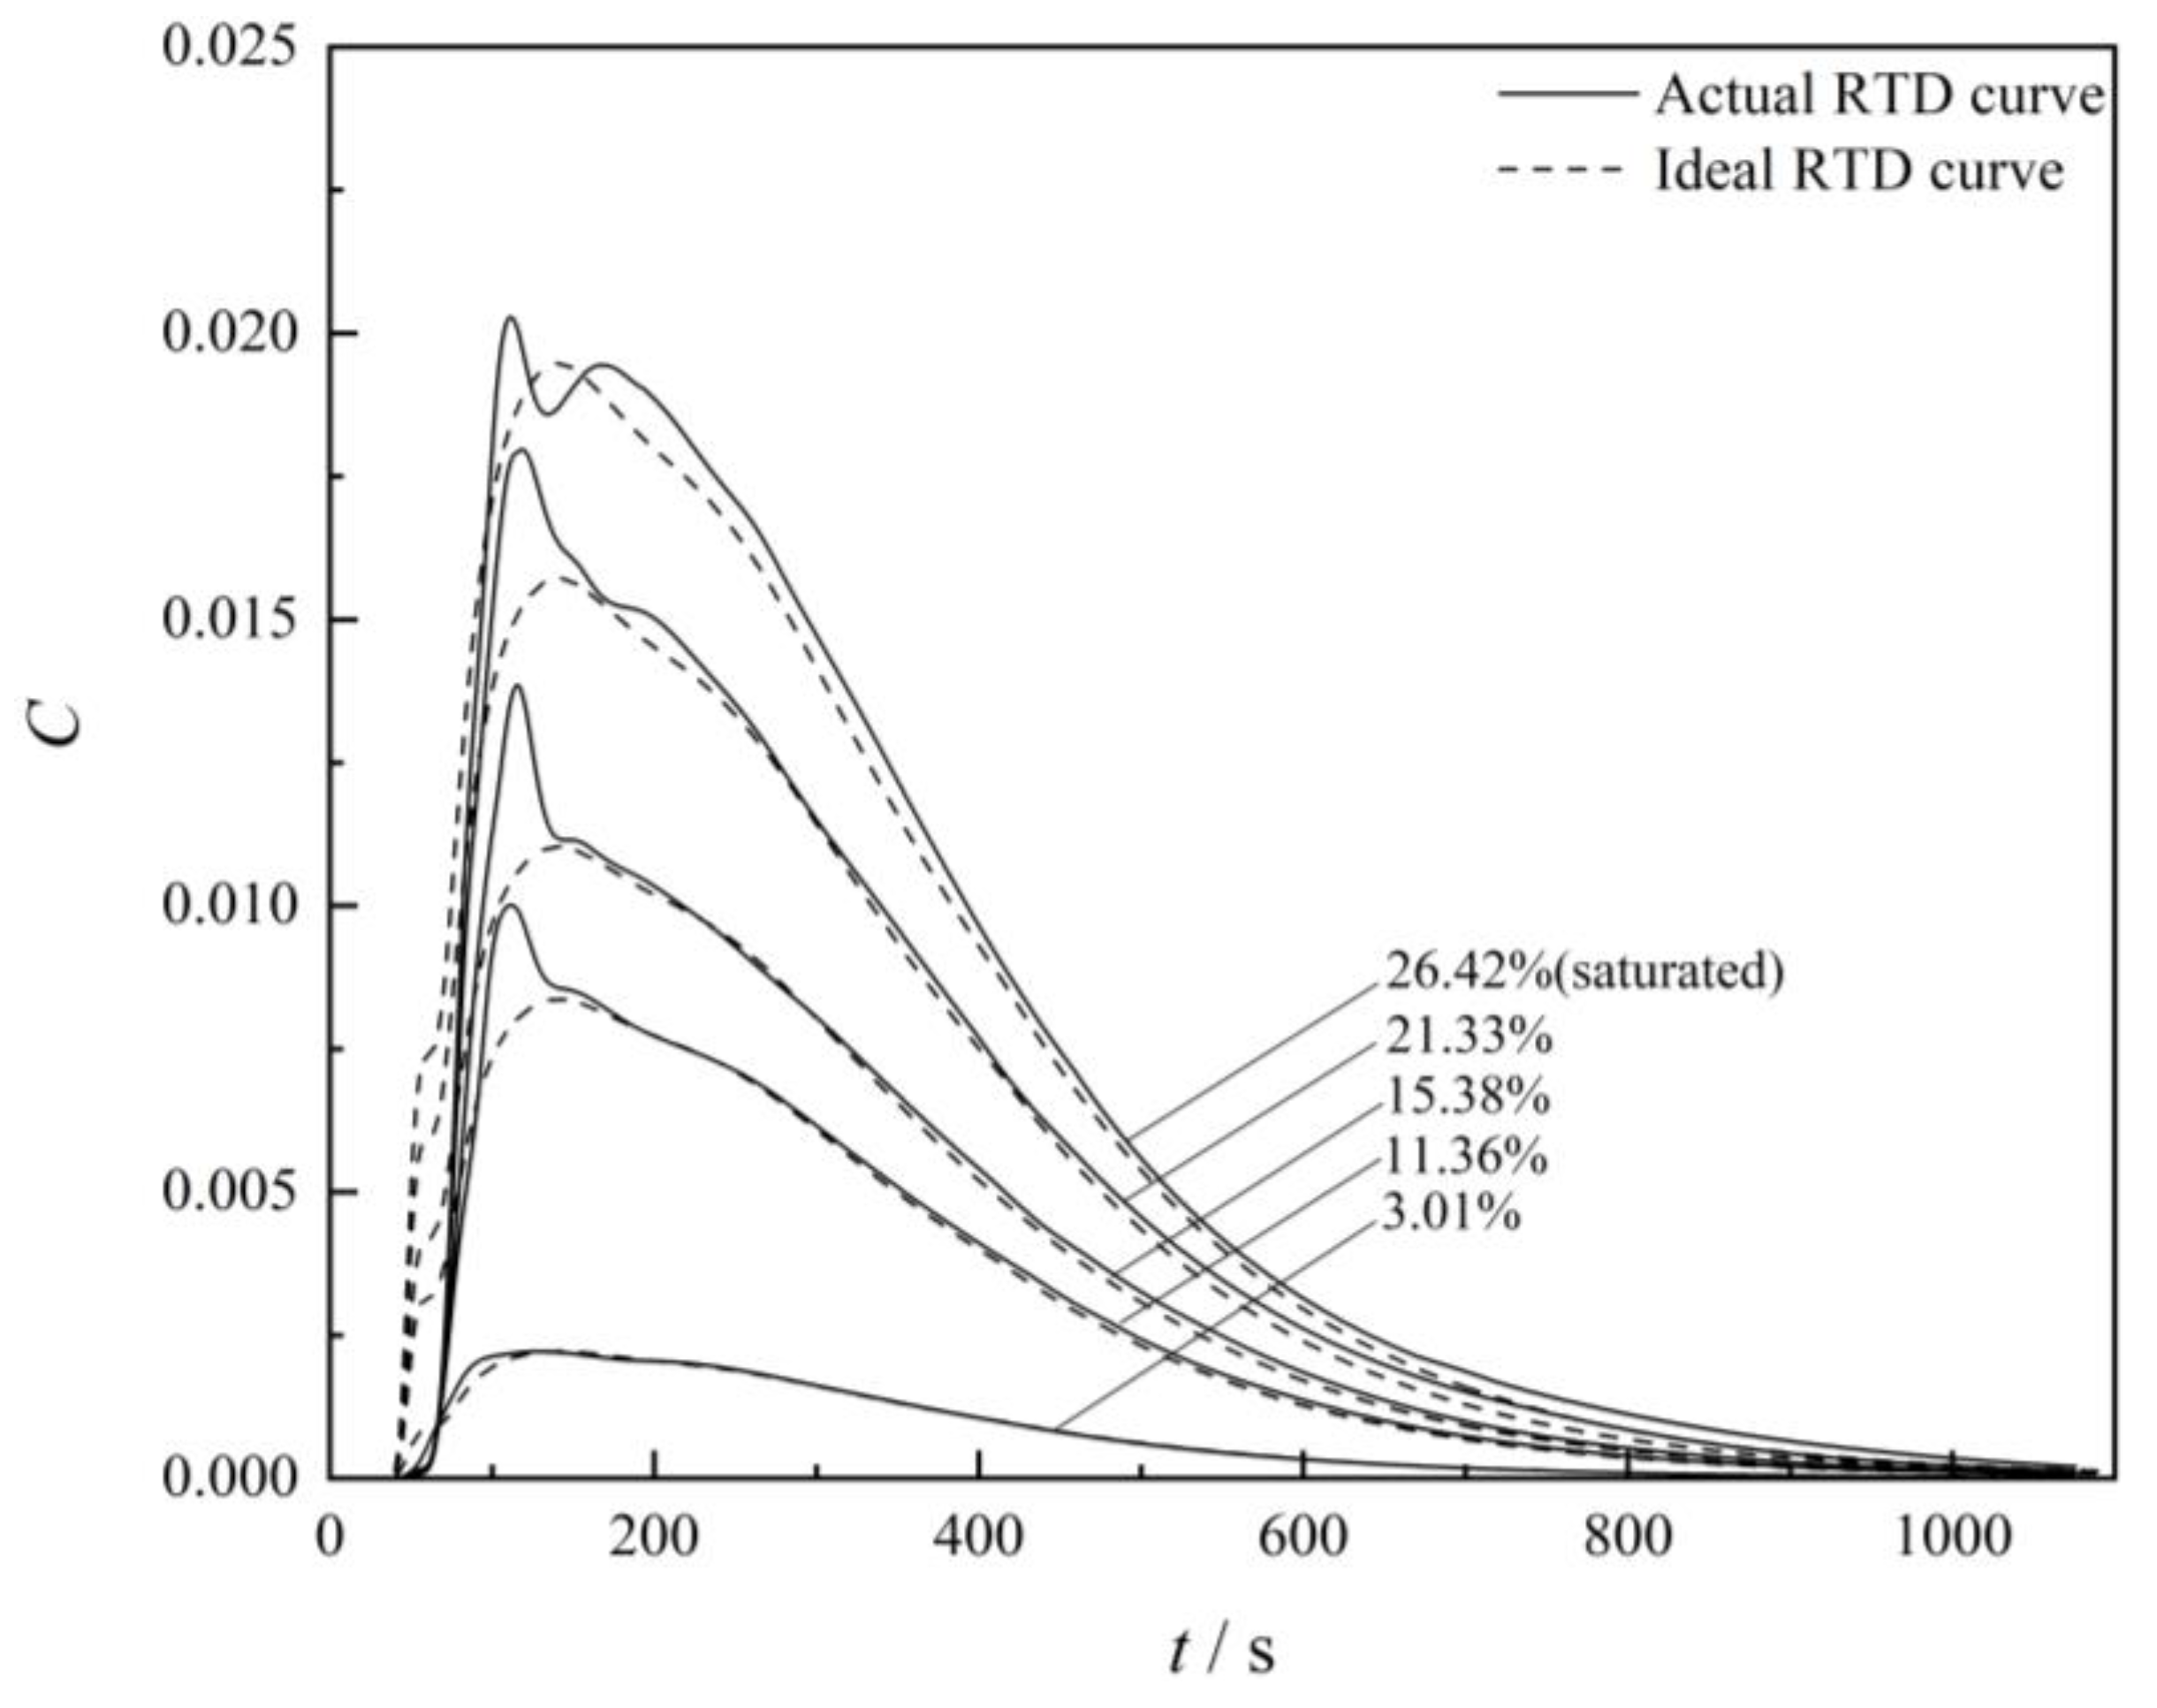
4.1. Injected Tracer Mass Concentration
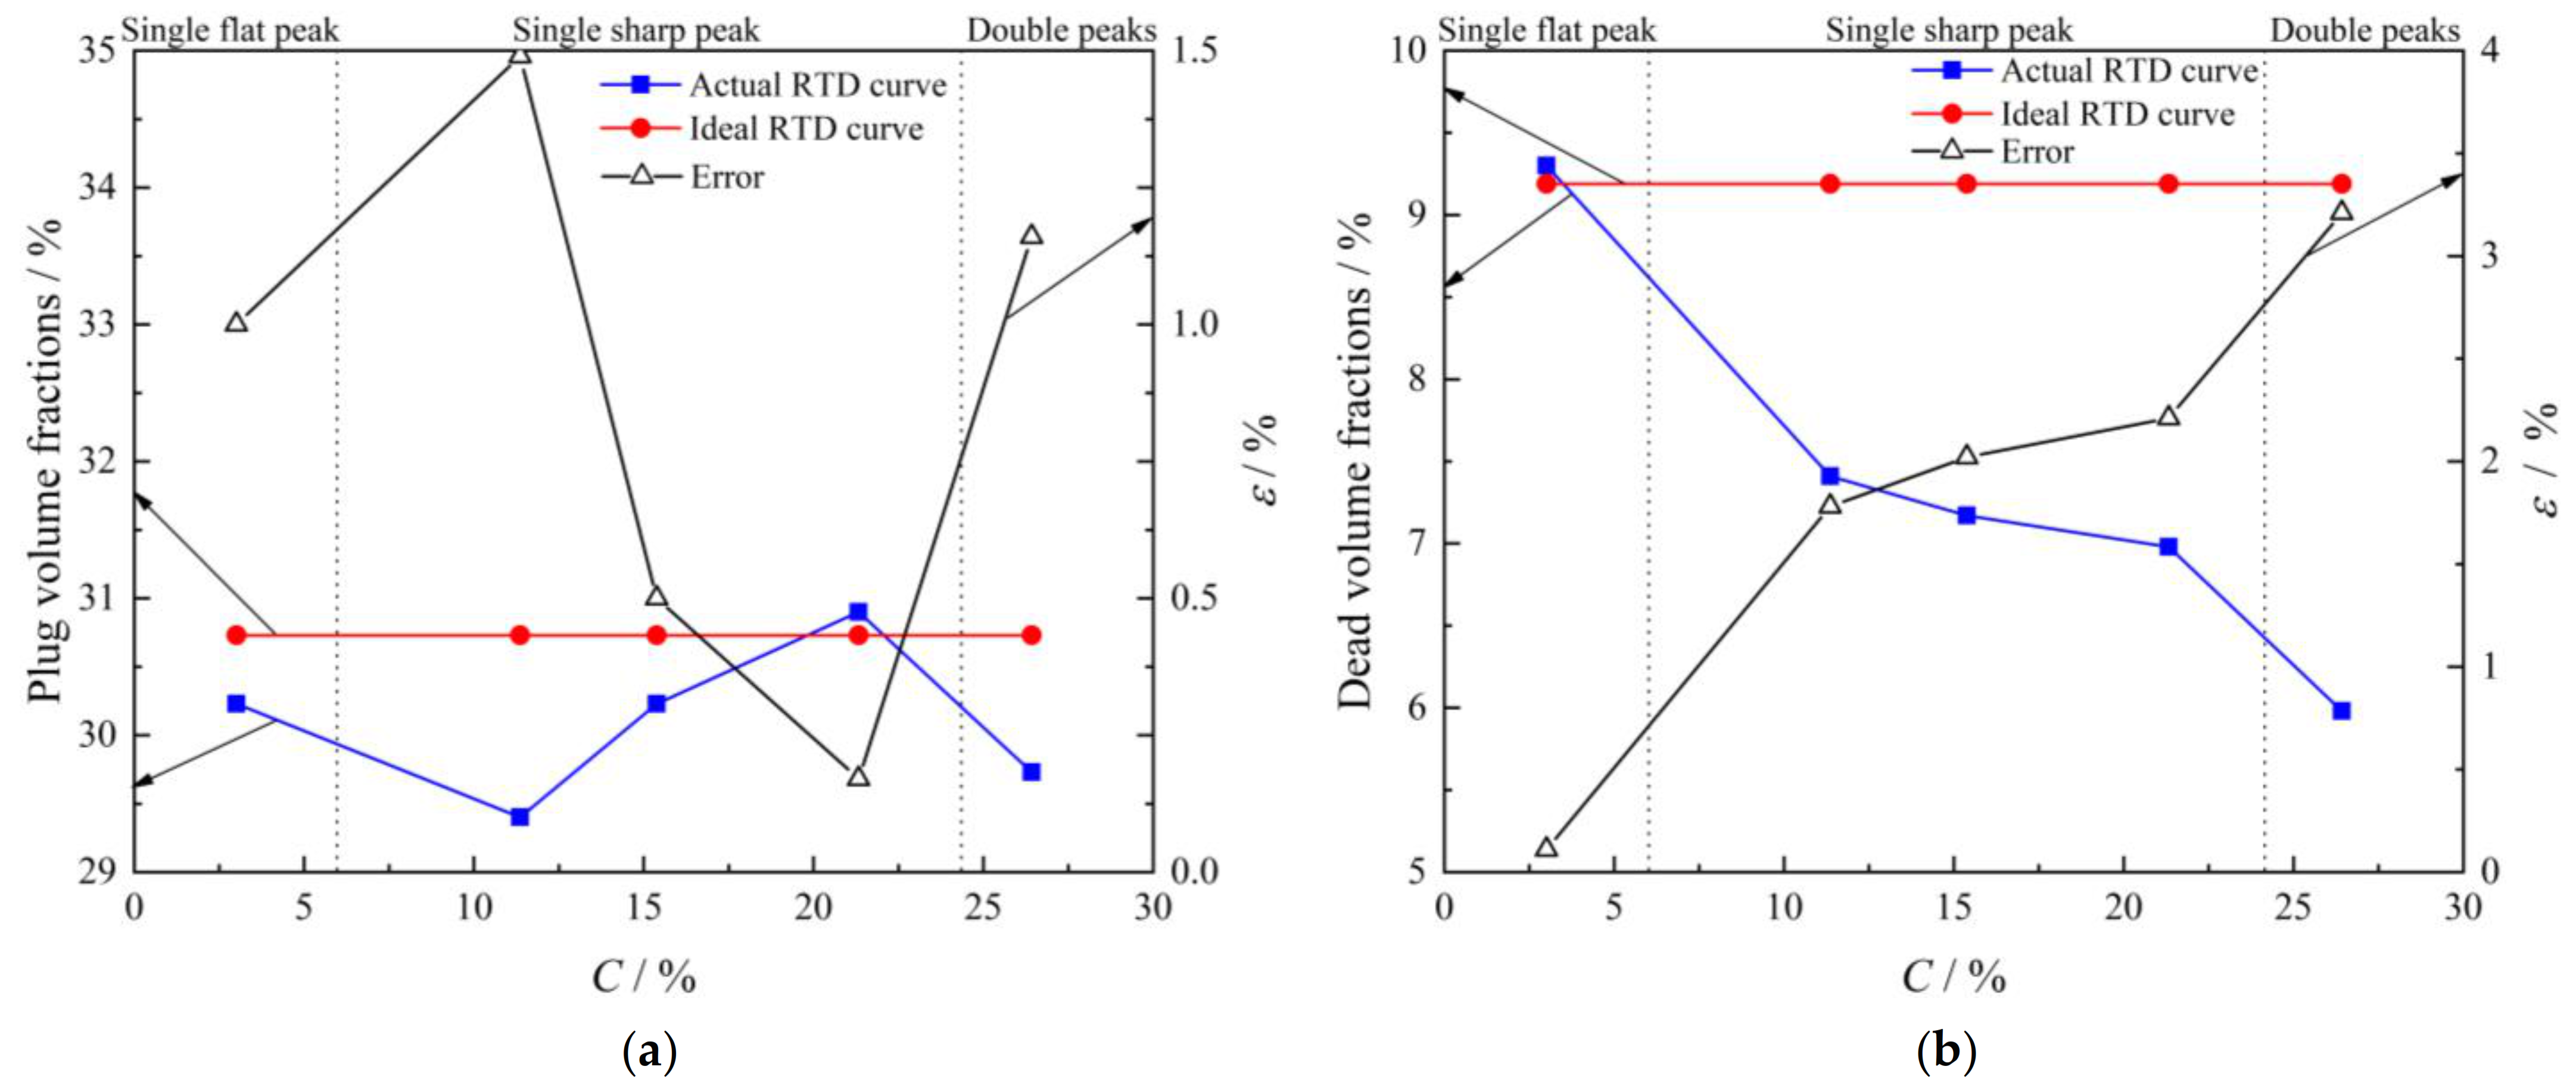
- (1)
- The change of the tracer concentration results in the change of flow field. With the increase of the tracer concentration, the actual RTD curve changes from the flat single peak RTD curve to the sharp single peak RTD curve, then to the double peaks RTD curve.
- (2)
- Table 7 shows that with the increase of tracer mass concentration, the sum of the minimum residence time and the peak concentration time follows the following rule: decrease → increase → decrease due to the relevant variation of flow field.
4.2. Tracer Solution Volume
- (1)
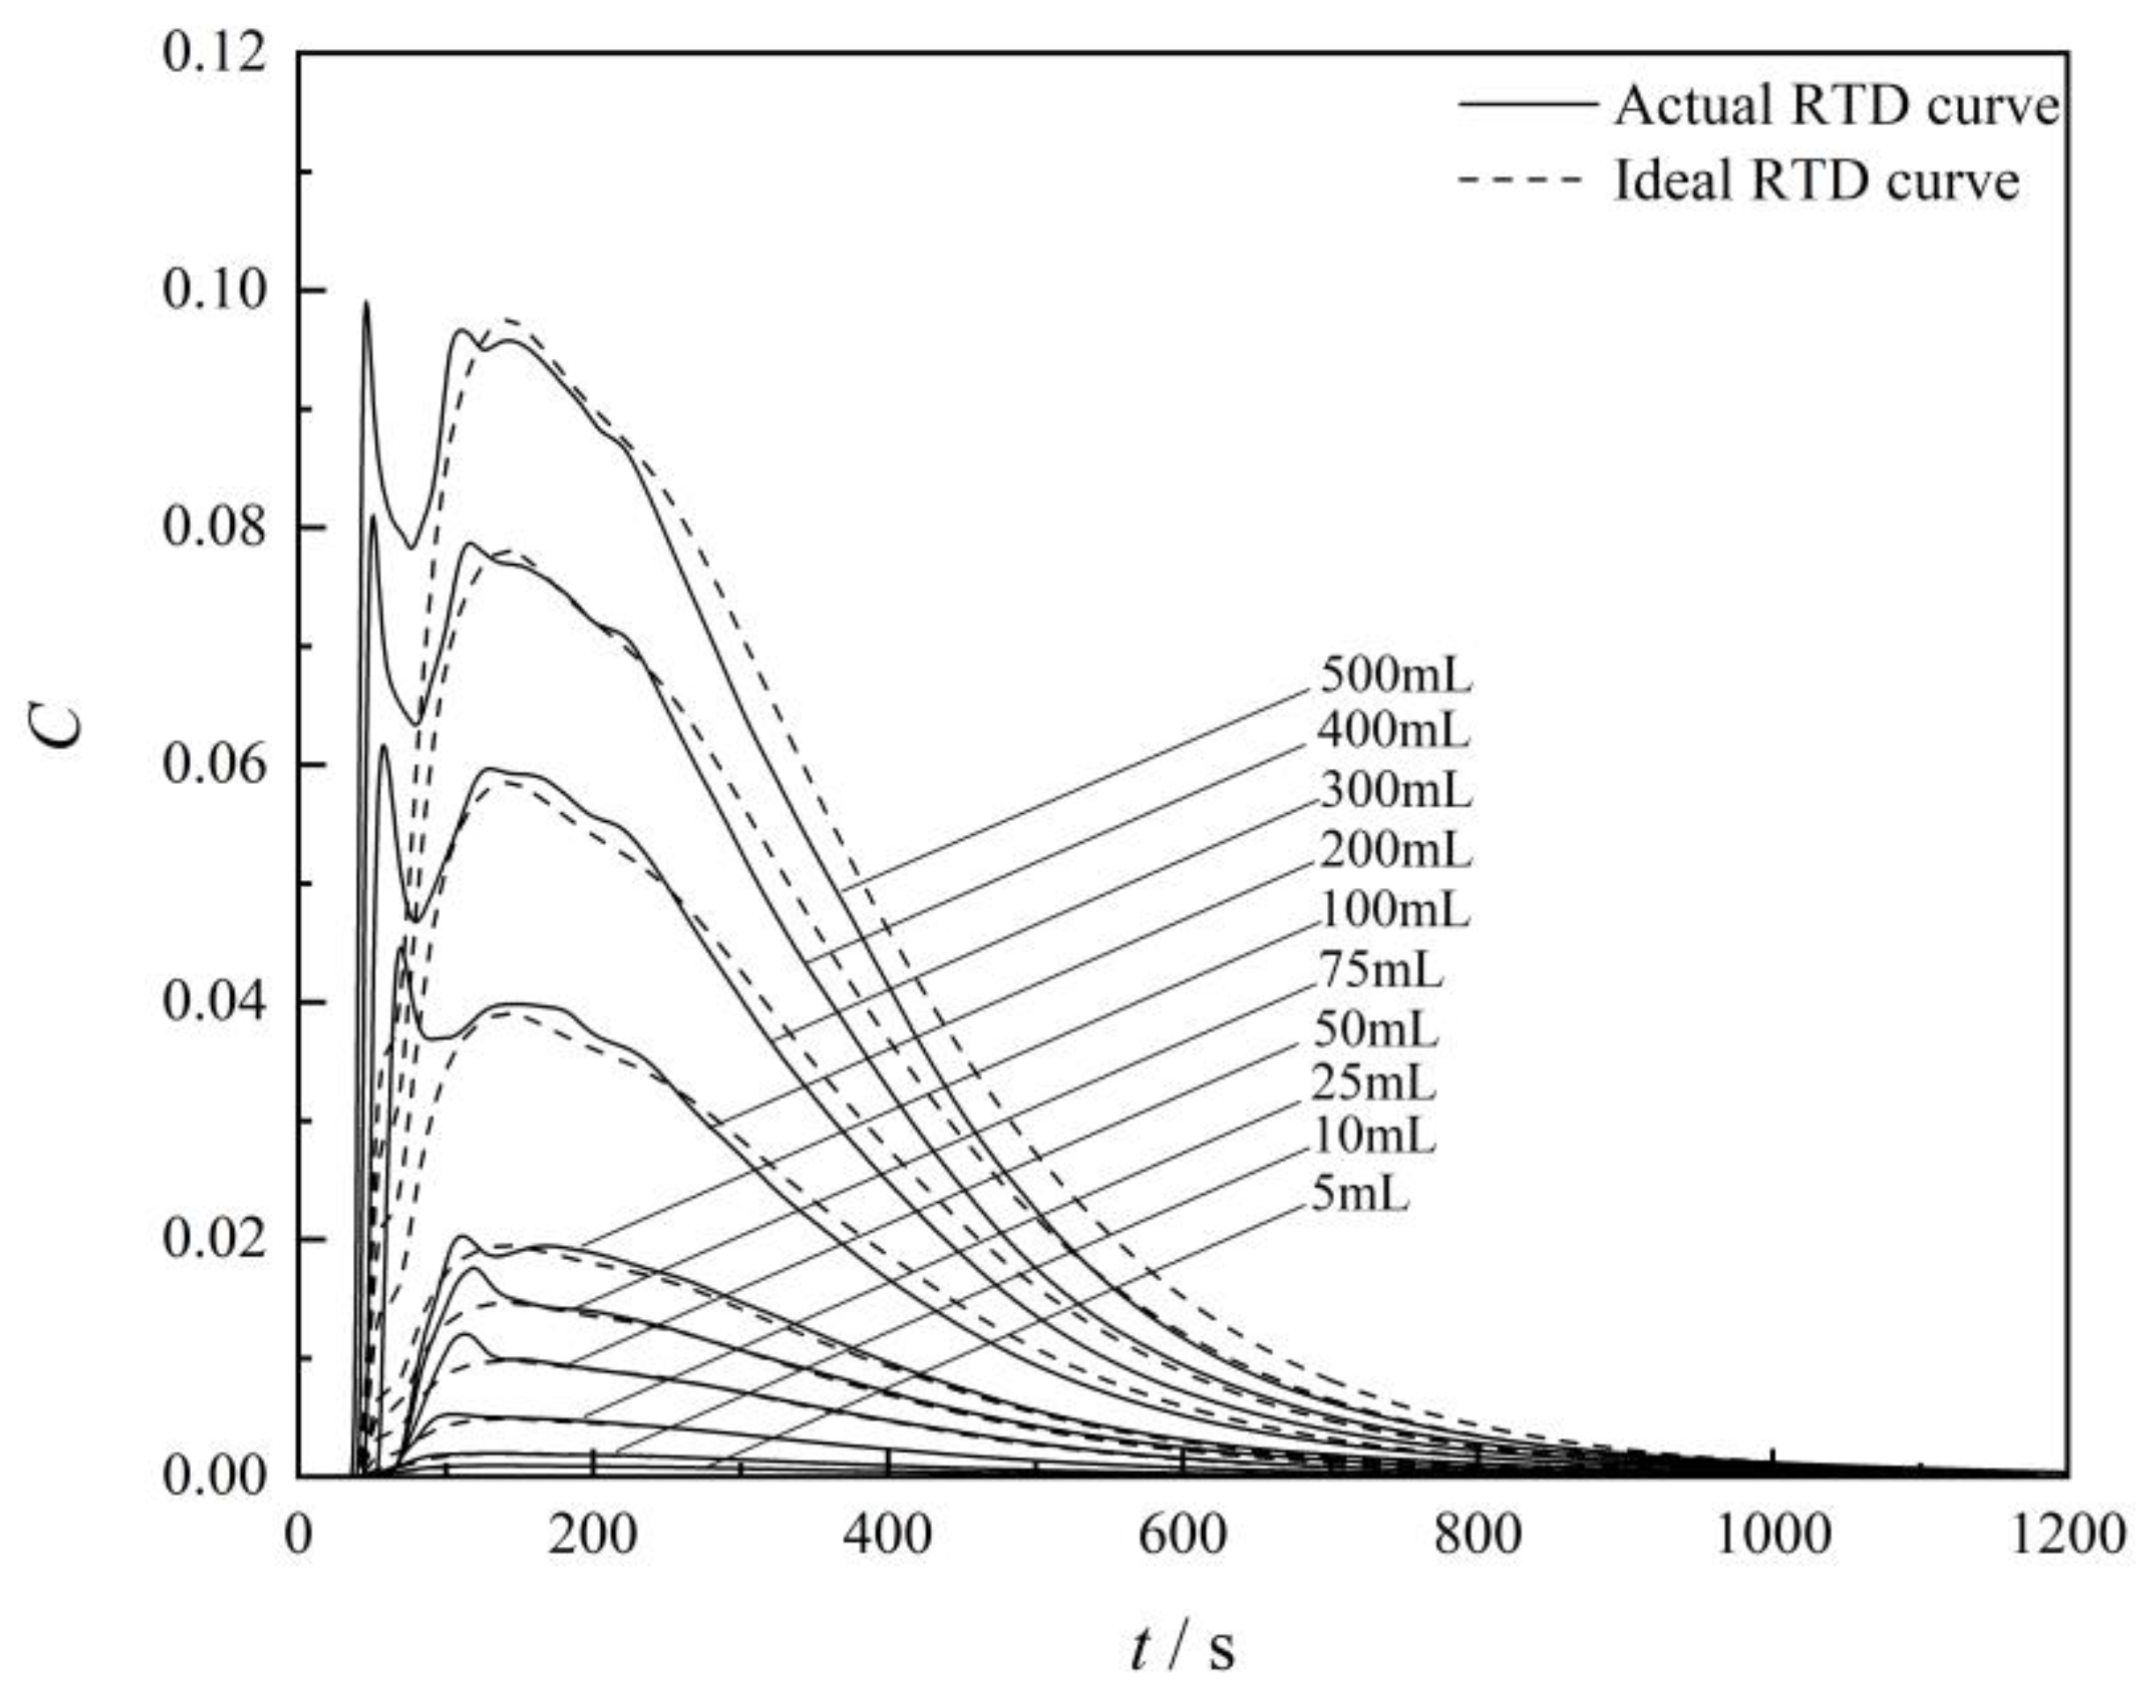
- The first peak concentration increases with the tracer solution volume, when the tracer solution volume increases from 100 mL to 500 mL, the first peak concentration is always greater than the second peak concentration.
- (2)
- With the increase of the tracer solution volume, the first peak time follows the following rule: decrease → increase → decrease. Because the RTD curves change from the single flat peak to the single sharp peak, then to the double peaks.
- (3)
- With the increase of the tracer solution volume, the second peak time decreases monotonously and the second peak concentration increases monotonously.
- (4)
- With the increase of the tracer solution volume, the average residence time follows the following rule: keep unchanged → increase → decrease because the RTD curves change from the single flat peak to the single sharp peak, then to the double peaks.
- (1)
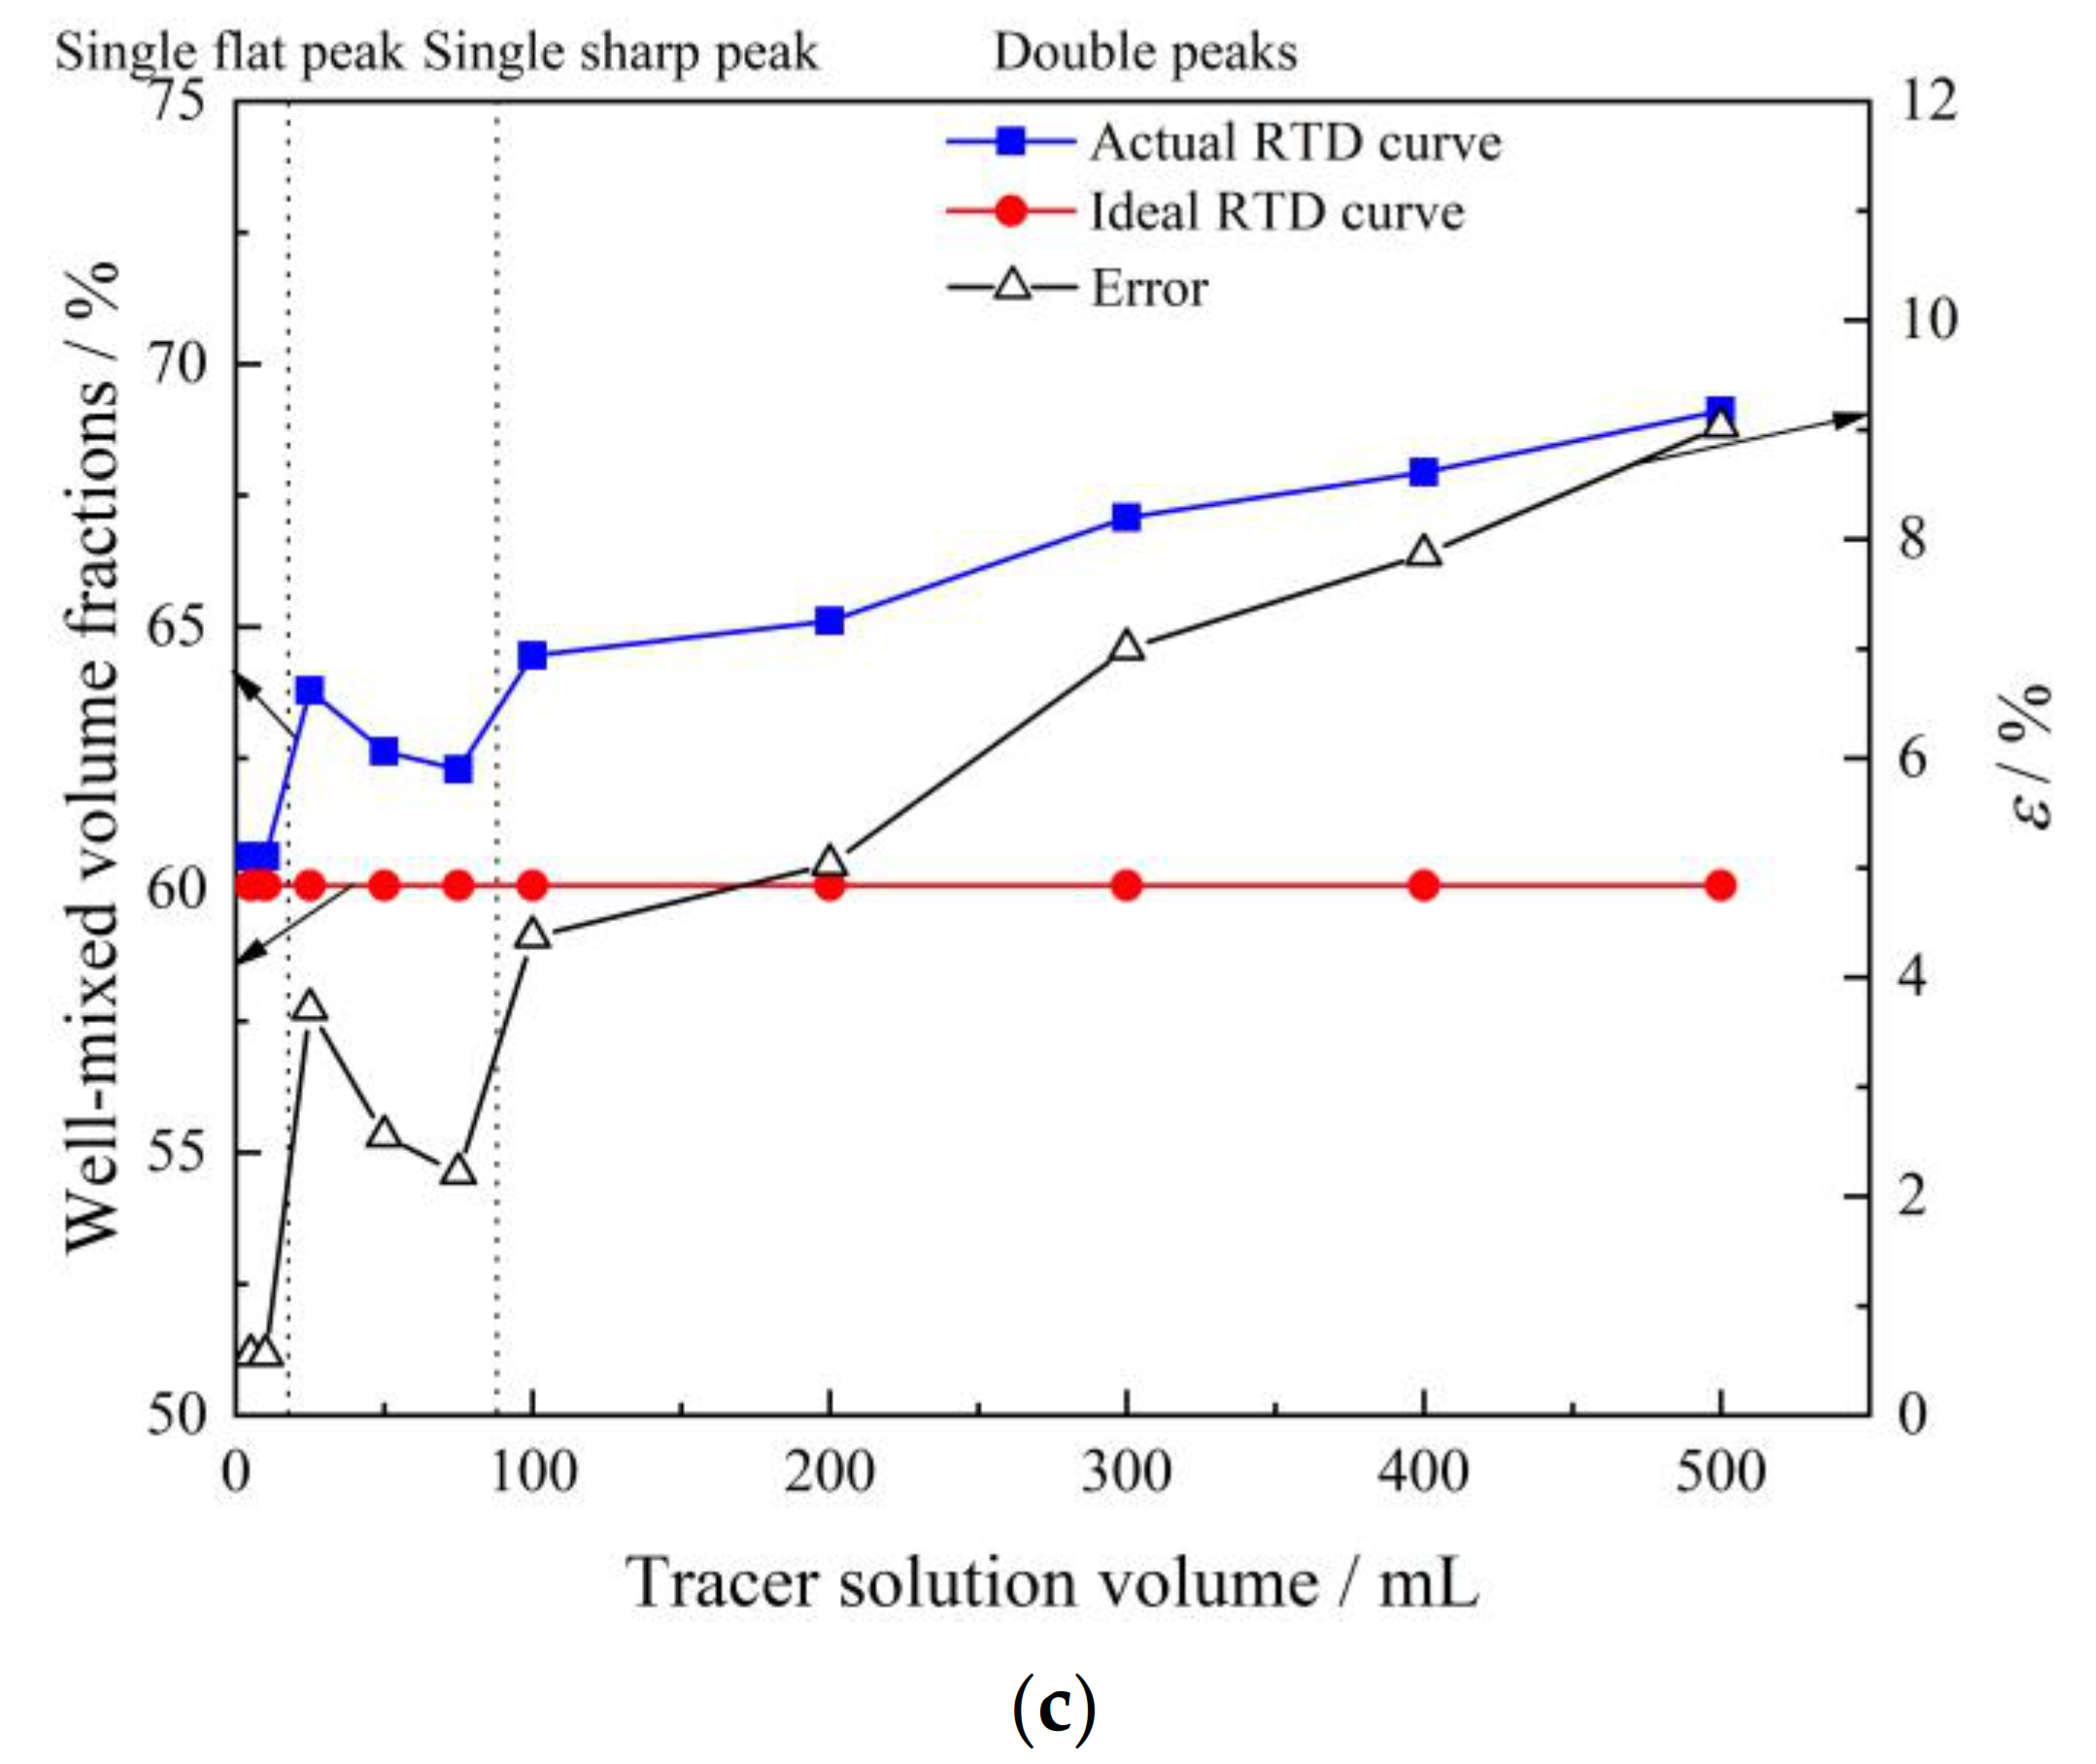
- For the ideal RTD curve, the plug volume fraction, the dead volume fraction and the well-mixed volume fraction remain the constant.
- (2)
- If the tracer solution volume is less than 10 mL, the related plug volume fraction, dead volume fraction and well-mixed volume fraction are close to the analysis result of ideal RTD curve.
- (3)
- With the increase of the tracer solution volume, the plug volume fraction of actual RTD curve follows the following rule: decrease → increase → decrease. The rule is the same as the case of different mass concentrations. The volume of tracer has a great influence on the flow field in tundish. As a result, with the increase of the tracer volume, the actual RTD curve changes from the flat single peak RTD curve to the sharp single peak RTD curve, then to the double peaks RTD curve.
- (4)
- With the increase of the tracer solution volume, the dead volume fraction of actual RTD curve follows the following rule: decrease → increase. The reasons for the decrease of dead volume fraction is that the longer flow path of tracer leads to the longer average residence time in the tundish. The reasons for the increase is that the greater solute buoyancy leads to stronger fluid flow, then the average residence time of the fluid becomes shorter in the tundish.
- (5)
- With the increase of the tracer solution volume, the well-mixed volume fraction of actual RTD curve follows the following rule: increase → decrease → increase.
4.3. General Discussion
4.3.1. Tracer Transfer Behavior
4.3.2. Solute Buoyancy
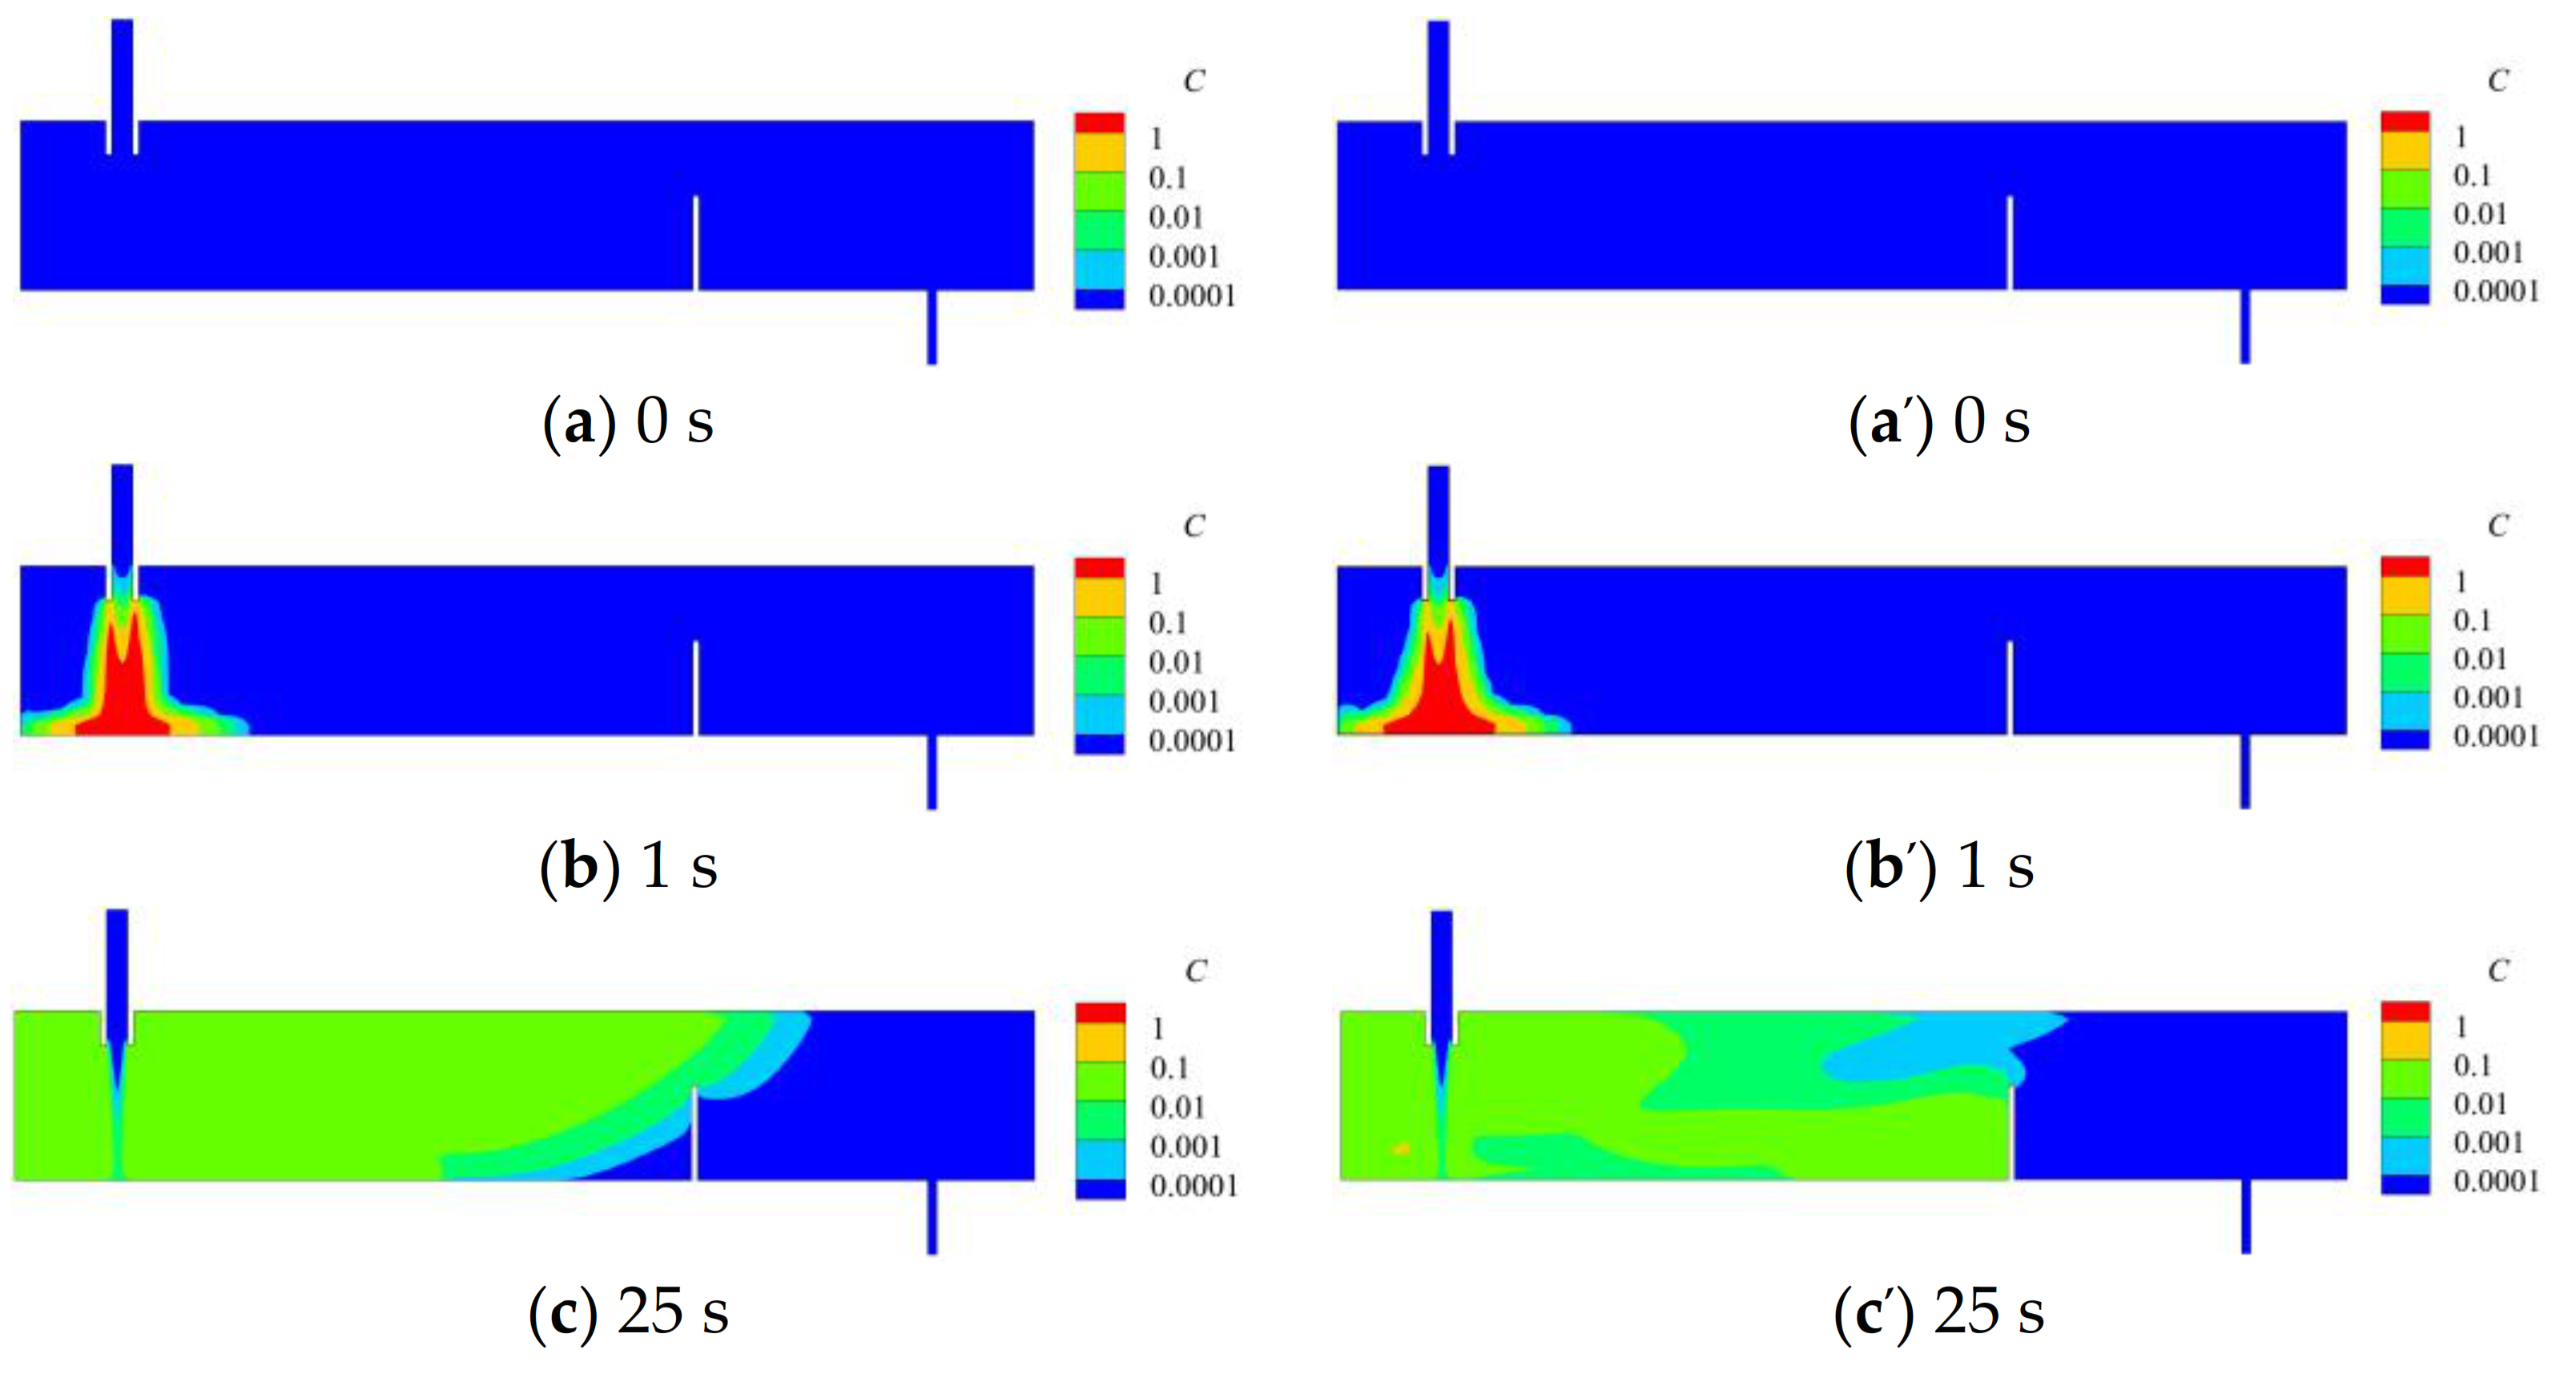
- (1)
- The solute buoyancy has very little effect on the flow field at the initial stage of the tracer pulse (Figure 12a,b), because the tracer is in the region where the fluid flow fast.
- (2)
- (3)
- After 171 s, the tracer concentration in the tundish decreases with the time, the fluid flow in the case of actual tracer is closer to the fluid flow in the case of ideal tracer as shown in Figure 12g,h.
5. Conclusions
- (1)
- The predicted RTD curve in the case of solute buoyancy has the double-peaks shape, which is closer to the RTD curve by water model. However, the ideal RTD curve has the single flat peak shape, which is different from the RTD curve by water model.
- (2)
- With the increase of the mass concentration and the volume of the tracer, the shape of the RTD curve changes from single flat peak to single sharp peak and then to double peaks. However, the ideal RTD curves are always single flat peak. The phenomenon leads to an interesting fact. The plug volume fraction, dead volume fraction and well-mixed volume fraction change with the increase of the mass concentration and the volume of the tracer for the same flow field. In order to weaken this phenomenon, the low mass concentration and the small volume of the tracer are recommended for the water model experiment.
- (3)
- By comparing the tracer transfer behavior of ideal tracer with actual tracer, because of the difference of fluid density, there is a stratified flow phenomenon in the case of actual tracer. The stratified flow causes the tracer to split into two streams to reach the tundish outlet. Therefore, there are different RTD curves for the same flow field. In other words, the unreasonable tracer parameters maybe lead to the strange RTD curves.
- (4)
- For describing the effect of tracer on flow field, the velocity difference number (δ) is introduced to demonstrate the importance of the density difference between the tracer and the fluid. As time goes on, the effect of tracer on the fluid flow in the tundish first becomes stronger and then weakens gradually. With the decrease of tracer mass concentration, the effect of tracer on the fluid flow in the tundish weakens gradually.
- (1)
- The quantitative criterion should be proposed to determine the concentration and the volume of the tracer.
- (2)
- There are some RTD curve analysis models, and these model give different RTD analysis results, it is necessary to give the advantage and the disadvantage of these models.
Author Contributions
Funding
Institutional Review Board Statement
Informed Consent Statement
Data Availability Statement
Acknowledgments
Conflicts of Interest
Nomenclatures
| Velocity of fluid (m/s) | |
| Reference concentration (—) | |
| Gravitational acceleration vector (m/s2) | |
| Pressure (Pa) | |
| Tracer mass concentration (—) | |
| Turbulent kinetic energy (m2/s2) | |
| Turbulence dissipation rate (m2/s3) | |
| Effective diffusion coefficient (m2/s) | |
| Turbulence Schmidt number (—) | |
| Charge of the ion (—) | |
| Diffusion coefficient of ion (m2/s) | |
| Fluid flow rate at tundish exit (m3/s) | |
| Minimum residence time (s) | |
| Peak concentration time (s) | |
| Theoretical residence time (s) | |
| Average residence time (s) | |
| Plug volume fraction (—) | |
| Dead volume fraction (—) | |
| Well-mixed volume fraction (—) | |
| Volume of molten steel in the tundish (m3) | |
| Velocity at x direction in the case of actual tracer(m/s) | |
| Velocity at y direction in the case of actual tracer (m/s) | |
| Velocity at z direction in the case of actual tracer (m/s) | |
| Velocity at x direction in the case of ideal tracer (m/s) | |
| Velocity at y direction in the case of ideal tracer (m/s) | |
| Velocity at z direction in the case of ideal tracer (m/s) | |
| Greek Symbols | |
| Reference density (kg/m3) | |
| Solute expansion coefficient (—) | |
| Dynamic viscosity (Pa·s) | |
| Kinematic viscosity (m2/s) | |
| Velocity difference number (—) | |
References
- Danckwerts, P.V. Continuous Flow Systems-Distribution of Residence Times. Chem. Eng. Sci. 1953, 2, 1–13. [Google Scholar] [CrossRef]
- Pour, M.A.S.; Hassanpour, S. Steel Cleanliness Depends on Inflow Turbulence Intensity (in Tundishes and Molds). Met. Mater. Trans. B 2020, 51, 2199–2210. [Google Scholar] [CrossRef]
- Nieves-Remacha, M.J.; Kukarni, A.A.; Jensen, K.F. OpenFOAM Computational Fluid Dynamic Simulations of Single-Phase Flows in an Advanced-Flow Reactor. Ind. Eng. Chem. Res. 2015, 54, 7543–7553. [Google Scholar] [CrossRef]
- Yang, B.; Lei, H.; Bi, Q.; Xiao, Y.Y.; Zhao, Y. Numerical Simulation of Collision-Coalescence and Removal of Inclusions in a Tundish. JOM 2018, 70, 2950–2957. [Google Scholar] [CrossRef]
- Wang, Q.; Qi, F.S.; Li, B.K.; Tsukihashi, F. Behavior of Non-metallic Inclusions in a Continuous Casting Tundish with Channel Type Induction Heating. Isij Int. 2014, 54, 2796–2805. [Google Scholar] [CrossRef] [Green Version]
- Rocha, J.R.D.; de Souza, E.E.B.; Marcondes, F.; Castro, J.A. Modeling and Computational Simulation of Fluid Flow, Heat Transfer and Inclusions Trajectories in a Tundish of a Steel Continuous Casting Machine. J. Mater. Res. Technol. 2019, 8, 4209–4220. [Google Scholar] [CrossRef]
- Yao, C.; Wang, M.; Zheng, R.X.; Pan, M.X.; Rao, J.Y.; Bao, Y.P. Effect of Turbulence Inhibitors on Molten Steel Flow in 66-ton T-Type Tundish with Large Impact Area. Metals 2020, 10, 1111. [Google Scholar] [CrossRef]
- Chang, S.; Zhong, L.C.; Zou, Z.S. Simulation of Flow and Heat Fields in a Seven-Strand Tundish with Gas Curtain for Molten Steel Continuous-Casting. Isij Int. 2015, 55, 837–844. [Google Scholar] [CrossRef] [Green Version]
- Chen, D.F.; Xie, X.; Long, M.J.; Zhang, M.; Zhang, L.L.; Liao, Q. Hydraulics and Mathematics Simulation on the Weir and Gas Curtain in Tundish of Ultrathick Slab Continuous Casting. Met. Mater. Trans. B 2014, 45, 392–398. [Google Scholar] [CrossRef]
- Sheng, D.Y.; Yue, Q. Modeling of Fluid Flow and Residence-Time Distribution in a Five-Strand Tundish. Metals 2020, 10, 1084. [Google Scholar] [CrossRef]
- Su, X.F.; Ji, Y.L.; Liu, J.H.; He, Y.; Shen, S.B.; Cui, H. Analysis on Residence Time Distribution Curve of Continuous Casting Tundish by Combined Model. Steel Res. Int. 2018, 89, 1800085. [Google Scholar] [CrossRef]
- Yang, B.; Lei, H.; Zhao, Y. Quasi-Symmetric Transfer Behavior in an Asymmetric Two-Strand Tundish with Different Turbulence Inhibitor. Metals 2019, 9, 855. [Google Scholar] [CrossRef] [Green Version]
- Tripathi, A.; Kumar, A.; Ajmani, S.; Singh, J.B.; Mahashabde, V. Numerical Investigation of Fluid Flow and Heat Transfer Phenomenon Inside a Single Strand Tundish of Slab Caster. Steel Res. Int. 2015, 86, 1558–1573. [Google Scholar] [CrossRef]
- Cui, H.; Liu, Y.; Li, D.X. Fluid Flow Characterization in Asymmetric Tundish. Isij Int. 2015, 55, 2604–2608. [Google Scholar] [CrossRef] [Green Version]
- Levenspiel, O. Chemical Reaction Engineering; Wiley: New York, NY, USA, 1962; pp. 243–255. [Google Scholar]
- Wang, G.C.; Yun, M.F.; Zhang, C.M.; Xiao, G.D. Flow Mechanism of Molten Steel in a Single-Strand Slab Caster Tundish Based on the Residence Time Distribution Curve and Data. Isij Int. 2015, 55, 984–992. [Google Scholar] [CrossRef] [Green Version]
- Sheng, D.Y. Design Optimization of a Single-Strand Tundish Based on CFD-Taguchi-Grey Relational Analysis Combined Method. Metals 2020, 10, 1539. [Google Scholar] [CrossRef]
- Neves, L.; Tavares, R.P. Analysis of the Mathematical Model of the Gas Bubbling Curtain Injection on the Bottom and the Walls of a Continuous Casting Tundish. Ironmak. Steelmak. 2017, 44, 559–567. [Google Scholar] [CrossRef]
- Cwudzinski, A. Numerical Prediction of Hydrodynamic Conditions in One Strand Tundish. Influence of Thermal Conditions and Casting Speed. Arch. Met. Mater. 2014, 55, 1249–1256. [Google Scholar] [CrossRef] [Green Version]
- Wang, X.Y.; Zhao, D.T.; Qiu, S.T.; Zou, Z.S. Effect of Tunnel Filters on Flow Characteristics in an Eight-Strand Tundish. Isij Int. 2017, 57, 1990–1999. [Google Scholar] [CrossRef] [Green Version]
- Merder, T. Modelling the Influence of Changing Constructive Parameters of Multi-Strand Tundish on Steel Flow and Heat Transfer. Ironmak. Steelmak. 2016, 43, 758–768. [Google Scholar] [CrossRef]
- Kumar, A.; Koria, S.C.; Mazumdar, D. Basis for Systematic Hydrodynamic Analysis of a Multi-Strand Tundish. Isij Int. 2007, 47, 1618–1624. [Google Scholar] [CrossRef] [Green Version]
- Yang, X.M.; Liu, S.X.; Jiao, J.S.; Zhang, M.; Duan, J.P.; Li, L.; Liu, C.Z. Hydrodynamic Modeling and Mathematical Simulation of Flow Field and Temperature Profile for Molten Stainless Steel in an Asymmetrical T-Type Single-Strand Continuous Casting Tundish with Arch or Round Hole(s) at Dam Bottom. Steel Res. Int. 2012, 83, 269–287. [Google Scholar] [CrossRef]
- Ding, N.; Bao, Y.P.; Sun, Q.S.; Wang, L.F. Optimization of Flow Control Devices in a Single-Strand Slab Continuous Casting Tundish. Int. J. Min. Met. Mater. 2011, 18, 292–296. [Google Scholar] [CrossRef]
- Cwudzinski, A. Numerical and Physical Prediction of Hydrodynamic Conditions in One Strand Slab Tundish. Met. Res. Technol. 2014, 111, 45–55. [Google Scholar] [CrossRef]
- Fang, Q.; Zhang, H.; Luo, R.H.; Liu, C.; Wang, Y.; Ni, H.W. Optimization of Flow, Heat Transfer and Inclusion Removal Behaviors in an Odd Multistrand Bloom Casting Tundish. J. Mater. Res. Technol. 2020, 9, 347–363. [Google Scholar] [CrossRef]
- Zhong, L.C.; Hao, R.C.; Li, J.Z.; Zhu, Y.X. Molten Steel Flow in a Slab Continuous-Casting Tundish. J. Iron Steel Res. Int. 2014, 21, 10–16. [Google Scholar] [CrossRef]
- Vassilicos, A.; Sinha, A.K. Physical Modeling Study of Thermal Effects on Steel Flow and Mixing in the Tundish. In Proceedings of the 10th Process Technology Conference, Toronto, ON, Canada, 5–8 April 1992. [Google Scholar]
- Damle, C.; Sahai, Y. The Effect of Tracer Density on Melt Flow Characterization in Continuous-Casting Tundishes—A Modeling Study. Isij Int. 1995, 35, 163–169. [Google Scholar] [CrossRef] [Green Version]
- Chen, C.; Cheng, G.G.; Sun, H.B.; Hou, Z.B.; Wang, X.C.; Zhang, J.Q. Effects of Salt Tracer Amount, Concentration and Kind on the Fluid Flow Behavior in a Hydrodynamic Model of Continuous Casting Tundish. Steel Res. Int. 2012, 83, 1141–1151. [Google Scholar] [CrossRef]
- Chen, C.; Jonsson, L.; Tilliander, A.; Cheng, G.G.; Jonsson, P. A Mathematical Modeling Study of Tracer Mixing in a Continuous Casting Tundish. Met. Mater. Trans. B 2015, 46, 169–190. [Google Scholar] [CrossRef]
- Chen, C.; Jonsson, L.; Tilliander, A.; Cheng, G.G.; Jonsson, P. A Mathematical Modeling Study of the Influence of Small Amounts of KCl Solution Tracers on Mixing in Water and Residence Time Distribution of Tracers in a Continuous Flow Reactor-Metallurgical Tundish. Chem. Eng. Sci. 2015, 137, 914–937. [Google Scholar] [CrossRef]
- Launder, B.E.; Spalding, D.B. Lectures in Mathematical Models of Turbulence; Academic Press: London, UK, 1972. [Google Scholar]
- Issa, R. Solution of the Implicitly Discretised Fluid Row Equations by Operator-Splitting. J. Comput. Phys. 1986, 62, 40–65. [Google Scholar] [CrossRef]
- Cussler, E. Diffusion: Mass Transfer in Fluid Systems; Cambridge University Press: New York, NY, USA, 2009. [Google Scholar]
- Ghaffari, A.; Rahbar-Kelishami, A. MD Simulation and Evaluation of the Self-Diffusion Coefficients in Aqueous NaCl Solutions at Different Temperatures and Concentrations. J. Mol. Liq. 2013, 187, 238–245. [Google Scholar] [CrossRef]
- Lei, H. New Insight into Combined Model and Revised Model for RTD Curves in a Multi-Strand Tundish. Met. Mater. Trans. B 2015, 46, 2408–2413. [Google Scholar] [CrossRef]
- Cwudzinski, A. Numerical, Physical, and Industrial Studies of Liquid Steel Chemical Homogenization in One Strand Tundish with Subflux Turbulence Controller. Steel Res. Int. 2015, 86, 972–983. [Google Scholar] [CrossRef]
- Cwudzinski, A. Numerical and Physical Modeling of Liquid Steel Active Flow in Tundish with Subflux Turbulence Controller and Dam. Steel Res. Int. 2014, 85, 902–917. [Google Scholar] [CrossRef]


| Parameters | Water Model |
|---|---|
| Liquid | Water |
| Number of strand | single strand |
| Flow volume at the inlet | 373.97 mL/s |
| Height of dam | 140 mm |
| Diameter of inlet | 30 mm |
| Diameter of outlet | 12 mm |
| Height of liquid level | 250 mm |
| Length of tundish model | 1500 mm |
| Width of tundish model | 300 mm |
| Height of tundish model | 350 mm |
| Solver Operator | Method |
|---|---|
| Time derivative | Euler |
| Gradient | Gauss linear |
| Divergence | Gauss upwind |
| Gauss linear | |
| Laplacian | Gauss linear uncorrected |
| Variables | Numerical Solver |
|---|---|
| Velocity | Preconditioned biconjugate gradient |
| Preconditioner diagonal-incomplete LU | |
| Pressure | Preconditioned conjugate gradient |
| Preconditioner diagonal-incomplete Cholesky | |
| Concentration | Preconditioned biconjugate gradient |
| Preconditioner diagonal-incomplete LU |
| Mass Concentration (%) | 3.01 | 11.36 | 15.38 | 21.33 | 26.42 |
|---|---|---|---|---|---|
| Average diffusion coefficient (10−9m2/s) | 0.914 | 0.945 | 0.725 | 0.66 | 0.551 |
| Grid Numbers | 84,072 | 112,380 | 136,068 | 162,156 | 184,860 |
|---|---|---|---|---|---|
| tmax | 111 | 111 | 111 | 111 | 111 |
| Cmax | 0.020212 | 0.020322 | 0.020379 | 0.020200 | 0.020097 |
| Case | |||
|---|---|---|---|
| RTD curve with solute buoyancy effect | 29.57% | 5.98% | 64.45% |
| RTD curve from water model | 27.41% | 6.64% | 65.95% |
| Ideal RTD curve | 30.73% | 9.30% | 59.97% |
| Tracer Mass Concentration/% | Minimum Residence Time/s | Peak Concentration Time/s | Average Residence Time/s | Theoretical Residence Time/s |
|---|---|---|---|---|
| 3.01 | 50 | 129 | 273 | 301 |
| 11.36 | 65 | 111 | 278 | |
| 15.38 | 66 | 116 | 279 | |
| 21.33 | 67 | 119 | 280 | |
| 26.42 | 67 | 111 | 283 |
| Tracer Volume/mL | First Peak Time/s | First Peak Concentration | Second Peak Time/s | Second Peak Concentration | Average Residence Time/s |
|---|---|---|---|---|---|
| 5 | 135 | 0.0009 | - | - | 273 |
| 10 | 132 | 0.0020 | - | - | 273 |
| 25 | 105 | 0.0053 | - | - | 275 |
| 50 | 113 | 0.0120 | - | - | 278 |
| 75 | 119 | 0.0176 | - | - | 280 |
| 100 | 111 | 0.0203 | 171 | 0.0194 | 283 |
| 200 | 69 | 0.0446 | 147 | 0.0398 | 258 |
| 300 | 58 | 0.0617 | 130 | 0.0597 | 254 |
| 400 | 51 | 0.0810 | 116 | 0.0787 | 251 |
| 500 | 46 | 0.0990 | 111 | 0.0966 | 250 |
Publisher’s Note: MDPI stays neutral with regard to jurisdictional claims in published maps and institutional affiliations. |
© 2021 by the authors. Licensee MDPI, Basel, Switzerland. This article is an open access article distributed under the terms and conditions of the Creative Commons Attribution (CC BY) license (http://creativecommons.org/licenses/by/4.0/).
Share and Cite
Ding, C.; Lei, H.; Niu, H.; Zhang, H.; Yang, B.; Zhao, Y. Effects of Salt Tracer Volume and Concentration on Residence Time Distribution Curves for Characterization of Liquid Steel Behavior in Metallurgical Tundish. Metals 2021, 11, 430. https://doi.org/10.3390/met11030430
Ding C, Lei H, Niu H, Zhang H, Yang B, Zhao Y. Effects of Salt Tracer Volume and Concentration on Residence Time Distribution Curves for Characterization of Liquid Steel Behavior in Metallurgical Tundish. Metals. 2021; 11(3):430. https://doi.org/10.3390/met11030430
Chicago/Turabian StyleDing, Changyou, Hong Lei, Hong Niu, Han Zhang, Bin Yang, and Yan Zhao. 2021. "Effects of Salt Tracer Volume and Concentration on Residence Time Distribution Curves for Characterization of Liquid Steel Behavior in Metallurgical Tundish" Metals 11, no. 3: 430. https://doi.org/10.3390/met11030430