Article

Study on a New Forming Method—Thread Rolling by Crystal Plasticity Finite Element Simulation

1
College of Materials Engineering, Jilin University, Changchun 130025, China
2
Roll Forging Research Institute, Jilin University, Changchun 130025, China
*
Author to whom correspondence should be addressed.
Metals 2021, 11(3), 503; https://doi.org/10.3390/met11030503
Submission received: 1 March 2021 / Revised: 13 March 2021 / Accepted: 13 March 2021 / Published: 18 March 2021

Abstract

:
In order to study a new thread rolling forming process from a microscopic perspective, a polycrystalline model was established, based on the crystal plasticity finite element method (CPFEM) and Voronoi polyhedron theory. The fluidity of metals was studied to explain the reason for the concave center. The simulation results show that the strain curve of the representative element can more truly reflect the deformation behavior of the material. The grain orientations after deformation are distributed near the initial orientation. The evolution of each slip system is determined by the initial grain orientations and grain locations. The pole figures obtained from the experiment show high consistency with the pole figures obtained by simulation, which verifies the accuracy of the texture prediction by CPFEM. The experimental results show that thread rolling is more uniform in deformation than ordinary rolling.

1. Introduction

With the progress of society, scientific research has begun to be closely linked in multiple disciplines and fields. A better combination of numerical simulation and theory is required to establish a quantitative relationship between the micro- and macro-perspective. It is of particular significance to study the changes of grain orientation and dislocation slip microscopically. The crystal plasticity finite element method (CPFEM) has relatively high requirements from modeling to analysis, to data processing. Because of its academic frontier, it has become a hot spot in related research fields. When the size is reduced to the micro-scale, the size effects [1,2] become significant. The material will show anisotropy in the plastic deformation process [3]. The appearance of texture will have an important impact on the mechanical properties of the material [4,5].
The production technology of wire rod has been highly automated and has become an indispensable part of the industry. A large number of new materials, new equipment, and new products are widely used. As a traditional plastic processing method, the drawing process is mainly used for the processing and production of bars and wires. This paper mainly proposes a new wire processing method, designing a new type of metal wire thread rolling equipment. The material exhibits significant anisotropy during plastic processing with large deformation. The constitutive model of the research material plays an important role in CPFEM [6,7]. As the theory of crystal plasticity becomes more and more perfected, it becomes easier to establish the connection between the internal mechanism of the material and the macroscopic properties. It is of great significance to use CPFEM to simulate material deformation [8,9,10]. The plastic constitutive theory of continuum mechanics can only solve the macroscopic material plastic deformation problem. Parameter fitting is required in the macroscopic simulation, which requires a large amount of experimental data as a basis. It has a great dependence on experiment, and it is also necessary to find the correct expression to obtain the mechanical property data of the material. The crystal plasticity theory based on the microstructure of materials can truly reflect the plastic deformation behavior of materials [11,12,13,14,15]. The movement of the slip system is described by plastic shear strain rate. Metal materials have a size effect. As the size decreases, the effect becomes more obvious. CPFEM is based on the different grain orientations inside the material. This method truly restores the physical nature of the material and makes up for the shortcomings of the macroscopic finite element method. Today’s computer technology is developing very rapidly, and most forming methods can be numerically simulated on the computer. CPFEM can improve the quality of the material and help understand the plastic deformation mechanism of the material [16,17,18]. Chen et al. [19] used CPFEM to analysis the copper rolling process, and the results showed that the movement of the slip system is different. Pi et al. [20,21] used CPFEM to analysis the textures during the different deformation methods of pure aluminum, and the results showed that the textures of the simulation were consistent with the experimental. Hama and Takuda [22,23] studied the unloading behavior of magnesium alloy during tensile deformation. It was concluded that only the base slip systems were activated during the unloading process. Alankar et al. [24] and Ha et al. [25] simulated the deformation of pure aluminum by using a dislocation-density-based crystal plasticity model. The results showed a reasonable attempt at incorporating microstructural considerations into the model along with the kinematics of crystal plasticity in forming a more physically realistic prediction. Li et al. [26] studied the rotation of the grains during uniaxial deformation. The results showed that the initial orientation determined the degree of grain rotation. Ritz and Dawson [27] used CPFEM to study the effect of grain morphology on the tensile deformation of aluminum alloys, and found that the grain morphology significantly affects the stress distribution interior of the grains and at the grain boundaries. Nakamachi et al. [28] established a polycrystalline representative volume element (RVE) model that satisfies the periodic condition of the crystal orientation distribution, and verified the accuracy of the RVE model through the results. Jigh et al. [29] used the RVE model to predict the mechanical behavior of metal foams and studied the effects of different boundary conditions on the mechanical properties.
According to the above literature review, it is clear that the molding method is relatively simple. At present, research on the effect of grain orientation during complex deformation, based on the three-dimensional CPFEM model, is still limited. This paper proposes a new forming method—thread rolling. This forming method using CPFEM is difficult to converge with calculation. The relevant parameters need to be set strictly. A poly crystalline model was established based on the Voronoi diagram, and the deformation behavior during the rotation of the workpiece was studied. The fluidity of the metal was analyzed, and the reason for the concave core phenomenon explained. The rotation of the grain and the movement of the slip system were also studied. The pole figure obtained from simulation was used to predict the appearance of the texture on thread rolling forming.

2. Theoretical Model

2.1. Kinematics Model

The theory of crystal plasticity follows the pioneering work of Talor [30]. The plastic constitutive equations were initially proposed by Hill and Rice [31]. The total deformation gradient F   is given as follows:
F = F * · F P
where   F P and   F * are the plastic and the elastic deformation gradient, respectively. The elastic constitutive relation can be expressed as follows:
M = C e : E = det ( F * ) ( F * ) 1 σ ( F * ) T
where M is the second Piola–Kirchhoff stress; C e is the fourth-order anisotropic elasticity matrix; E is the Lagrangian elastic strain tensor; σ is the Cauchy stress tensor. F ˙ P   is the rate of change of F P ;   ( F P ) 1   is the inverse matrix of F P ; γ ˙ ( α )   is the shear strain rate of the slip system α . The relationship between   F ˙ P and γ ˙ ( α ) is given as follows:
F ˙ P · ( F P ) 1 = α γ ˙ ( α )     S ( α )       m ( α )
where   S ( α )   is the slip direction vector of the slip plane in the slip system   α ;   m ( α ) is the normal direction vector of the slip plane in the slip system   α . The summation range includes all the slip systems being activated.

2.2. Constitutive Model

Assuming that the crystal slip follows Schmid’s law, the relationship between   σ   and the resolved shear stress   τ α is given as follows:
τ α = m * ( α ) · ρ 0 ρ · σ ·   S * ( α )
where m * ( α ) and     S * ( α )   are the unit normal direction vector of slip plane and the unit slip direction vector in the slip system α , respectively. ρ 0   and   ρ   represent the mass density of the reference state and the current state, respectively.
Crystal plasticity theory is completed by relating the shear strain rate   γ ˙ ( α ) to the stress   M . The generalized Schmid’s law states that slip occurs if the resolved shear stress τ α = M : T reaches a critical value. T   is the Schmid tensor. In the rate-dependent crystal plasticity model, the exponential equation describes the relationship between the shear strain rate γ ˙ ( α ) and the resolved shear stress τ α of the slip system   α . The formula is given as follows:
γ ˙ ( α ) = γ ˙ 0 ( α )   s i g n   ( τ α ) |   τ α τ c α   | n
where τ c α   is the critical resolved shear stress of the slip system   α ; γ ˙ 0 ( α ) is the reference shear strain rate;   n   is the strain rate sensitive coefficient.   n = 0   and   n =   correspond to viscoelasticity and rate-independent materials, respectively. The critical shear rate τ ˙ c α   is given as follows:
τ ˙ c α = β N h α β | γ ˙ ( β ) | ,
where h α β   is the slip hardening modulus; γ ˙ ( β ) is the shear strain rate of the slip system   β . N represents the total number of slip systems; The above formula sums all activated slip systems. When   α =   β , h α β   = h α α , h α α   is called the self-hardening modulus; when   α β , h α β   is called the latent hardening modulus. The formula for calculating the self-hardening modulus was given by Peirce [32,33] et al. and Asaro et al. [34] as follows:
h α α = h ( γ ) = h 0 s e c h 2 ( h 0 γ τ s τ 0 )
γ = α 0 t | γ ˙ ( α ) | d t
The formula for calculating the latent hardening modulus is as follows: γ
h α β = q h ( γ ) ( α β )
where h 0   represents the initial hardening modulus; γ represents the cumulative shear strain rates of all slip systems; τ 0   represents the initial critical shear stress; τ s   is the saturation value of the initial critical shear stress; q   is the latent hardening parameter.
The constitutive model was compiled by FORTRAN language into the user-defined material subroutine (UMAT) for the CPFEM simulation, and the combination of finite element method and crystal plasticity constitutive theory was realized.

3. Finite Element Model

In this paper, the polycrystalline model was obtained by the NEPER [35] software. The polycrystalline model used for thread rolling forming contains 50 grains. Each grain is given a random orientation before deformation. The model is given in Figure 1.
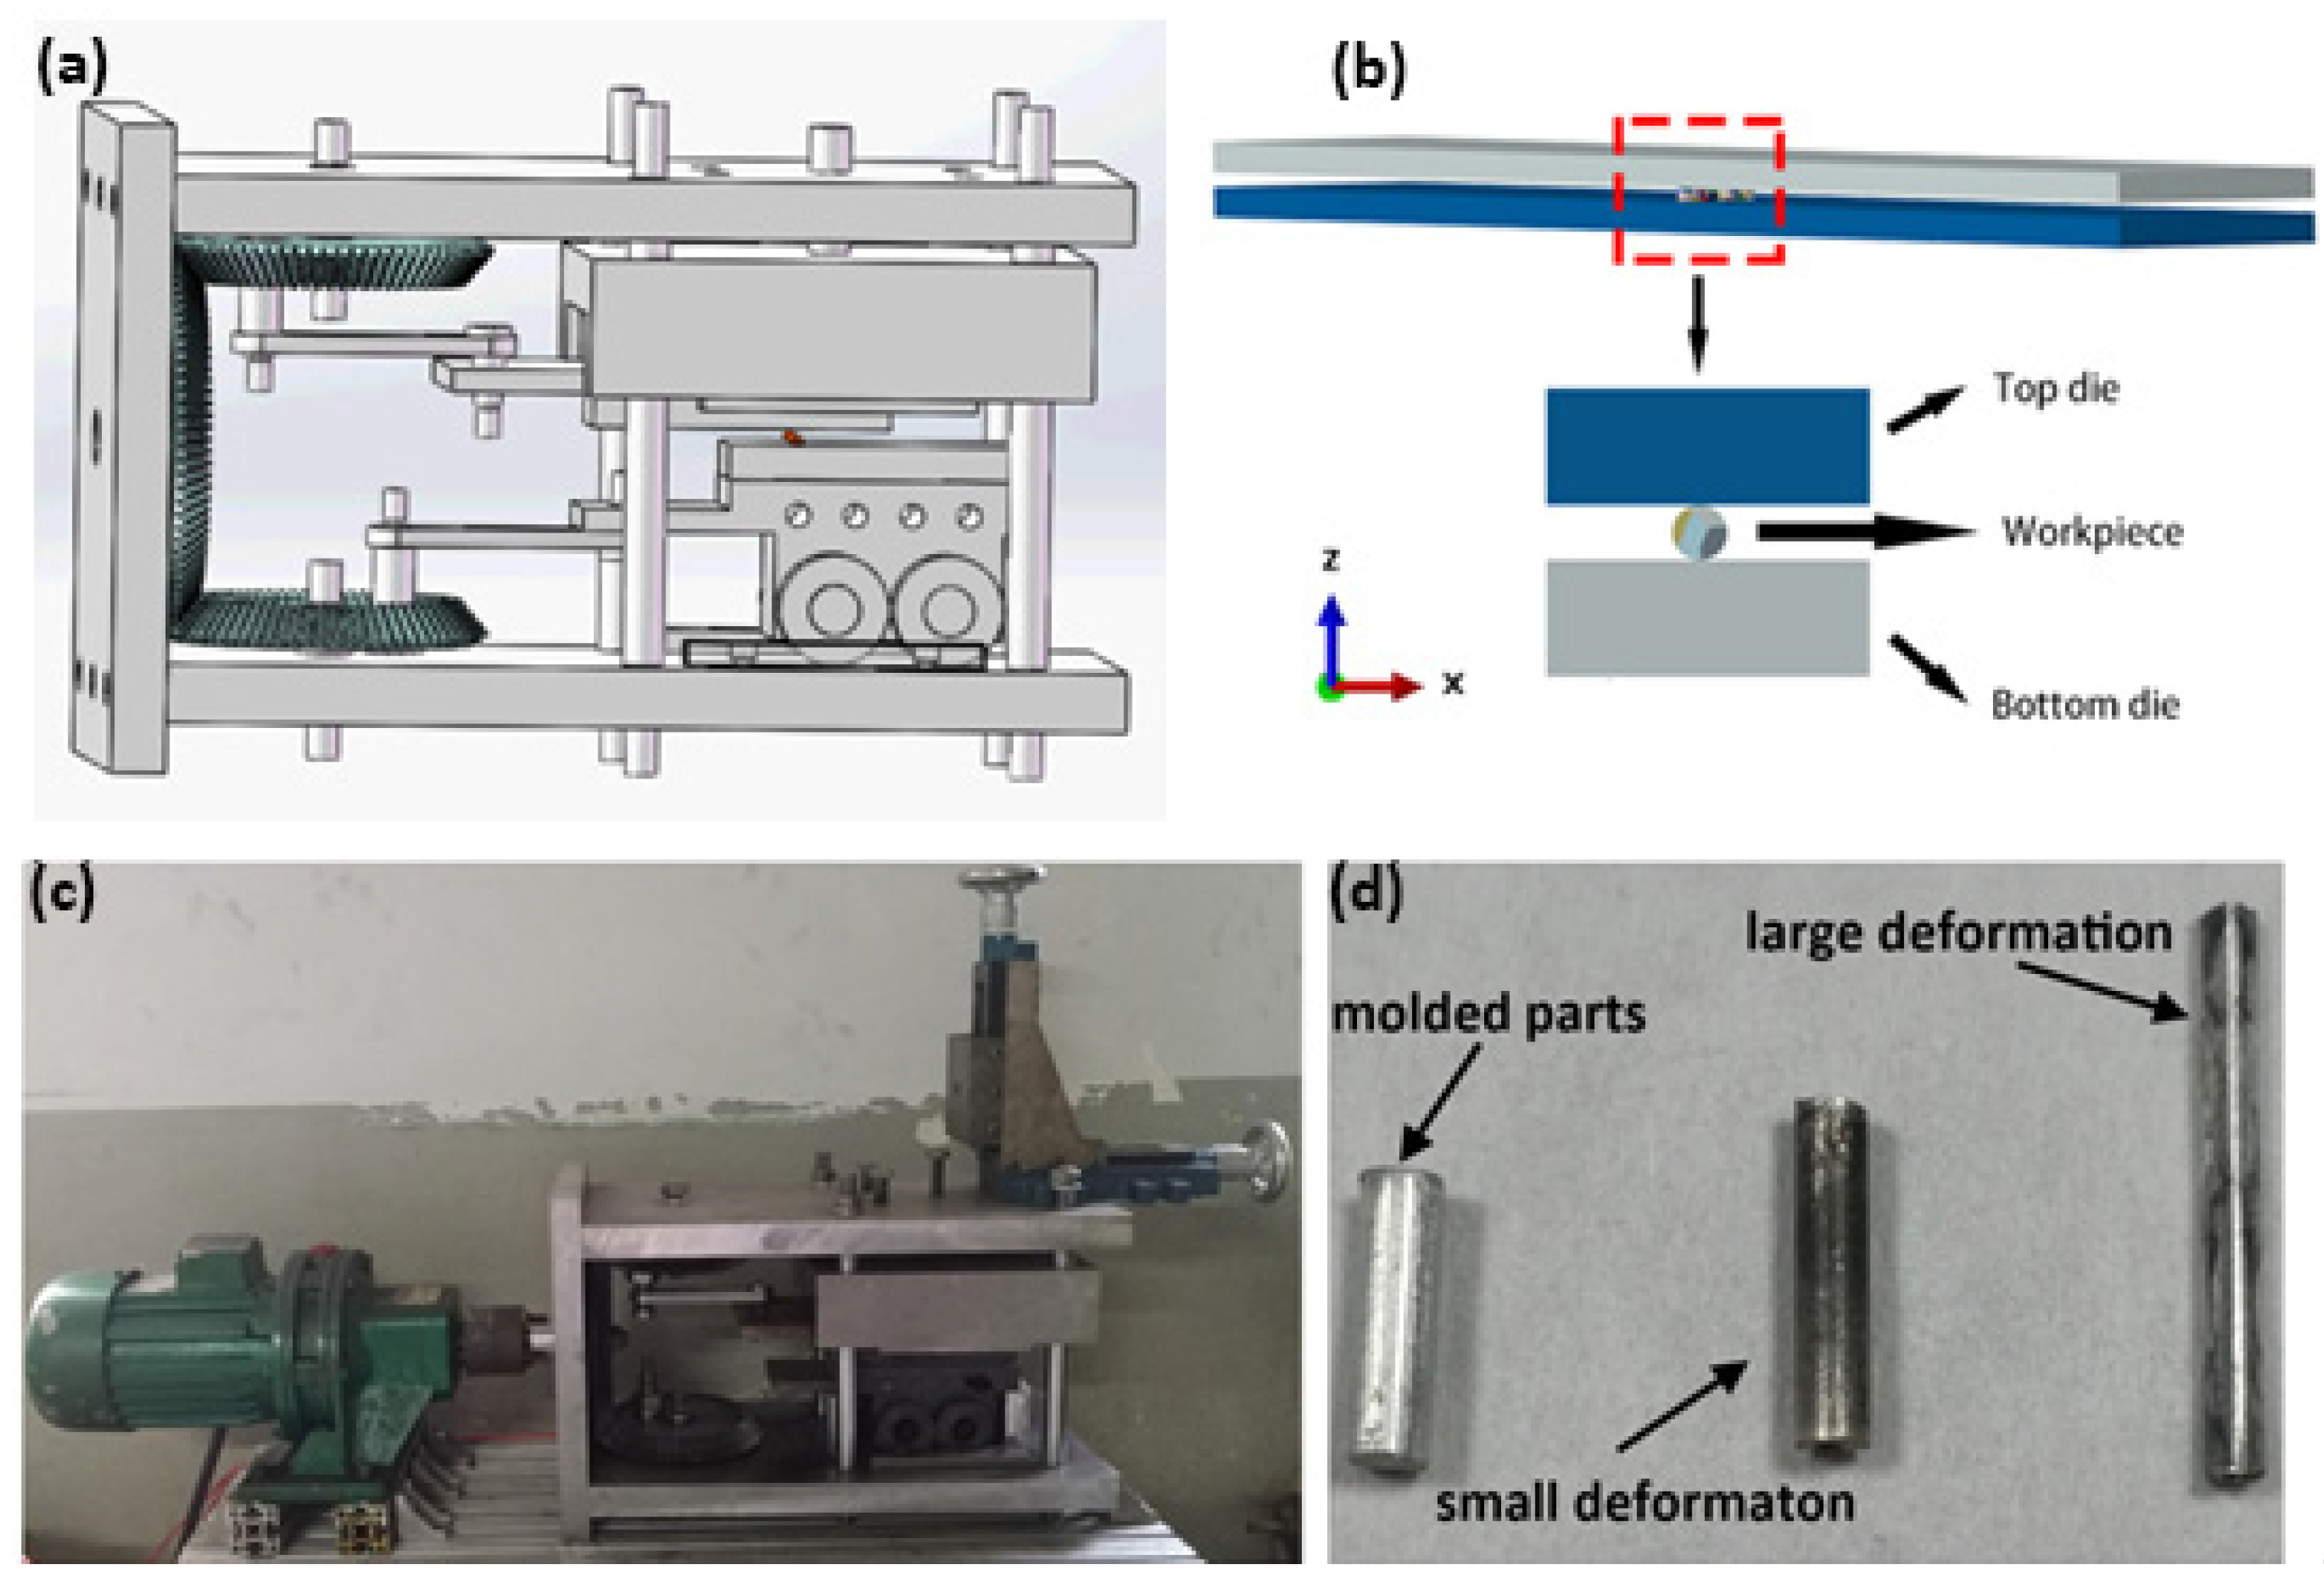
This research independently designed thread rolling forming equipment. The power of the equipment comes from the motor, and the movement of the top and bottom dies is completed by the transmission of the drive shaft. The transmission shaft drives the movement of the gears. The gears mesh with each other, and the top and bottom dies are driven by the connecting rod. In this way, the reciprocating movement between top and bottom dies can be realized. Combined with the pressure applied to the top die, the workpiece is deformed in this process, and the thread rolling process is formed. Figure 2b is a simplified thread rolling finite element model. As shown in Figure 2d, the length of the workpiece changes from 10 mm to 21 mm and the diameter changes from 3 mm to 2 mm after the thread rolling experiment. The thread rolling model is shown in Figure 2.
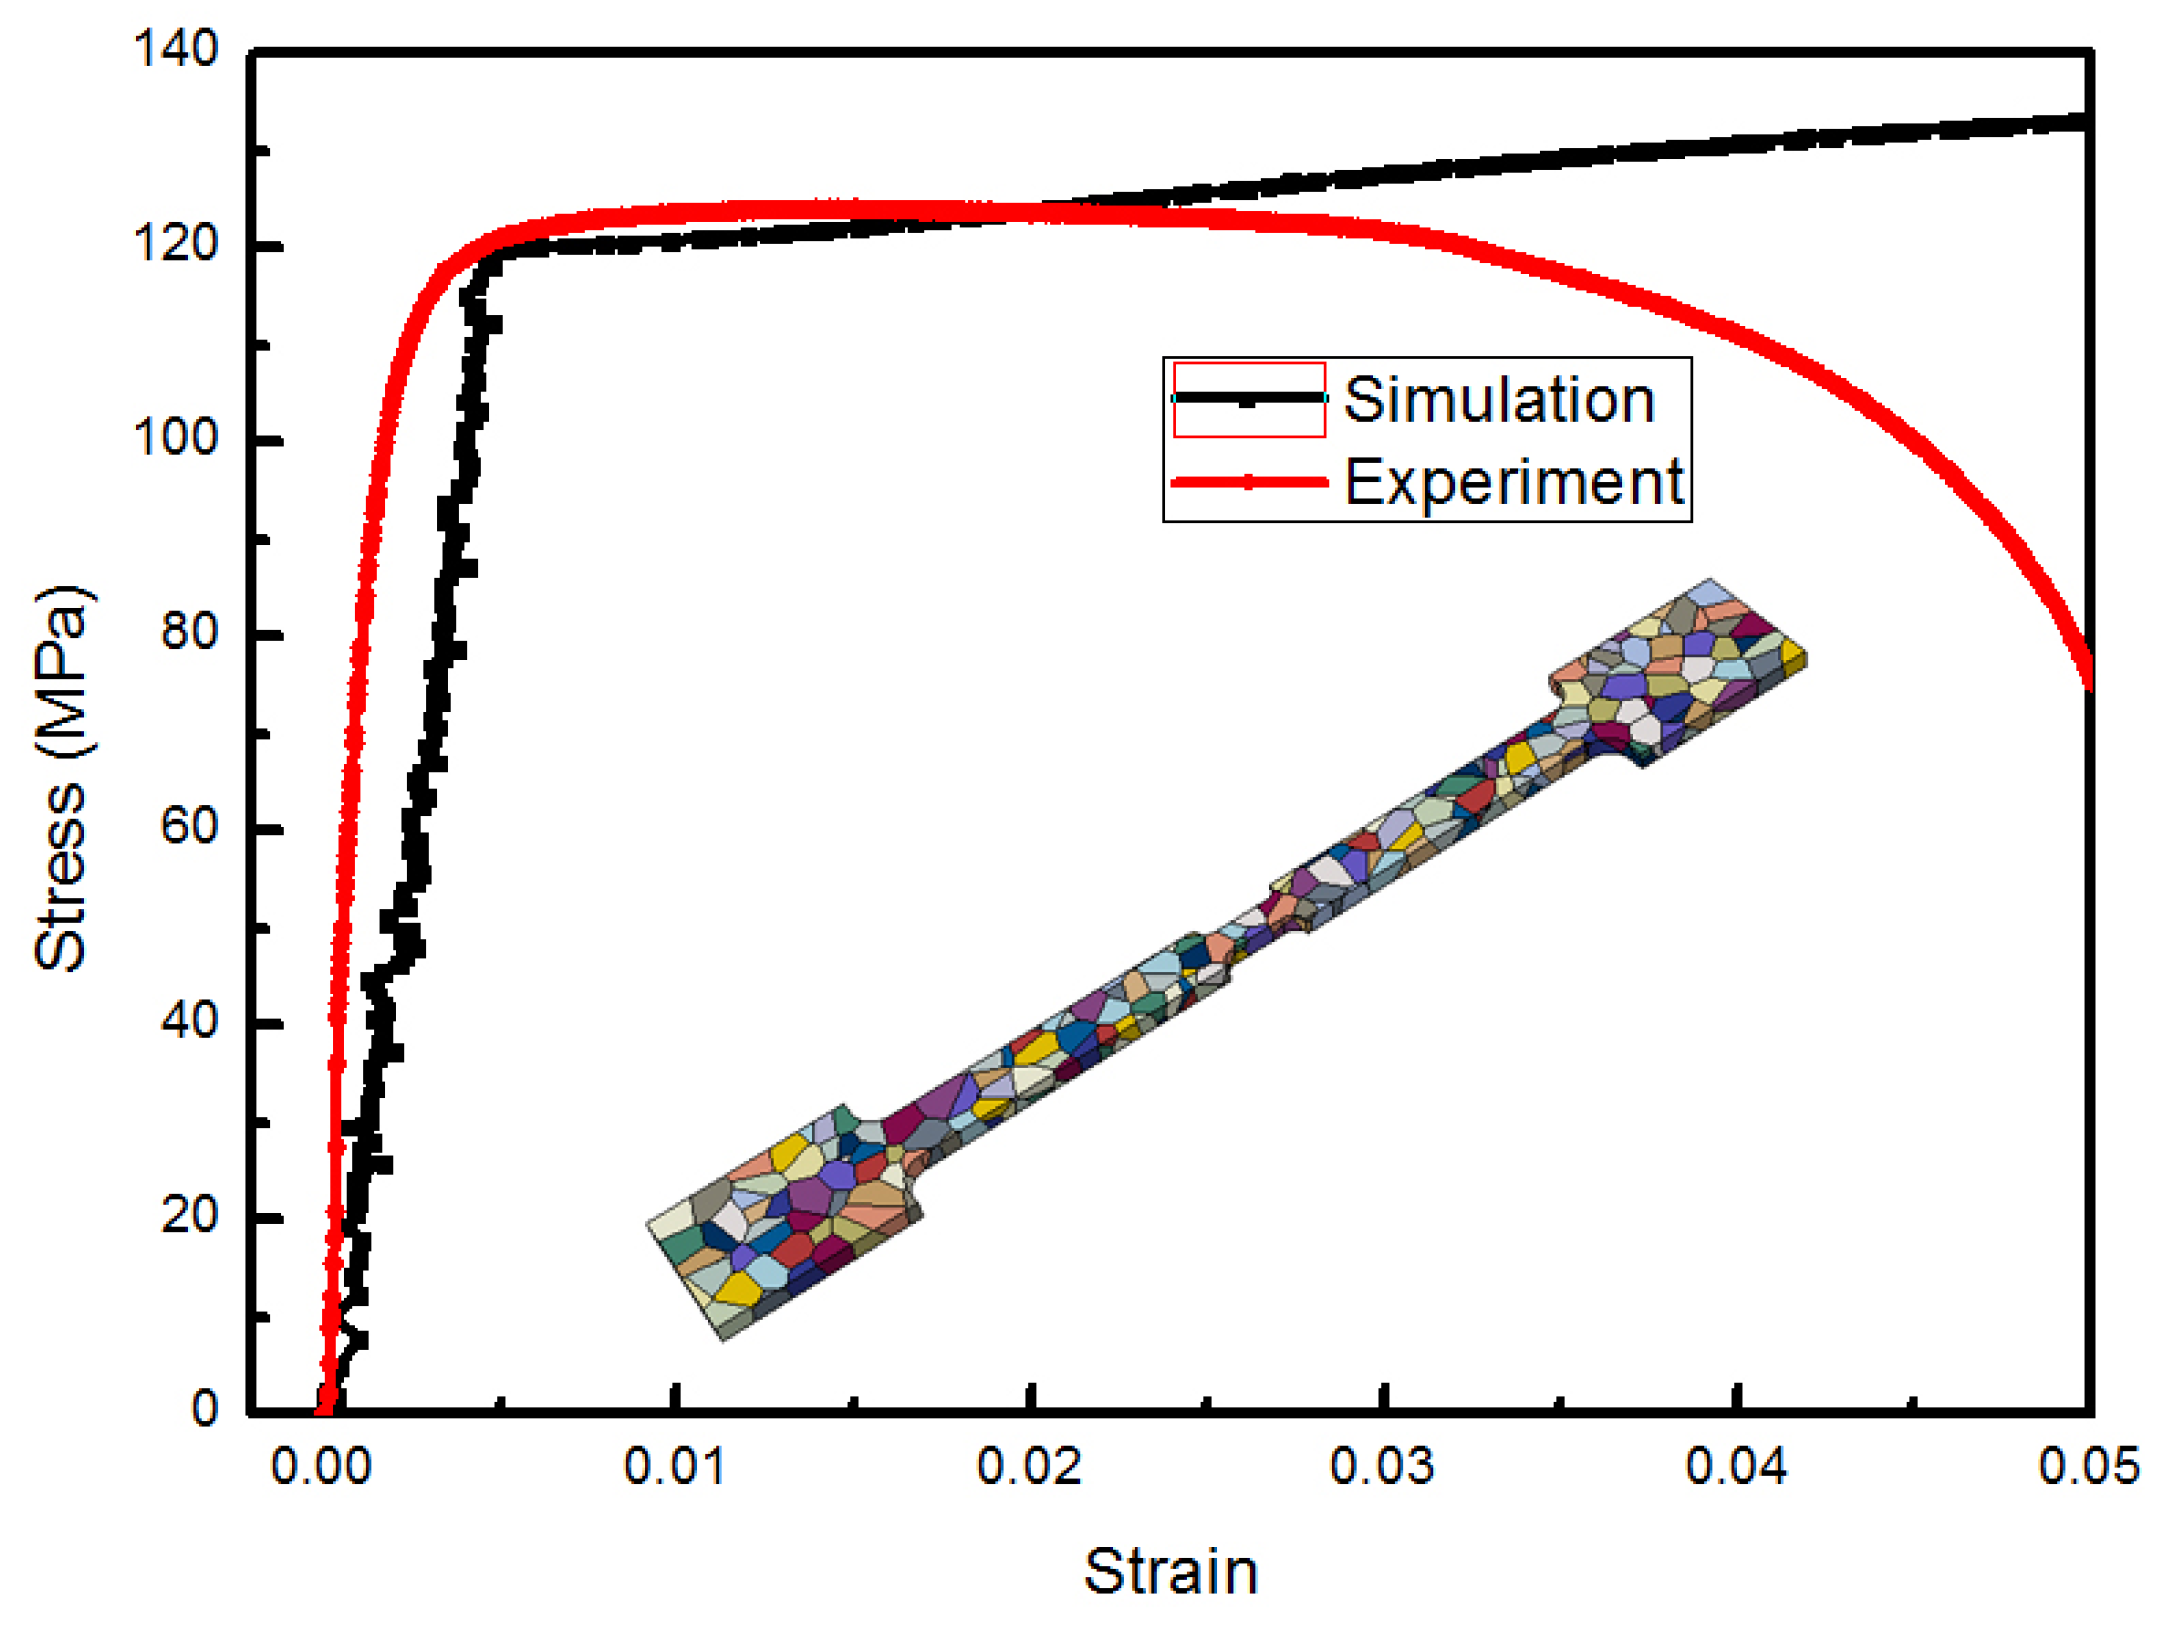
The simulation in this article consists of two analysis steps. The first analysis step (before 1 s) establishes the contact relationship between the parts, and the second analysis step (1 s later) begins the deformation. The size of the top and bottom dies is 200 mm × 20 mm; the thickness is 5 mm; the diameter of the workpiece is 3 mm; the length is 10 mm; the number of nodes is 8236; the element type is C3D10; the number of elements is 5302. The bottom die is fixed on the Y and Z axis; the top die is fixed on the Y axis and given a displacement in the negative direction of the Z axis; the top and bottom dies move in opposite directions on the X axis. Through the relative movement of the top and the bottom dies in the X and Z axis directions, the workpiece is uniformly thinned and elongated. In this paper, pure aluminum material is used as the research object. By comparing simulated and experimental tensile stress-strain curves in Figure 3, the reasonable parameters are determined. The elastic coefficients are C11 = 108,000 MPa, C12 = 62,000 MPa, and C44 = 28,300 MPa. The parameters of the constitutive model are shown in the following Table 1.

4. Simulation Results and Discussion

4.1. Metal Fluidity Analysis

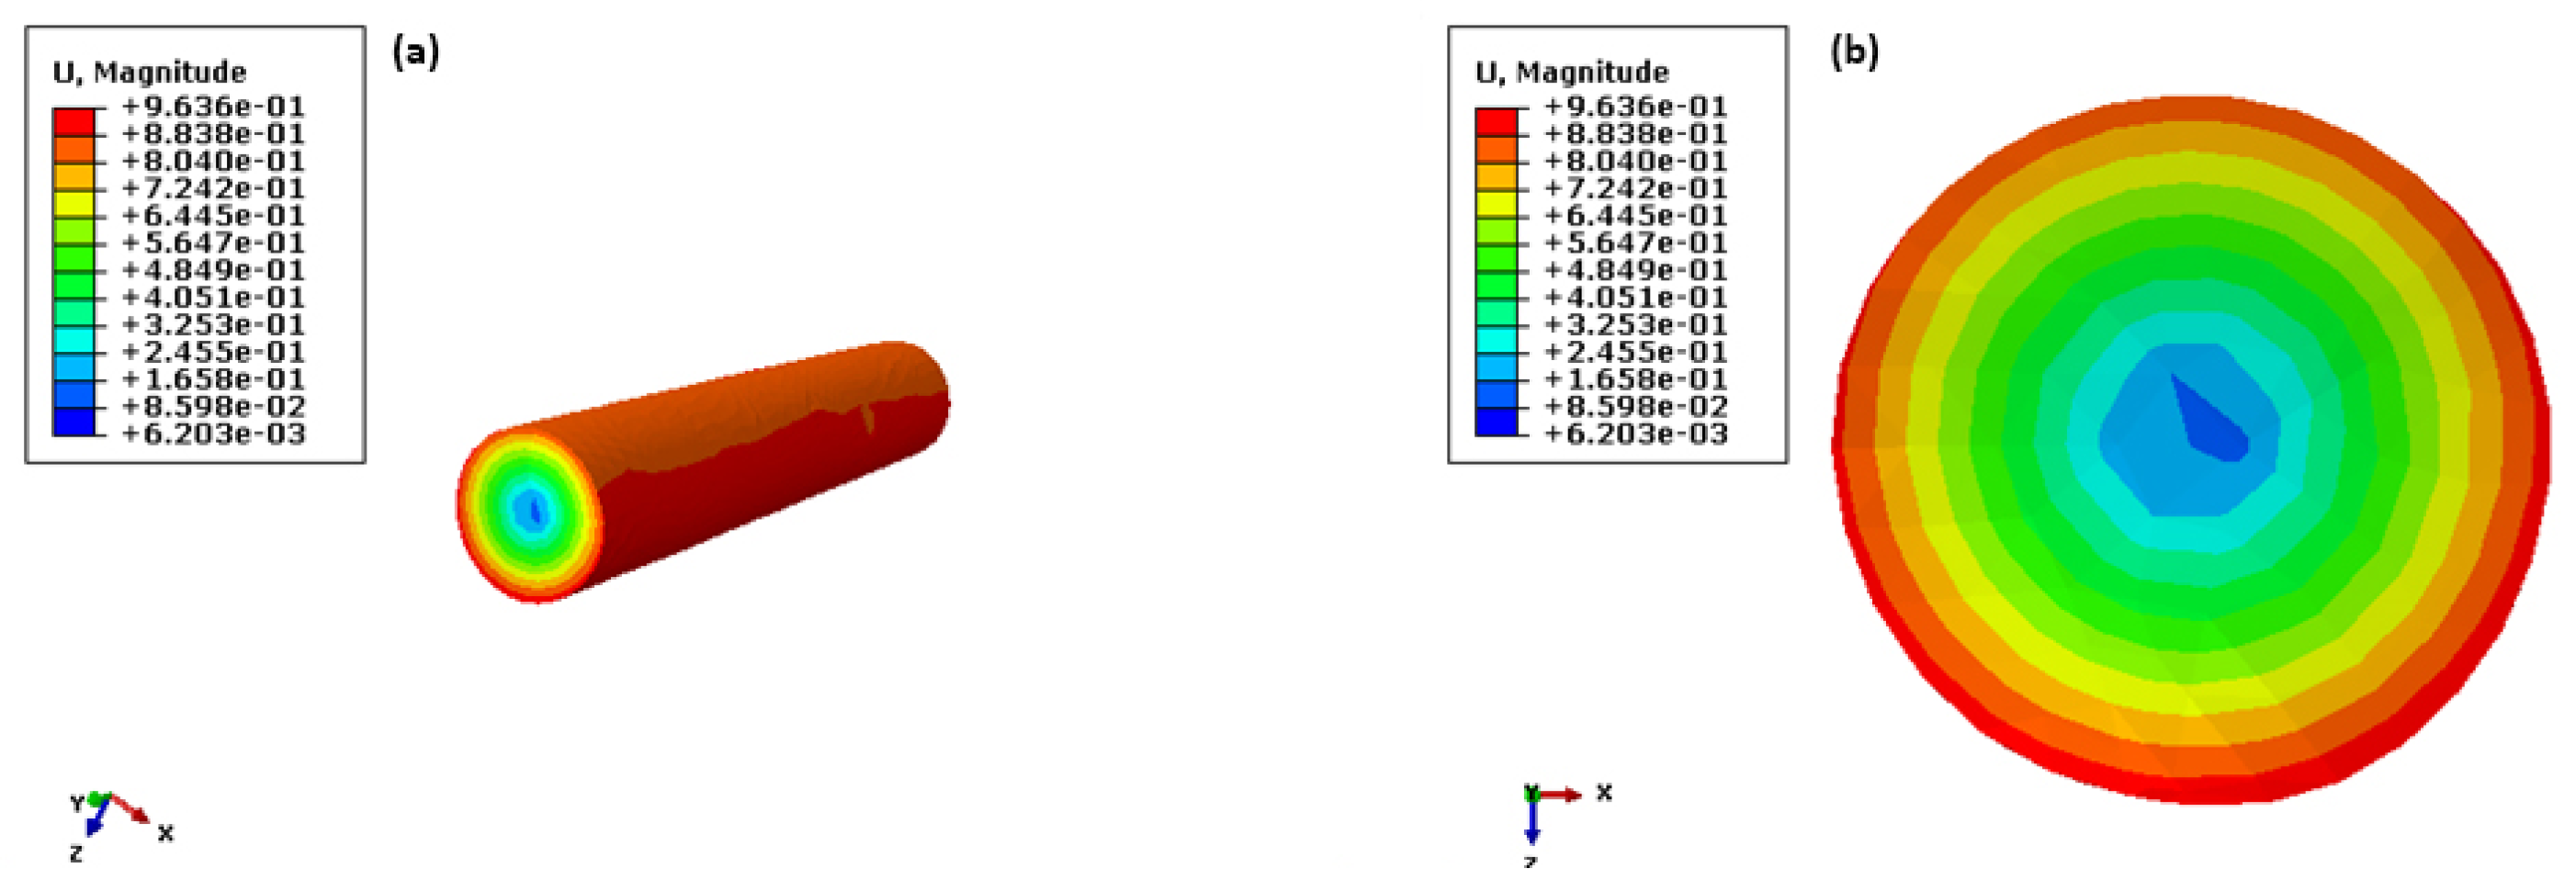
Figure 4 shows the distribution of the total displacement field of the workpiece during thread rolling forming. U, U1, U2, and U3 represent the total displacement, the radial displacement in the X direction, the axial displacement in the Y direction, and the radial displacement in the Z direction, respectively. Figure 4a is an intuitive view of the workpiece, and Figure 4b is a radial sectional view. It can be seen from the total displacement field that the displacement at the axis center is smaller. When approaching the surface, the displacement value will increase.
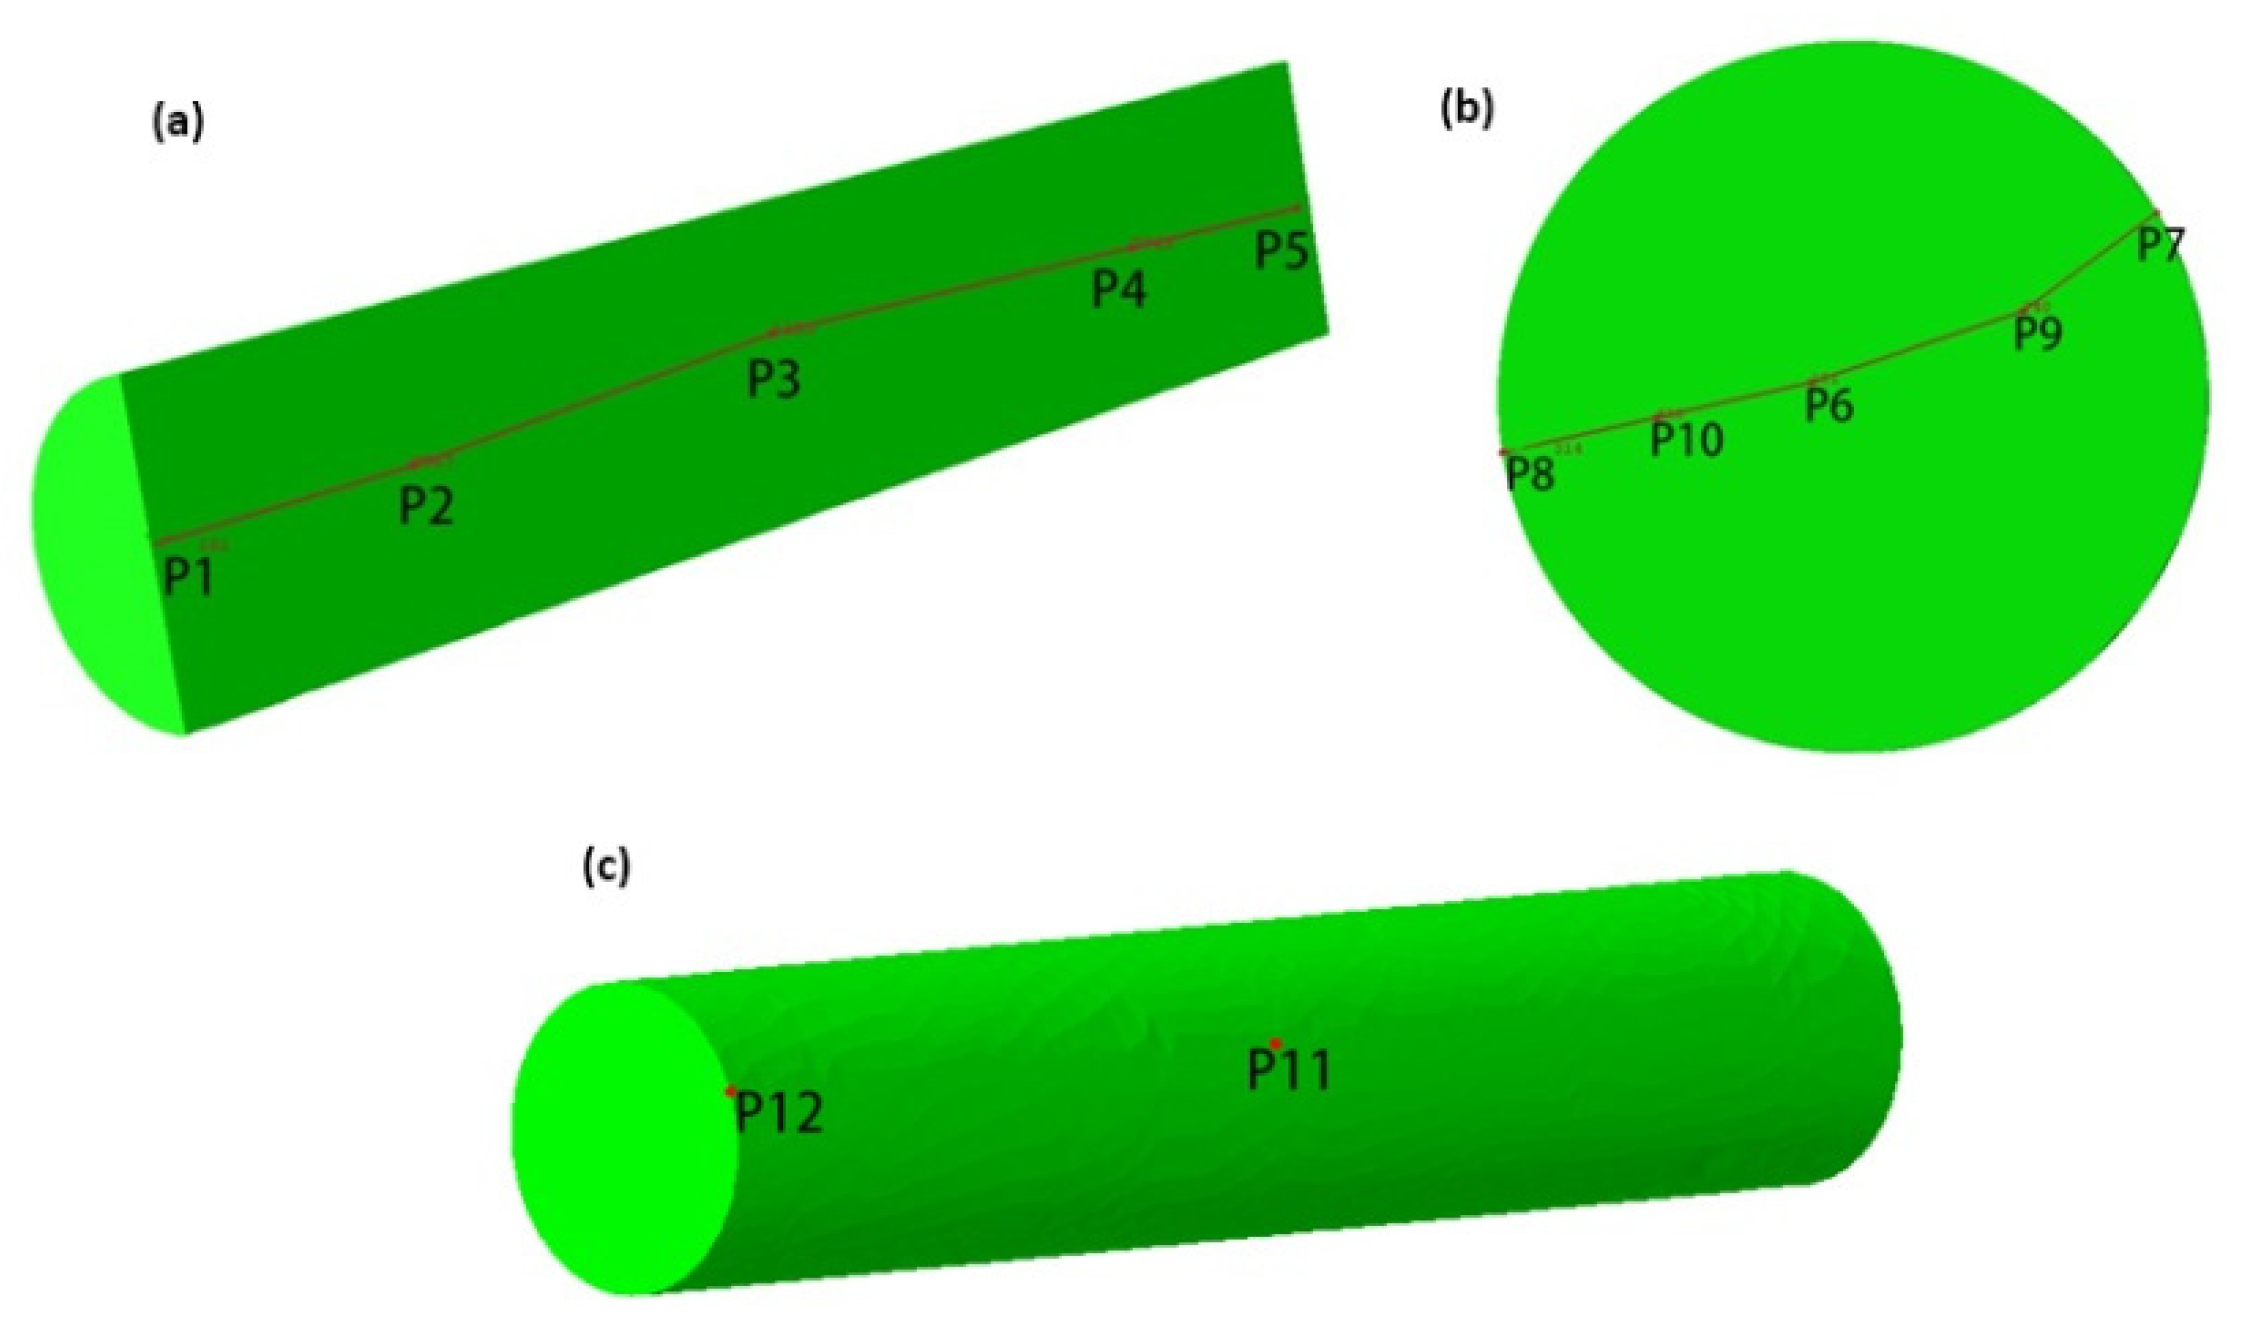
In order to further explain the fluidity of metal materials on thread rolling forming, five characteristic points on the axial section of the workpiece are selected as path outputs for research, and the corresponding points are marked as P1, P2, P3, P4, and P5. At the radial section of the workpiece end, five characteristic points are also selected as the research object, and the corresponding marks are P6, P7, P8, P9, and P10. Two characteristic points are selected on the outer surface of the workpiece, which are located in the middle and the end respectively, and marked as P11 and P12. The distribution of characteristic points is given in Figure 5.
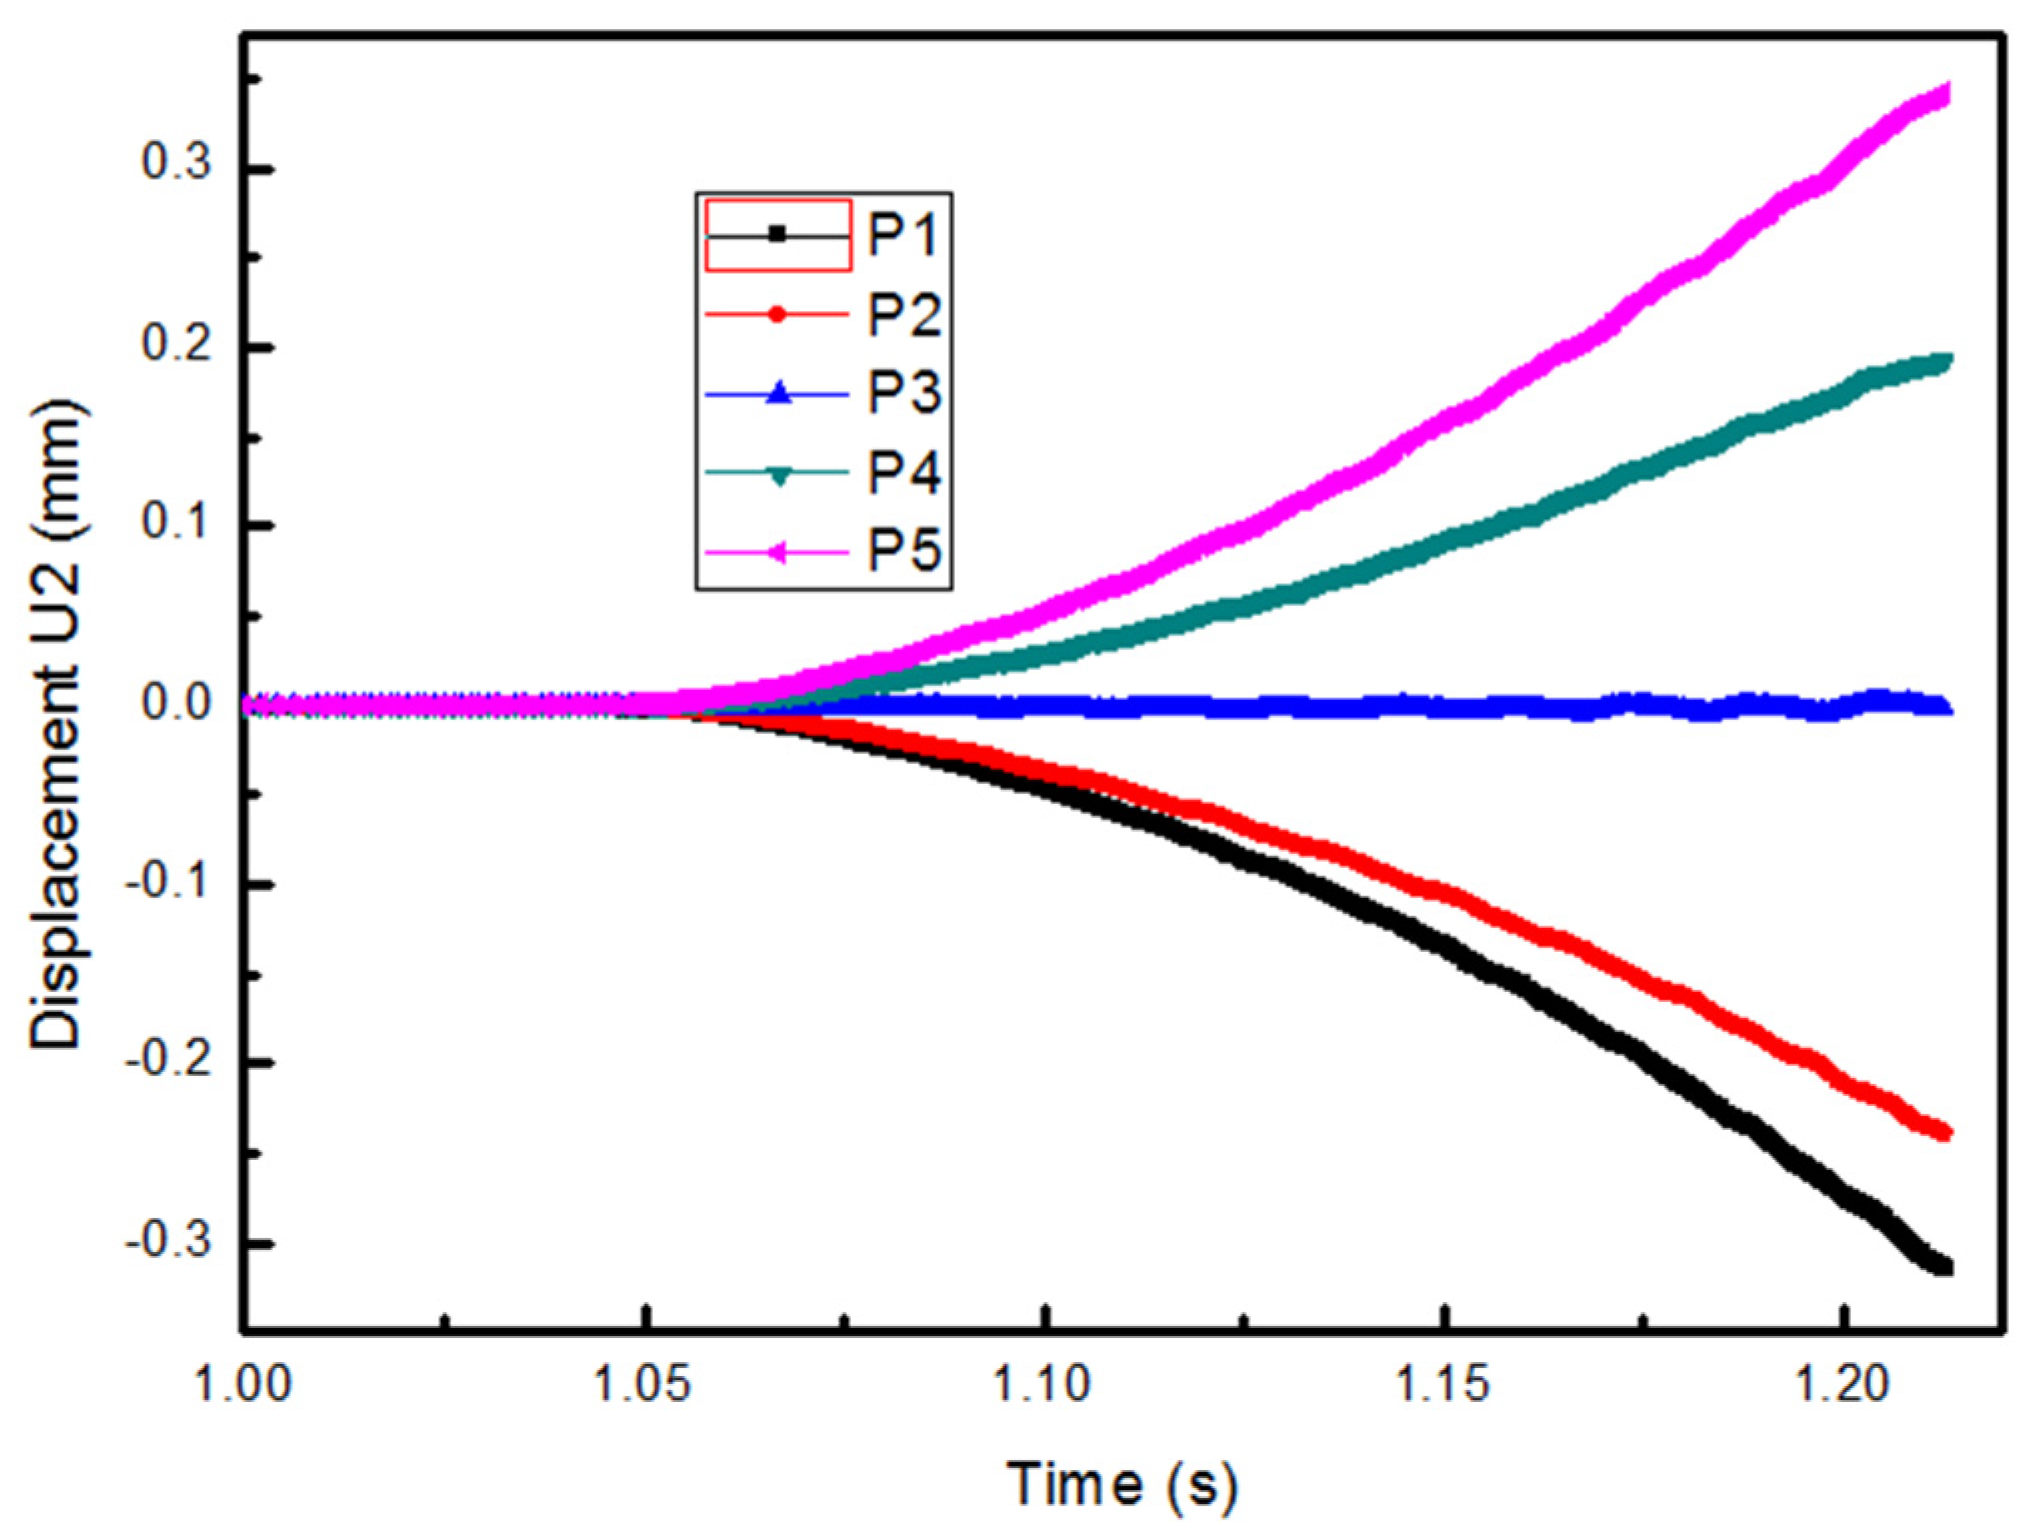
Figure 6 shows the axial displacement-time curve of the characteristic points. The displacement value in the middle is always near zero during the deformation process. When approaching the end of the workpiece, the displacement changes become more and more obvious. A trend of symmetrical extension on both sides is shown. At the end of the thread rolling deformation, the axial displacement value reaches the maximum, with a value of about 0.35.
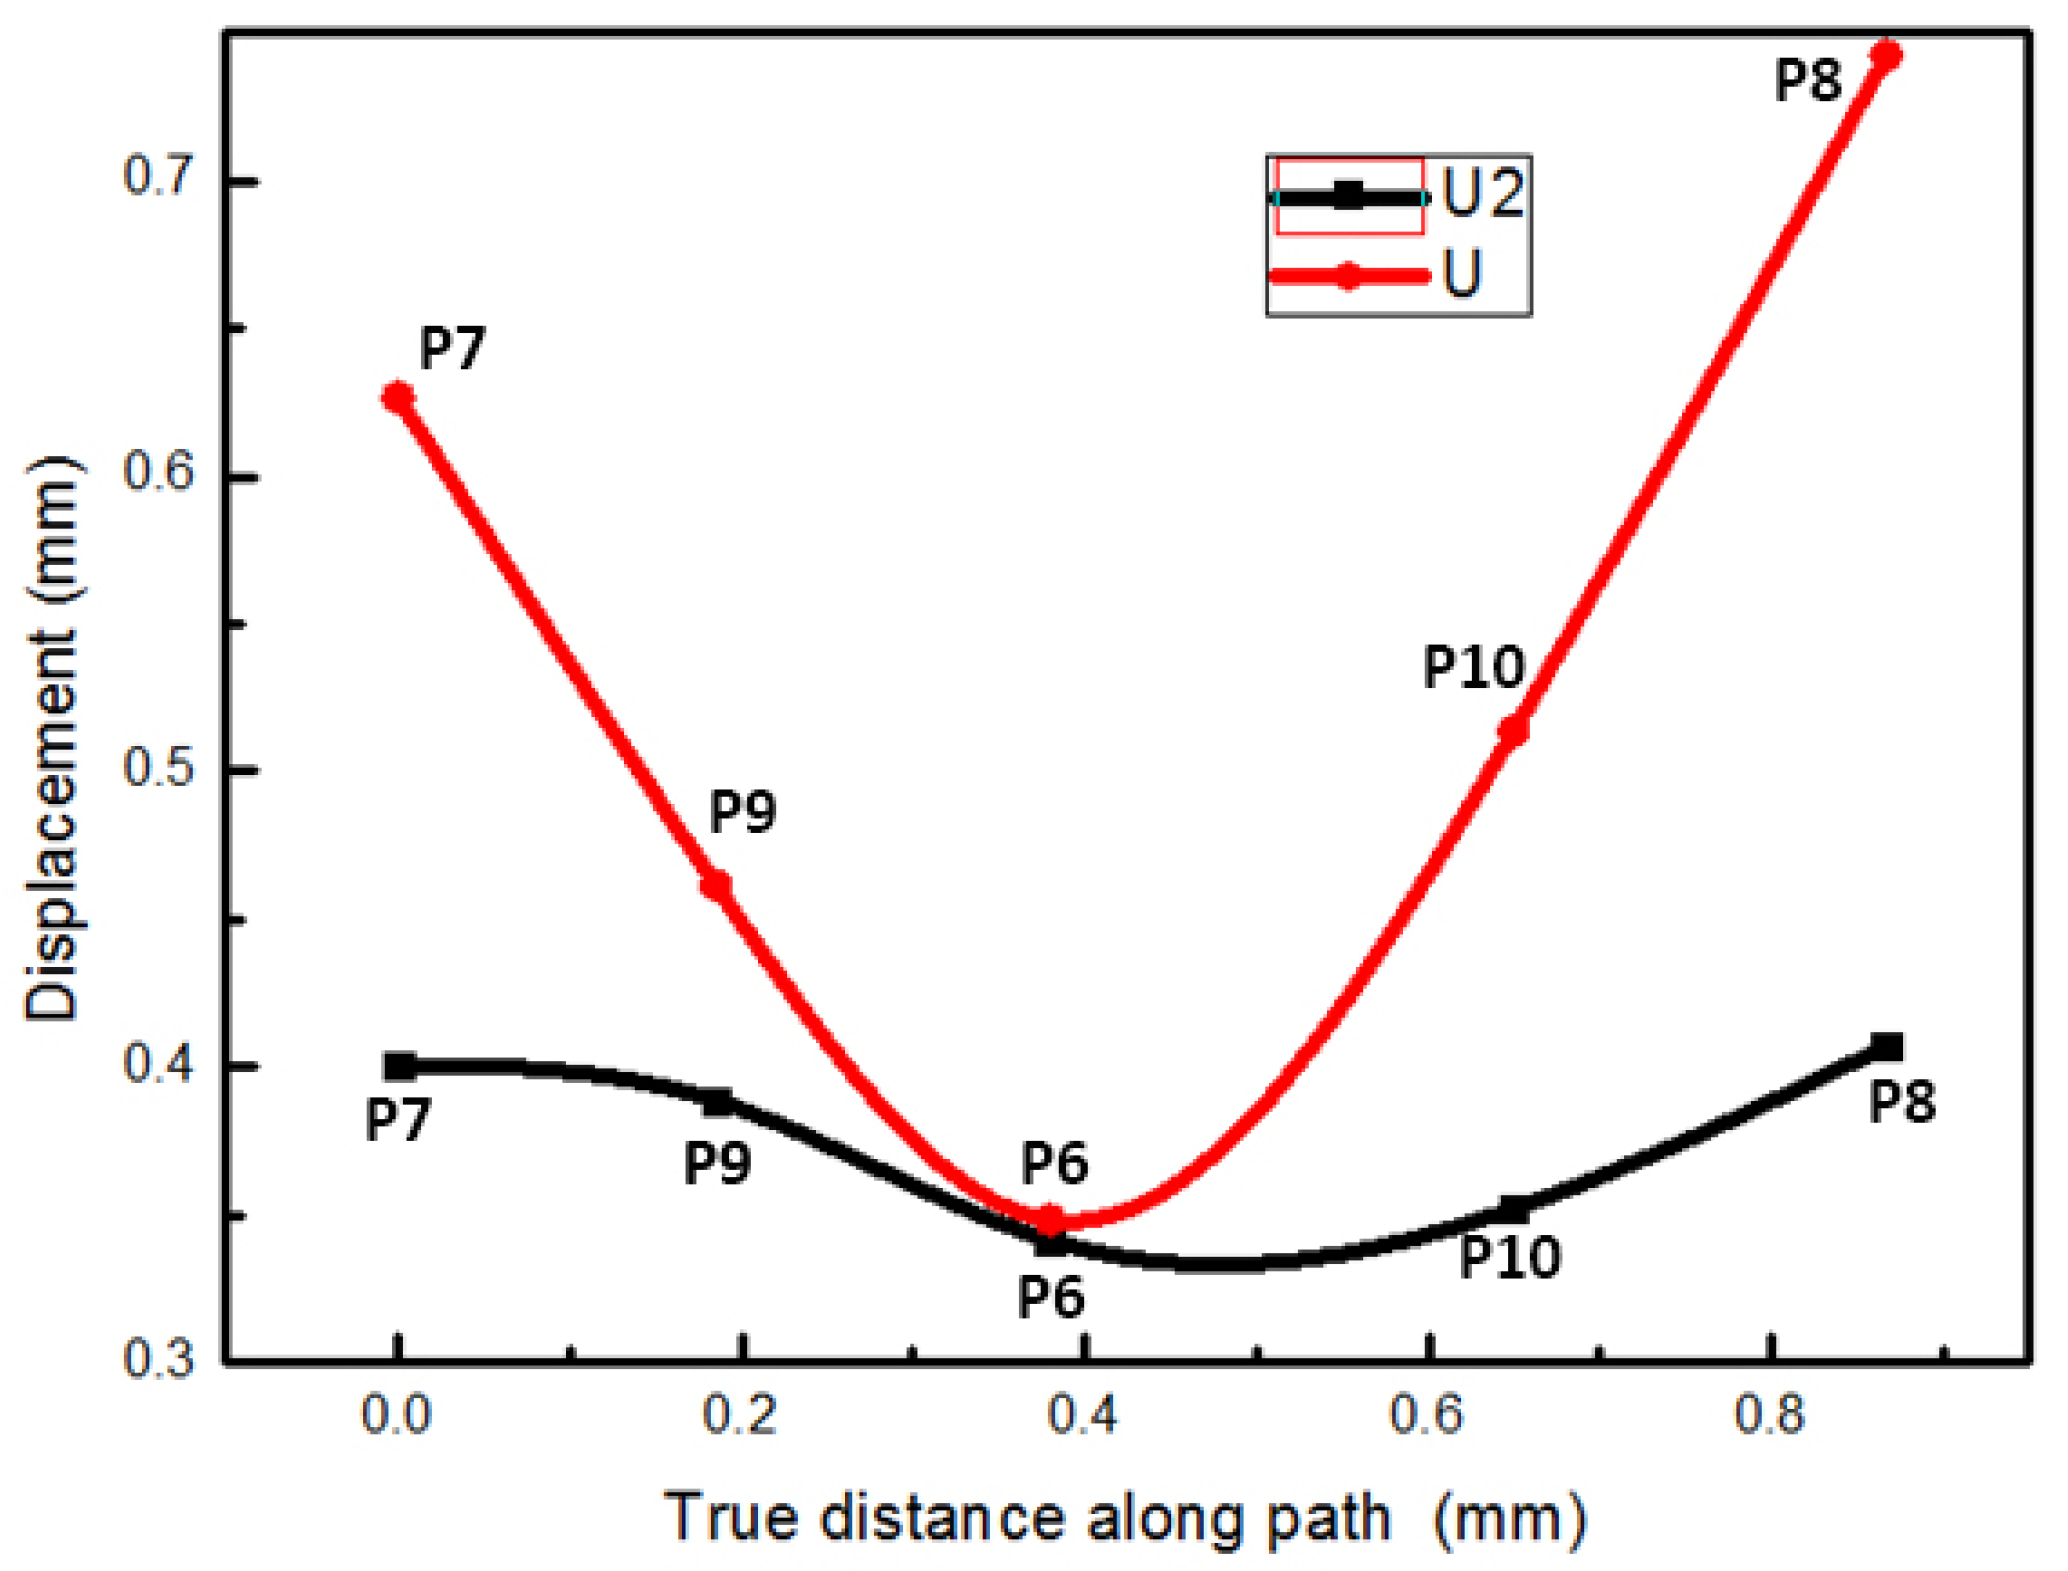
Figure 7 shows the axial displacement-true path curve of the characteristic point on the radial section during the deformation process. It can be seen that the axial displacement and the total displacement gradually increase from the inside to the outside. The displacement at the axial center is the smallest, and the displacement at the outside is the largest. The axial extension of the outer characteristic point is about 0.05 mm more than the axial extension at the center, and a certain depth of cavity is formed. This is because the outside of the workpiece end is directly affected by the die to produce axial elongation. The axial center is driven by the additional tensile stress generated by the axial elongation of the outside region, and the additional tensile stress gradually weakens from the outside to the center. Similarly, from the curve of the total displacement, it can be seen that the change in the displacement at the axial center is the smallest, and the fluidity of the outer metal is larger than that of the inner metal. So a concave core phenomenon is formed at the workpiece end.
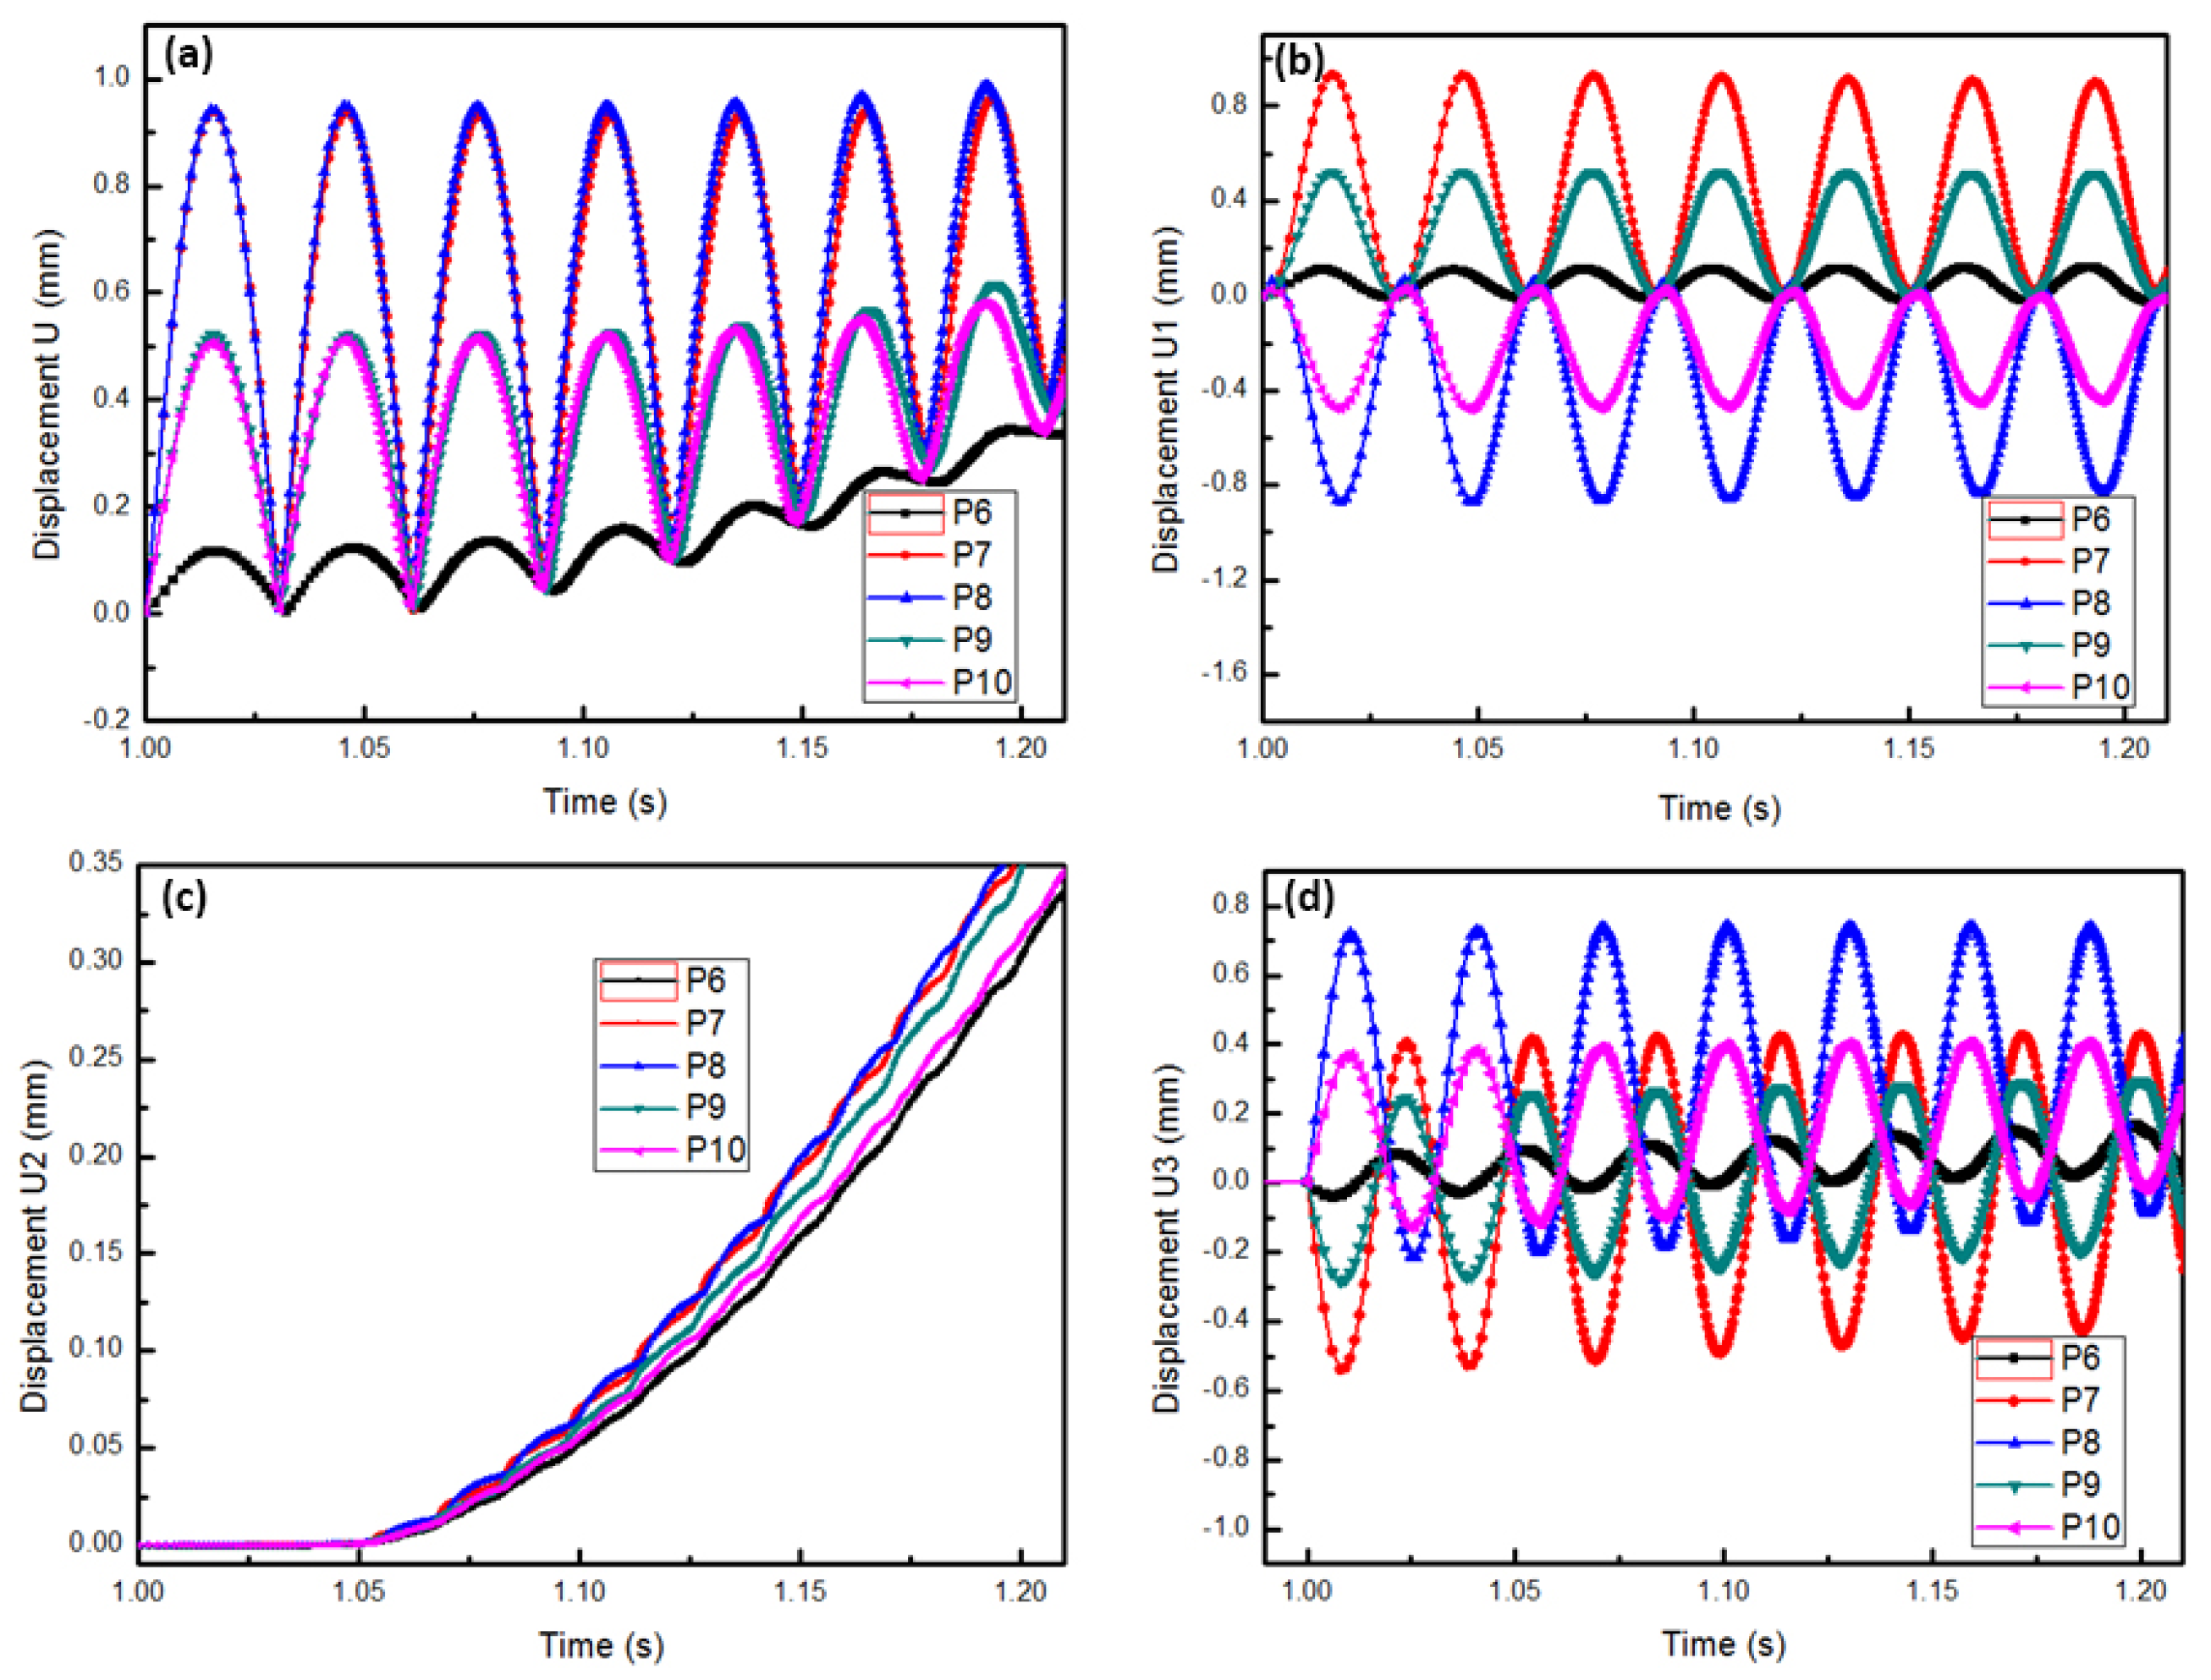
Figure 8 shows the characteristic point displacement-time curve of the radial section. Although the workpiece is elongated in the axial direction, it can be seen that except for the characteristic point P6 at the axial center in Figure 8a, the total displacement curves of the other characteristic points are distributed periodically. The closer the characteristic point is to the outside, the greater the fluctuation range. This shows that the change of the axial displacement of the outer point only accounts for a relatively small part, and the radial displacement is dominant. The radial displacement of points close to the axial center does not change much, so the deformation trend retains the characteristics of the axial displacement change, and the value slowly increases. At the end of each cycle, the displacement values of all the characteristic points almost coincide. This is because the radial displacement of all characteristic points is smaller at this time, and the total displacement value is completely determined by the axial displacement. Figure 8b is the displacement-time curve in the radial direction of the X axis which has an obvious periodic distribution. The magnitude of the amplitude depends on the distance from the axial center position. The amplitude of P7 and P8 on the outside is larger, and the amplitude of P6 at the axial center is the smallest. Figure 8c shows the change in the axial displacement of the characteristic point. At the same moment in time, the axial displacement value of P6 at the axial center is always smaller than the other characteristic points. This fully explains the formation of the concave core in the workpiece end. The displacement change in the radial direction of the Z axis in Figure 8d is basically consistent with the trend in Figure 8b, which is the result of this periodic change due to the rotation of the workpiece.
In order to more intuitively describe the movement of the workpiece in space during the thread rolling process and explain the flow characteristics of the metal, the spatial movement trajectory graph of the characteristic points was studied. Figure 9 shows the spatial motion trajectories of P11 and P12. It can be seen that the trajectory graph of the characteristic points is distributed in a circle, which is caused by the rotation of the workpiece itself. The displacement value of the characteristic point in the Y direction increases with time. The spatial motion trajectories are distributed in the circle of the two-dimensional plane formed by the X and Z axes. The maximum axial displacement of P12 is around 0.4 mm, which is uniformly distributed in a circle. The maximum axial displacement of P11 at the middle is only 0.015 mm. The common point in Figure 9a,b is that the radius of the circle in the two-dimensional plane formed by the X and Z axes decreases as the axial displacement increases. Above, the important characteristics of the thread rolling forming process are further explained from three-dimensional space.

4.2. Stress–Strain Analysis

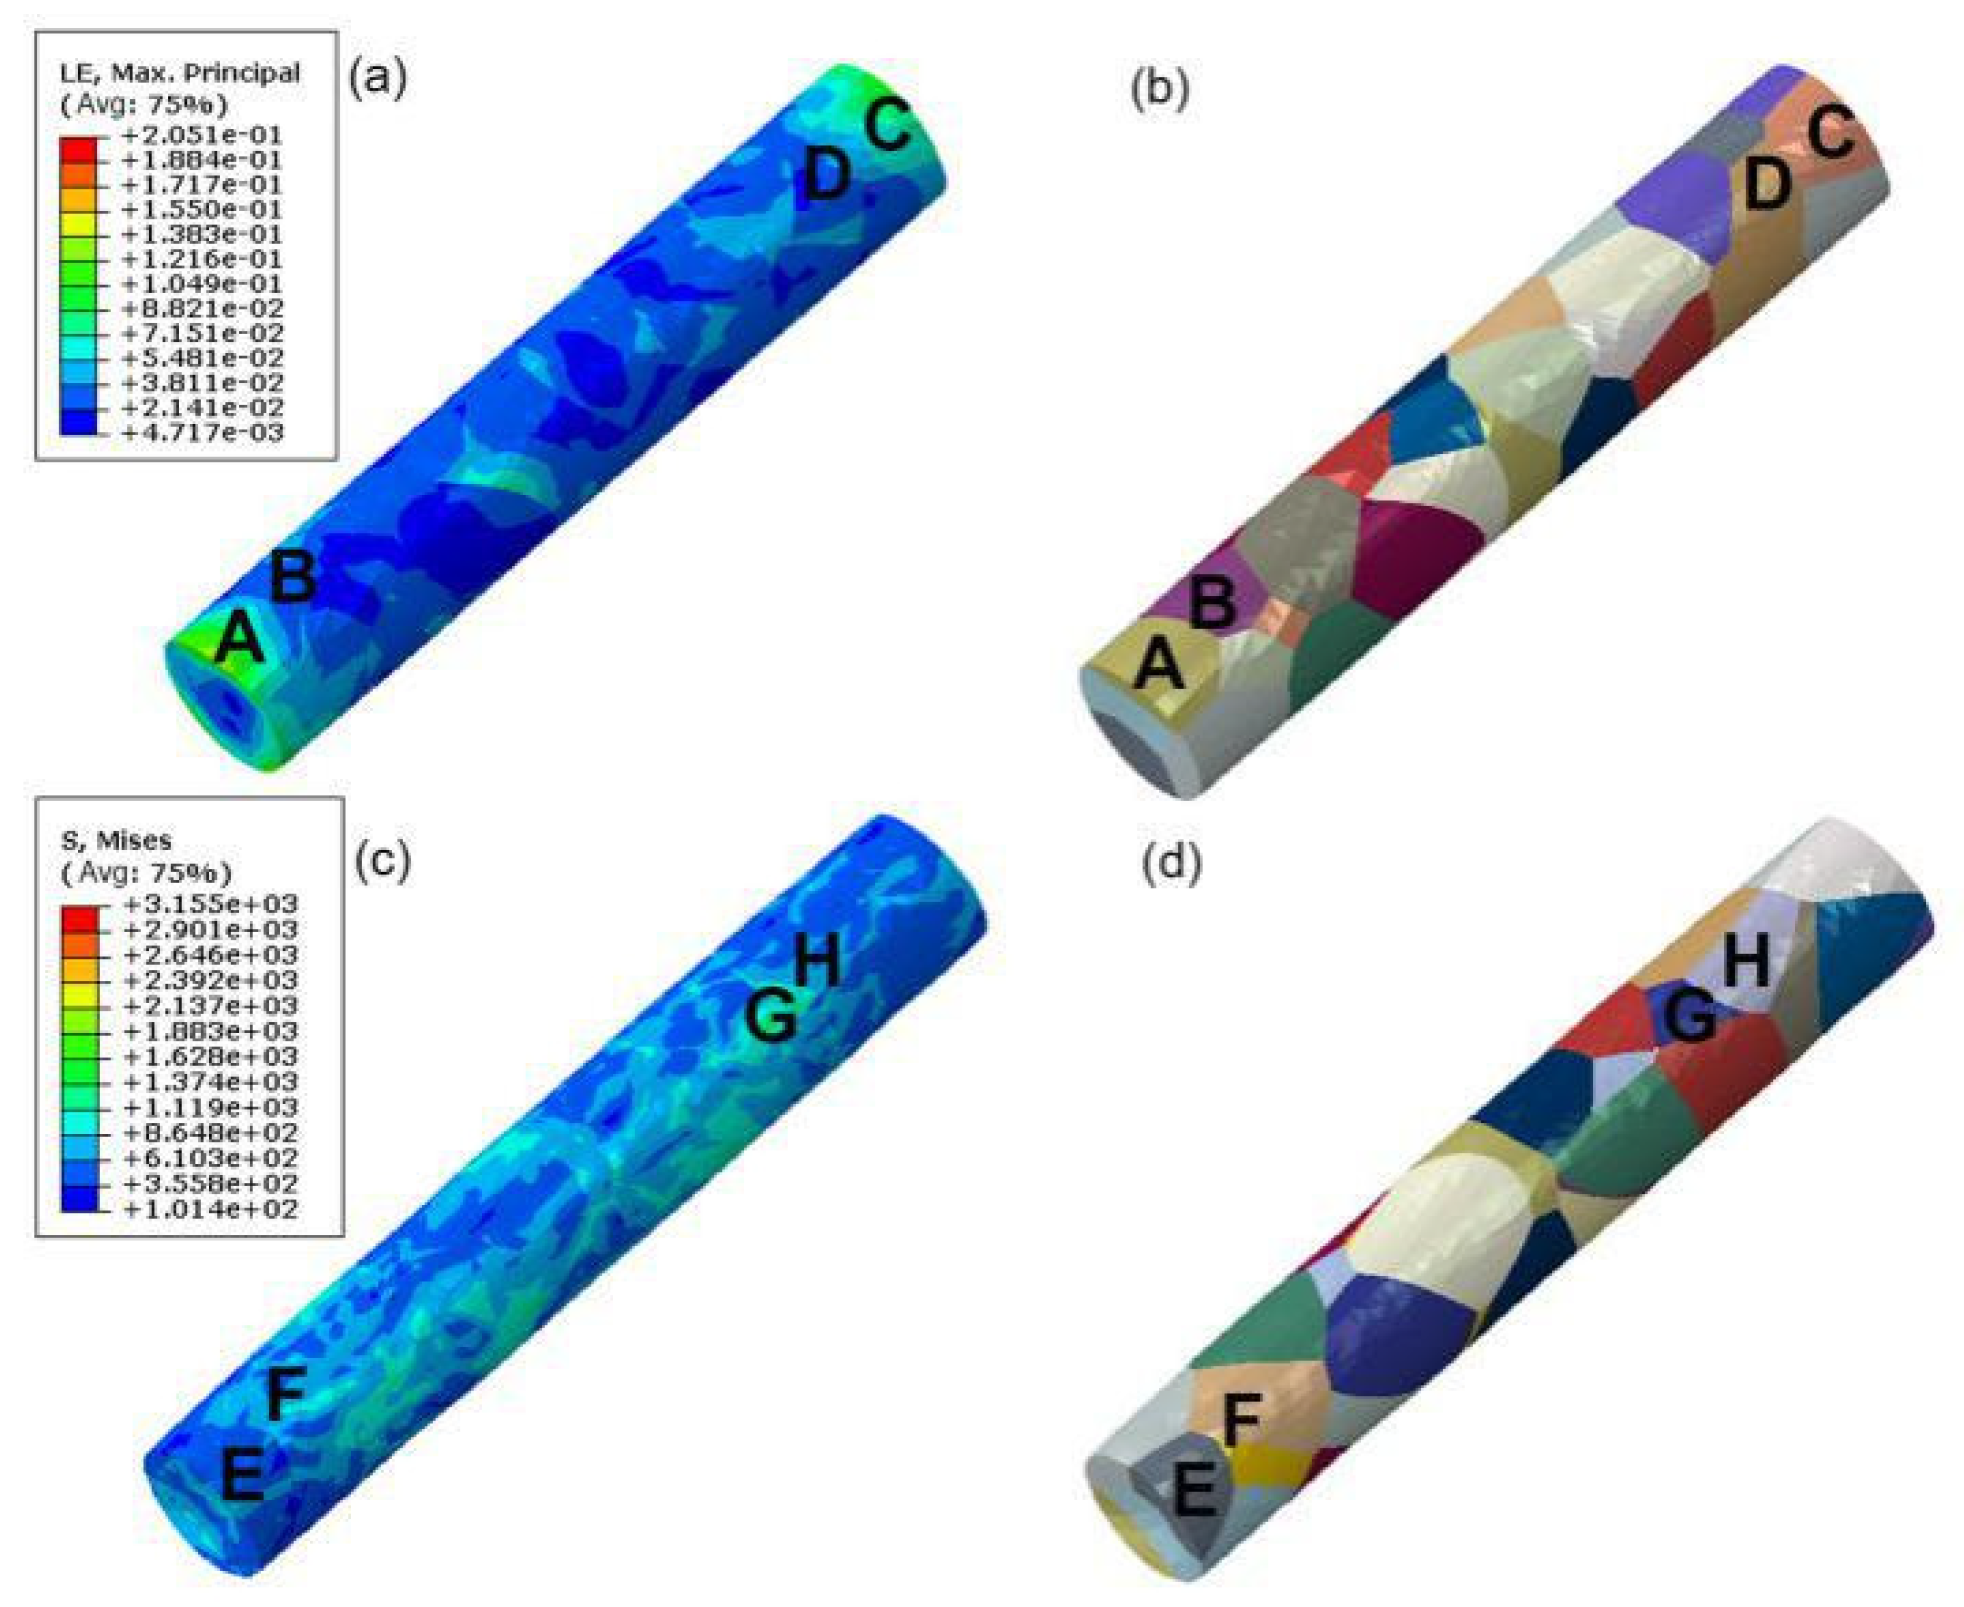
An important advantage of CPFEM is that the deformation behavior inside the crystal can clearly be analyzed on the micro-scale. It provides a convenient way for us to study material deformation. Figure 10 shows that the distribution of stress and strain is inhomogeneous. The deformation situation is also completely different because of the different grain orientations. In addition, the deformation among the grains is coordinated, which is affected by the adjacent grains. From the comparison of Figure 10a,b, there is a clear strain gradient phenomenon. The strain of the A,C grains on both sides and the B,D grains next to them have obvious gradients. The difference among them is even one magnitude. The reason for this phenomenon may be that the orientation of A and C is in a favorable position to slip, and the strain value is relatively large. The same conclusion can be drawn by comparing Figure 10c,d. The stress between E and F, G and H also differs greatly due to the difference of grain orientation. The stress concentrates on the grains boundaries and then extends to the grains interior. It is clear that the inhomogeneous deformation is directly affected by grain orientation.
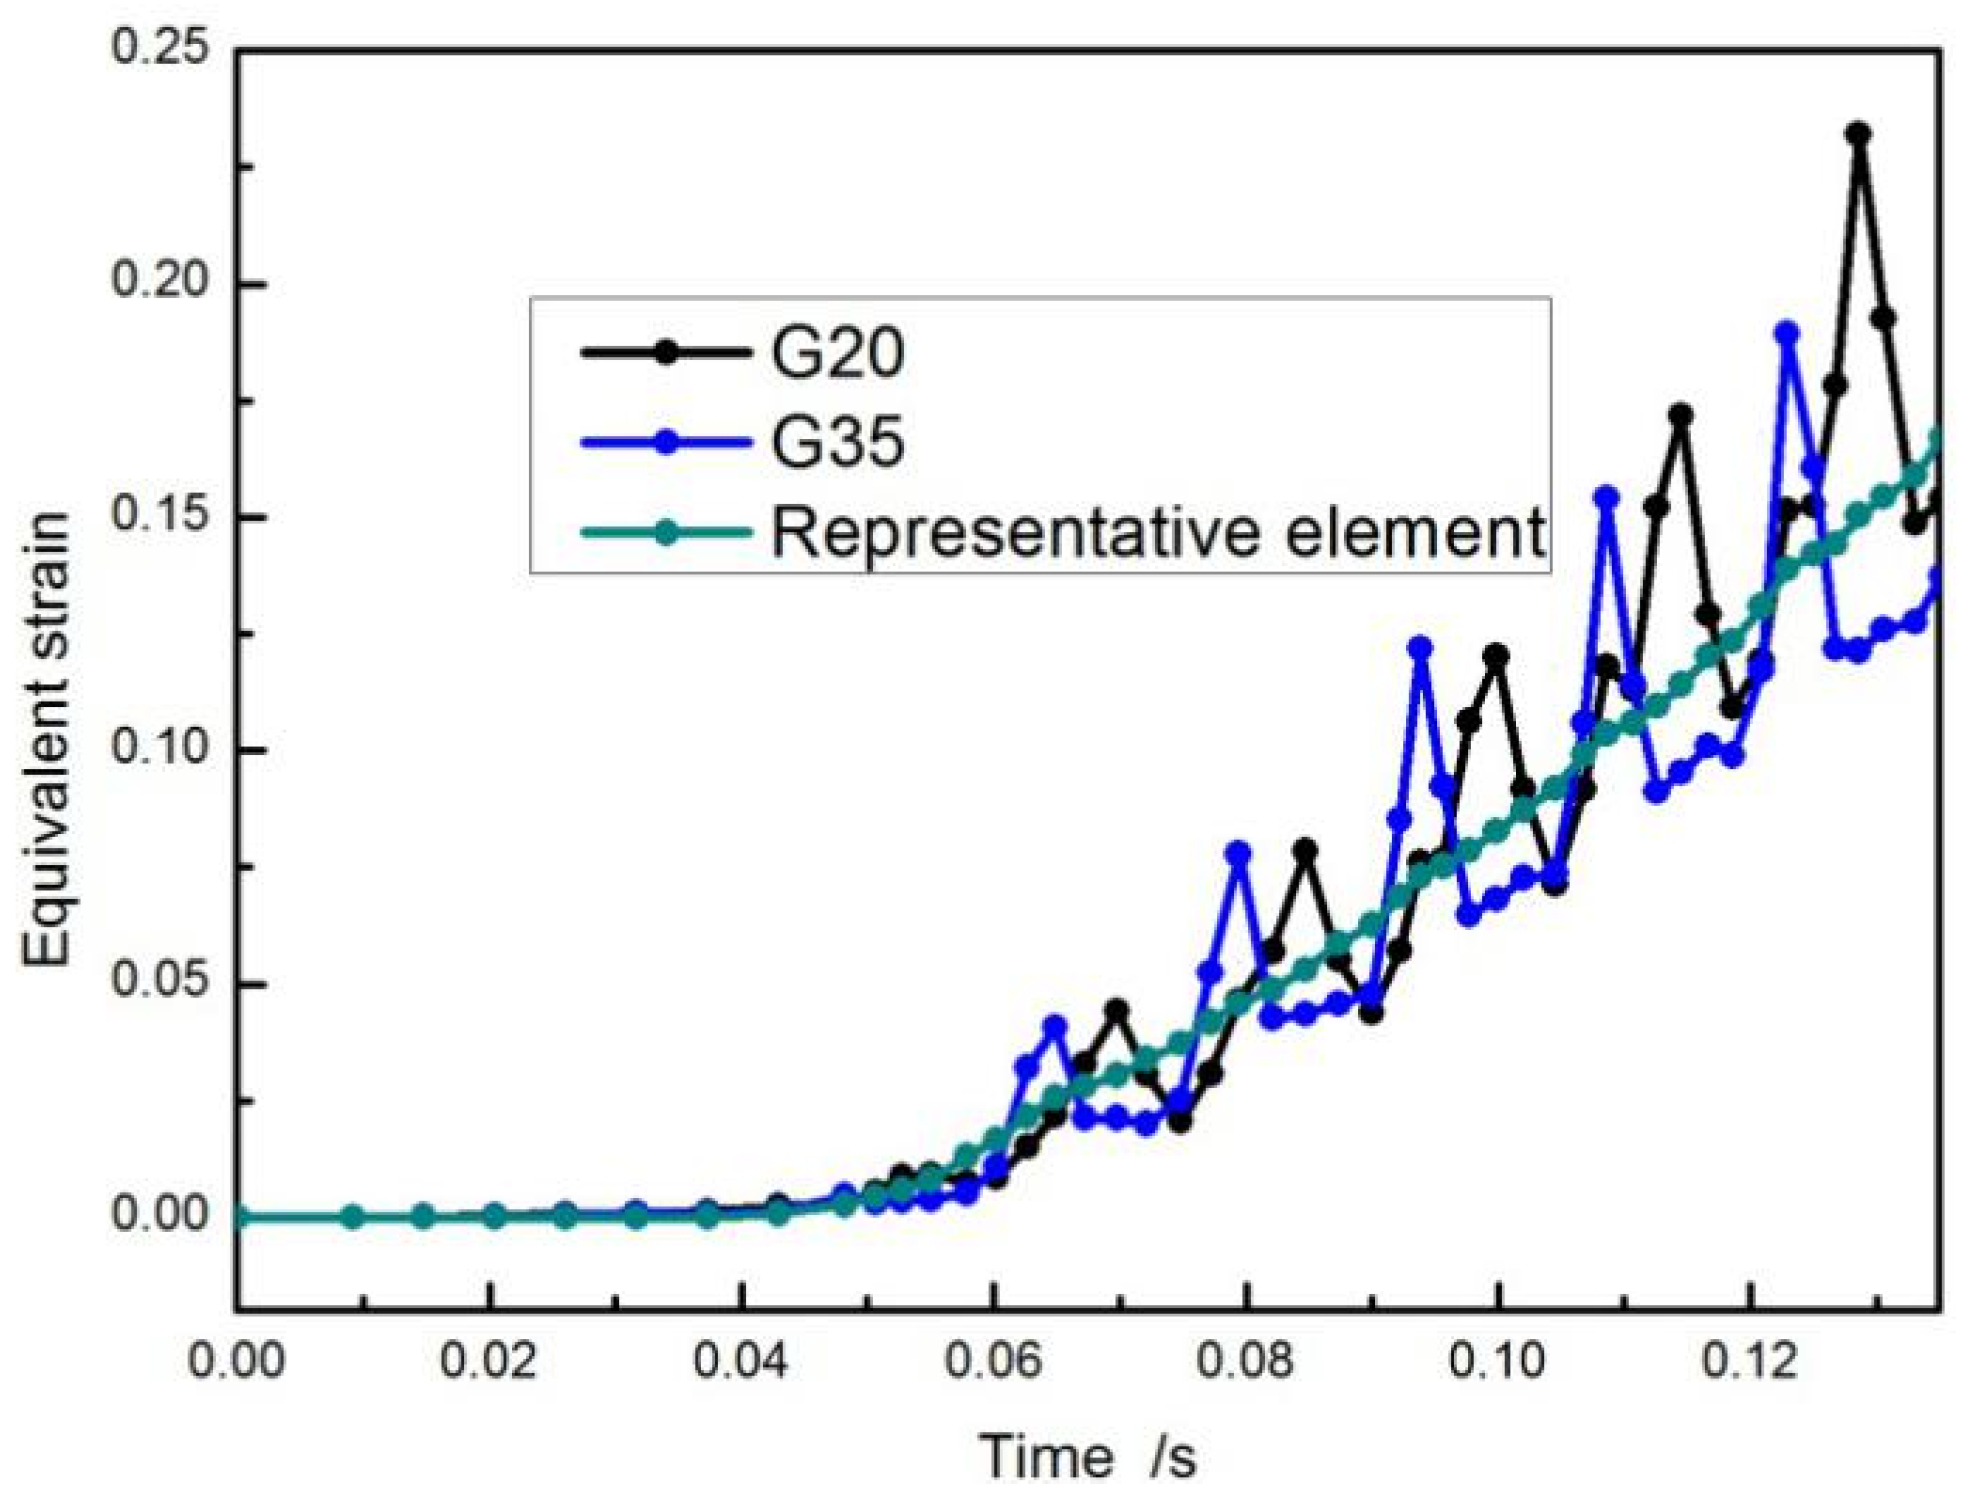
The simulation of thread rolling is more complicated than the uniaxial tension and compression process. As the workpiece rotates, the stress state will change periodically. When polycrystalline materials are formed, there is a big difference in the deformation among the grains. The volume average method is used in the polycrystalline model to obtain the mechanical response of the representative element. This method can more truly reflect the force state of the entire material after homogenization. The three curves in Figure 11 represent the strain changes in the selected grain 20 (G20), G35 and the representative element. This is counted from the beginning of the second analysis step. G20 and G35 are adjacent, but the changes in strain are not synchronized, and there are large fluctuations. It can be seen that there is a big difference in the strain among the grains in the thread rolling deformation. Due to the coordinated deformation among the grains, the strain of the representative element tends to increase steadily after homogenization. It is representative and accurate, and can better reflect the thread rolling deformation behavior of the workpiece.
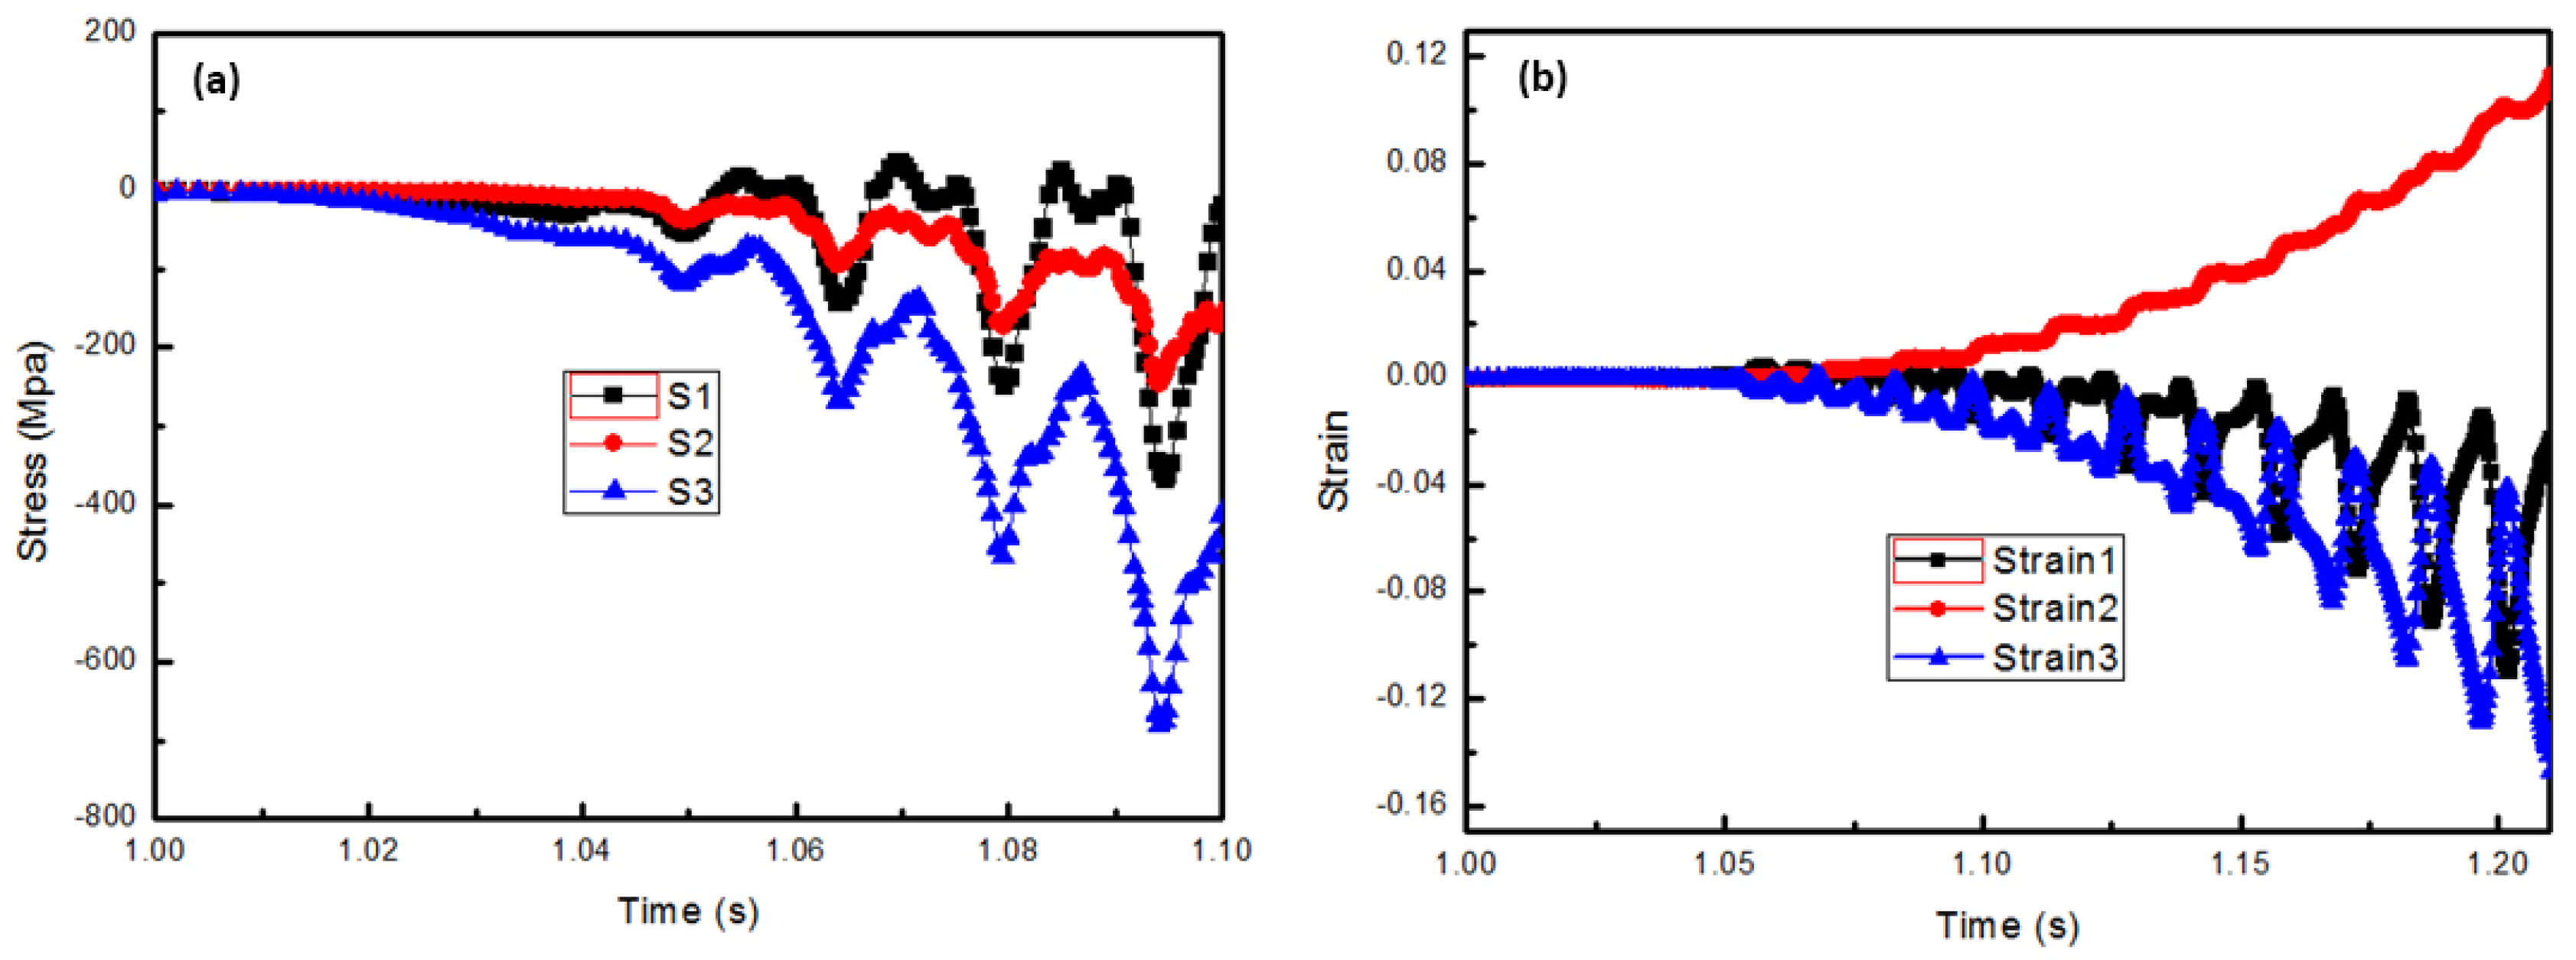
Figure 12a shows the distribution of stress during the thread rolling process. S1, S2, and S3 represent the stress of P5 in the X-axis, Y-axis and Z-axis directions respectively. It can be seen that the fluctuation of the S2 curve is small. Unlike the drawing process, the axial stress during the thread rolling process is small, which also helps to avoid axial necking or even fracture of the workpiece. The curves of S1 and S3 have large fluctuation, indicating that the radial stress on the forming process is dominant. Figure 12b shows the strain–time curve of P5. Corresponding to the change of the forming stress, the radial strain of the workpiece also fluctuates up and down, and gradually increases. The strain fluctuation in the axial direction is small, but the final strain value is larger. This is because the stress in the axial direction is relatively small, and the strain will not change in the positive and negative directions. For the characteristic point P5, the change in axial strain indicates that it always stretches in one direction. This is different from the strain in the radial direction. The strain of the radial direction fluctuates violently while the workpiece is rotating. As the deformation continues, the strain values in all directions increase.

4.3. Evolution of the Slip Systems

Pure aluminum belongs to a face-centered cubic (FCC) structure, and there are 12 slip systems during plastic deformation. The slip system is shown in Table 2.
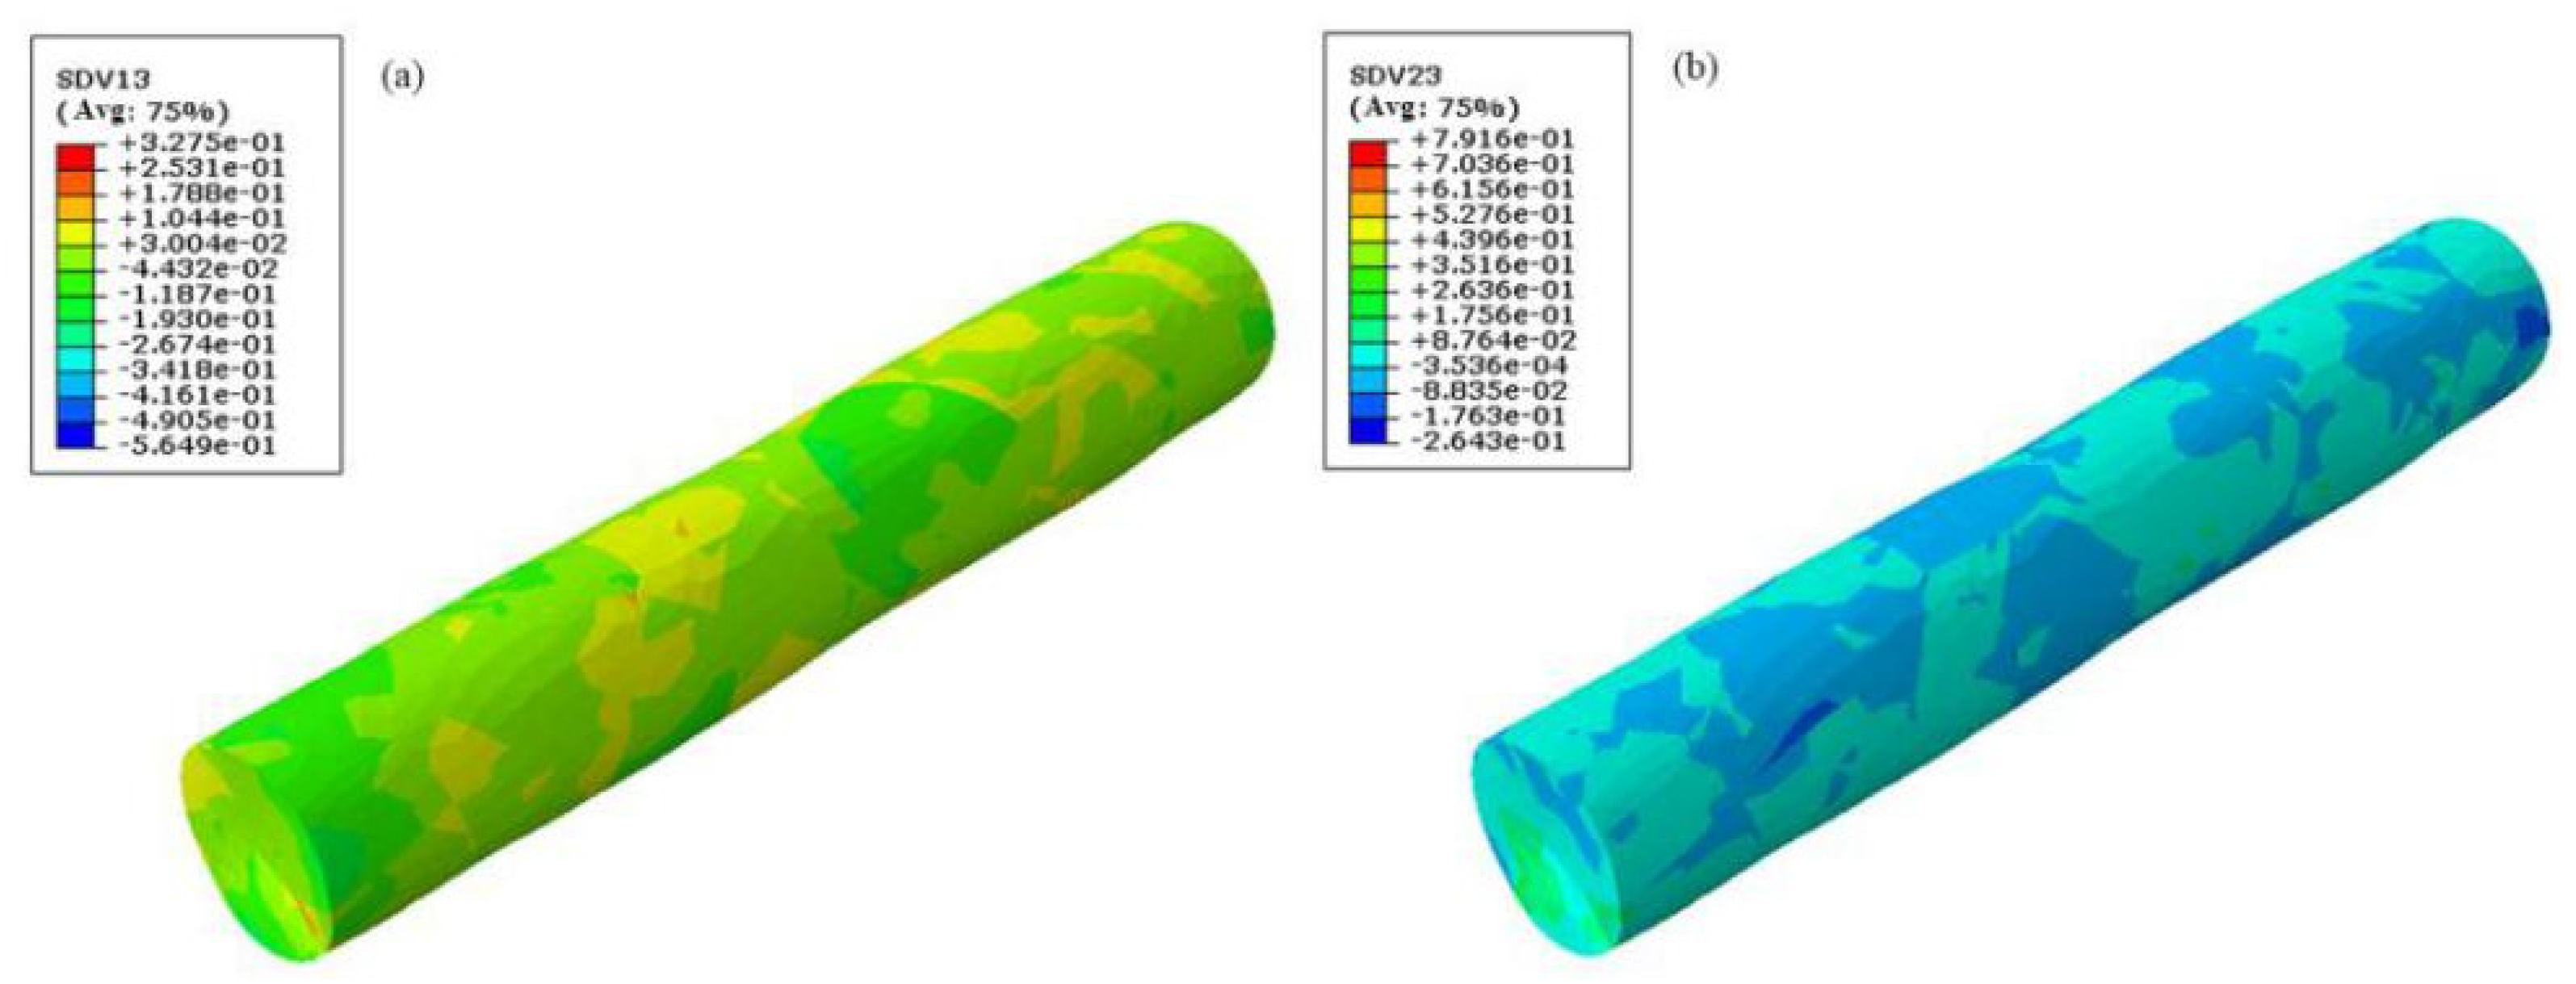
As shown in Figure 13, it is clear that there is a significant difference in the shear strain distribution of each slip system. SDV13 and SDV23 represent the shear strain rates of slip systems a1 and d2, respectively. A positive value indicates movement in the positive direction of slip, and a negative value indicates movement in the opposite direction of the slip system. It can be seen that the shear strain distribution is related to the orientation of the grains in Figure 13a. The shear strain rates among the adjacent grains differ greatly, which indicates that the shear strain rate is different in the different grains. The activation of the slip system is determined by the shear strain rate. The initial orientation of the grains has an important influence on the movement of the slip system. In the same way, the slip system d2 in Figure 13b has the same situation. The different slip systems have different shear strain distributions from comparison of Figure 13a,b.
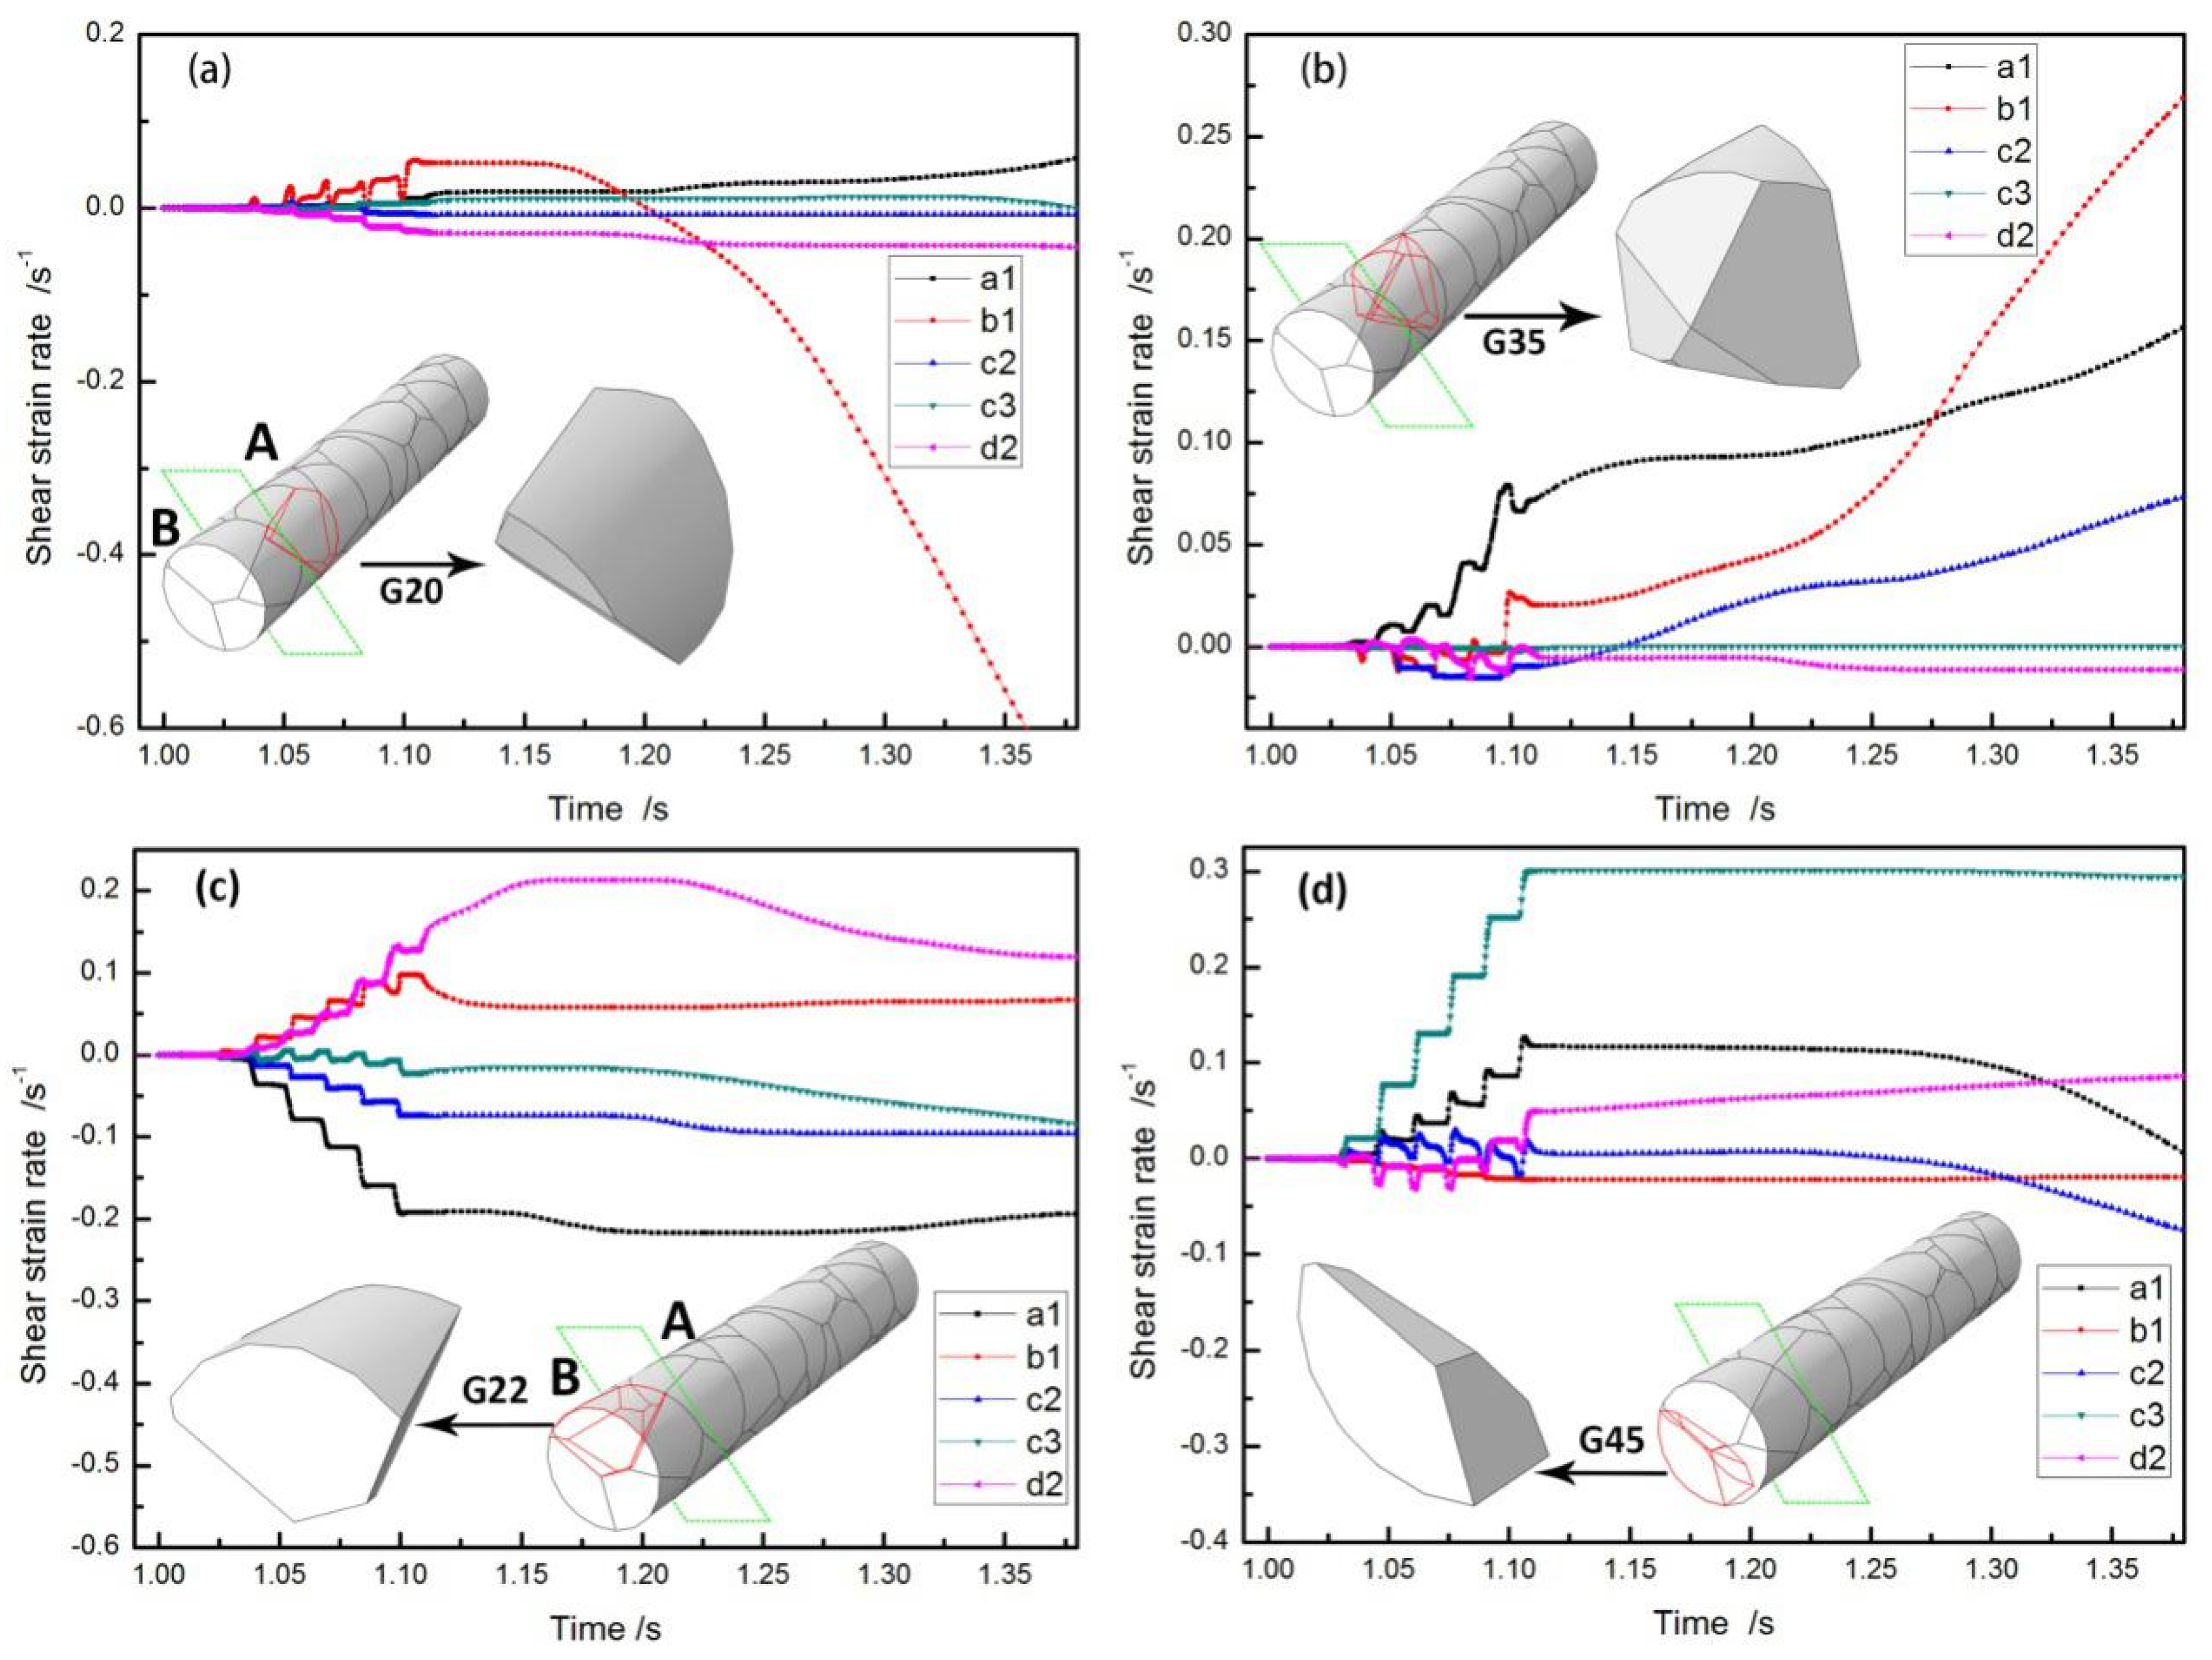
In order to better explain the mechanism of thread rolling, the evolution of the slip system was analyzed in each grain. Figure 14 shows the evolution of the five slip systems in the different grains. Region A is located in the middle of the workpiece, and region B is located at the end of the workpiece. G20 and G35 belong to region A, and G22 and G45 belong to region B. Figure 14a shows that the slip system b1 of G20 begins to move along the [101] direction. The initially activated slip system causes the rotation of the slip plane, as well as the interaction among adjacent grains, which leads to the activation of slip systems a1, c3, and d2. The slip systems a1 and c3 move along the positive directions [0 1 ¯ 1] and [10 1 ¯ ] respectively, and the slip system d2 moves along the opposite direction [ 1 ¯ 0 1 ¯ ]. The shear stain rate of the initially activated slip system b1 is reduced duo to the influence of the later activated slip systems. The slip system c2 has not been activated on the entire thread rolling deformation. Figure 14b shows that the initially activated slip system a1 of G35 moves along the positive direction [0 1 ¯ 1]. The increase rate of the slip system b1 is larger than the other slip systems, while the slip system c3 has not been activated on the entire thread rolling deformation. The difference from area A is that all the five slip systems are activated in the G22 and G45 of region B. There is no slip system that is not activated. This is because the grains at the end of the workpiece need less resistance due to coordinated deformation among the grains. It can be concluded that the shear strain rate of the slip system is affected by the position of the grains and the orientation of the grain, and the activation sequence of the slip system leads to inhomogeneous deformation among the grains.

4.4. Pole Figures Analysis

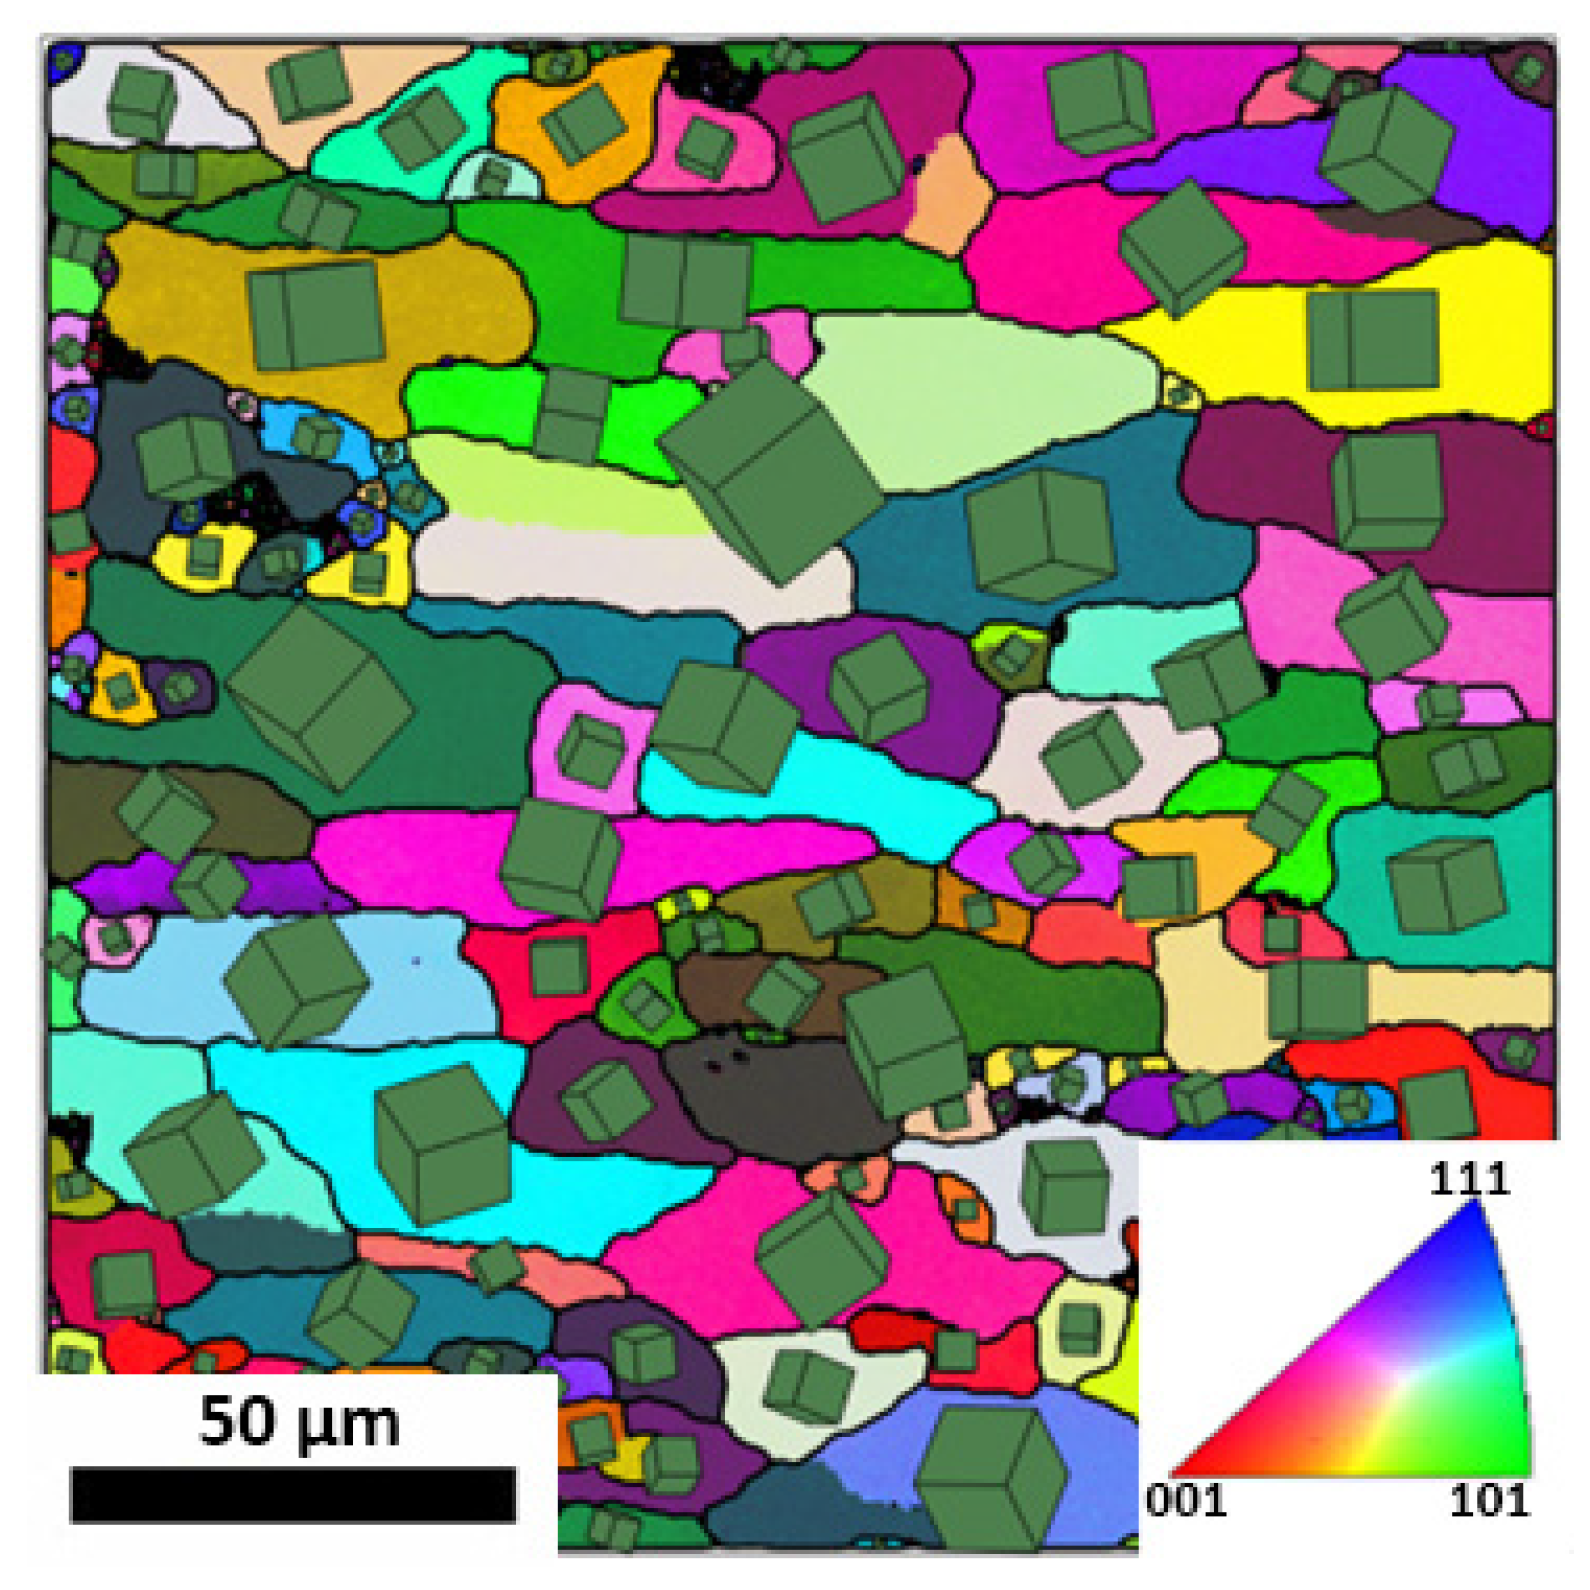
On thread rolling forming, the workpiece is compressed in the radial direction and elongated in the axial direction. Figure 15 shows the grain morphology and orientation distribution under this molding condition. The distribution of the small cubes represents the orientation of the corresponding crystal grains. It can be seen that the grains of the workpiece are elongated in the axial direction. The grain orientation distribution shows that the color is relatively uniform, and the direction distribution of each small cube is also relatively random, indicating that the texture will not be too strong.
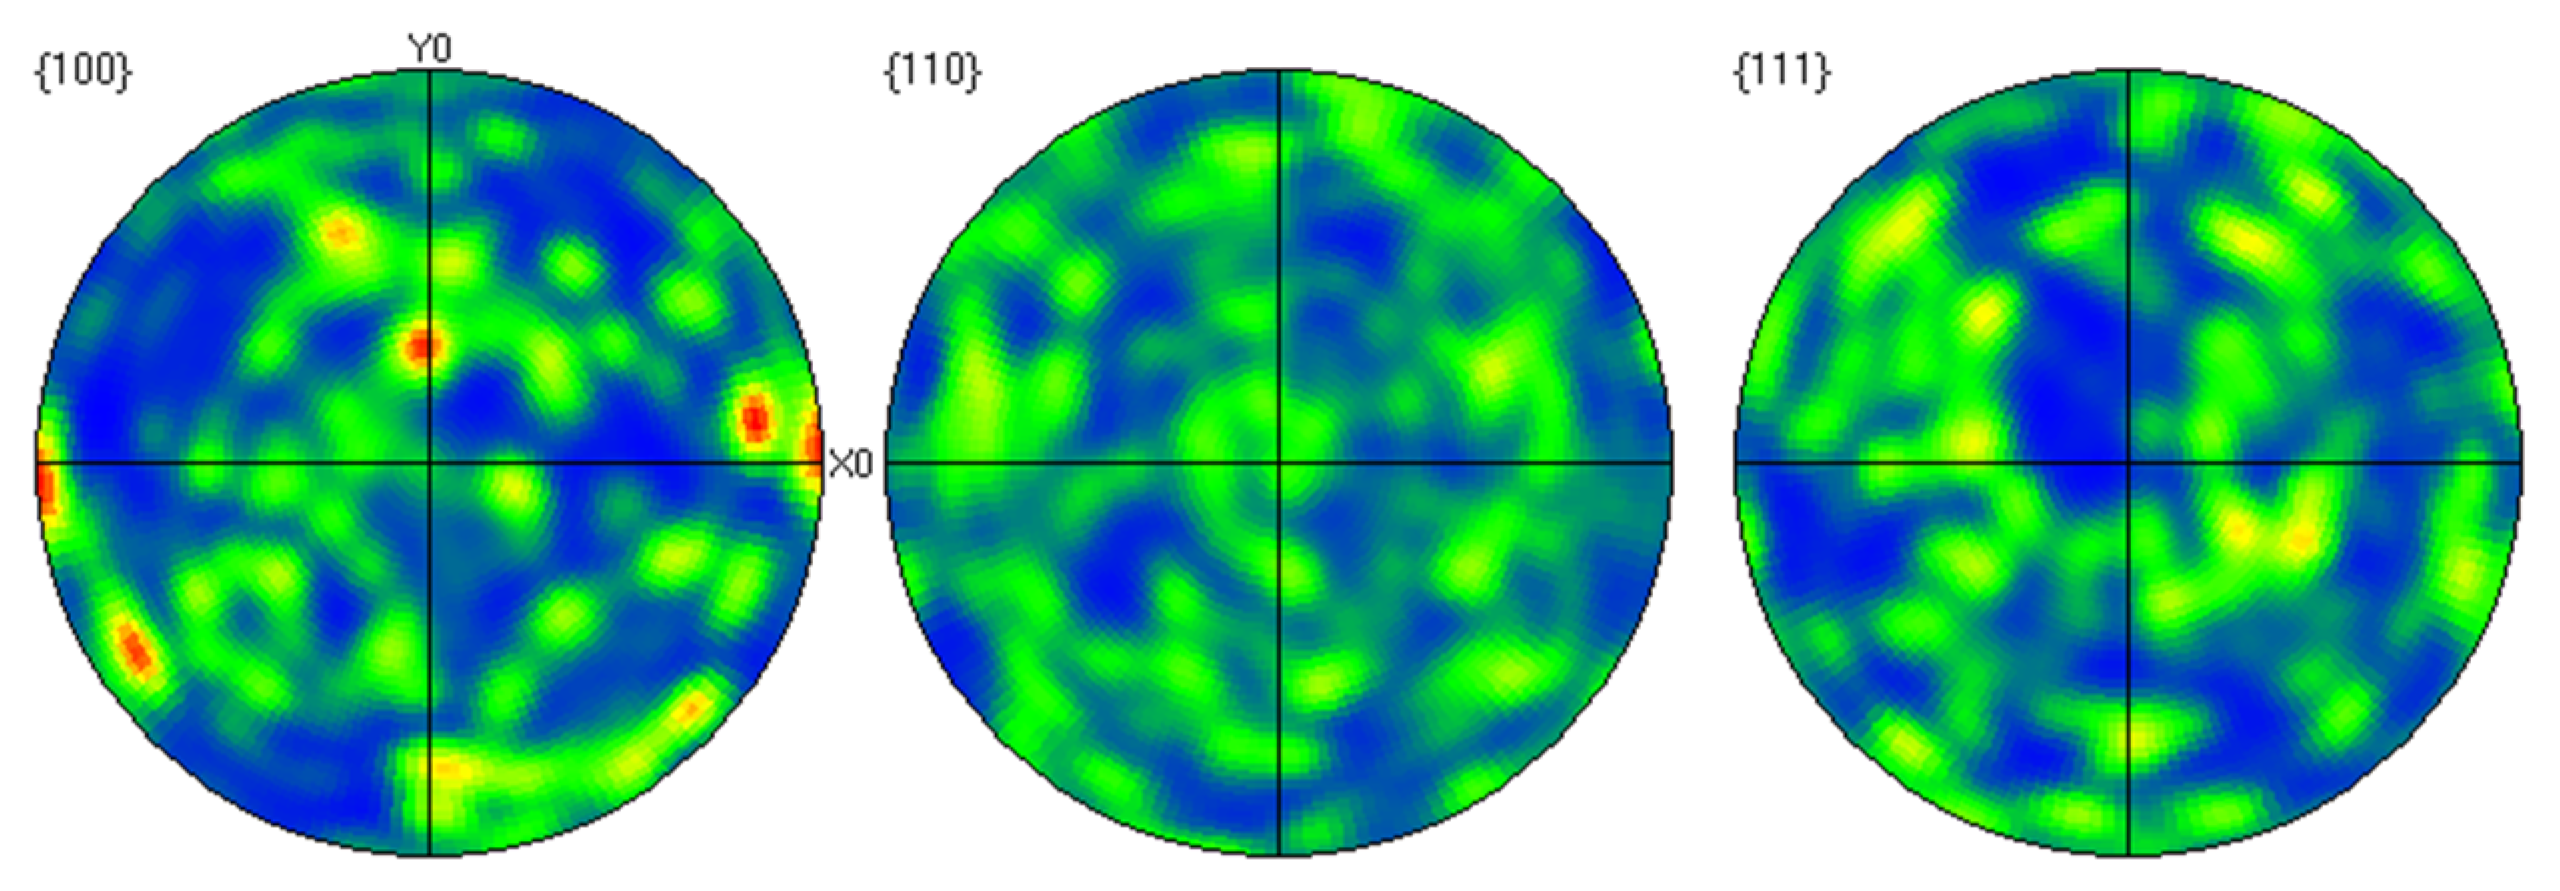
Figure 16 shows the pole figure distribution after thread rolling deformation. Compared with ordinary rolling, only a small area with higher density appear on the (100) plane, and the textures on the (110) and (111) planes do not appear to be obvious. The important aspect is that the stress state of the two rolling methods is very different. On thread rolling, there is no fixed transverse and normal force on the material. The force in the radial direction always changes periodically. The grain rotates with the continuous rotation of the workpiece, and the grain orientation is also changing at all times. The effect of the periodic changes in the radial direction makes the direction of the grains still appear as a random distribution. The workpiece is only elongated in the axial direction, without obvious texture. Thread rolling deformation is more uniform than ordinary rolling.
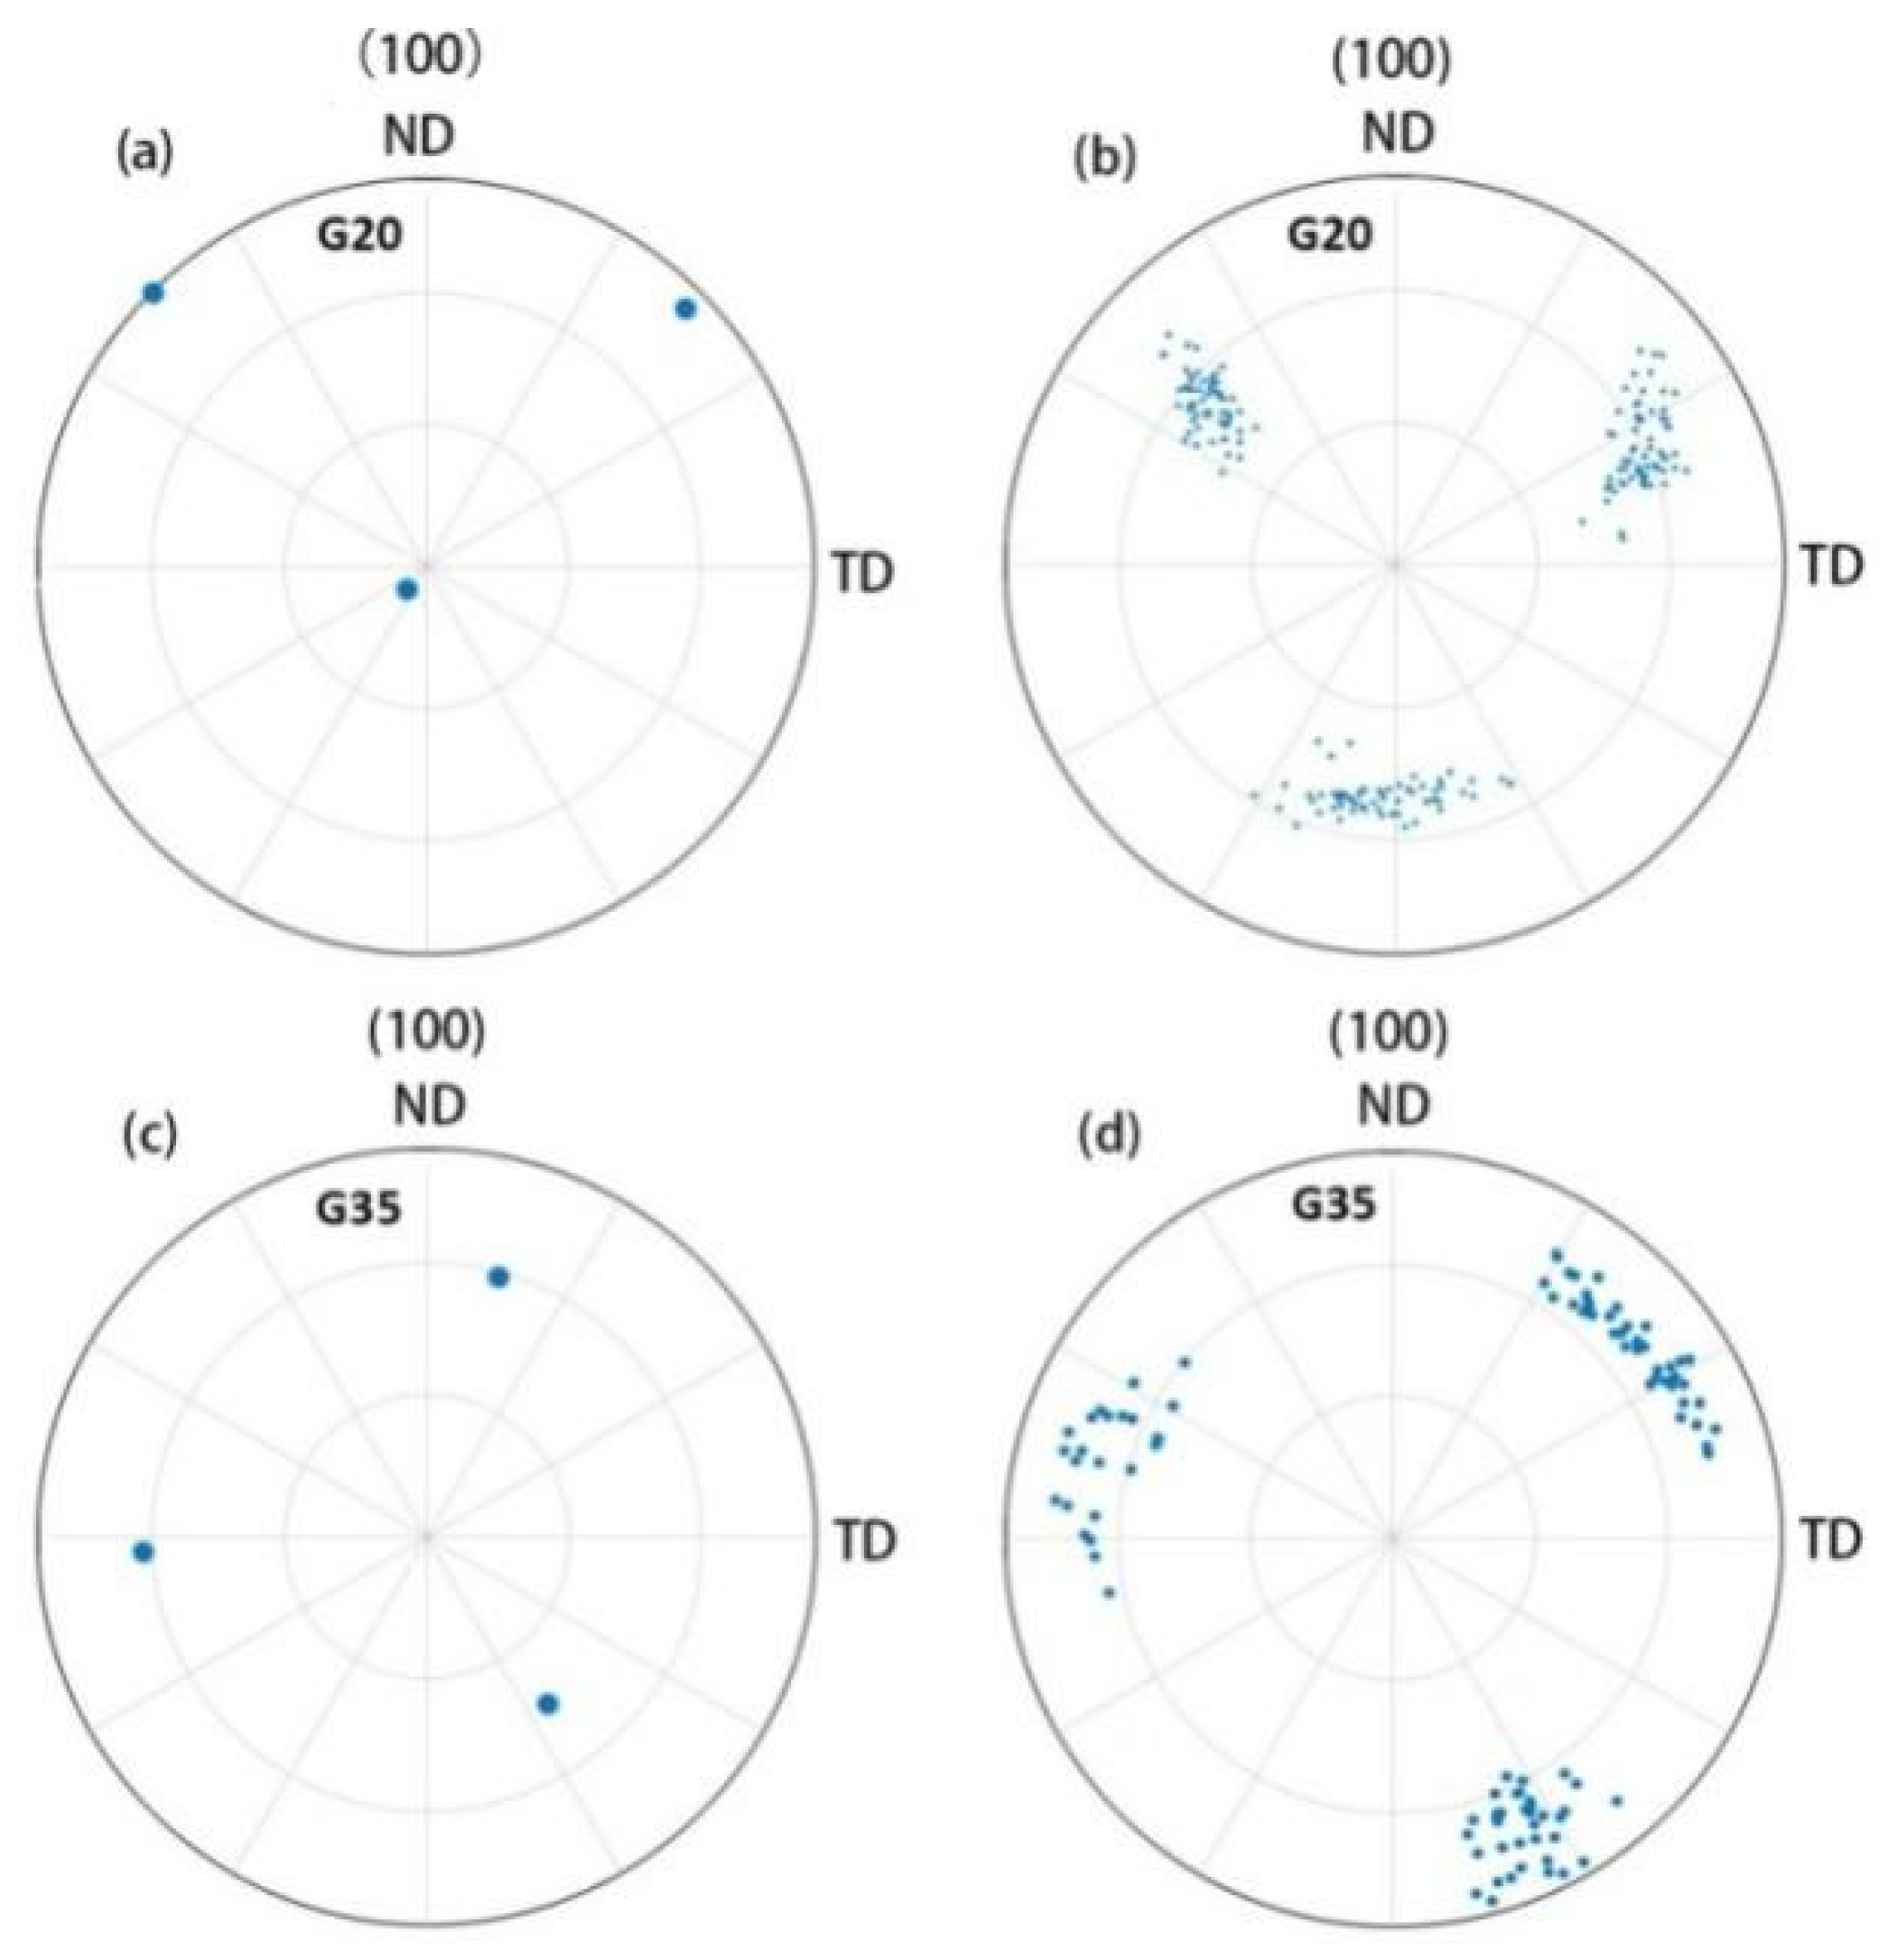
The X, Y, and Z axes represent the transverse (TD), rolling (RD) and normal directions (ND) respectively. Figure 17 shows the (100) pole figures of G20 and G35 before and after the thread rolling deformation. Each grain is a single orientation before the deformation. The grain orientation will rotate after the deformation. It can be seen that the initial orientation distribution is different in G20 and G35. The orientations of G20 rotate by a discrete 10°–15° along RD, and diffuse 25°–35° along ND. The orientations of G35 rotate by a discrete 15°–25° along the RD, and diffuse 15°–25° along TD and ND. Due to the difference in the initial orientation and position of the grains, the rotation of each grain is inconsistent. The grains in a favorable orientation for deformation have a relatively large degree of rotation. It can be seen that the grains are not severely deformed, and the orientation after rotation appears near the initial orientation because of the coordinated deformation among the grains. It can be concluded that the degree of the grain internal deformation is different, and the grain orientation changes from single to discrete distribution.
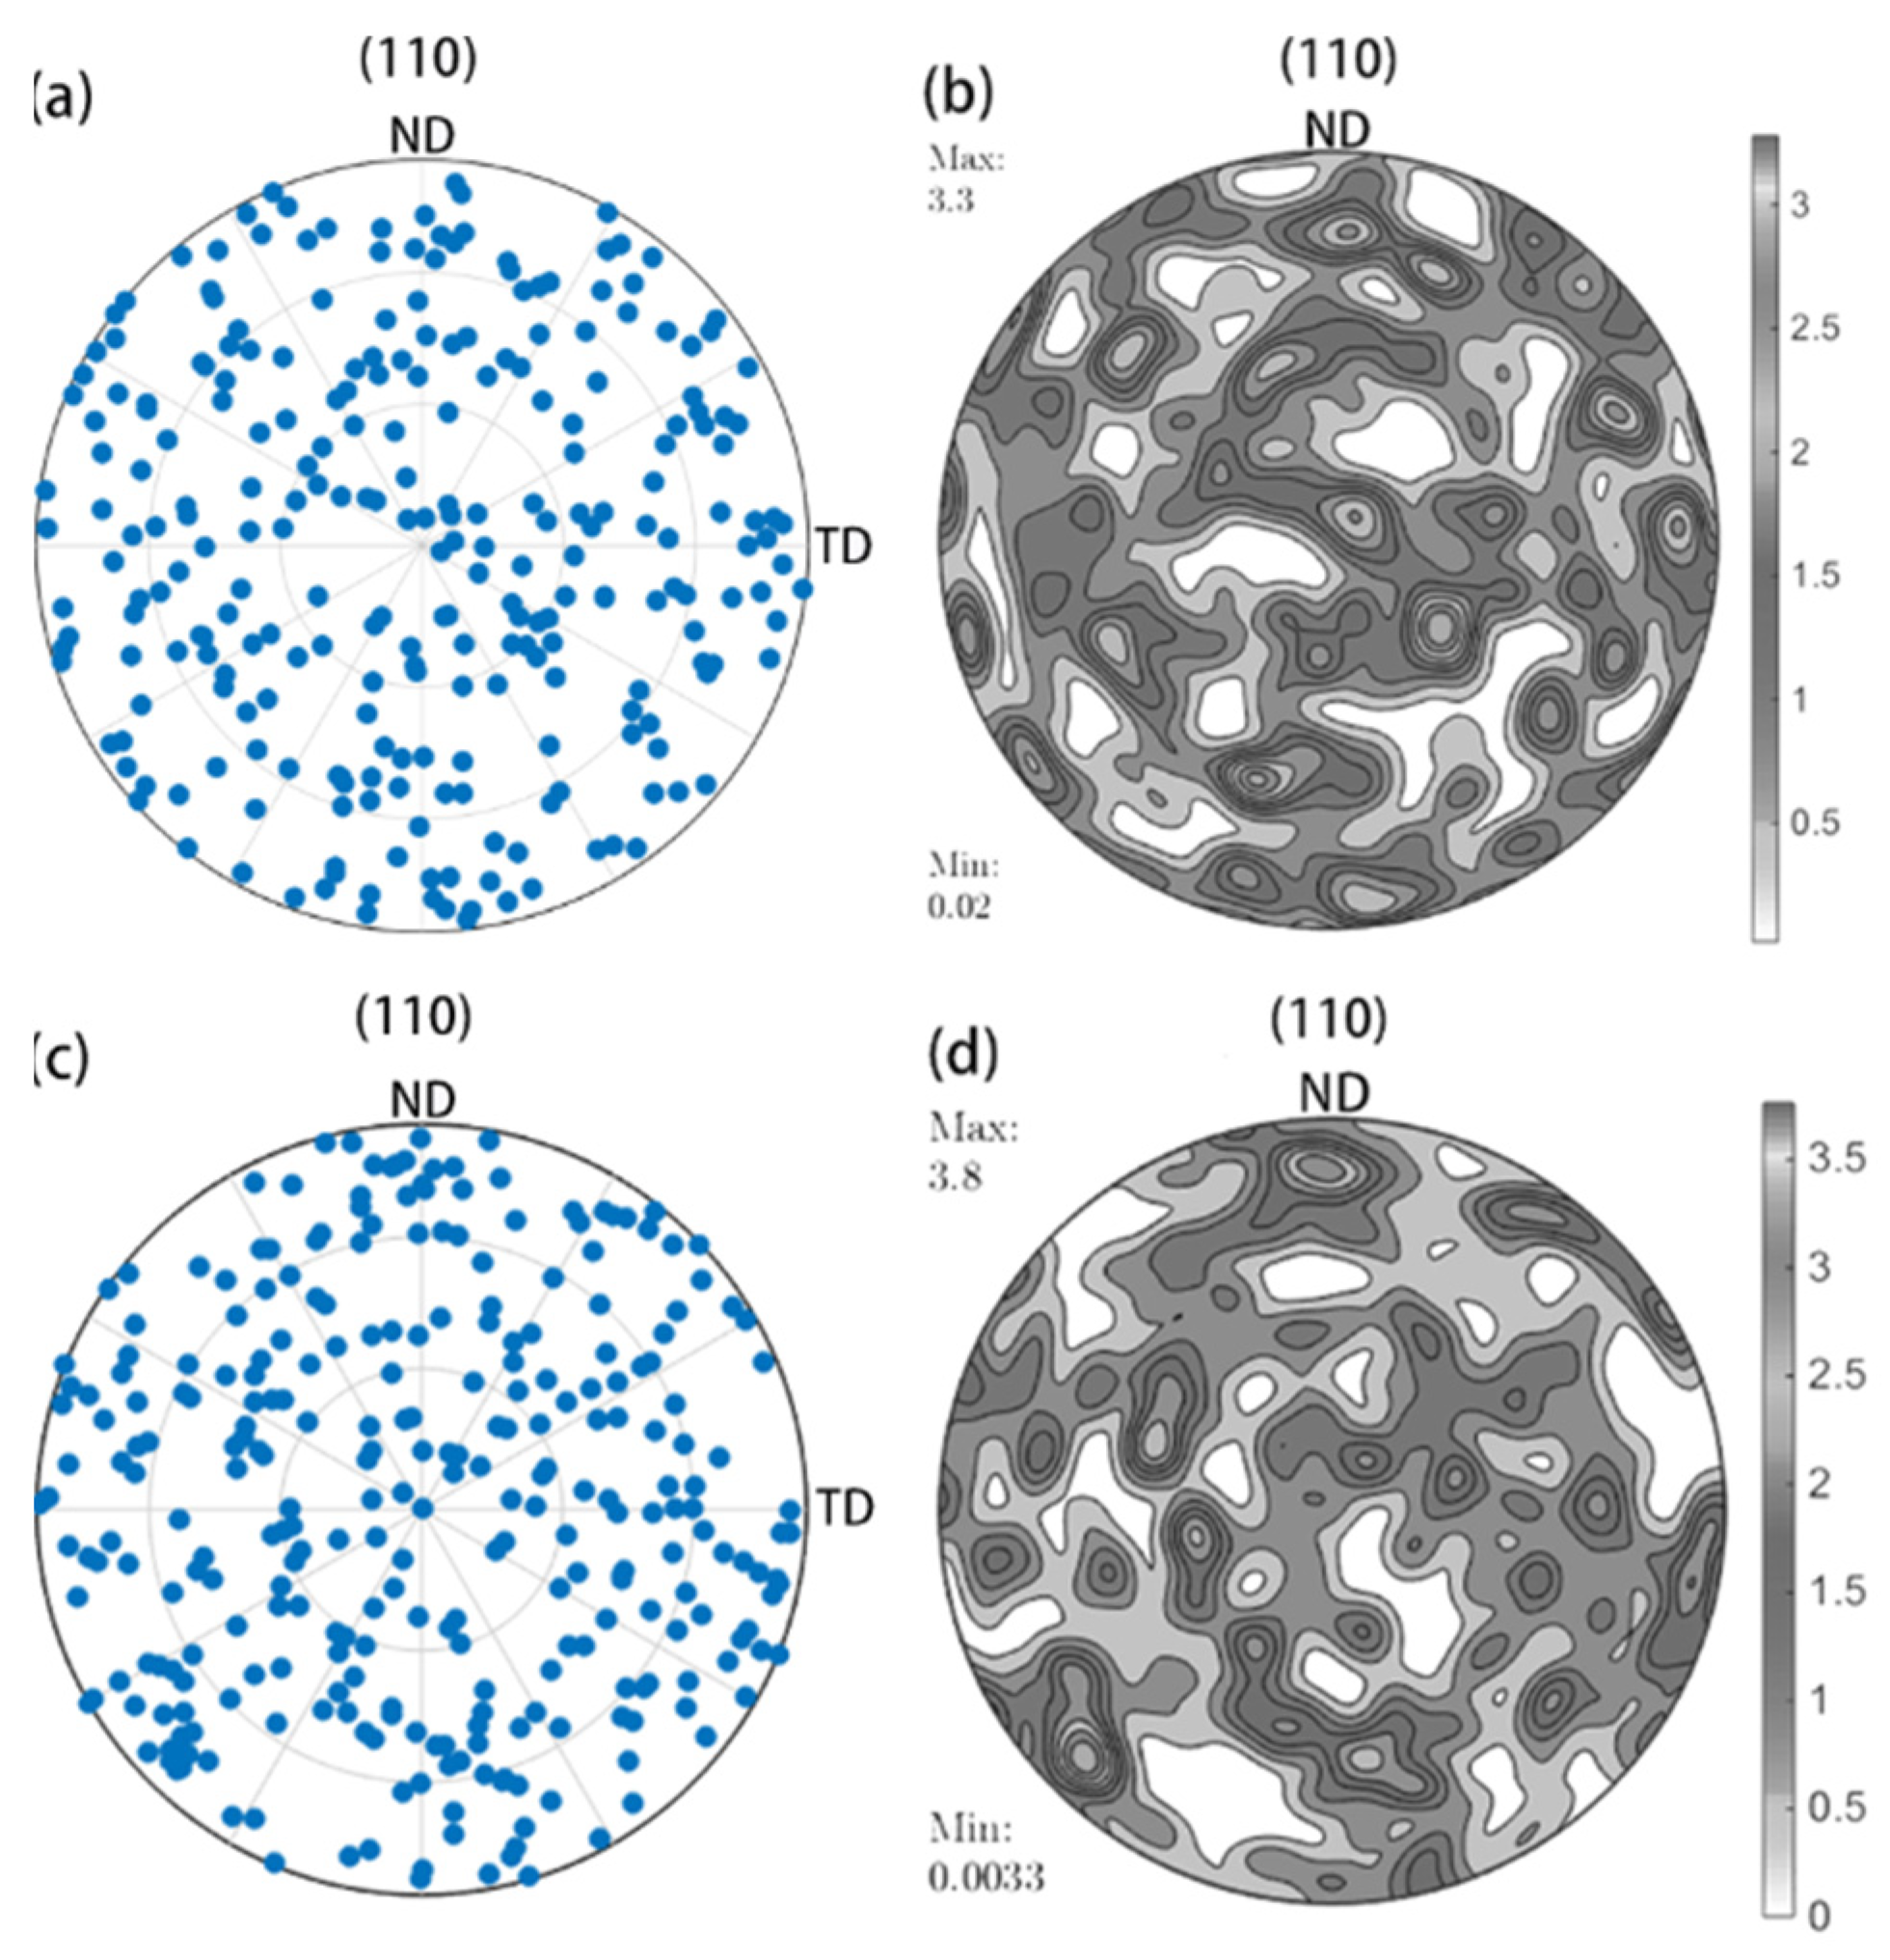
The pole figures before and after the thread rolling deformation are shown in Figure 18. The maximum density value is 3.8 after thread rolling deformation in Figure 18d, which is larger than 3.3 before deformation in Figure 18b. There is no obvious texture after deformation. On the one hand, this is because the amount of deformation is relatively small, so that the degree of grain orientation redistribution is small. On the other hand, it is determined by the thread rolling forming method. When the workpiece continues to rotate, the force state becomes periodic. The radial direction is compressed and the axial direction is elongated. In addition to the rotation of grain orientation, each grain itself in the polycrystalline model is also rotated. The orientation is basically still randomly distributed after deformation.

5. Conclusions

The purpose of this article was to use CPFEM to simulate the thread rolling forming method. The calibrated constitutive model parameters can accurately express the material properties by comparing the tensile stress–strain curves from experiment and simulation. The fluidity of the metal was analyzed, and the reason for the concave core explained. The movement of the slip system and the change of grain orientation were studied. The following conclusions were drawn:
  • The displacement field of the thread rolling was studied. It shows a trend of symmetrical extension on both sides during the forming process. The axial extension of the outer characteristic point is about 0.05 mm more than the axial extension at the center. This explains the reason for the concave core at the workpiece end.
  • The volume average method was used in the polycrystalline model to obtain the mechanical response of the representative element after homogenization. It can better reflect the force state of the entire material than a single grain.
  • The evolution of each slip system was determined by the initial grain orientations and grain locations. The grains at the end of the workpiece require less resistance due to coordinated deformation among the grains. The grain orientation after deformation appears near to the initial orientation.
  • The pole figure obtained by the experiment is basically consistent with the pole figure by the simulation. The grains are elongated in the axial direction and compressed in the radial direction without obvious texture, indicating thread rolling deformation is more uniform than ordinary rolling due to the periodic rotation effect.

Author Contributions

Y.Z. analyzed the numerical results and wrote the paper; Z.H. conceived and guided the simulation analysis; L.G. designed the experiments and revised the paper. All authors have read and agreed to the published version of the manuscript.

Funding

This research was funded by the National Natural Science Foundation of China (Grant Nos. 51275201 and 51311130129) and the Jilin Province Key R&D Plan Project (Grant No.20140204062GX).

Conflicts of Interest

The authors declare no conflict of interest.

Nomenclatures

F total deformation gradient
F * elastic deformation gradient
F P Plastic deformation gradient
M second Piola–Kirchhoff stress
C e anisotropic elasticity matrix
E Lagrangian elastic strain tensor
σ Cauchy stress tensor
F ˙ P rate of change of F P
( F P ) 1 inverse matrix of F P
γ ˙ ( α ) shear strain rate
S ( α ) slip direction vector
  m ( α ) normal direction vector
m * ( α ) unit normal direction vector
  S * ( α ) unit slip direction vector
ρ 0 mass density of reference state
ρ mass density of current state
T Schmid tensor
τ α resolved shear stress
τ c α   critical resolved shear stress
γ ˙ 0 ( α ) reference shear strain rate
n strain rate sensitive coefficient
τ ˙ c α critical shear rate
h 0 initial hardening modulus
N total number of slip systems
h α α self-hardening modulus
h α β   latent hardening modulus.
γ cumulative shear strain rates
τ 0 initial critical shear stress
τ s saturation value of τ 0
q latent hardening parameter.

References

  1. Chen, Y.; Kraft, O.; Walter, M. Size effects in thin coarse-grained gold microwires under tensile and torsional loading. Acta Mater. 2015, 87, 78–85. [Google Scholar] [CrossRef]
  2. Xu, Z.T.; Peng, L.F.; Fu, M.W.; Lai, X.M. Size effect affected formability of sheet metals in micro/meso scale plastic deformation: Experiment and modeling. Int. J. Plast. 2014, 68, 34–54. [Google Scholar] [CrossRef]
  3. Liu, W.; Chen, B.K.; Pang, Y. Numerical investigation of evolution of earing, anisotropic yield and plastic potentials in cold rolled FCC aluminium alloy based on the crystallographic texture measurements. Eur. J. Mech. A-Solids 2019, 75, 41–55. [Google Scholar] [CrossRef]
  4. Bishoyi, B.; Debta, M.K.; Yadav, S.K.; Sabat, R.K.; Sahoo, S.K. Simulation of texture evolution during uniaxial deformation of commercially pure Titanium. IOP Conf. Ser. Mater. Sci. Eng. 2018, 338, 012038. [Google Scholar] [CrossRef] [Green Version]
  5. Huang, S.Y.; Zhang, S.R.; Li, D.Y.; Peng, Y.H. Simulation of texture evolution during plastic deformation of FCC, BCC and HCP structured crystals with crystal plasticity based finite element method. Trans. Nonferr. Met. Soc. China 2011, 21, 1817–1825. [Google Scholar] [CrossRef]
  6. Fan, W.W.; Ren, Z.K.; Hou, J.; Wang, T. Finite element simulation of mesoscale inhomogeneous deformation in 304 stainless steel foil tensile. Mater. Res. Express 2019, 6, 096540. [Google Scholar] [CrossRef]
  7. Lu, J.W.; Sun, W.; Becker, A. Material characterization and finite element modelling of cyclic plasticity behavior for 304 stainless steel using a crystal plasticity model. Int. J. Mech. Sci. 2015, 105, 315–329. [Google Scholar] [CrossRef]
  8. Si, L.Y. Simulation of the Texture Evolution During Cold Deformation of FCC Metal with Crystal Plasticity FEM. Ph.D. Thesis, Northeastern University, Shenyang, China, 2009. [Google Scholar]
  9. Kalidindi, S.R.; Schoenfeld, S.E. On the prediction of yield surfaces by the crystal plasticity models for fcc polycrystals. Mater. Sci. Eng. A 2000, 293, 120–129. [Google Scholar] [CrossRef]
  10. Ma, X.G.; Zhao, J.W.; Du, W.; Zhang, X.; Jiang, L.Z.; Jiang, Z.Y. An analysis of ridging of ferritic stainless steel 430. Mater. Sci. Eng. A 2017, 685, 358–366. [Google Scholar] [CrossRef]
  11. Zhang, P.; Karimpour, M.; Balint, D.; Lin, J.G.; Farrugia, D. A controlled Poisson Voronoi tessellation for grain and cohesive boundary generation applied to crystal plasticity analysis. Comput. Mater. Sci. 2012, 64, 84–89. [Google Scholar] [CrossRef]
  12. Rawat, S.; Chandra, S.; Chavan, V.M.; Sharma, S.; Warrier, M.; Chaturvedi, S.; Patel, R.J. Integrated experimental and computational studies of deformation of single crystal copper at high strain rates. J. Appl. Phys. 2014, 116, 213507. [Google Scholar] [CrossRef]
  13. Ren, Z.K.; Fan, W.W.; Hou, J.; Wang, T. A Numerical Study of Slip System Evolution in Ultra-Thin Stainless Steel Foil. Materials 2019, 12, 1819. [Google Scholar] [CrossRef] [Green Version]
  14. Rehrl, C.; Volker, B.; Kleber, S.; Antretter, T.; Pippan, R. Crystal orientation changes: A comparison between a crystal plasticity finite element study and experimental results. Acta Mater. 2012, 60, 2379–2386. [Google Scholar] [CrossRef]
  15. Huang, Y.G. A User-Material Subroutine Incroporating Single Crystal Plasticity in the Abaqus Finite Element Program; Harvard University: Cambridge, MA, USA, 1991. [Google Scholar]
  16. Sun, C.Y.; Guo, X.R.; Guo, N.; Yang, J.; Huang, J. Investigation of plastic deformation behavior on coupling twinning of polycrystal twip steel. Acta Metall. Sin. 2015, 51, 1507–1515. [Google Scholar]
  17. Tang, B.; Xie, S.; Liu, Y.; Han, F.B.; Kou, H.C.; Li, J.S. Crystal Plasticity Finite Element Simulations for Single Phase Titanium Alloys: Effect of Polycrystalline Aggregate Features on the Mechanical Response. Rare Metal Mat. Eng. 2015, 44, 267–271. [Google Scholar]
  18. Alharbi, H.F.; Kalidindi, S.R. Crystal plasticity finite element simulations using a database of discrete Fourier transforms. Int. J. Plast. 2015, 66, 71–84. [Google Scholar] [CrossRef]
  19. Chen, S.D.; Liu, X.H.; Liu, L.Z.; Song, M. Crystal plasticity finite element simulation of slip and deformation in ultrathin copper strip rolling. Acta Metall. Sin. 2016, 52, 120–128. [Google Scholar]
  20. Pi, H.C.; Han, J.T.; Zhang, C.G.; Tieu, A.K.; Jiang, Z.Y. Simulation of the rolling texture of pure Al using crystal plasticity finite element method. J. Univ. Sci. Technol. Beijing 2007, 29, 920–924. [Google Scholar]
  21. Pi, H.C.; Han, J.T.; Zhang, C.G.; Tieu, A.K.; Jiang, Z.Y. Modeling uniaxial tensile deformation of polycrystalline Al using CPFEM. J. Univ. Sci. Technol. Beijing 2008, 15, 43–47. [Google Scholar] [CrossRef]
  22. Hama, T.; Takuda, H. Crystal-plasticity finite-element analysis of inelastic behavior during unloading in a magnesium alloy sheet. Int. J. Plast. 2011, 27, 1072–1092. [Google Scholar] [CrossRef] [Green Version]
  23. Hama, T.; Takuda, H. Crystal plasticity finite-element simulation of work-hardening behavior in a magnesium alloy sheet under biaxial tension. Comput. Mater. Sci. 2012, 51, 156–164. [Google Scholar] [CrossRef] [Green Version]
  24. Alankar, A.; Mastorakos, I.N.; Field, D.P. A dislocation-density-based 3D crystal plasticity model for pure aluminum. Acta Mater. 2009, 57, 5936–5946. [Google Scholar] [CrossRef]
  25. Ha, S.; Jang, J.H.; Kim, K.T. Finite element implementation of dislocation-density-based crystal plasticity model and its application to pure aluminum crystalline materials. Int. J. Mech. Sci. 2017, 120, 249–262. [Google Scholar] [CrossRef]
  26. Li, Z.; Yang, F. Grain rotations during uniaxial deformation of gradient nano-grained metals using crystal plasticity finite element simulations. Extreme Mech. Lett. 2017, 16, 41–48. [Google Scholar] [CrossRef]
  27. Ritz, H.; Dawson, P.R. Sensitivity to grain discretization of the simulated crystal stress distributions in FCC polycrystals. Modell. Simul. Mater. Sci. Eng. 2009, 17, 015001. [Google Scholar] [CrossRef] [Green Version]
  28. Nakamachi, E.; Tam, N.N.; Morimoto, H. Multi-scale finite element analyses of sheet metals by using SEM-EBSD measured crystallographic RVE models. Int. J. Plast. 2007, 23, 450–489. [Google Scholar] [CrossRef]
  29. Kami’nski, M.; Sokołowski, D. Dual probabilistic homogenization of the rubber-based composite with random 373 carbon black particle reinforcement. Comp. Struct. 2016, 140, 783–797. [Google Scholar] [CrossRef]
  30. Taylor, G.I. Plastic strain in metals. J. Inst. Met. 1938, 62, 307–324. [Google Scholar]
  31. Hill, R.; Rice, J.R. Constitutive analysis of elastic-plastic crystals at arbitrary strain. J. Mech. Phys. Solids 1972, 20, 401–413. [Google Scholar] [CrossRef]
  32. Peirce, D.; Asaro, R.J.; Needleman, A. An analysis of nonuniform and localized deformation in ductile single crystals. Acta Metall. 1982, 30, 1087–1119. [Google Scholar] [CrossRef]
  33. Peirce, D.; Asaro, R.J.; Needleman, A. Material rate dependence and localized deformation in crystalline solids. Acta Metall. 1983, 31, 1951–1976. [Google Scholar] [CrossRef]
  34. Asaro, R.J.; Needleman, A. Texture development and strain hardening in rate dependent polycrystals. Acta Metall. 1985, 33, 923–953. [Google Scholar] [CrossRef]
  35. Quey, R.; Dawson, P.R.; Barbe, F. Large-scale 3D random polycrystals for the finite element method:Generation, meshing and remeshing. Comput. Meth. Appl. Mech. Eng. 2011, 200, 1729–1745. [Google Scholar] [CrossRef] [Green Version]
Figure 1. Polycrystalline model: (a) before meshing; (b) after meshing.
Metals 11 00503 g001
Figure 2. Thread rolling model: (a,b) drawing; (c,d) experiment.
Metals 11 00503 g002
Figure 3. Tensile stress–strain curves by simulation and experiment.
Metals 11 00503 g003
Figure 4. The distribution of the total displacement field: (a) intuitive view; (b) radial section.
Metals 11 00503 g004
Figure 5. The distribution of characteristic points: (a) P1–P5; (b) P6–P10; (c) P11 and P12.
Metals 11 00503 g005
Figure 6. The axial displacement-time curve of the characteristic points (P1–P5).
Metals 11 00503 g006
Figure 7. The axial displacement-true path curve of the characteristic point (P6–P10).
Metals 11 00503 g007
Figure 8. The characteristic point displacement-time curve: (a) U; (b) U1; (c) U2; (d) U3.
Metals 11 00503 g008
Figure 9. The spatial motion trajectories: (a) P11; (b) P12.
Metals 11 00503 g009
Figure 10. (a,c) Strain and stress distribution and (b,d) polycrystalline model.
Metals 11 00503 g010
Figure 11. Equivalent strain curve of the polycrystalline representative element.
Metals 11 00503 g011
Figure 12. The stress (a) and strain (b) distribution of P5.
Metals 11 00503 g012
Figure 13. Shear strain rate distributions of the different slip systems: (a) a1; (b) d2.
Metals 11 00503 g013
Figure 14. Shear strain rate of the slip system: (a) G20; (b) G35; (c) G22; (d) G45.
Metals 11 00503 g014
Figure 15. The grain morphology and orientation distribution after the experiment.
Metals 11 00503 g015
Figure 16. The pole figure distribution after the experiment.
Metals 11 00503 g016
Figure 17. Pole figure before and after deformation: (a,b) G20; (c,d) G35.
Metals 11 00503 g017
Figure 18. Pole figures of the thread rolling: (a,b) before simulation deformation; (c,d) after simulation deformation.
Metals 11 00503 g018
Table 1. Constitutive model parameters of pure aluminum.
h 0 . τ 0 τ s γ ˙ 0 ( α ) n q
6021610.001101.2
Table 2. Slip systems of face-centered cubic (FCC) pure aluminum.
PlaneDirectionSlip System
(111)[0 1 ¯ 1]a1
[10 1 ¯ ]a2
[ 1 ¯ 10]a3
( 1 ¯ 11)[101]b1
[110]b2
[0 1 ¯ 1]b3
(1 1 ¯ 1)[011]c1
[110]c2
[10 1 ¯ ]c3
(11 1 ¯ )[011]d1
[101]d2
[ 1 ¯ 10]d3
Publisher’s Note: MDPI stays neutral with regard to jurisdictional claims in published maps and institutional affiliations.