Article

Microstructural Stability of Extruded Mg-Mn-Ce Hollow Profiles with Weld Seams

1
INGWERK GmbH, 13629 Berlin, Germany
2
Extrusion Research & Development Center, TU Berlin, 13355 Berlin, Germany
3
ZELMI, TU Berlin, 10623 Berlin, Germany
*
Author to whom correspondence should be addressed.
Metals 2021, 11(4), 547; https://doi.org/10.3390/met11040547
Submission received: 29 January 2021 / Revised: 11 March 2021 / Accepted: 17 March 2021 / Published: 27 March 2021
(This article belongs to the Special Issue Magnesium Alloys: Design, Processing and Properties)

Abstract

:
Despite aluminum profiles, magnesium profiles have not been well developed due to the low formability. Furthermore, extruded magnesium profiles show a strong dependence on the mechanical properties, according to the loading direction. This is caused by a strong basal texture, which is directly dependent on the process parameters during the extrusion and the subsequent aging. Thus, the present paper focuses on the analysis of the microstructure and its evolution of extruded magnesium hollow profiles, which were subjected to a series of heat treatments at 475 °C up to one hour. The hollow profiles were extruded through a porthole die, thus, containing longitudinal weld seams. These were formed by material that underwent heavy shearing along the tool surface based on the friction conditions in the porthole die. Three extrusion ratios (ER = 8:1, ER = 16:1, ER = 30:1) were applied, resulting in three different wall thicknesses of the profiles. The microstructure of the profiles was analyzed using light-optical microscopy (LOM) and scanning electron microscopy (SEM) coupled with electron backscatter diffraction (EBSD). The analysis revealed no change of the microstructure of the profiles extruded at the two higher extrusion ratios within the time frame of the heat treatment. In contrast, the microstructure and, thus, the micro-texture of the profile with the lowest extrusion ratio (ER = 8:1) has been affected to a great extent. While only small changes in microstructure in the weld-free area were observed, the initial microstructure in the weld seam was transformed from fine recrystallized grains into a significantly bimodal microstructure mainly due to an abnormal grain growth (AGG). These changes were accompanied by a promotion of the rare-earth (RE) texture component for the weld-free material and a change of the overall texture from RE to a typical non-RE double fiber texture for the weld seam due to the intense AGG within the short-time heat treatments. In addition, the influence of the extrusion ratio on particle size and distribution as well as the character of the microstructure governing the behavior during heat treatments was analyzed and discussed.

1. Introduction

Extruded profiles are commonly used in various applications and industrial sectors such as transport, construction, machine building, sporting goods, medical application, and many more. The wide utilization of extruded profiles is due to the large range of profile geometries that can be produced by extrusion, especially hollow profiles that are combining low weight and high stiffness. Currently, most commercially available lightweight extrusion profiles are aluminum profiles. This is mainly due to the excellent forming behavior of aluminum as well as the broad range of available alloys. Since magnesium has an hcp lattice structure, it has a low formability, especially at lower temperatures. Throughout the last two decades, various efforts have been made to improve the formability of magnesium alloys with special emphasis on room temperature or low-temperature deformation properties. Therefore, variations in process conditions, i.e., different strain paths, have been performed. Mostly, the commercially available alloys of the AZ and ZK family have been used.
In rolled products, sharp basal textures that come with a pronounced mechanical anisotropy and, thus, reduced formability, were observed in conventional Mg alloys, such as AZ31 [1,2], ZM21 [3], or Z1 [4]. Strong basal textures are also the result of the extrusion process over a wide range of processing conditions. The authors in Reference [5] observed a ring fiber texture in extruded round bars of pure magnesium. The same was observed in alloy M1 at various extrusion conditions yielding a pronounced ⟨10-10⟩/⟨11-20⟩ double-fiber texture [6]. However, the characteristics of the previously mentioned ⟨10-10⟩/⟨11-20⟩ double-fiber texture is directly dependent on the extrusion temperature. At lower extrusion temperatures, i.e., exit temperatures, the ⟨10-10⟩-fiber component as the ‘deformation texture’ dominates the overall texture [7,8,9,10]. By increasing the extrusion temperature, a strengthening of the ⟨11-20⟩-fiber at the expense of the ⟨10-10⟩-fiber intensity is often observed [11,12,13] and the authors refer this change in fiber character to altered dynamically recrystallized (DRX) mechanisms as well as to static recrystallization (SRX) or grain growth (GG) at sufficiently high temperatures.
However, for reducing the anisotropy of the mechanical properties and, thus, increasing the formability, rare earth (RE) elements as alloying elements in magnesium alloys play a major role. This is attributed to the implementation of the ⟨11-21⟩ RE texture component accompanied by a simultaneously weakening of the usually observed ⟨10-10⟩ fiber or ⟨10-10⟩/⟨11-20⟩ double-fiber texture as well as in rolled [1,2,3,4] and in extruded products [5,6,14,15]. The modification and weakening of the overall texture are related to either particle stimulated nucleation (PSN) [16,17], shear band nucleation (SBN) [18,19,20], or solute segregation of RE elements at the grain boundary influencing the grain boundary mobility [19,21,22,23,24].
Recently, some investigations were performed on the post-deformation heat treatment behavior of the alloy ME21 [25,26,27], which is also used in this paper. The heat treatments of ME21 at temperatures above 475 °C resulted in significant grain growth accompanied with the enhancement of the RE texture component. Thereby, heat treatments at 475 °C led to a bimodal microstructure consisting of starting grains and preferentially grown grains (abnormal grain growth (AGG)) whereas a more homogeneous grain structure was achieved at temperatures of 550 °C. Furthermore, long annealing times resulted in a coarsening and coalescence of Ce-rich and Mn-rich dispersoids, which, in combination with the texture modification, is proposed to significantly increase the ductility, mainly in compression. The authors in Reference [27] also identified the activation of <c+a>-pyramidal and <a>-basal slip as the main deformation modes to facilitate the high deformation strains.
Although the previously mentioned promising results show the potential of increasing room temperature (RT) ductility of this alloy, the samples were solely taken out of extruded, round bars. The fabrication of structural parts, i.e., in car bodies, may include extruded (hollow) profiles of varying shapes that demand complex extrusion tooling such as porthole dies. Here, at least one mandrel is placed within the die, forming the inner shape of the hollow profile. The fixture of the mandrel through the use of bridges causes the work piece material to split up in front of each bridge, flowing around it and weld together in the welding chamber under solid-state welding conditions. Due to the inherent friction along bridges and the rest of the tooling, each separate metal stream experiences an inhomogeneous deformation history over its cross-section. Therefore, the strain path when forming complex hollow profiles is very different from the simple case of extruding a round bar. The welding of the separate metal streams results in a longitudinal weld seam, which is formed parallel to the extrusion direction (ED), consisting of highly sheared material and, thus, the properties of the weld seam compared to completely weld-free material are different.
The authors in Reference [28] found larger grains in weld seams of extruded AZ31 hollow profiles compared to the weld-free microstructure. In contrast, in the work of References [29,30], the grains in the welding zone of extruded AZ31 hollow profiles was smaller, with the difference being that the latter profiles were extruded at significantly lower temperatures. It can be assumed that, in both cases, the increased strain originating from friction at the bridges of the porthole die lead to these differences in grain size while the bigger grains in Reference [28] are the direct result of grain growth due to an increased driving force. In addition to changes in grain size, several authors found altered textures in the weld seam regions. For example, in extruded AM30 rectangular hollow profiles, the weld region consists of fine grains aligned at the weld line, which are surrounded by large grains. These larger grains featured a ⟨11-20⟩-texture component resulting from post-extrusion grain growth [31]. In the works of References [31,32], the weld seam was found to have a split basal texture with each of the basal textural components representing the individual material flow into the weld seam. The tilt angle of the split texture component with respect to the texture of the reference material, i.e., basal sheet texture, is believed to result from the characteristic material flow inside the welding chamber. Furthermore, several authors observed an alignment of second phase particles along or at least in the vicinity of the weld line, which eventually led to premature failure of the part during mechanical testing [33,34,35].
Because of the divergent properties in the weld area, a post-deformation heat treatment can have different effects on the resulting microstructure due to the deformed state when comparing with that of round bars for example. Therefore, the aim of this research was to to analyze the microstructural differences between the different material zones of the weld-free and weld-seam material. Therefore, short-term heat treatments for up to an hour were conducted and the effect on the microstructure and texture was analyzed.

2. Experimental Procedure

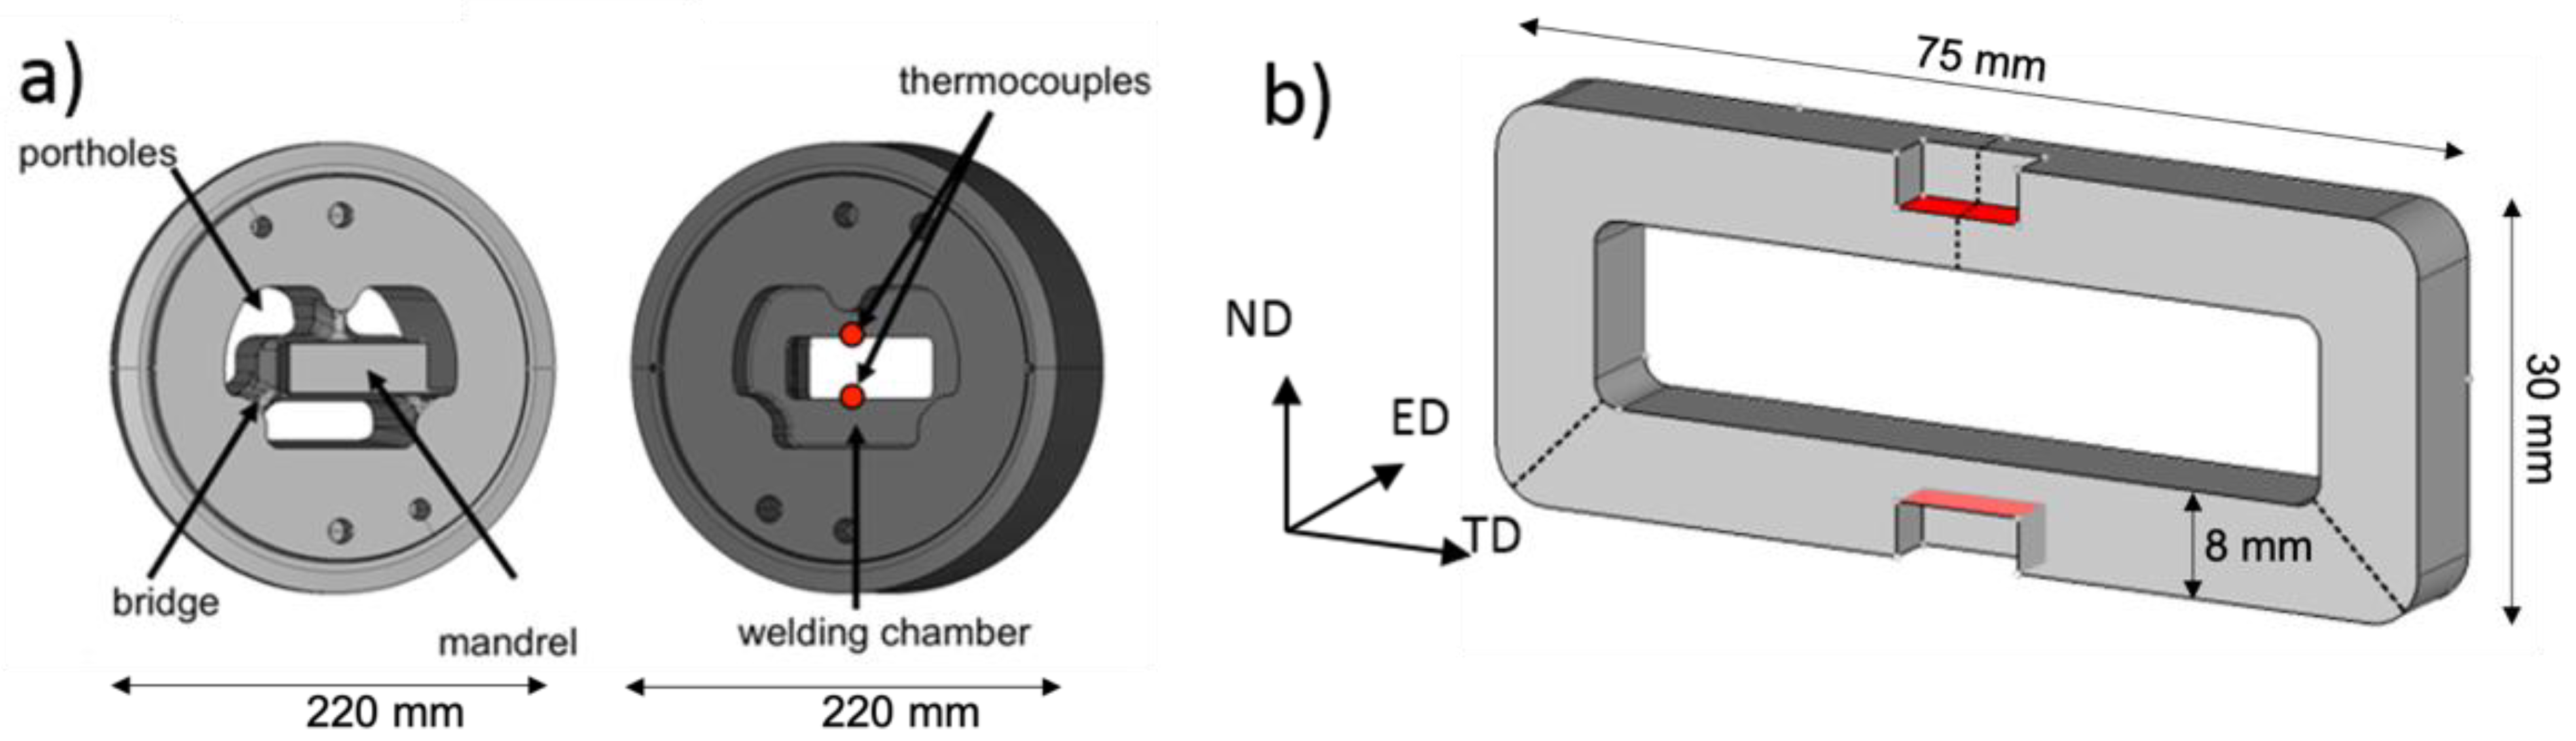
2.1. Forming Experiments

The alloy chosen for this study has a composition of 2 wt% manganese and 0.7 wt% cerium, which was provided by Stolfig Group (Stolfig Group, Geisenfeld, Germany). The feedstock material was billets with a length of 250 mm and a diameter of 123 mm. The extruded hollow profiles had a width of 75 mm and a height of 30 mm. The wall thickness was 8 mm for the extrusion ratio (ER) = 8:1, 4 mm for ER = 16:1, and 2 mm for ER = 30:1 [23]. Briefly, the extrusion die features three portholes and, thus, three bridges resulting in a profile with a rectangular cross section having three weld seams, according to the positioning of the bridges (Figure 1). Extrusion was performed billet-to-billet at a billet temperature of 450 °C and a profile exit speed of 1 m/min. This resulted in profiles containing transverse or charged welds. However, traces thereof were only found in the immediate vicinity of the profile surface. After the extrusion sections containing the weld seam as well as weld-free material were cut out of the profiles. The weld-free and weld seam containing samples were isothermally heat-treated in a batch furnace at 475 °C for dwell times of 400 s, 1200 s, and 3600 s, whereby the dwell time is defined as the timeframe of the heat treatment where the samples have reached the nominal heat treatment temperature. For accurate temperature control and measurement of the heating curve, a sample of identical dimensions was equipped with a thermocouple and placed at the same location inside the furnace when the samples were used for the investigation.

2.2. Microstructure Characterisation

The resulting microstructure was then observed using light-optical microscopy (LOM) (Leica Microsystems GmbH, Wetzlar, Germany) at the half wall thickness of the profiles. Therefore, the samples underwent standard metallographic procedures including wet grinding with SiC paper, followed by polishing using a diamond-based suspension of 6-µm, 3-µm, and 1-µm particle size and subsequent chemically polishing using CP2 agent for 3–5 s. The samples for (polarized) light-optical investigation were etched using an acetal picric (70 mL of ethanol, 15 mL of distilled H2O, 15 mL of acetic acid, and 4 g of picric acid). Samples for the investigation of particle size and distribution were also polished and chemically etched (CP2) for 1 s in order to increase the contrast of the particles with respect to the matrix during the observation using scanning electron microscopy (SEM) (Jeol Ltd., Tokyo, Japan). Acquisition of images was done on a Jeol 640 SEM and the measurement of particle distribution and sizes was performed using ImageJ software. For a deeper understanding of the effects of the heat treatments on the microstructure especially in the weld seam region, electron backscatter diffraction (EBSD) (Carl Zeiss Microscopy Deutschland GmbH, Oberkochen, Germany), measurements were carried out. The sample preparation was identical to that of the LOM investigation except for the etching with picric acid. The investigation of the local microstructure and texture using EBSD was performed using a Zeiss DSM 982 GEMINI SEM equipped with an EDAX Hikari camera. The data were processed using the OIM Data Collection and OIM Analysis Software (EDAX LLC, Mahwah, NJ, USA). The EBSD measurements were carried out at the half wall thickness of selected weld seam areas and corresponding weld-free (reference) areas of the same profile, as outlined in Figure 1. The exact position of the weld line was located in advance using polarized light in combination with a micro hardness testing machine. Finally, the step size was 500 nm.

3. Results and Discussion

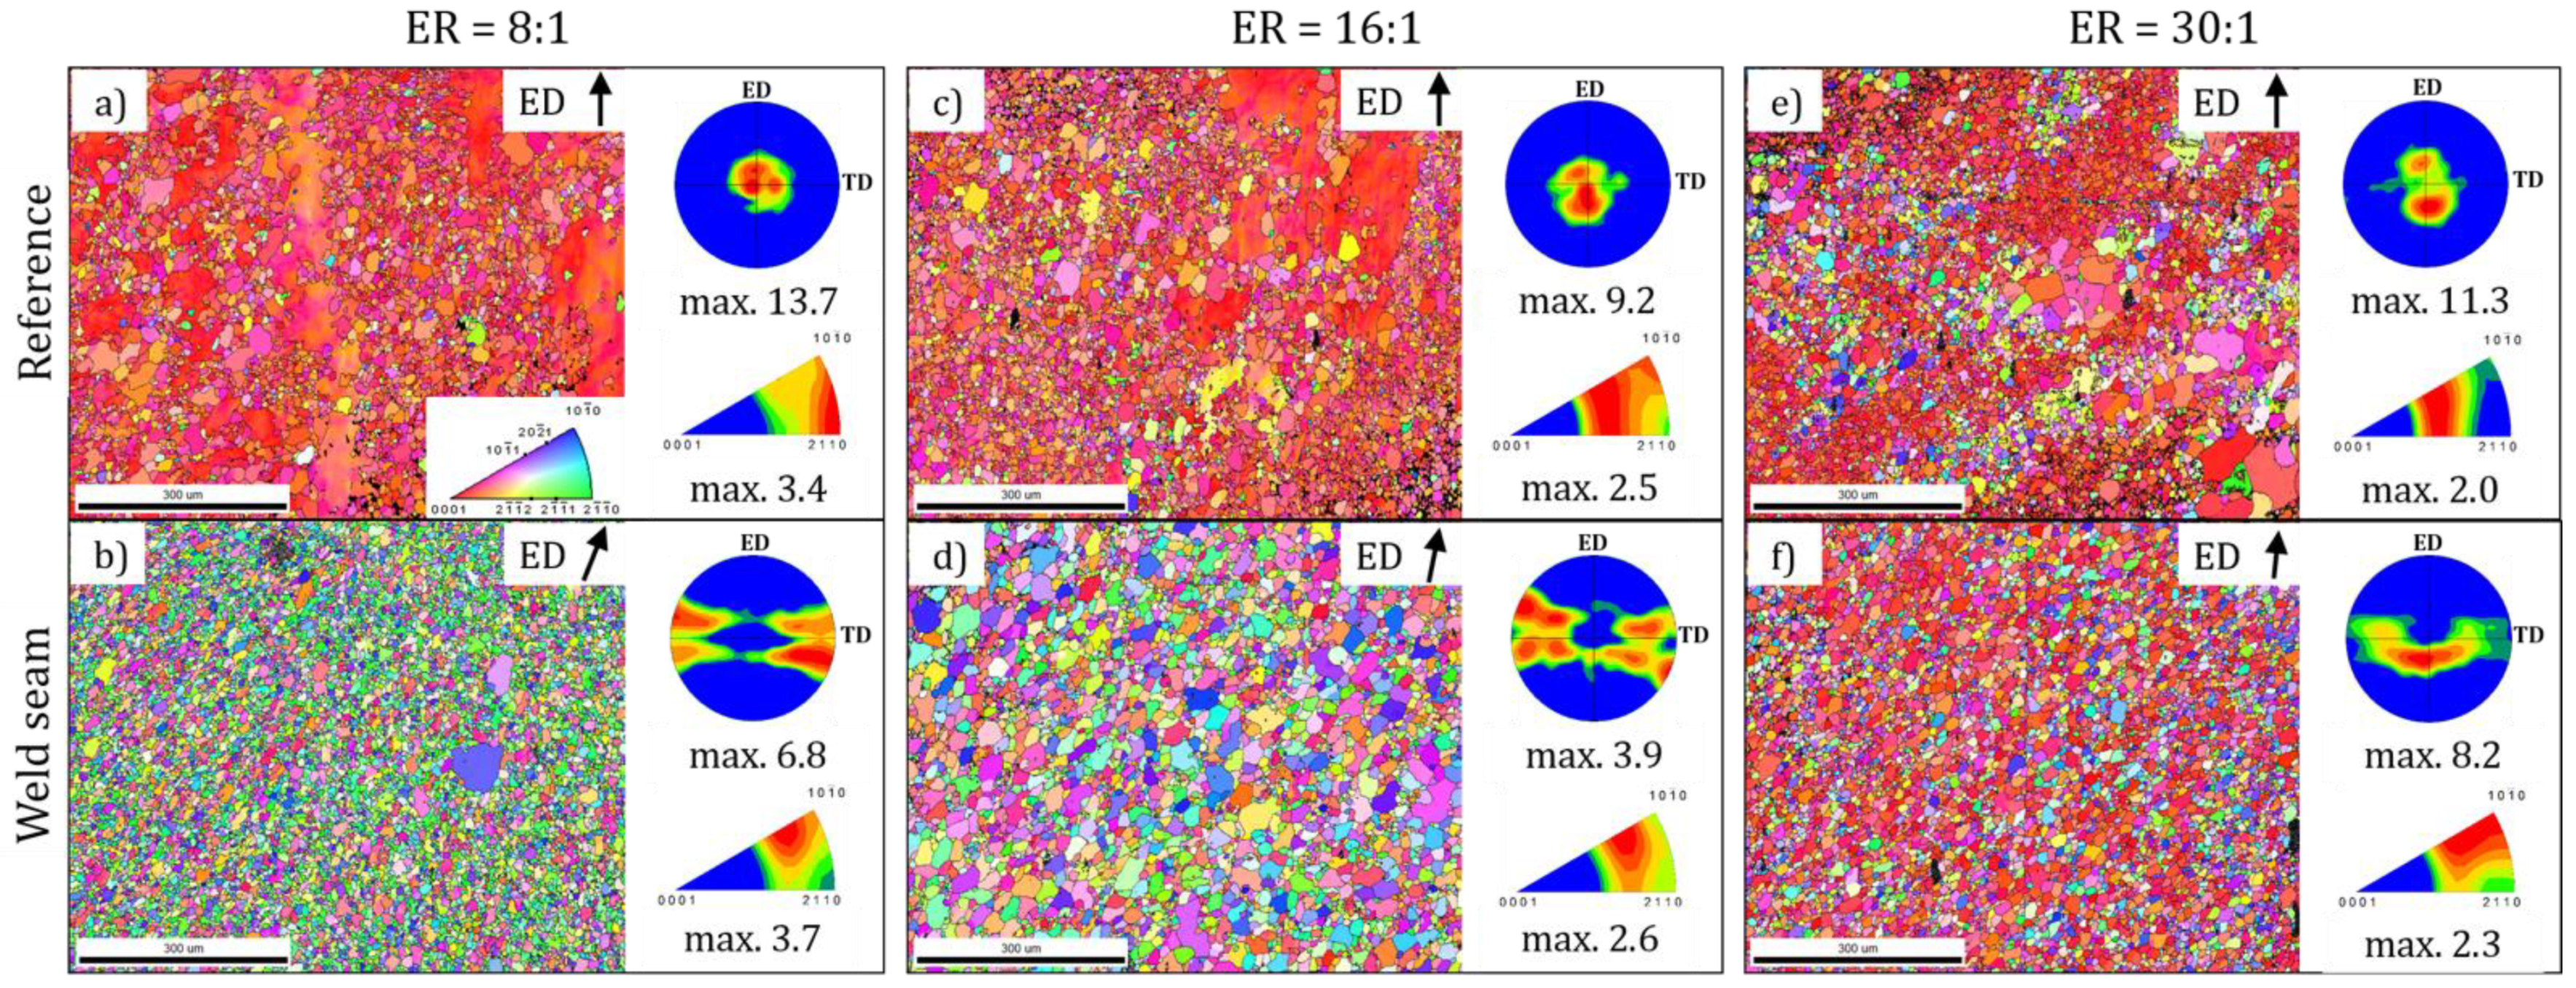
3.1. Initial Microstructure and Texture

The initial microstructure of the profiles has already been described in detail in reference [23]. Briefly, the hollow profile with the higher extrusion ratio (ER) of ER = 30:1 has an overall more homogeneous microstructure over the profiles extruded at an ER = 16:1 and ER = 8:1, which is attributed to the increase in the degree of deformation, i.e., strain, as a function of increasing the extrusion ratio. Hereby, in the reference area (without the weld seam), the fraction of dynamically recrystallized (DRX) grains increased as a function of increasing strain (Figure 2a–c). All samples taken from the reference area of the three investigated profiles show comparable recrystallized grain sizes of 13.6 µm (ER = 8:1) and 13.9 µm (ER = 30:1) and slightly lower in the case of ER = 16:1 (11.8 µm) without significant differences regarding the size distribution (Figure 3). Some minor grain growth can also be noticed in all of the three investigated areas. This is believed to be the result of the slow air cooling after the profile has exited the porthole die. In general, the lower the extrusion ratio is, the higher the profile mass is and the slower the cooling rate becomes.
Figure 2 also illustrates the texture of the samples of the reference area using inverse pole figures (IPF) maps and {0001} pole figures. In the case of the low extrusion ratio, a pronounced basal texture is evident from the (0002) pole figure (Figure 2a) having the c-axes tilted around the normal direction (ND) of the sheet plane. The corresponding inverse pole symbol in Figure 2a provides an intensity distribution between the ⟨10-10⟩-component and the ⟨11-20⟩-component with stronger intensity in case of the latter typical of a microstructure consisting of not fully recrystallized as well as recrystallized grains. In addition to that, there is also a weaker intensity developed between the ⟨10-10⟩ and the ⟨0001⟩ poles around the ⟨20-21⟩-texture component. Increasing the extrusion ratio generally leads to the formation of a split basal pole in the (0002) pole figure and to a decrease of the texture intensity, which was also observed by other investigations using the present alloy or similar alloys [23]. The absence of the ⟨10-10⟩-components and ⟨11-20⟩-components in the sample from the highest extrusion ratio (Figure 2c) is believed to be due to an increased formation of shear bands and related DRX in them, which leads to the formation of a pronounced fiber component in the arc between the ⟨11-21⟩-pole and the ⟨20-21⟩-pole. The necessity of applying certain critical process parameters in order to facilitate the formation of RE-textures in this alloy is further corroborated by the recent work of Reference [36].
In the immediate weld seam area, the microstructure is characterized by a fully recrystallized fine grained and homogeneous microstructure for all profiles. The average grain size in the mid-plane varies with a change in extrusion ratio and a bigger grain size is measured in the weld seam of ER = 16:1 profiles (19 µm) compared to roughly 10 µm and 12 µm in the ER = 8:1 and ER = 30:1 weld seams, respectively. Additionally, there is a slightly wider grain size distribution in the weld seam of the ER = 16:1 profile (Figure 3b).
The higher grain size in the ER = 16:1 weld seam and size distribution are indicative of at least some grain growth. The reason for this instance may not be explored fully here and would need further investigation into that specific example. Comparing all three extrusion conditions, the exit temperature increases with a rising extrusion ratio due to the increased degree of deformation and, hence, increased deformation heat is generated [23]. This leads to about 20 K higher exit temperatures in the ER = 16:1 profiles compared to the ER = 8:1 extrudates but about 40 K less than compared to the ER = 30:1 samples. In addition, when profiles exit the die with the same speed but the extrusion ratio varies, then local and average strain rates are different in the porthole dies. Because of the strain rate sensitivity of Mg alloys and also because the DRX grain size is strongly dependent on the strain rate and temperature (e.g., Zener-Parameter = ε ˙ e x p ( Q / R T ) ), the thermomechanical history of the material flow through the ports and welding chamber of the extrusion die is different from one case to the other. The influence of the strain rate and temperatures is superimposed by the amount of the strain. Due to the weld seam material, the frictional strain along the die bridges is of great importance. All of the previously described mechanisms determine the condition of the microstructure at the point of the die exit predetermining subsequent grain growth. Hence, at this point, it is difficult to isolate each parameter within the scope of the complex material flow in a porthole die.
Regarding the texture, the weld seam areas are very different compared to the reference material. The intense shear deformation alongside the bridges leads to the formation of a unique distribution of basal planes visible in the (0002) pole figures in Figure 2d–f, which develop differently when the extrusion ratio is changed. The (0002) pole figure corresponding to the low extrusion ratio (Figure 2d) displays four separate poles stretching close to the ND toward the transverse direction (TD) while, at the same time, being tilted toward the extrusion direction at about 10–15°. Thereby, two diagonally opposed poles belong to the material of one common metal stream originating from one of the two feeding portholes of the die [23]. The pole density distribution changes toward an arched shape stretching around the ND toward the TD when the extrusion ratio is increased to ER = 30:1 (Figure 2f). In the case of the intermediate extrusion ratio, the (0002) pole figure resembles that of the lowest extrusion ratio but having a significantly weaker maximum intensity of 3.9 multiples of random distribution (m.r.d.) compared to 6.8 m.r.d. Furthermore, the basal pole intensity is again increased at the highest extrusion ratio. The drop in intensity in the case of the intermediate extrusion ratio is believed to be connected to the bigger grain size. Hence, it can be assumed that some grain growth already took place in that area. In addition, a fiber texture featuring a component in the arc between the ⟨11-21⟩-and the ⟨20-21⟩-pole, whereby the intensity of the latter is increased. Except for the intermediate extrusion ratio, the weld seams also feature a pronounced ⟨10-10⟩-component with a wider stretched distribution toward the ⟨11-20⟩-component. Consequently, texture development is strongly connected to the degree of deformation and, hence, the progress of DRX, whereby higher extrusion ratios favor the strengthening of the RE texture. In addition, simultaneously to the increase of the strain at higher extrusion ratios, the strain rate in the deformation zone increases. Considering comparable exit speeds, the ram speed during extrusion of the highest extrusion ratio is the lowest and, thus, material enters the portholes, which are equally designed for all ERs with the lowest strain rate first, but when it enters the welding chamber and the deformation zone, an even higher acceleration of the material occurs to facilitate the deformation, resulting in higher strain rates compared to the case of lower ERs. Higher strain rates are known to promote the DRX process and lead to higher recrystallized fractions and associated softening [6].

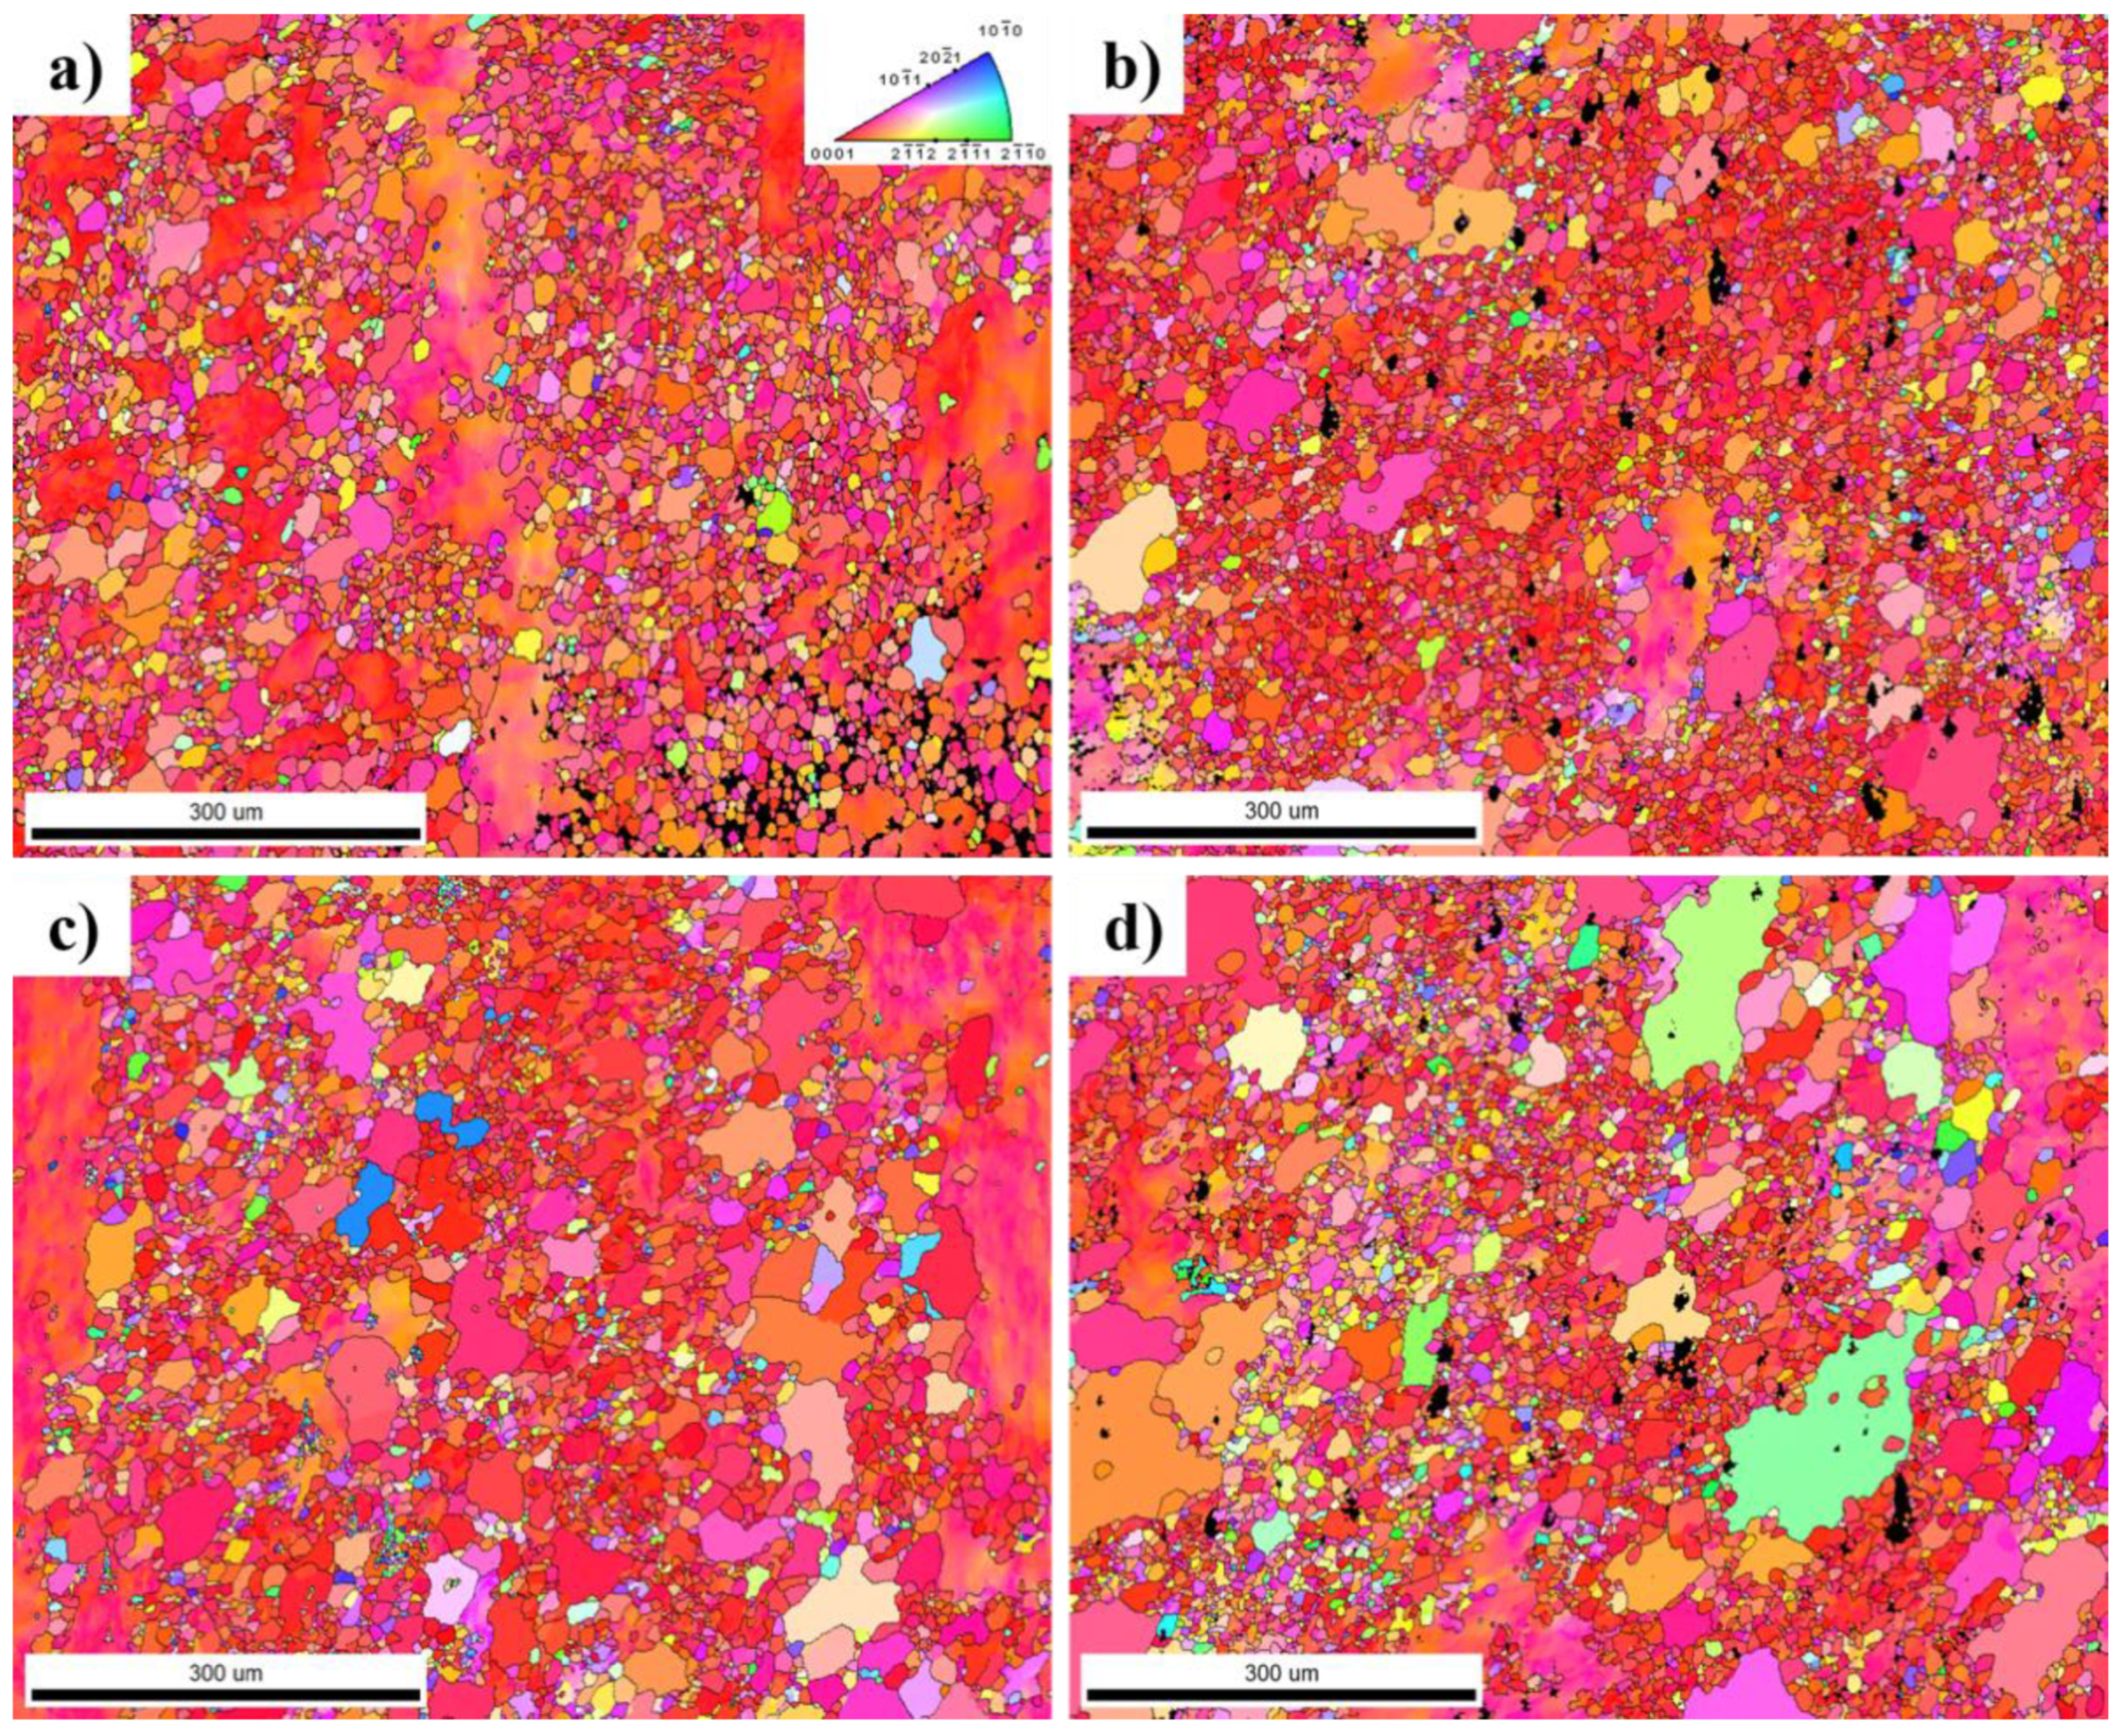
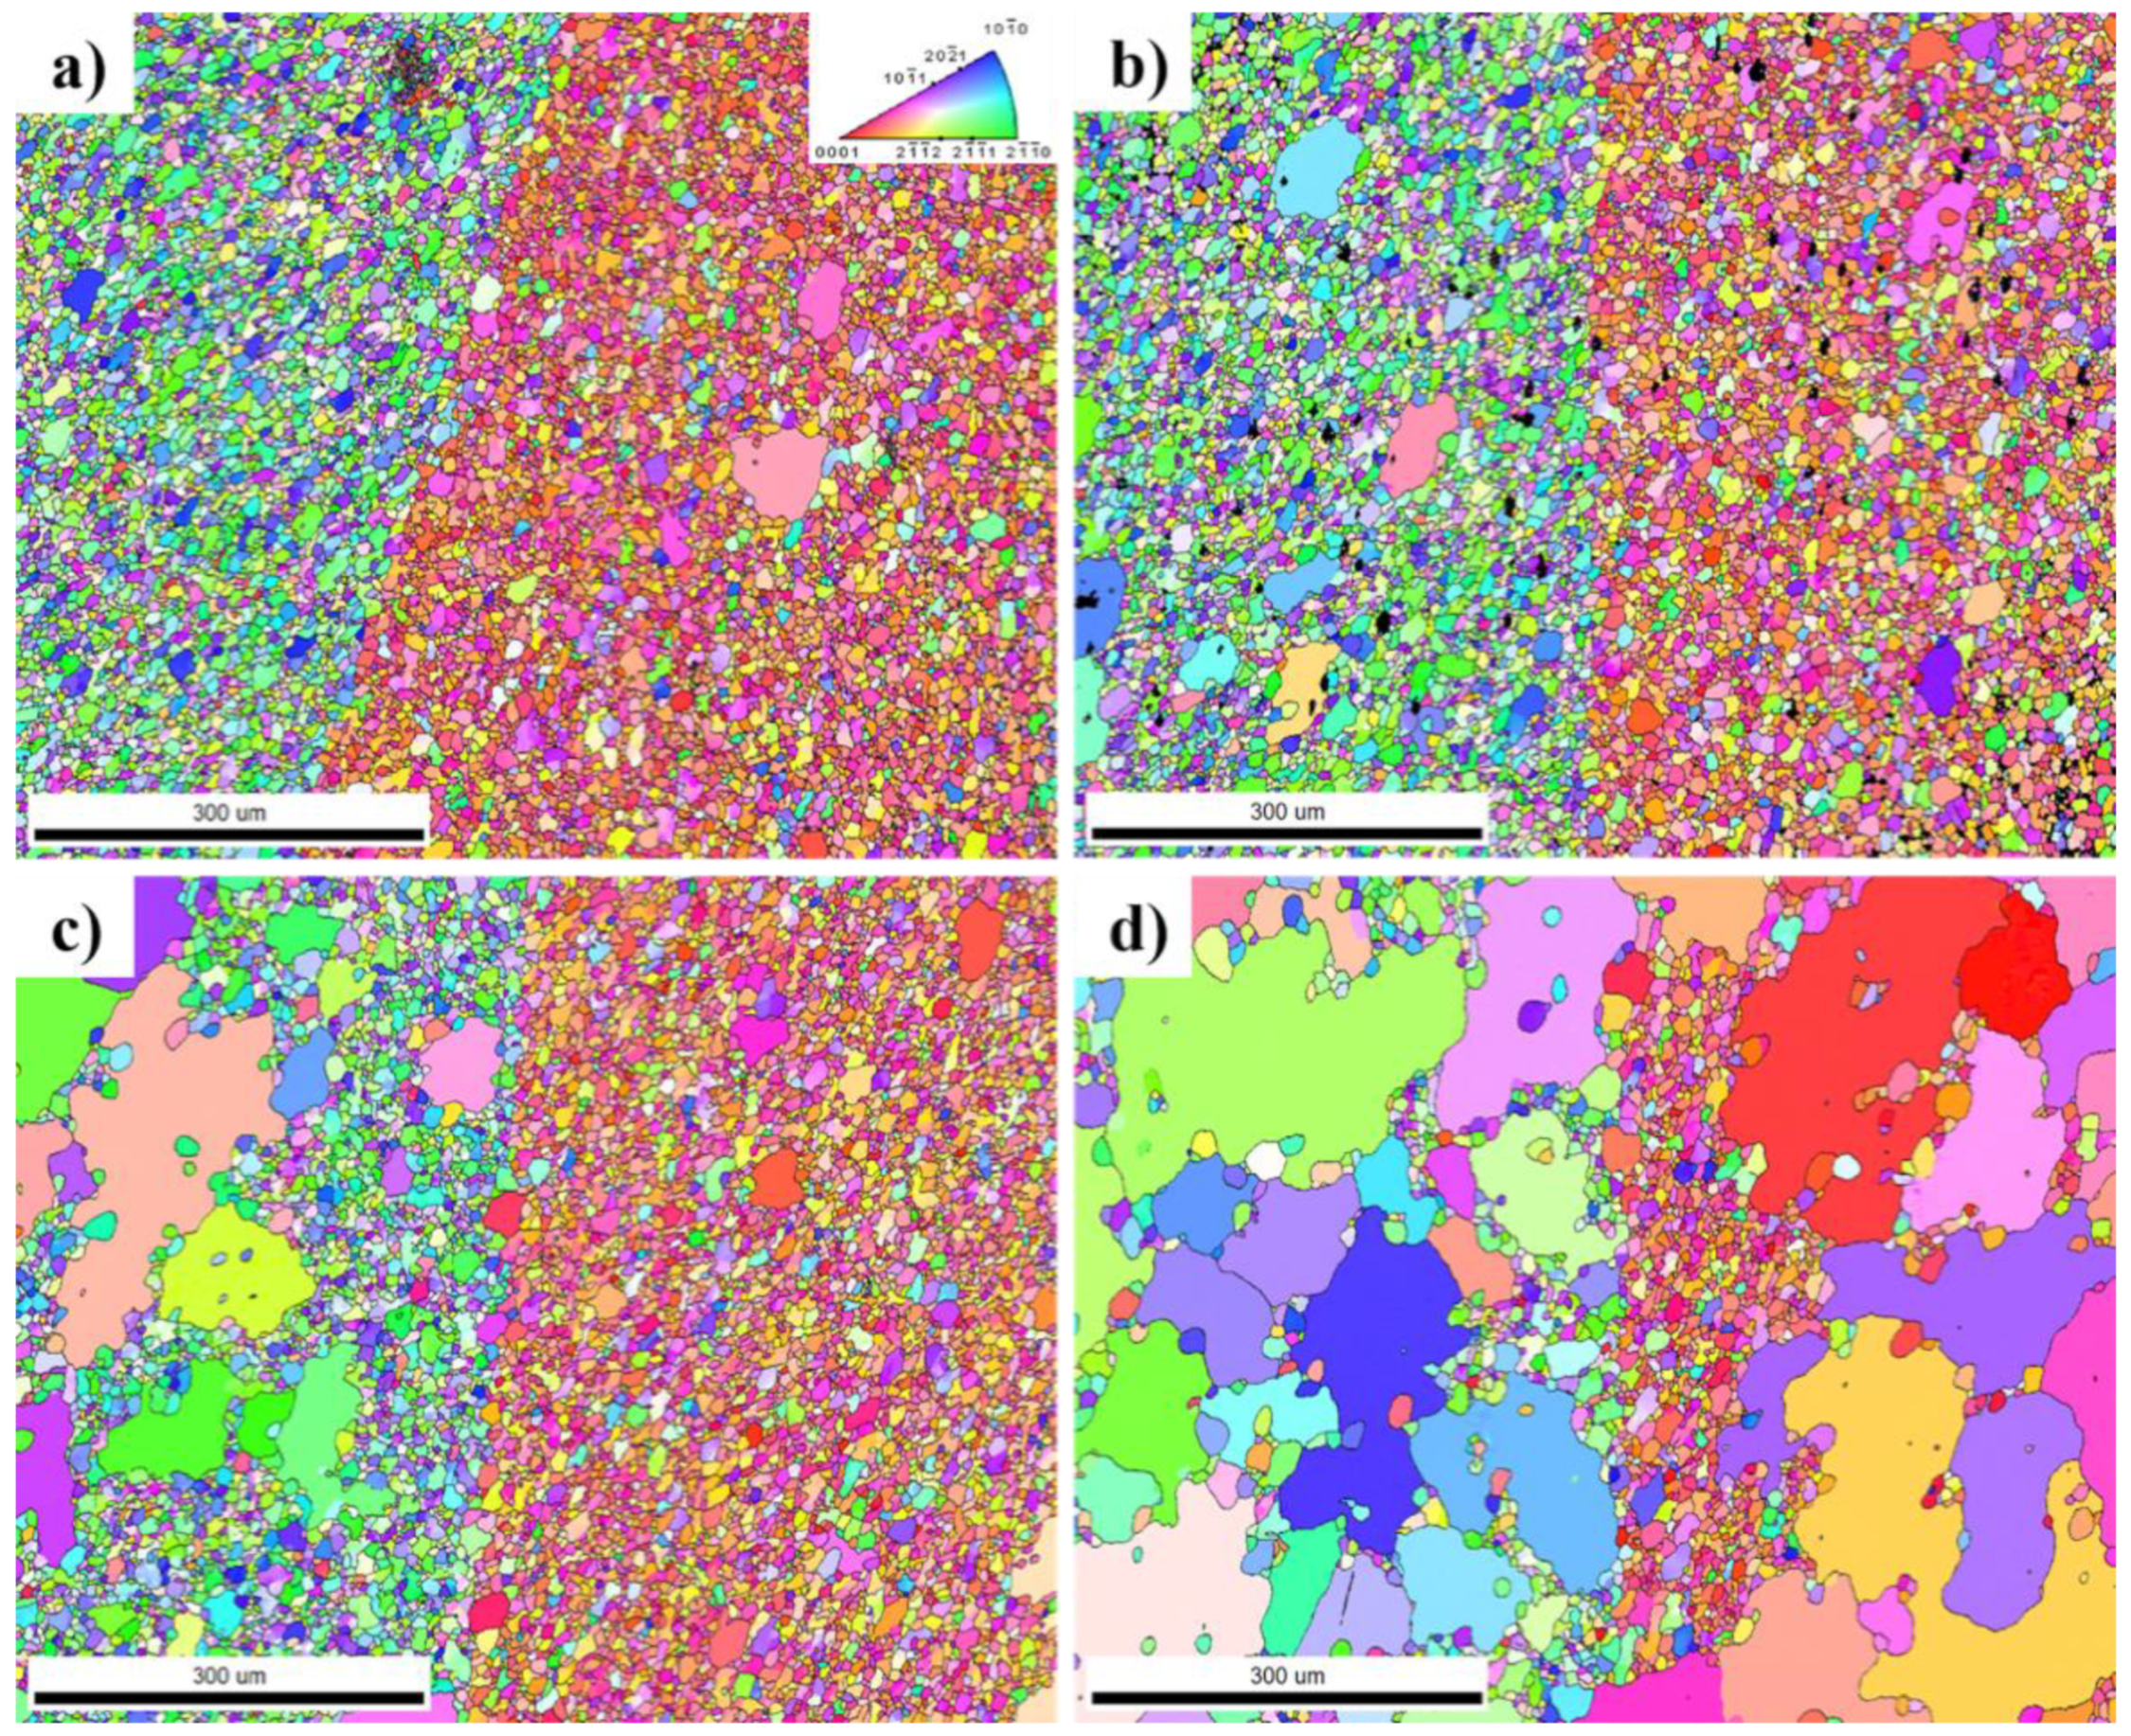
3.2. Microstructure and Texture Evolution during Isothermal Heat Treatments

As a result of the heat treatments within the present study, two very different results can be observed. After one hour, the grain structure of the profiles with the intermediate and high extrusion ratios remained unchanged (not shown here). Even after dwell times of three hours, no change in the microstructure was detected. In contrast, the heat treatment had a very significant effect on the microstructure of the profile extruded at the lowest extrusion ratio. Here, both the weld-free and the weld-seam material showed grain growth (Figure 4 and Figure 5). In Figure 6, histograms of the grain size for all annealing states of samples stemming from the low extrusion ratio profile are presented.
The flat sections in Figure 4 show the evolution of the grain structure with increasing duration of the heat treatment for the weld-free (reference) material. Due to the low extrusion ratio (corresponding to an average strain of about 2) and the retarding effects of solute RE elements on the onset of DRX, a significant fraction of deformed and partially un-recrystallized grains can be observed in the as-extruded condition in Figure 4a. After 1 h of heat treatment at 475 °C, there are still deformed grains left in the microstructure, which likely did not fulfill the necessary criteria for the onset of static recrystallization (SRX) during that period of time. Excluding the deformed and un-recrystallized grains from the observation, the microstructure still consists of a bimodal grain distribution. Increasing the dwell time up to 1 h led to the growth of individual grains at the expense of smaller ones as a function of annealing time. The process usually referred to as AGG or secondary recrystallization [24]. As it becomes clear in Figure 3, the area fraction of smaller grains with diameters of around 10 µm and less decreases. The initial grain size of the recrystallized grains was approximately 14 µm. After heat treatment at 475 °C for 60 min, the grain size was increased up to 31 µm with the 30 largest recrystallized grains making up to 18% of the sample area compared to 5% in the as-extruded state. The average grain size of these 30 largest grains has risen from a starting 35 µm up to 84 µm, whereby this value increases relatively constant with further annealing time (see Figure 6e).
In the early stage of the annealing process (Figure 5b), a minority of grains of the weld-seam material exhibits an accelerated growth rate resulting in an increasingly inhomogeneous microstructure. With further annealing (Figure 5c,d), very few grains grow very fast and lead to a more severe coarsening of the grain structure than in the weld-free material. After 3600 s of dwell time, the area fraction of the small grains with a limited growth rate decreased rapidly and the abnormal grown grains measuring up to several 100 µm in their largest dimension have consumed a considerable amount of the initial microstructure. The remarkable strong coarsening of only a few grains led to an increase in the average grain diameter from 10 µm to 105 µm. Here, the 30 largest grains made up about half of the measured area (average grain diameter of 150 µm) compared to a starting value of only 3% (average grain diameter of 26 µm).
The evolution of the texture during heat treatment is depicted in Figure 7. For the calculation of the IPFs from EBSD data shown in Figure 4 and Figure 6, only the recrystallized fraction was considered and deformed grains with high internal misorientation (not fully recrystallized) were excluded. The texture both of the weld-free and weld-seam containing material exhibit a ⟨11-21⟩ texture component in the initial ax-extruded condition. This is a common characteristic of RE containing Mg alloys and attributed to the altered DRX behavior due to the RE addition in contrast to conventional Mg alloys, which feature a ⟨10-10⟩ or ⟨10-10⟩/⟨11-20⟩ fiber texture after the extrusion process. This was previously reported for the alloy ME21 [5,19,20,21]. The maximum intensities for both specimens are located near the ⟨20-21⟩ texture component. The maximum intensity of the ⟨20-21⟩ component in the weld seam is stronger than in its weld-free counterpart (3.8 m.r.d. in the former, 2.3 m.r.d. in the latter).
During heat treatment, a change in texture for both areas of interest was observed, but at different values. The initial ⟨11-21⟩ RE and the ⟨20-21⟩ texture components in the weld-free material weaken after a dwell time of 400 s while a shift of the maximum intensity toward the ⟨10-10⟩/⟨11-20⟩ fiber texture can be observed. After 20 min, the ⟨11-20⟩ texture component becomes dominant with a maximum intensity close to 5 m.r.d. Interestingly, after 60 min of annealing time, the ⟨20-21⟩ texture component reappears, resulting in two weak maxima at the ⟨20-21⟩ and the ⟨11-20⟩ component. As mentioned above, the weld seam is textured much stronger in the as-extruded state even though the underlying characteristic remains the same as in the weld-free region. The heat treatment leads to a continuous weakening of the ⟨20-21⟩ texture component with the promotion of the ⟨11-20⟩ texture component after 20 min, as it can be observed for the weld-free sample after 60 min. Further annealing leads to intensive selective grain growth and the texture becomes dominated by the sub-textures of a very few large grains oriented featuring the ⟨10-10⟩/⟨11-20⟩ or close to the ⟨10-14⟩/⟨11-26⟩ direction aligned parallel to the extrusion direction.
Generally, the RE texture component in the ME21 alloy is known to be promoted during heat treatment, whereby the kinetics of texture evolution accelerate with higher temperatures [19,20,21]. In contrast, in this study, the evolving textures differ from those observations. Instead of promoting the ⟨11-21⟩—RE component, we observe that the ⟨11-20⟩ texture component along with the ⟨20-21⟩ becomes prevalent after 20 min and 60 min for the weld seam and weld-free samples, respectively. In addition, the kinetics of grain growth are significantly accelerated compared to the previous studies on ME21 heat treatments, which can be observed especially in the weld seam. This may be related to different strain paths in the porthole die. Here, after 60 min, grain growth was much more advanced in comparison to the long-term heat treatments of up to 100 h in the case of Reference [19] or even 24 h [19,20,21], resulting in a total conversion of the initial texture. Therefore, in Figure 8, grains bigger than 30 µm are isolated in respective inverse pole figure maps of 1 h annealed samples and the texture of these grains and of those which feature grain sizes smaller than 15 µm as well as grains in the size range of 15–30 µm are plotted separately. Despite the findings of Lentz et al. [27] where small as well as large grains showed similar texture components, we rather observe that the promotion of the ⟨20-21⟩ RE texture component is associated mainly with the grain size below 15 µm in the weld seam and above 30 µm in the weld-free material, whereas the fraction of large grains does not feature the RE texture component. Thus, in the weld seam, these large grains (d > 30 µm) dominate the overall texture and feature the previously mentioned ⟨10-10⟩/⟨11-20⟩ and ⟨10-14⟩/⟨11-26⟩ texture components. In the weld-free region, large grains are oriented in the ⟨20-21⟩ direction parallel to the ED. The different material behavior during heat treatment of ME21 round bars in Reference [27] and extrusion weld seams of the same alloy is associated with the deformation history. While the initial grain sizes are almost equal in these cases, the strain path and its length are markedly different when the material is extruded through a porthole die. In this case, the distance between the billet face and entrance into the bearing channel is approximately 100 mm.

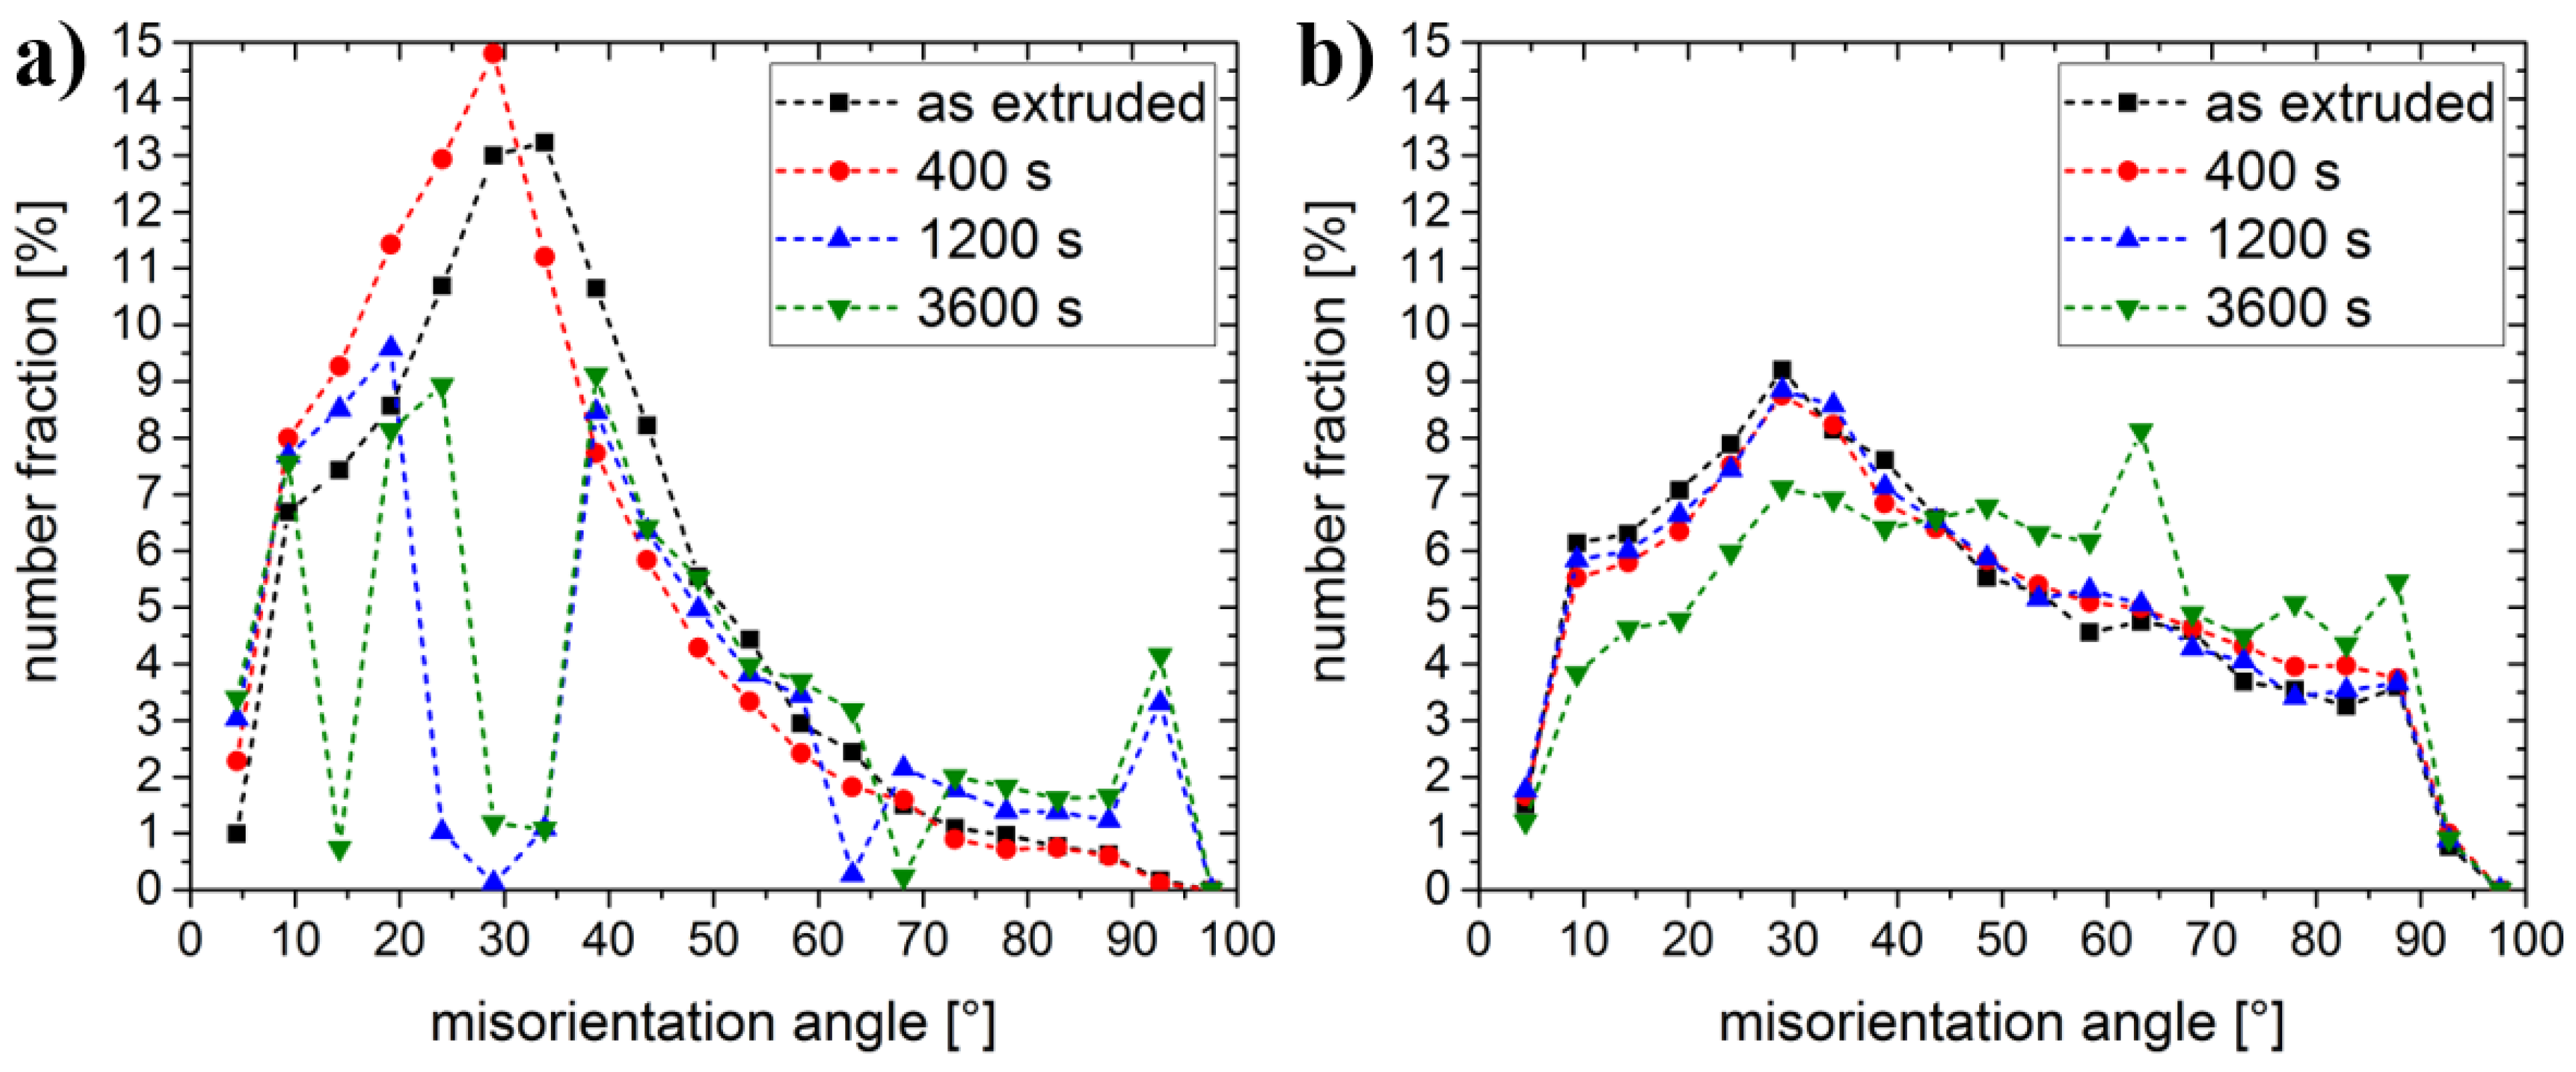
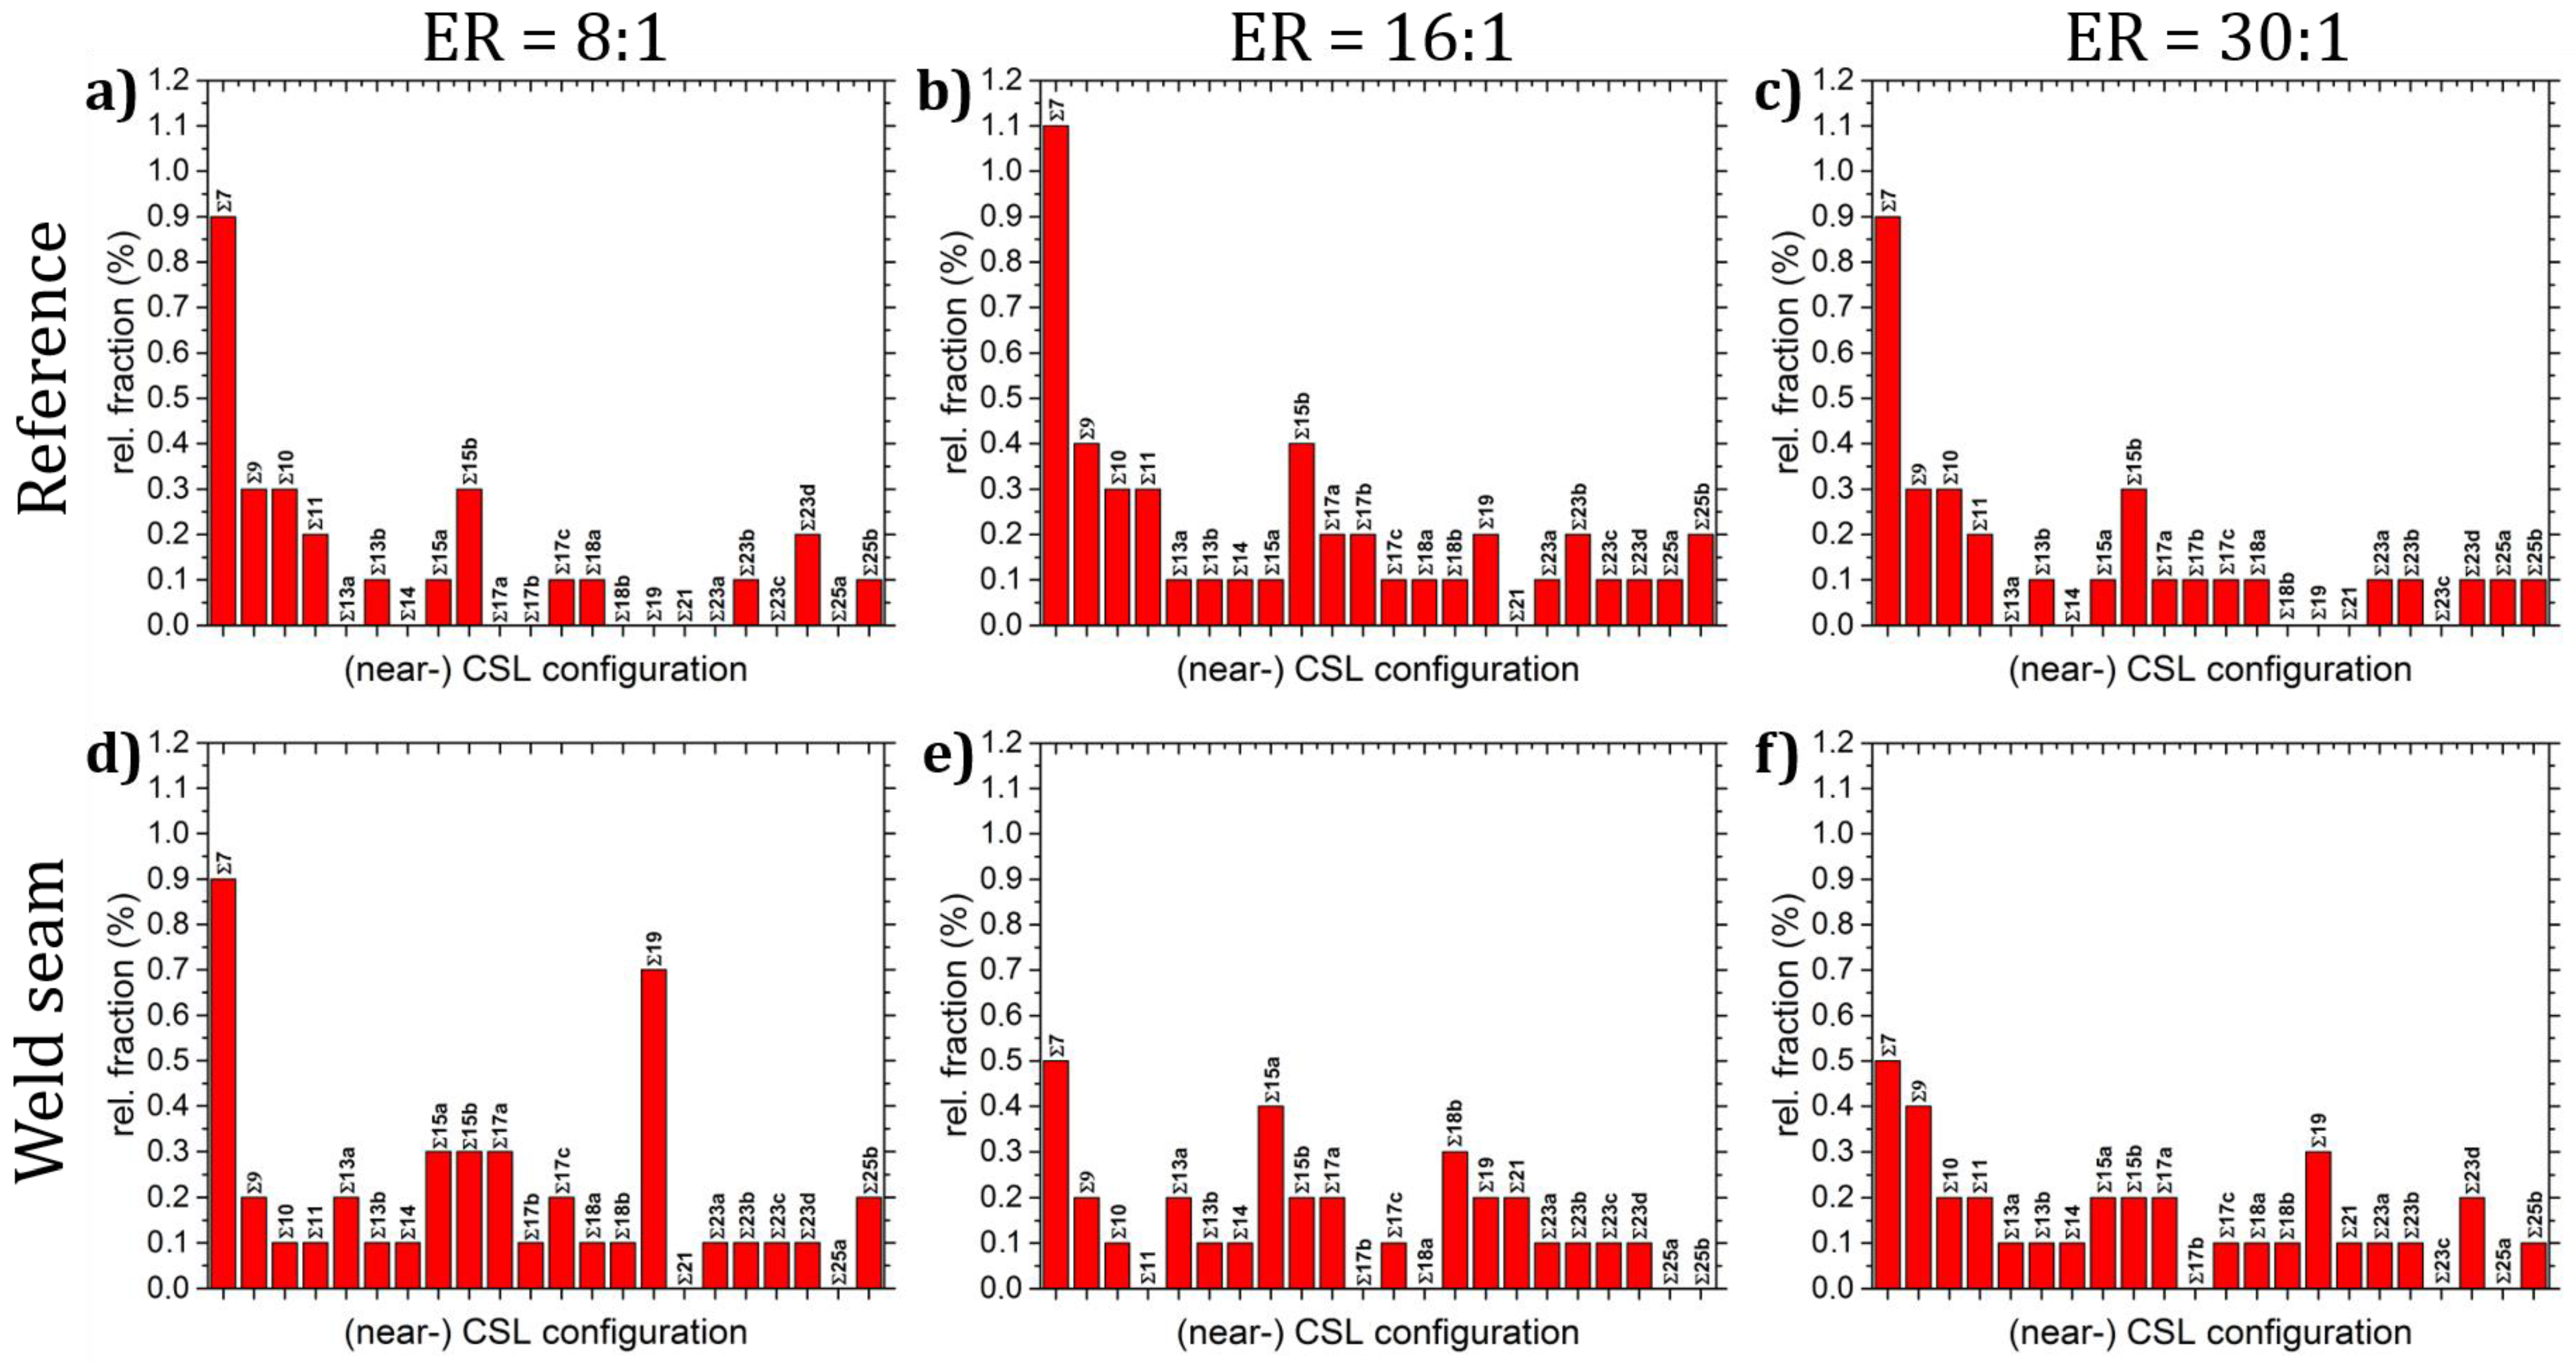
3.3. Grain Boundary Analysis

As pointed out in the beginning, the microstructure of the weld seam extruded at different extrusion ratios was very similar from the aspect of grain size. Yet, the response to the heat treatment was remarkably different in that no change in microstructure was observed for the higher ER and rapid preferential grain growth that occurred for the lower ER, at least during short time annealing. Since the driving force for grain growth depends strongly on the grain boundary energy (GBE), the amount of stored energy within grains and also on the grain size and misorientation distribution [24], we attempt to characterize the weld seams in this respect.
From Figure 9, it becomes clear that considerably more grains in the weld seam of ER = 8:1 extruded profiles exhibit high internal misorientation compared to those of the other weld seams, meaning that the extrusion process and possibly the subsequent cooling led to a number of highly deformed grains despite the DRX process. The higher grain orientation spread (GOS) values in the weld seam of ER = 8:1 may be a result of the low extrusion ratio and, hence, degree of deformation, that is then insufficient to facilitate complete DRX. The maximum grain orientation spread (GOS) value in the EBSD mappings of the weld seam of the ER = 8:1 profile was about 6.5°, while, in the other weld seams, values of around 5° were determined, but, in all cases, the internal grain misorientation axis analysis revealed prismatic dislocations as the most abundant in the highly disoriented grains (not shown here). One interesting observation with regard to GOS values can be made when textures are calculated based on specific grain fractions, as seen in Figure 10. In the weld seam of the profile with the lowest ER grains with very low GOS values (Figure 10a), only a small portion feature the RE texture while most grains predominantly have a ⟨11-20⟩ orientation. It is the latter fraction that dominates GG over the RE-textured grain fraction, which, in turn, are characterized by a higher amount of stored energy, seen in Figure 10b. From that, the direction of grain growth in the weld seam is assumed to occur from the ⟨11-20⟩ grains into the RE grains rather than into grains with any other orientation, i.e., ⟨10-10⟩.
The fact that, in all cases, highly deformed grains exist but only in the weld seam of the lowest ER, a change in microstructure after heat treatment is observed, suggesting that a deformed grain alone cannot be responsible for the initiation of AGG, at least during short-time annealing. The recrystallized microstructure of RE containing alloys after hot deformation usually displays a peak around 30° in the misorientation angle distribution. All of the three weld seam microstructures feature such a peak but with different intensities. There is also a remarkable difference in the fraction of boundaries with misorientation angles above and below 50°. Therefore, both weld seams with higher ERs display a higher fraction of >50° high angle boundaries than the weld seam of the lowest ER. It is assumed that those high angle grain boundaries (HAGB) are less mobile [24]. A rough estimate as the fraction of 30° boundaries decreases the fraction of HAGB increases with a growing overall strain. Furthermore, it is reported that 30° twist-and-tilt boundaries correspond to energy minima and are highly mobile [25].
As a result of the modified texture, there are also changes in misorientation distributions (Figure 11). The proportion of approximately 30° grain boundaries in the reference area decreases drastically after a dwell time of 1200 s. After 3600 s, there is also a significant drop in the number density of grain boundaries with about 13–14° misorientation. This directly suggests that these grain boundaries have an increased mobility over others. Reference [37] calculates an energy minimum for grain boundaries with misorientation of 30° and conclude that these grain boundaries are more mobile. A comparable reduction of the 30° grain boundaries is not found in the weld seam despite the much more pronounced grain growth. However, a decrease in the proportions of grain boundaries with misorientation below 45° and, simultaneously, an increase in the proportions above 45° after a dwell time of 3600 s is calculated. In addition, a local minimum of the misorientation distribution occurs in the reference area at about 65° and, in the weld seam within this misorientation range, a local maximum is calculated. In both cases, local maxima are also detected in the angular range at around 90°. These local peaks could also be indicative of higher and lesser boundary mobility, but, for these angles, no information regarding such features is available in the literature. It can be concluded that a higher amount of deformation work, i.e., strain through an increasing extrusion ratio and frictional work, influences the mobility of certain grain boundaries. Additionally, grain growth behavior is directly connected to the movement of grain boundaries.
Known for many years and still in debate is the topic of “special boundaries,” especially here with the focus on boundary mobility. Special boundaries or coincident site lattice (CSL) boundaries often serve as a simplified tool for the characterization of the microstructure and an indicator for the energy state of the overall boundary network, i.e., CSL may have low grain boundary energies (GBE) [38]. Possible CSL and near-CSL (depending on the exact c/a ratio) configurations of Magnesium boundaries can be found elsewhere [39,40]. The calculation of these boundaries was performed using Brandon’s criterion [41]. Based on the assumption that CSL have low GBE and, thus, are highly mobile because of the thermodynamically driven process to promote a state of low energy, it seems reasonable to examine the CSL and near-CSL distributions of the weld seam microstructure (Figure 11). In all three cases, the highest number fraction exists for Σ7 (axis/angle pair [0001]/21.79°) while most of the other possible configurations have significantly lower number fractions and, thus, are not included in the discussion. As mentioned before, Σ7 boundaries represent the single highest number fraction of all configurations and possess perfect coincidence because the [0001] rotation axis is parallel to the c-axis and, therefore, independent of the c/a ratio. The weld seam material of ER = 8:1 profiles exhibits a significantly higher number fraction of Σ7 (0.9%) than the two other samples, which have comparably lower fractions of Σ7 among one another (0.5%). In addition, the high fraction of Σ19 misorientations in the ER = 8:1 weld seam stands out. These are also in perfect coincidence having a 13.7° rotation about the [0001] axis and are considered a low angle boundary with reasonable high mobility compared to high angle boundaries. It is these two configurations that possess a considerably higher number fraction in the lowest ER weld seam and are thought to contribute to the higher fraction of misorientation angles of <30° in Figure 12b. Nevertheless, these relationships merely serve as an indicator of what might trigger the excessive grain growth in the ER = 8:1 weld seam while a change in the grain structure of the two other specimens cannot be observed. It is clear that, on the basis of the analyses in Figure 7 and Figure 8, the tendency of the weld seam from the ER = 8:1 profile to produce such a coarse-grained microstructure after annealing can be supported by the high internal grain misorientation coupled with the presence of an increased number of mobile boundaries. Reference [27] also reported on an increased number density of Σ19 boundaries in equal channel angular pressing (ECAP) processed AZ31. ECAP as a severe plastic deformation process may produce similar microstructure features, such as boundaries, which are also characterized through a high amount of plastic deformation caused by the friction or shear.

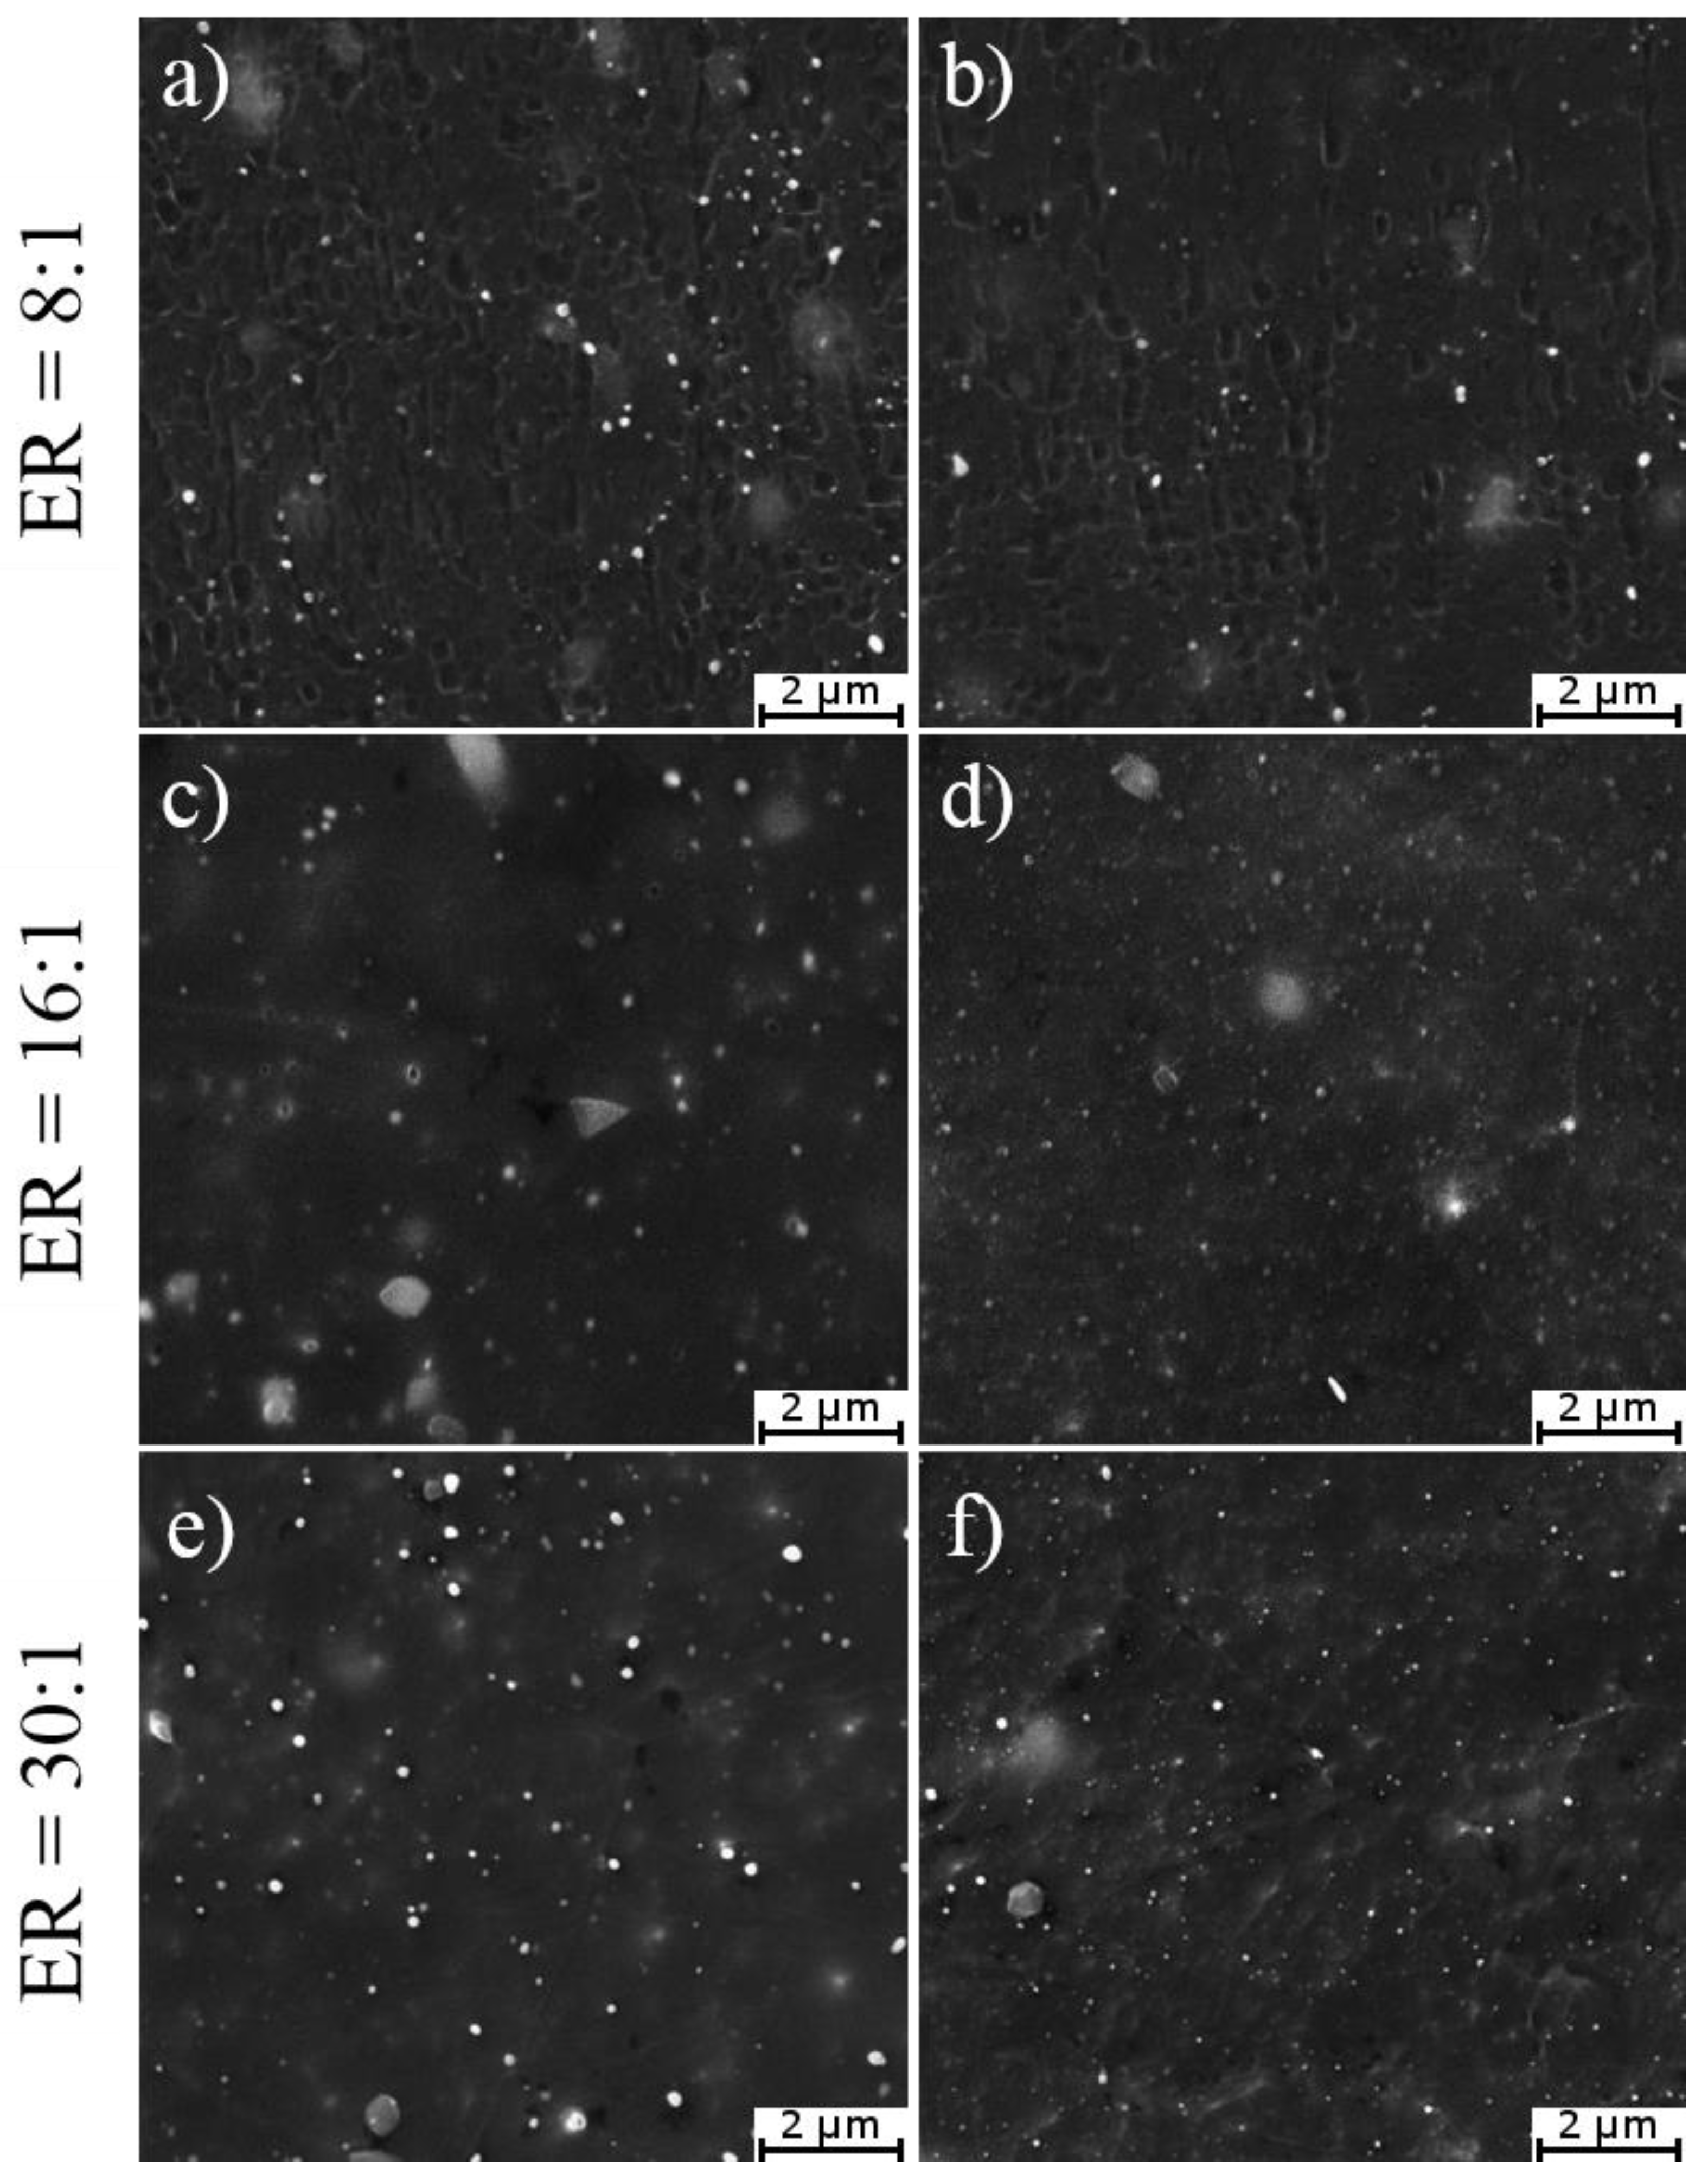
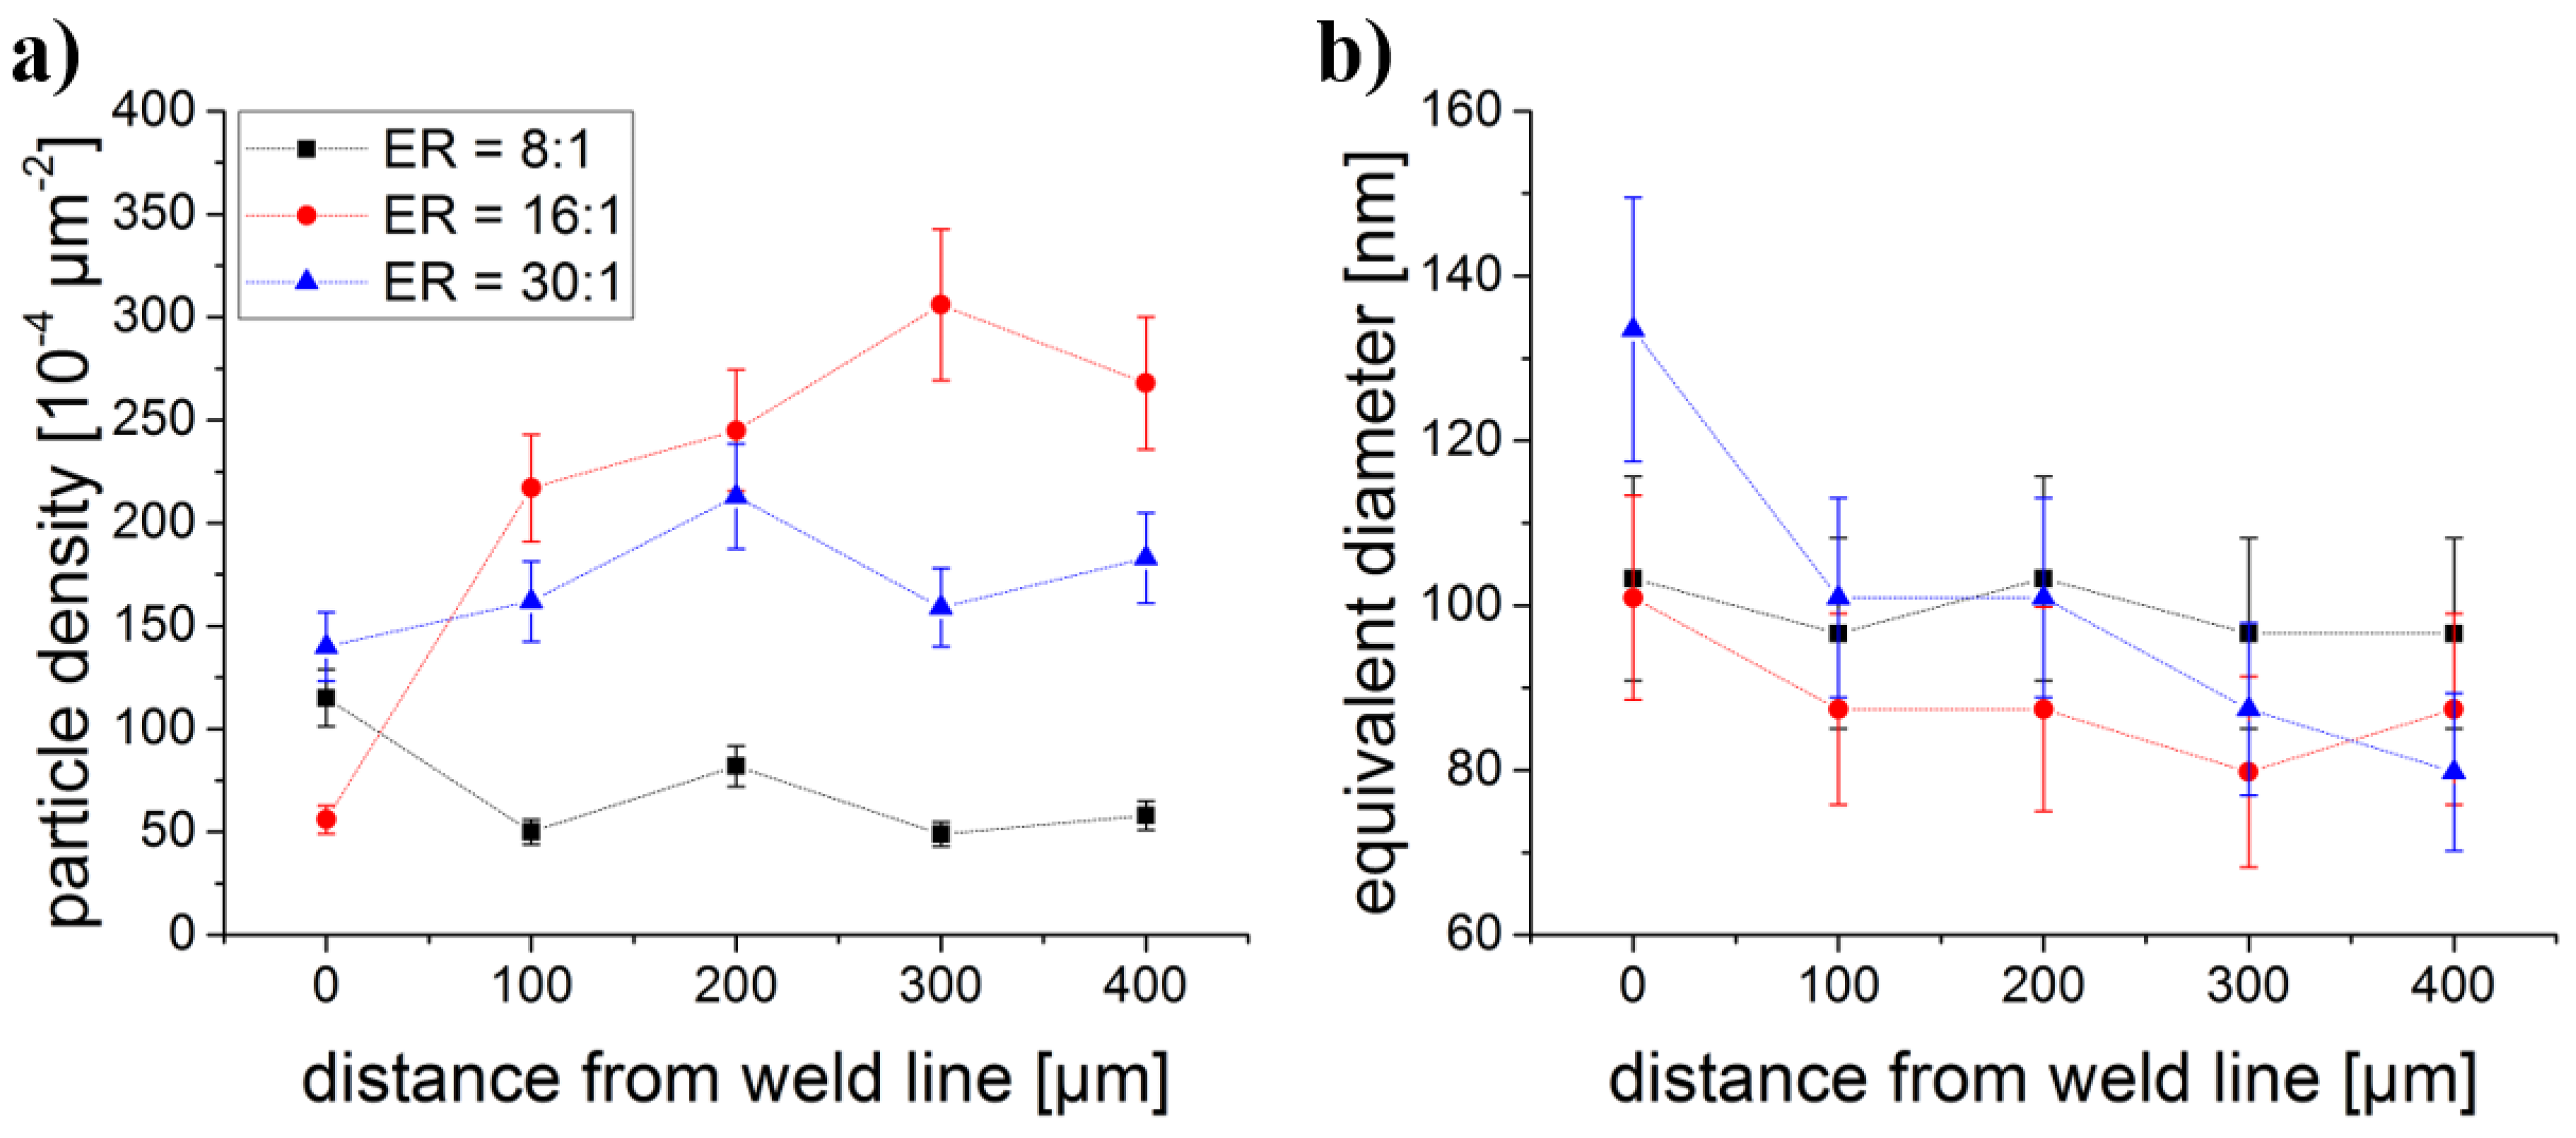
3.4. Particle Analysis

In addition to the analysis of the grain boundaries within the weld seam, the size and distribution of intermetallic particles in that particular area were investigated since the effect of particles pinning the movement of grain boundaries might contribute to the dissimilar behavior of the material during heat treatments. This mechanism, also known as Zener-pinning, is based on the assumption that particles of certain sizes and distribution in the matrix exert a net drag pressure on a grain boundary and, thus, hinders its movement. For all weld seam areas investigated in this work, a fully recrystallized microstructure is observed. It can, thus, be assumed that changes in the microstructure during static annealing results from movement of grain boundaries rather than from the effect of particle stimulated nucleation of recrystallization, which is why larger particles were excluded from this analysis.
SEM images taken at 10,000× magnification were used to evaluate the particle distribution and to measure the size of intermetallics in the matrix. Considering the Zener-pinning mechanism, the analysis of particles was focused on the sub-micron scale. Therefore, particles having equivalent diameters between 50 nm and 150 nm were taken into account according to findings of Reference [42] on a binary MgMn alloy. These measurements were performed on images taken at five different positions in the weld seam area, namely, directly at the weld line and in four steps of 100 microns moving away from the weld line, which covers the area scanned by EBSD. Figure 12 illustrates the distribution of intermetallics in the as-extruded condition at the weld line (Figure 12a,c,e) and in distance of 400 µm to the weld line (Figure 12b,d,f). EDS analysis confirmed Ce-rich and Mn-rich particles whereby the size of Mn-dispersoids is smaller than that of the Ce-rich intermetallics as reported in previous publications [20,21]. In the weld line area, the samples exhibit some differences in the particle density, particularly in the case of ER = 16:1. Fewer particles with concurrently larger sizes are observed. Moving away from the weld line yields finer dispersion of particles in the case of the two higher extrusion ratios, but not for the small extrusion ratio. In the latter case, no significant change in the distribution can be seen. These observations are substantiated by the measurements of the particle density in Figure 13a. For the small extrusion ratio, the particle density tends to decrease when moving away from the weld line whereas a significant and a minor increase of the particle density is found for ER = 16:1 and ER = 30:1, respectively. On the other hand, the average size of those intermetallics is between 90 nm and 110 nm for all extrusion ratios, except for the weld line area. In conclusion, all three samples yield different particle densities, which, in theory, can influence the material behavior during heat treatments. The fact that the ER = 8:1 sample displays the lowest measured particle density in combination with the findings on stored energy and the grain boundary characteristics supports a possible explanation why the heat treatment introduced the observed change in this particular sample in the form of AGG. In contrast, the two samples with the higher extrusion ratios exhibit a stable microstructure characterized by a fewer number of grains with high GOS values (see Figure 8). The reason for that may be found in the deformation history with respect to the die geometry. In the deformation zone in front of the bearing channel, the amount of deformation work declines with a decreasing extrusion ratio. Furthermore, the strain path of the material that enters the profile in the middle of the wall thickness changes with the extrusion ratio. In the case of the small extrusion ratio, this translates into higher stored energy in the friction zone alongside the bridges accompanied by lesser deformation work in the deformation zone, which, in total, could lead to a higher amount of stored energy available for meta-dynamic softening processes. In that case, the opposite would apply to the profiles extruded at higher extrusion ratios whereby a threshold of the amount of stored energy should exist between the small ER and the two higher ERs. The fact that the weld-free material of the ER = 8:1 profiles show some grain growth while the weld-free samples do not (as equal to their weld seam counterparts) suggests that the difference in the amount of work in the deformation zone plays a more important role than the difference in the friction induced shearing at the bridges.

4. Conclusions

Within the present study, the kinetics of grain structure evolution and accompanied texture modification were investigated in extruded hollow profiles of a magnesium RE alloy. Weld-free as well as weld-seam containing material has been characterized and the conclusions can be drawn as follows:
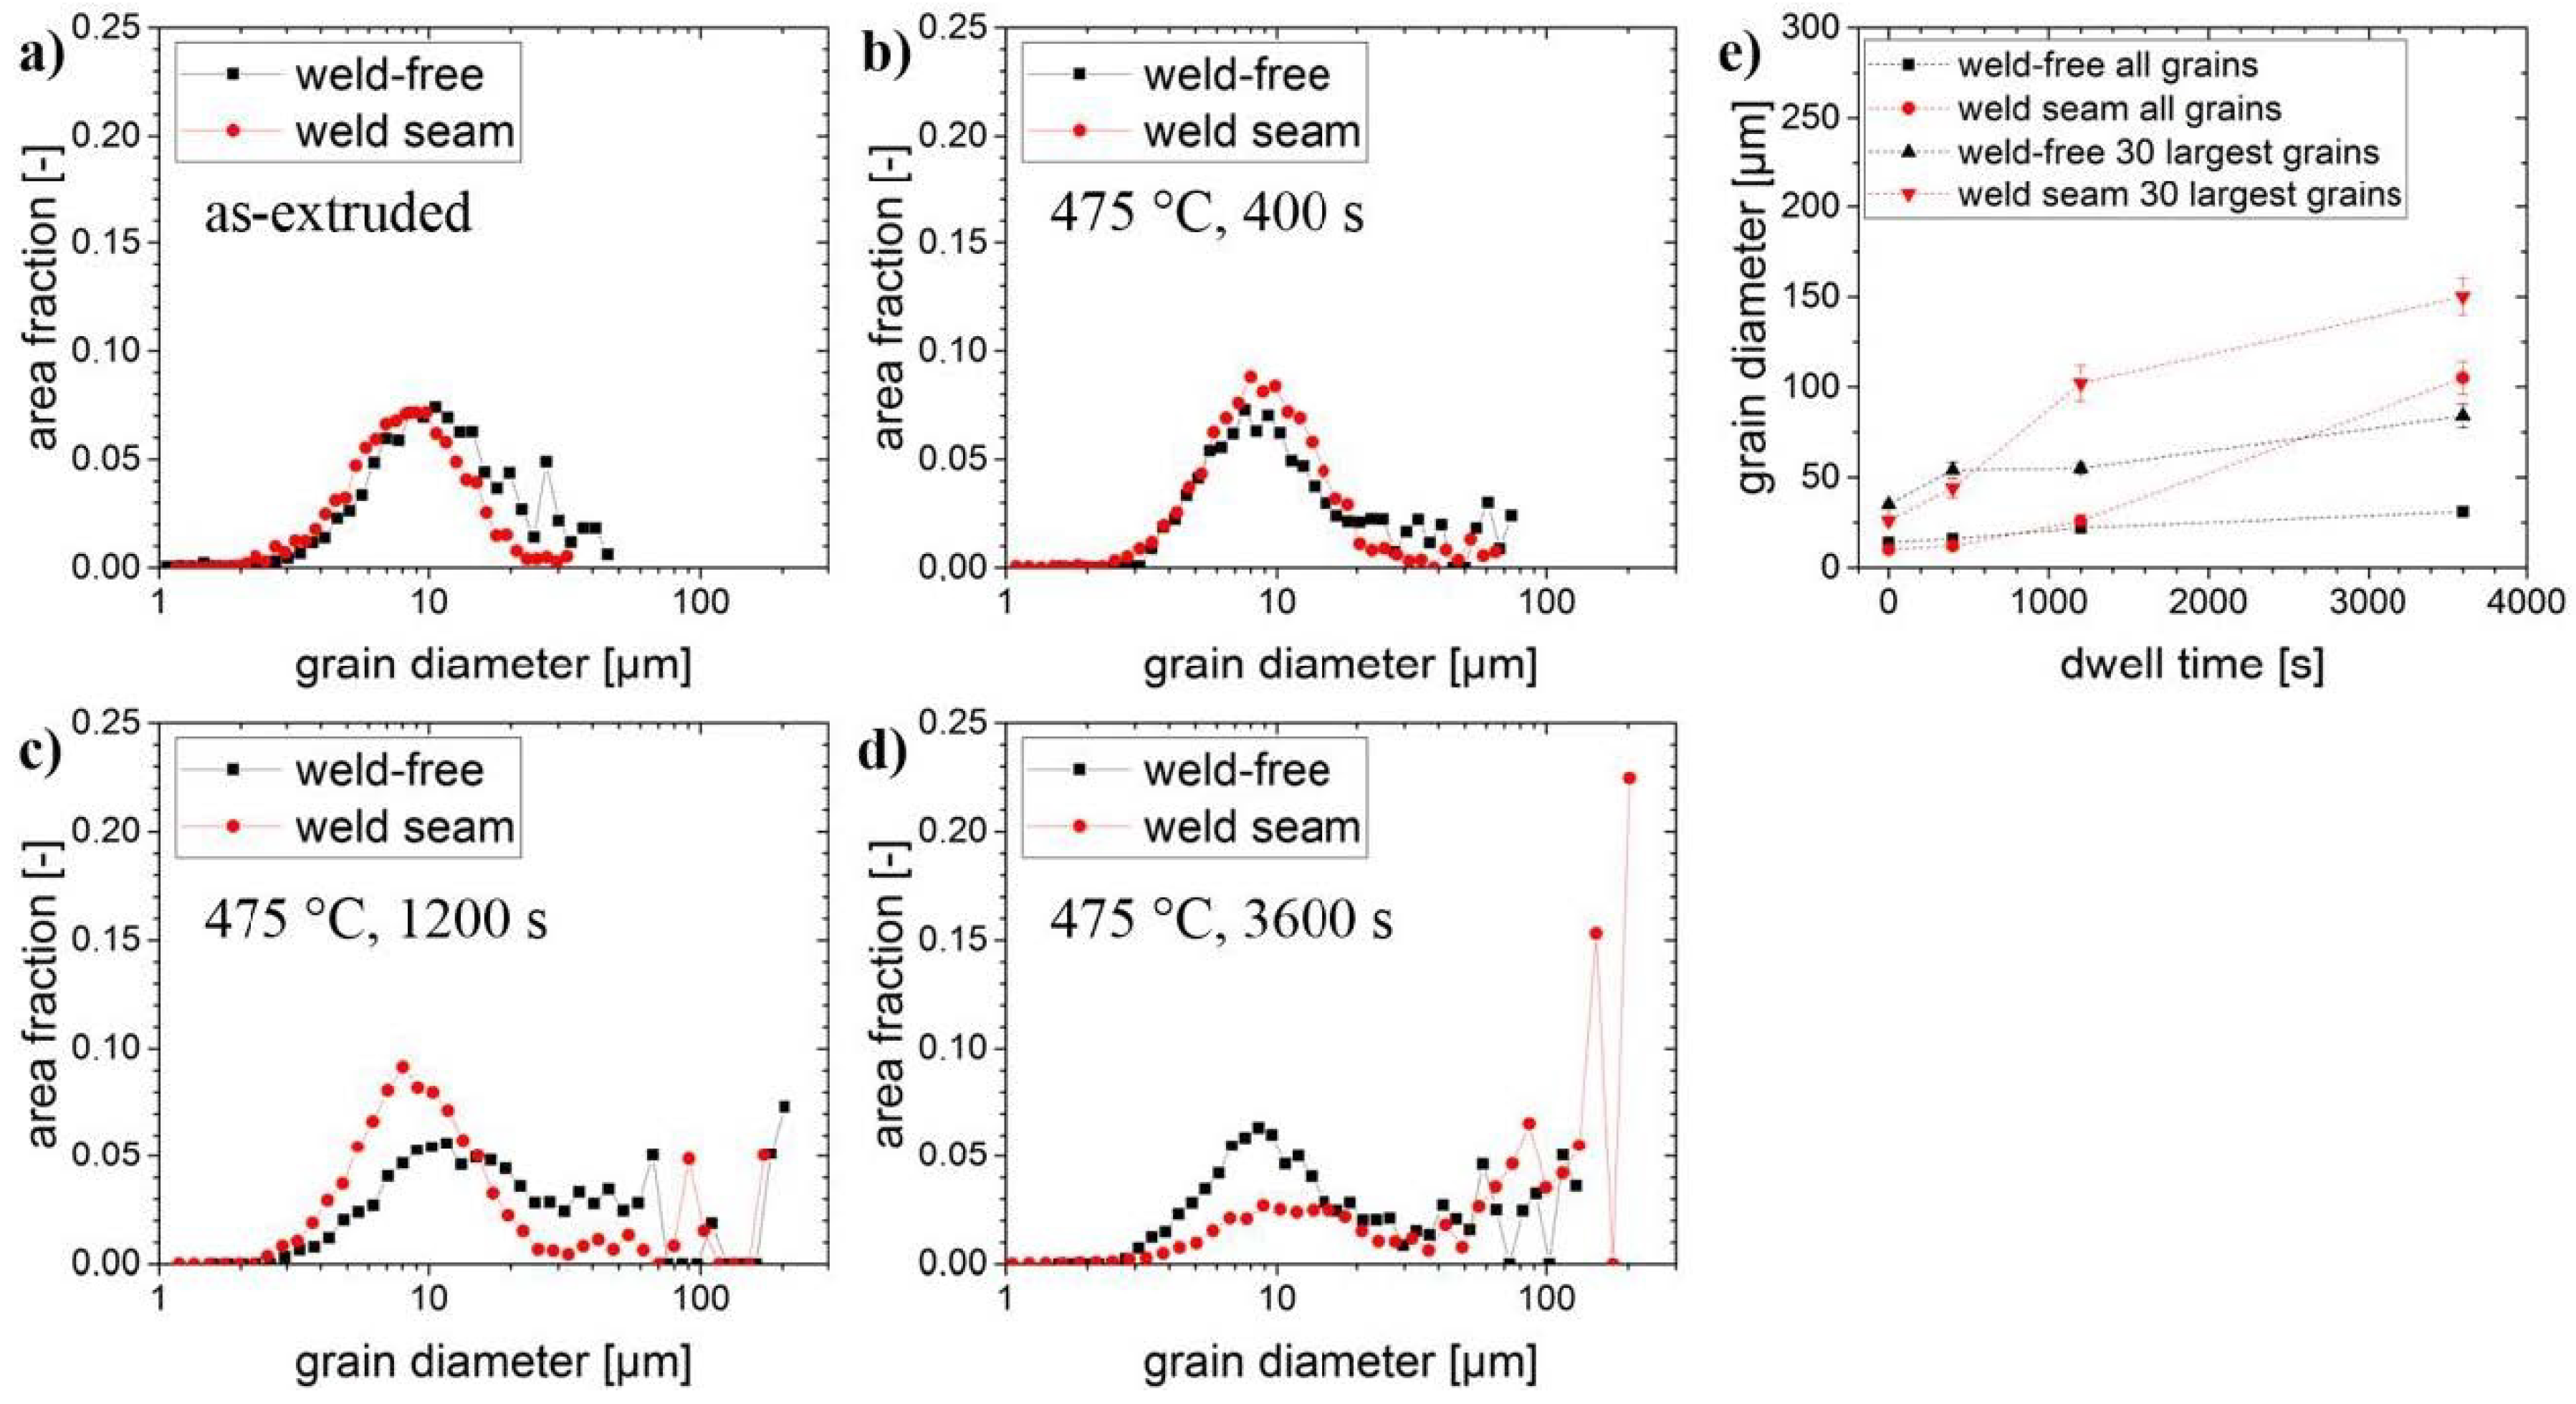
  • Short time heat treatment at 475 °C only had an effect on the microstructure and texture of hollow profiles extruded at an ER = 8:1. Hereby, selective grain growth was the main mechanism for the change in the microstructure.
  • The weld-free material of ER = 8:1 profiles consisted of a bimodal microstructure before heat treatment. That character did not change during heat treatment while some grains showed preferential grain growth during which the 30° HAGB were highly mobile and eventually disappeared as a result of GG.
  • On the other hand, a homogeneous microstructure was formed in the weld seam, which was almost totally consumed by AGG after a heat treatment for one hour at 475 °C. The material flow in the porthole die, which leads to the formation of the weld seams completely altering the alloys behavior during heat treatments and has a high sensibility toward factors, such as degree of deformation, strain rate, and temperature evolution.
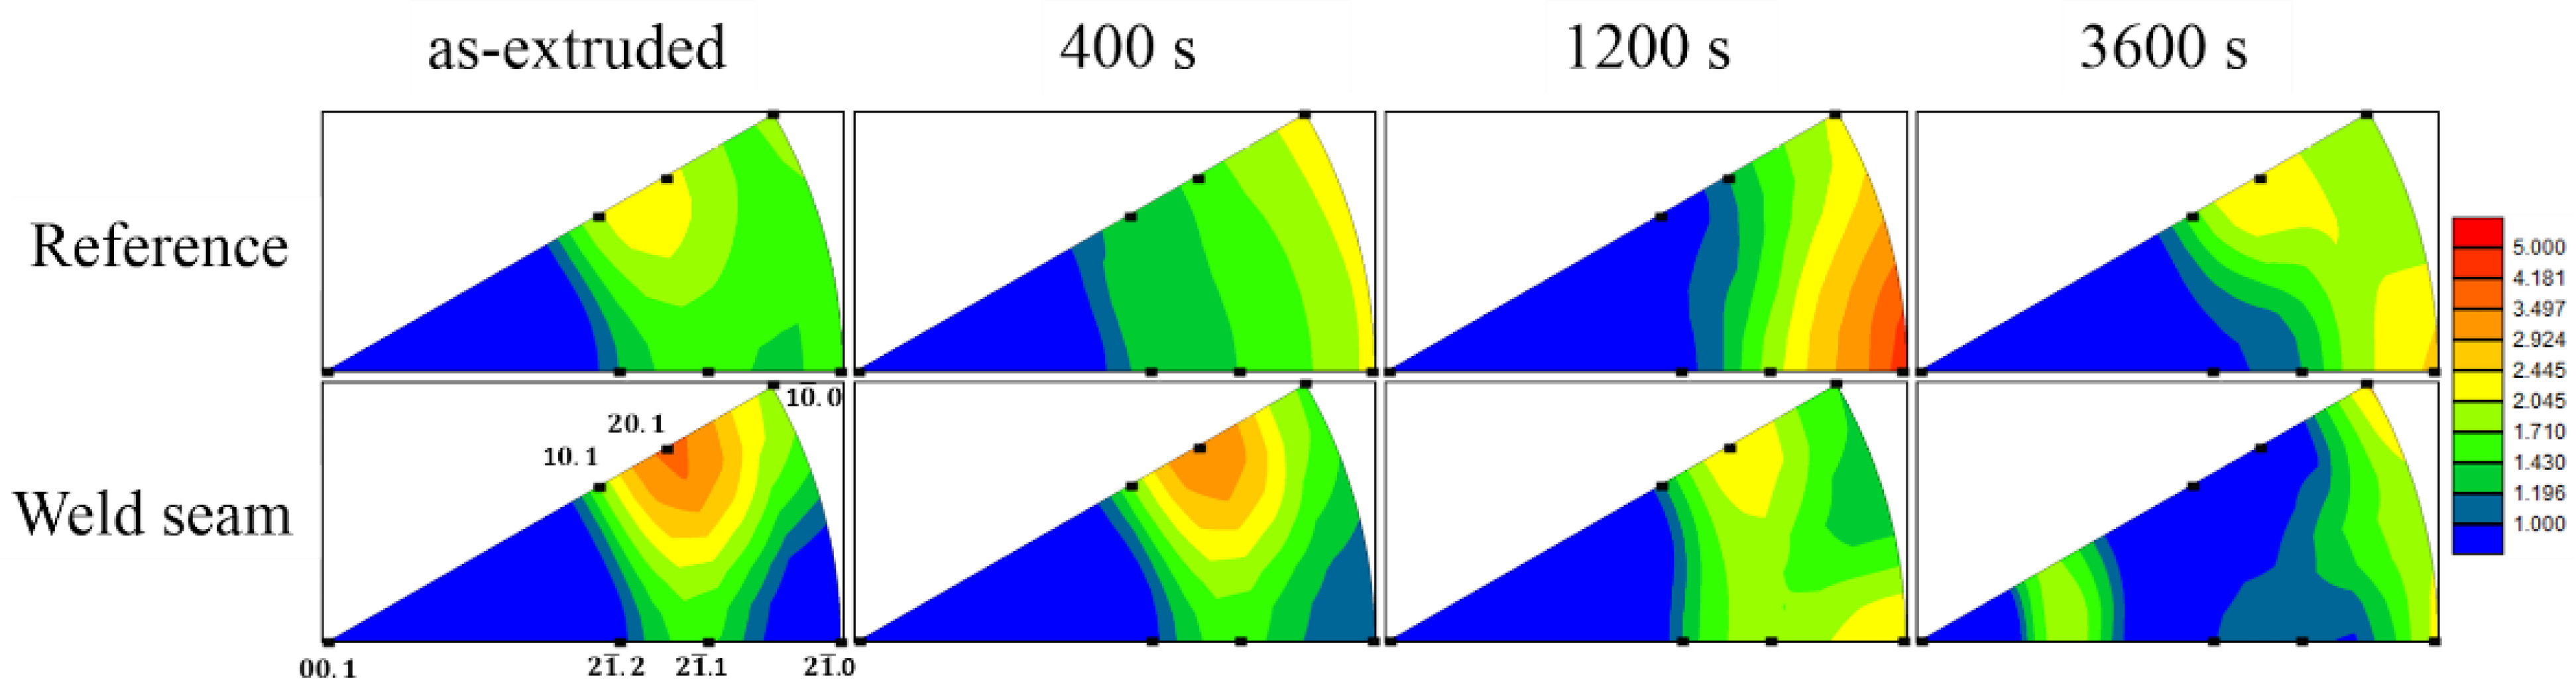
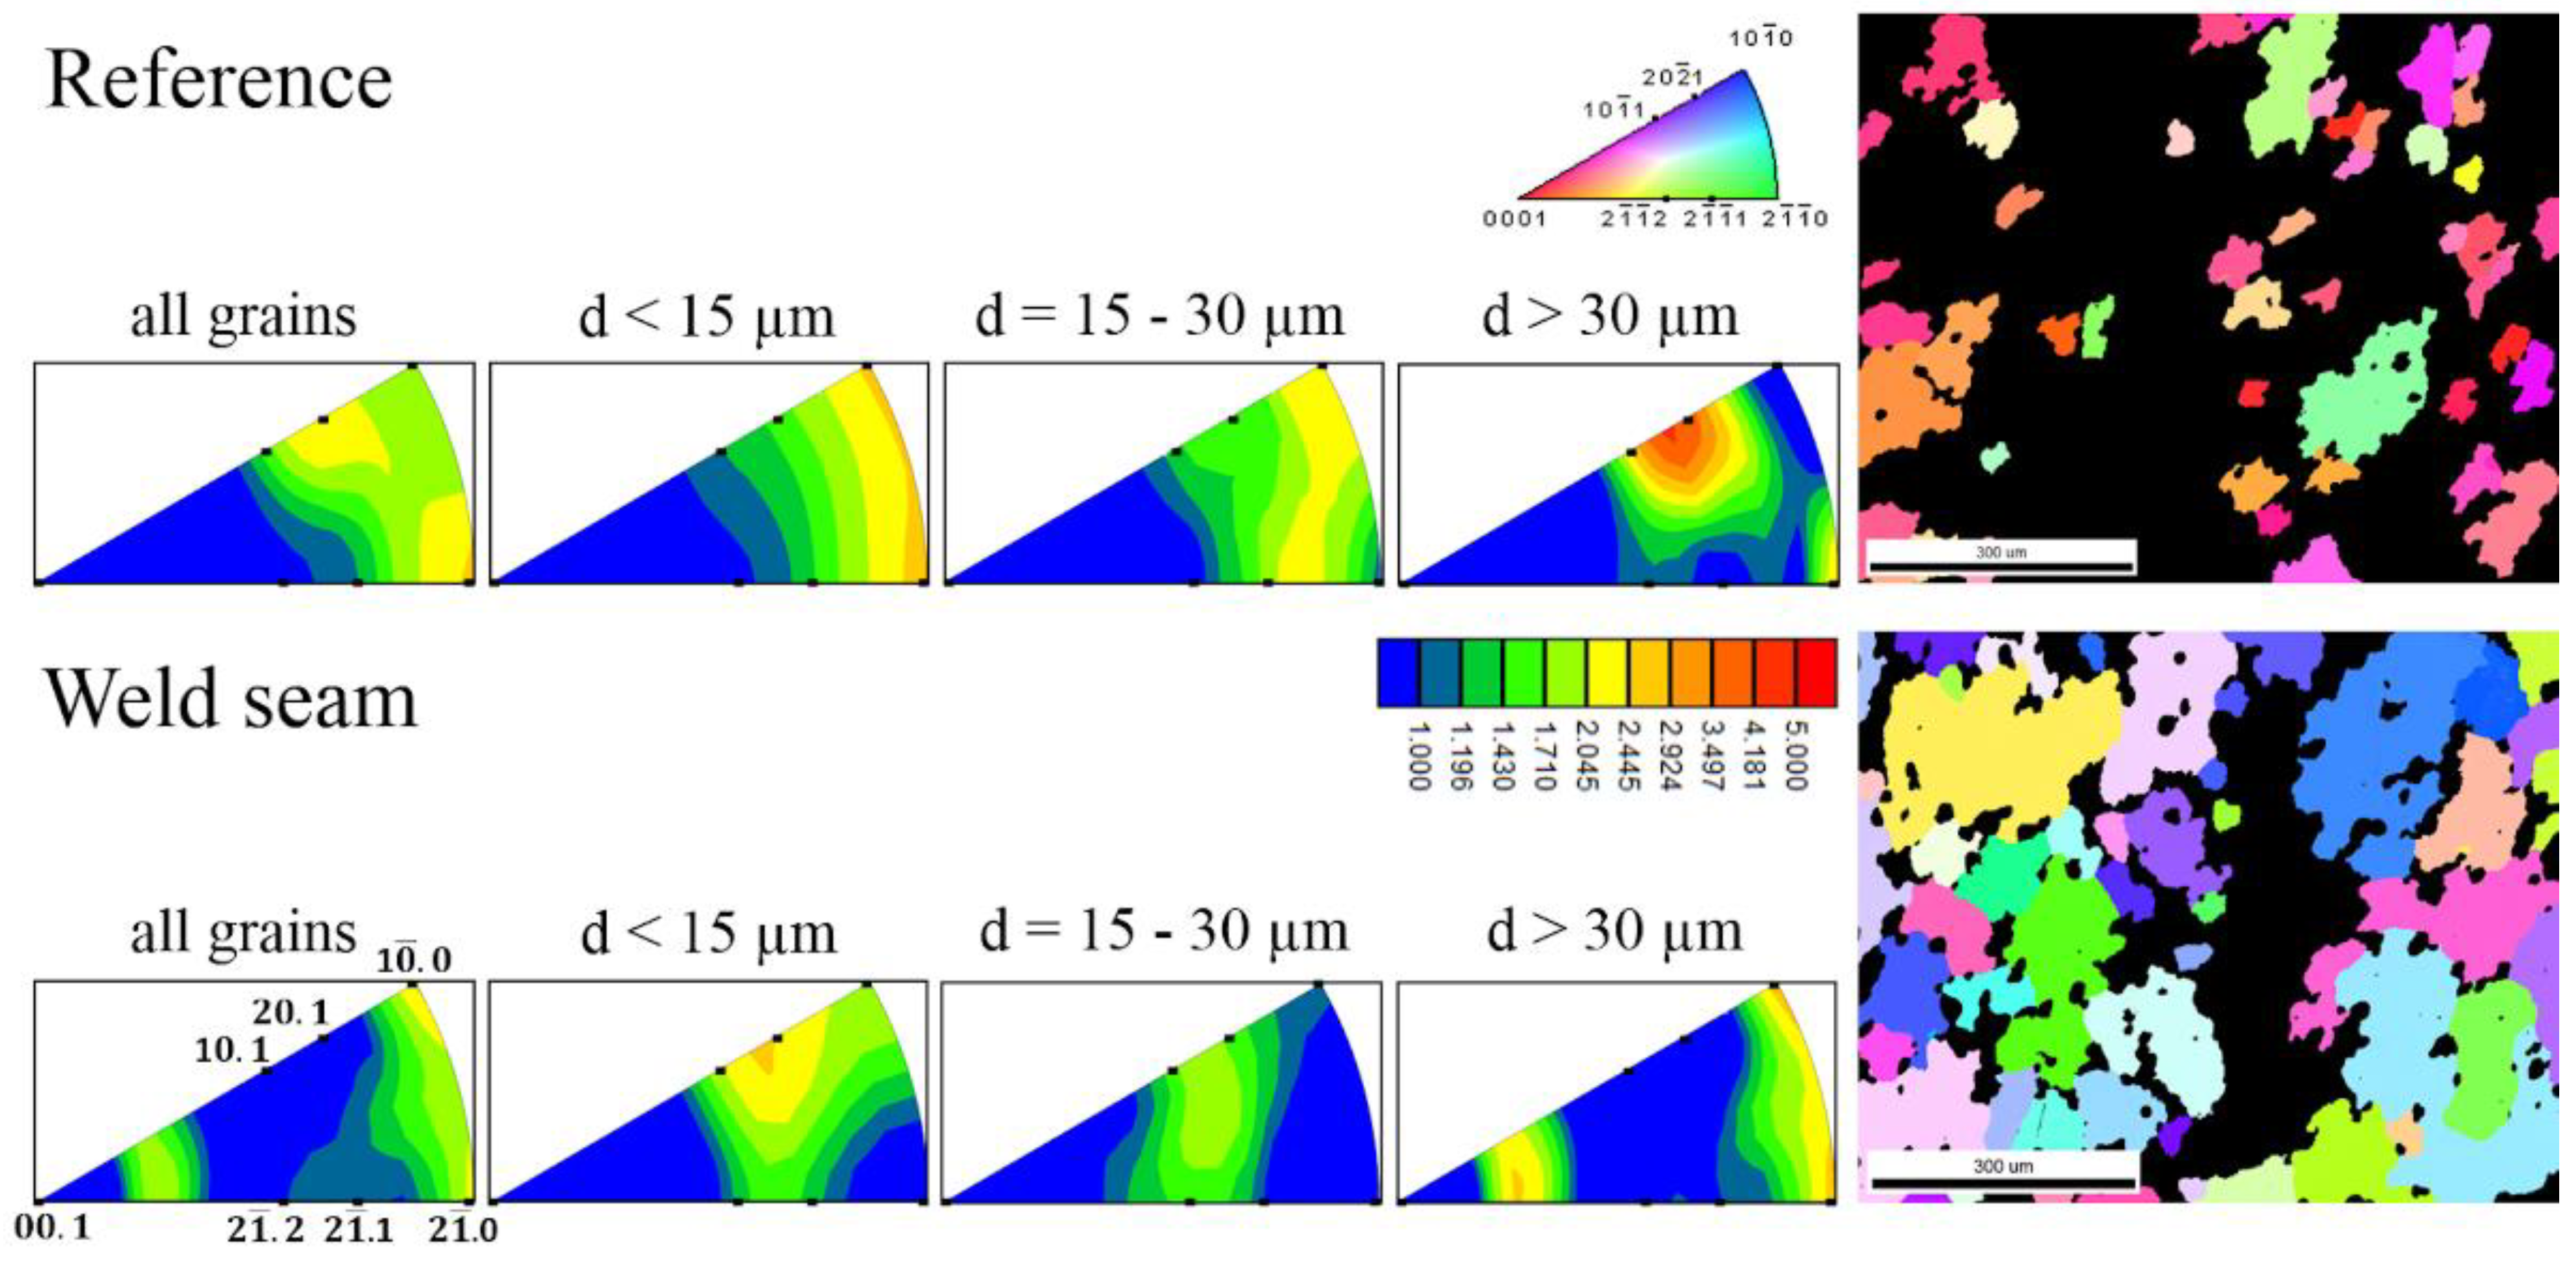
  • The micro-texture evolution of weld-free and weld-seam material differs from one another. The initial ⟨11-21⟩ RE and the ⟨20-21⟩ texture components in the weld-free area were subjected to a series of changes during the dwell time until, after 60 min, the ⟨20-21⟩ and the ⟨11-20⟩ were still the dominant components, whereby the grain growth favors the formation of the RE component. In a different manner, the starting RE texture in the weld seam was transformed into a ⟨10-10⟩/⟨11-20⟩ double-fiber texture. In addition, a component close to the ⟨10-14⟩/⟨11-26⟩ direction appeared. Both of these components are attributed to the abnormal growth of very few grains, which overtook most of the initial microstructure after 60 min at 475 °C heat treatment.
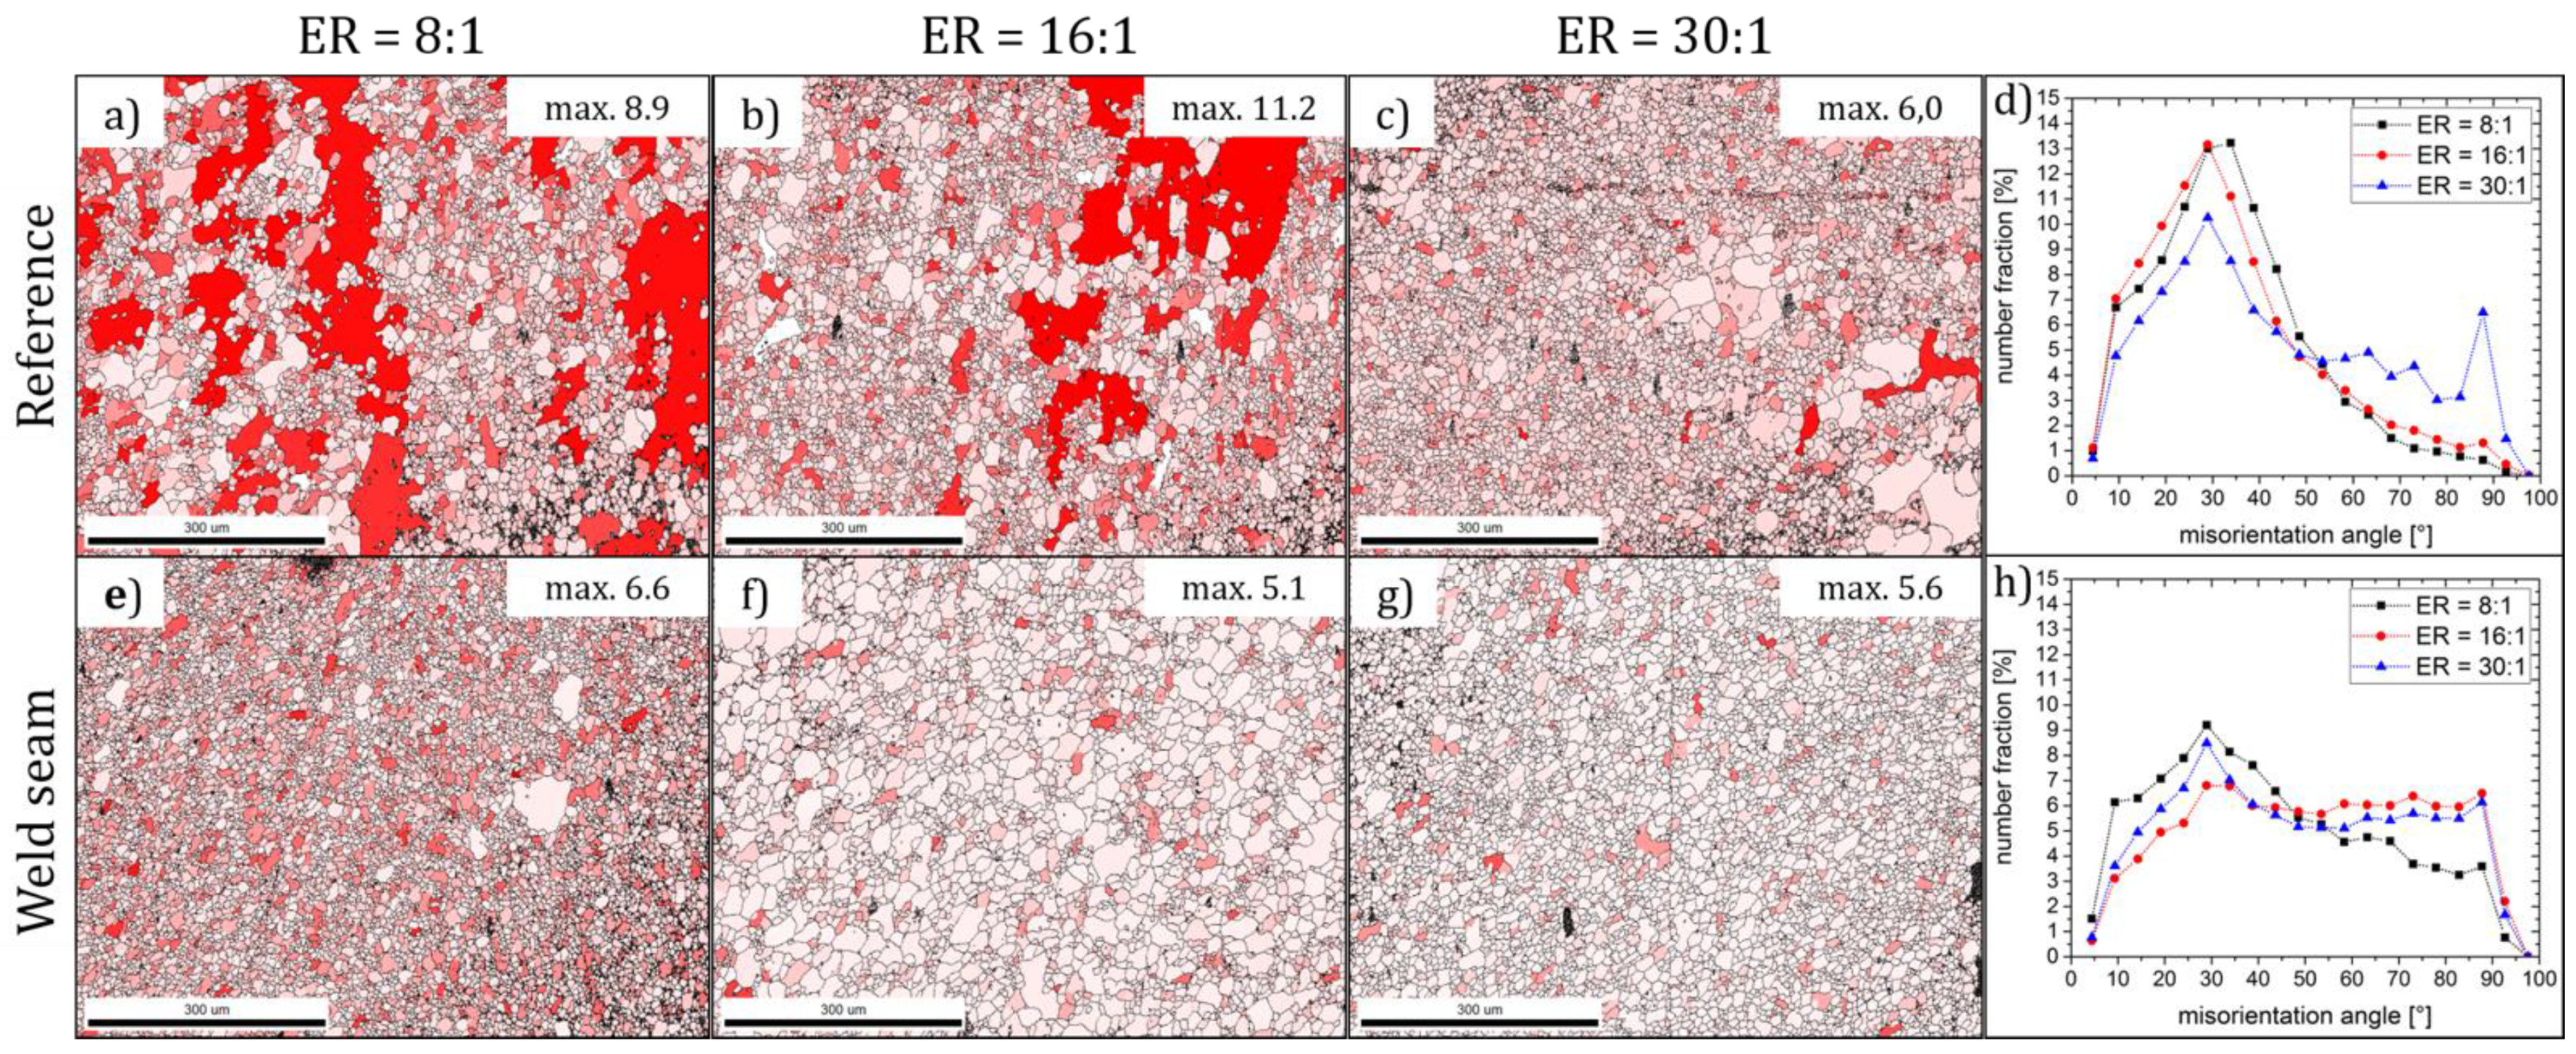
  • EBSD investigation of the weld seam material of all three extrusion ratios revealed differences in the amount of stored energy and also the grain boundary ‘character,’ which serve as a possible explanation for the different material behavior during short time-heat treatments in a way where the suppression of the formation of mobile boundaries in the case of higher extrusion ratios stabilizes the microstructure. Furthermore, Zener-pinning pressure in the samples differs based on a variation of intermetallic particle densities found in the three weld seams, which influences the thermal stability of the grain structure.

Author Contributions

Investigation, F.G., S.L. and C.F.; Supervision, S.M.; Writing—original draft, F.G.; Writing—review & editing, S.G. and S.M. All authors have read and agreed to the published version of the manuscript.

Funding

The authors are grateful for the financial support of the Deutsche Forschungsgemeinschaft (DFG) under the contract no. MU 2963/11-1.

Institutional Review Board Statement

Not applicable.

Informed Consent Statement

Not applicable.

Data Availability Statement

The data presented in this study are available on request from the corresponding author.

Conflicts of Interest

The authors declare no conflict of interest.

References

  1. Al-Samman, T.; Li, X. Sheet texture modification in magnesium-based alloys by selective rare earth alloying. Mater. Sci. Eng. A 2011, 528, 3809–3822. [Google Scholar] [CrossRef]
  2. Hantzsche, K.; Bohlen, J.; Wendt, J.; Kainer, K.U.; Yi, S.B.; Letzig, D. Effect of rare earth additions on microstructure and texture development of magnesium alloy sheets. Scr. Mater. 2010, 63, 725–730. [Google Scholar] [CrossRef]
  3. Bohlen, J.; Nürnberg, M.R.; Senn, J.W.; Letzig, D.; Agnew, S.R. The texture and anisotropy of magnesium–zinc–rare earth alloy sheets. Acta Mater. 2007, 55, 2101–2112. [Google Scholar] [CrossRef] [Green Version]
  4. Mackenzie, L.W.F.; Pekguleryuz, M.O. The recrystallization and texture of magnesium–zinc–cerium alloys. Scr. Mater. 2008, 59, 665–668. [Google Scholar] [CrossRef]
  5. Mishra, R.K.; Gupta, A.K.; Rao, P.R.; Sachdev, A.K.; Kumar, A.M.; Lao, A.A. Influence of cerium on the texture and ductility of magnesium extrusions. Scr. Mater. 2008, 59, 562–565. [Google Scholar] [CrossRef]
  6. Bohlen, J.; Yi, S.B.; Letzig, D.; Kainer, K.U. Effect of rare earth elements on the microstructure and texture development in magnesium–manganese alloys during extrusion. Mater. Sci. Eng. A 2010, 527, 7092–7098. [Google Scholar] [CrossRef]
  7. Müller, K.; Müller, S. Severe plastic deformation of the magnesium alloy AZ31. J. Mater. Proc. Tech. 2007, 187–188, 775–779. [Google Scholar] [CrossRef]
  8. Laser, T.; Hartig, C.; Nürnberg, M.R.; Letzig, D.; Bormann, R. The influence of calcium and cerium mischmetal on the microstructural evolution of Mg–3Al–1Zn during extrusion and resulting mechanical properties. Acta Mater. 2008, 56, 2971–2978. [Google Scholar] [CrossRef]
  9. Park, S.S.; You, B.S.; Yoon, D.J. Effect of the extrusion conditions on the texture and mechanical properties of indirect-extruded Mg–3Al–1Zn alloy. J. Mater. Proc. Technol. 2009, 209, 5940–5943. [Google Scholar] [CrossRef]
  10. Mueller, S.; Mueller, K.; Reimers, W. Modifications of the Extrusion process of Magnesium Alloys for improved Mechanical Properties. Key Eng. Mat. 2008, 367, 9–16. [Google Scholar] [CrossRef]
  11. Huppmann, W. Reimers. Microstructure and mechanical properties of differently extruded AZ31 magnesium alloy. Int. J. Mater. Res. 2010, 101, 1264–1271. [Google Scholar] [CrossRef]
  12. Gottstein, G.; Al-Samman, T. Texture Development in Pure Mg and Mg Alloy AZ31. Mater. Sci. Forum. 2005, 495, 623–632. [Google Scholar] [CrossRef]
  13. Yi, S.B.; Brokmeier, H.-G.; Letzig, D. Microstructural evolution during the annealing of an extruded AZ31 magnesium alloy. J. All. Comp. 2010, 506, 364–371. [Google Scholar] [CrossRef] [Green Version]
  14. Stanford, N.; Barnett, M.R. Effect of composition on the texture and deformation behaviour of wrought Mg alloys. Scr. Mater. 2008, 58, 179–182. [Google Scholar] [CrossRef]
  15. Luo, A.A.; Mishra, R.K.; Sachdev, A.K. High-ductility magnesium–zinc–cerium extrusion alloys. Scr. Mater. 2011, 64, 410–413. [Google Scholar] [CrossRef]
  16. Robson, J.D.; Henry, D.T.; Davis, B. Particle effects on recrystallization in magnesium–manganese alloys: Particle-stimulated nucleation. Acta Mater. 2009, 57, 2739–2747. [Google Scholar] [CrossRef]
  17. Al-Samman, T. Modification of texture and microstructure of magnesium alloy extrusions by particle-stimulated recrystallization. Mater. Sci. Eng. A 2013, 560, 561–566. [Google Scholar] [CrossRef]
  18. Basu, I.; Al-Samman, T.; Gottstein, G. Shear band-related recrystallization and grain growth in two rolled magnesium-rare earth alloys. Mater. Sci. Eng. A 2013, 579, 50–56. [Google Scholar] [CrossRef]
  19. Griffiths, D. Explaining texture weakening and improved formability in magnesium rare earth alloys. Mater. Sci. Technol. 2015, 1, 10–24. [Google Scholar] [CrossRef]
  20. Stanford, N.; Barnett, M.R. The origin of “rare earth” texture development in extruded Mg-based alloys and its effect on tensile testing. Mater. Sci. Eng. A 2008, 496, 399–408. [Google Scholar] [CrossRef]
  21. Bugnet, M.; Kula, A.; Niewczas, M.; Botton, G.A. Segregation and clustering of solutes at grain boundaries in Mg–rare earth solid solutions. Acta Mater. 2014, 79, 66–73. [Google Scholar] [CrossRef]
  22. Hadorn, J.P.; Hantzsche, K.; Yi, S.B.; Bohlen, J.; Letzig, D.; Wollmershauser, J.A.; Agnew, S.R. Role of Solute in the Texture Modification during Hot Deformation of Mg-Rare Earth Alloys. Metall. Mater. Trans. A 2012, 43A, 1347–1362. [Google Scholar] [CrossRef]
  23. Robson, J.D.; Haigh, S.J.; Davis, B.; Griffiths, D. Grain Boundary Segregation of Rare-Earth Elements in Magnesium Alloys. Metall. Mater. Trans. A 2016, 47A, 522–530. [Google Scholar] [CrossRef] [Green Version]
  24. Stanford, N.; Sha, G.; la Fontaine, A.; Barnett, M.R.; Ringer, S.P. Atom probe tomography of solute distributions in Mg-based alloys. Metall. Mater. Trans. A 2009, 40A, 2480–2487. [Google Scholar] [CrossRef]
  25. Brömmelhoff, K.; Huppmann, M.; Reimers, W. The effect of heat treatments on the microstructure, texture and mechanical properties of the extruded magnesium alloy ME21: Dedicated to Prof. Dr.-Ing. Heinrich Wollenberger on the occasion of his 80th birthday. Int. J. Mat. Res. 2011, 102, 1133–1138. [Google Scholar] [CrossRef]
  26. Lentz, M.; Nissen, J.; Fahrenson, C.; Vogel, S.C.; Reimers, W. Macro- and microtexture evolution of an extruded Mg–Mn–Ce alloy during annealing. Mater. Sci. Eng. A 2016, 655, 17–26. [Google Scholar] [CrossRef]
  27. Lentz, M.; Klaus, M.; Reimers, W.; Clausen, B. Effect of high temperature heat treatments on the deformation behavior of Mg–2%Mn–0.7%Ce extrusions investigated by in-situ energy-dispersive synchrotron X-ray diffraction and elasto-plastic self-consistent modeling. Mater. Sci. Eng. A 2013, 586, 178–189. [Google Scholar] [CrossRef]
  28. Gensch, F.; Nitschke, R.; Gall, S.; Müller, S. Extrusion of hollow magnesium profiles and investigation of extrusion seams. Magnes. Technol. 2014, 1, 257–262. [Google Scholar]
  29. Lu, X.; Zhao, G.; Xi, H.; Zhang, C.; Chen, L.; Sun, L. Microstructure, mechanical properties and welding quality evaluation of longitudinal welds in hollow magnesium alloy profiles extruded at different ram speeds. Mater. Charact. 2019, 151, 414–428. [Google Scholar] [CrossRef]
  30. Wu, S.; Cui, H.; Yang, W.; Guo, X. Microstructures and properties of AZ31 magnesium alloys formed by multi-channel porthole extrusion. Eng. Rev. 2018, 38, 11–19. [Google Scholar]
  31. Alharti, N.; Bingöl, S.; Ventura, A.; Misiolek, W. Analysis of Extrusion Welding in Magnesium Alloys—Numerical Predictions and Metallurgical Verification. Proc. Eng. 2014, 81, 658–663. [Google Scholar] [CrossRef] [Green Version]
  32. Gensch, F.; Gall, S.; Fahrenson, C.; Müller, S.; Reimers, W. Characterization of weld seam properties of extruded magnesium hollow profiles. J. Mater. Sci. 2016, 51, 3888–3896. [Google Scholar] [CrossRef]
  33. Hiscocks, J.; Jiang, L.; Jonas, J.J. Longitudinal Seam Failure in Extruded AZ31 Alloy. Adv. Mater. Res. 2007, 15–17, 439–444. [Google Scholar]
  34. Psyk, V.; Beerwald, C.; Klaus, A.; Kleiner, M. Characterisation of Extruded Magnesium Profiles for Electromagnetic Joining. J. Mater. Proc. Tech. 2006, 177, 266–269. [Google Scholar] [CrossRef]
  35. Sillekens, W.H.; van der Linden, D.C.W.; den Bakker, A.J. Weld-seam quality of hollow magnesium alloy extrusions. Magnes. Technol. 2008, 1, 189–194. [Google Scholar]
  36. Kurz, G.; Nienaber, M.; Bohlen, J.; Letzig, D.; Kainer, K.U. Variation of Extrusion Process Parameter for the Magnesium Alloy ME21. Magnes. Technol. 2020, 181–188. [Google Scholar] [CrossRef]
  37. Liu, X.; Wang, J. Low-energy, Mobile Grain Boundaries in Magnesium. Sci. Rep. 2016, 6, 21393. [Google Scholar] [CrossRef] [Green Version]
  38. Humphrey, F.J.; Hatherly, M. Recrystallization and Related Annealing Phenomena, 2nd ed.; Elsevier Ltd.: Amsterdam, The Netherlands, 2014. [Google Scholar]
  39. Li, B.; Liao, M.; Ma, Q.; McClelland, Z. Structure of grain boundaries with 30°[0001] misorientation in dynamically recrystallized magnesium alloys. Comput. Mater. Sci. 2015, 101, 175–180. [Google Scholar] [CrossRef]
  40. Ostapovets, A.; Šedá, P.; Jäger, A.; Lejček, P. Characteristics of coincident site lattice grain boundaries developed during equal channel angular pressing of magnesium single crystals. Scr. Mater. 2011, 64, 470–473. [Google Scholar] [CrossRef]
  41. Brandon, D.G. The structure of high angle grain boundaries. Acta Metall. 1966, 14, 1479–1484. [Google Scholar] [CrossRef]
  42. Robson, J.D.; Henry, D.T.; Davis, B. Particle effects on recrystallization in magnesium–manganese alloys: Particle pinning. Mater. Sci. Eng. A 2011, 528, 4239–4247. [Google Scholar] [CrossRef]
Figure 1. (a) Porthole die for the extrusion of hollow magnesium profiles, (b) position of the EBSD measurement (red areas) with respect to the profile orientation, ER = 8:1, and weld seam locations represented by dotted lines.
Metals 11 00547 g001
Figure 2. IPF-maps and {0001}-pole figures of the reference area with the corresponding weld seam area, electron backscatter diffraction (EBSD) measurements on flat sections of samples from profiles extruded at TB = 450 °C and vProd = 1 m/min, (a,b) ER = 8:1, (c,d) ER = 16:1, (e,f) ER = 30:1, processed to the ND.
Metals 11 00547 g002
Figure 3. Normalized grain size distribution of recrystallized grains: (a) in the reference area and (b) in the weld seam.
Metals 11 00547 g003
Figure 4. Inverse pole figure (IPF) maps (∥ Extrusion direction (ED)) outlining different microstructures in the weld-free region before and after heat treatments at 475 °C (flat section): (a) as-extruded, (b) after 400 s, (c) after 1200 s, and (d) 3600 s, ED parallel to the weld line, ER = 8:1.
Metals 11 00547 g004
Figure 5. IPF maps (∥ <110>) outlining different microstructures in the weld seam after heat treatment at 475 °C: (a) as-extruded, (b) after 400 s, (c) after 1200 s, and (d) 3600 s, ED parallel to the weld line, ER = 8:1.
Metals 11 00547 g005
Figure 6. Evolution of the grain size distribution (computed from EBSD maps in Figure 2 and Figure 4) in the as-extruded condition (a) and after heat treatment at 475 °C for (b) 400 s, (c) 1200 s, and (d) 3600 s. In addition, the average grain diameters of all recrystallized grains and of the 30 largest grains are plotted in (e) as a function of dwell time, ER = 8:1.
Metals 11 00547 g006
Figure 7. Texture evolution of the recrystallized partition of grains with increasing dwell time. IPF is parallel to the ED reconstructed from EBSD data presented in Figure 4 and Figure 5. IPFs of both reference and weld seam material of profiles with an ER of 8:1 are shown.
Metals 11 00547 g007
Figure 8. Comparison of the different IPFs of small grains originating from the initial microstructure (grain diameter < 15 µm), grains with a limited growth rate (grain diameter of 15–30 µm), and abnormally grown grains (grain diameter > 30 µm) after heat treatment at 475 °C for 3600 s. IPF maps (∥ ED) on the right-hand side provide size and distribution of abnormally grown grains (grain diameter > 30 µm), which were used to compute IPFs.
Metals 11 00547 g008
Figure 9. Computed grain orientation spread (GOS) in the reference area of profiles extruded with an extrusion ratio of (a) ER = 8:1, (b) ER = 16:1, and (c) ER = 30:1 and the corresponding weld seams of (e) ER = 8:1, (f) ER = 16:1, and (g) ER = 30:1. Higher internal misorientation are proportional to the intensity of a red color and black lines representing HAGBs (θ > 15°). Misorientation distribution is shown in (d,h) for reference area and weld seam, respectively.
Metals 11 00547 g009
Figure 10. Development of misorientation distribution with increasing dwell time: (a) reference area, and (b) weld seam area.
Metals 11 00547 g010
Figure 11. (near-)CSL boundaries distribution calculated from data of the above shown EBSD maps in the reference area of profiles extruded with an extrusion ratio of (a) ER = 8:1, (b) ER = 16:1, and (c) ER = 30:1 and the weld seam of profiles extruded with an extrusion ratio of (d) ER = 8:1, (e) ER = 16:1, and (f) ER = 30:1.
Metals 11 00547 g011
Figure 12. Scanning electron microscopy (SEM) micrographs outlining the intermetallic particles in the weld seam exactly at the joining line of the two metal streams (weld line) (a,c,e), and in 400 microns distance to the weld line (b,d,f).
Metals 11 00547 g012
Figure 13. Particle density (a) and size (b) in the weld seam as a function of the distance from the weld line.
Metals 11 00547 g013
Publisher’s Note: MDPI stays neutral with regard to jurisdictional claims in published maps and institutional affiliations.

