Article

Anisotropic Plasticity and Fracture of Three 6000-Series Aluminum Alloys

by
Susanne Thomesen
1,*,
Odd Sture Hopperstad
1,2 and
Tore Børvik
1,2
1
Structural Impact Laboratory (SIMLab), Department of Structural Engineering, NTNU—Norwegian University of Science and Technology, NO-7491 Trondheim, Norway
2
Centre for Advanced Structural Analysis (CASA), NTNU, NO-7491 Trondheim, Norway
*
Author to whom correspondence should be addressed.
Metals 2021, 11(4), 557; https://doi.org/10.3390/met11040557
Submission received: 5 March 2021 / Revised: 24 March 2021 / Accepted: 25 March 2021 / Published: 29 March 2021

Abstract

:
The influence of microstructure on plasticity and fracture of three 6000-series aluminum alloys is studied with emphasis on the anisotropy caused by the extrusion process. Tension tests on smooth and notched specimens are performed in different directions with respect to the extrusion direction, where the stress and strain to fracture are based on local measurements inside the neck or notch. The microstructure of the alloys, i.e., grain structure, crystallographic texture and size distribution of constituent particles, is characterized and used to explain the experimental findings. The experiments show considerable differences in the directional variation of the yield stress, the plastic flow, the work hardening, and the failure strain between alloys exhibiting recrystallization texture and deformation texture. The alloys with recrystallized microstructure exhibited substantial anisotropic work hardening caused by texture evolution and a stronger notch sensitivity of the failure strain than the alloy with deformed, non-recrystallized microstructure. Comparisons are made with previous experiments on the same alloys in the cast and homogenized condition, and the effects of the microstructural changes caused by the extrusion process on the macroscopic response are discussed.

1. Introduction

Structural components made from 6000-series aluminum alloys find a range of applications in the automotive industry. During the extrusion of aluminum profiles, which are often used to make structural components such as crash boxes or bumper beams, the alloy is subjected to extreme deformations at elevated temperature. The extrusion process typically leaves the final product highly anisotropic with respect to its flow stress, plastic deformation and fracture behavior. By combining microstructural characterizations with mechanical tests of different kinds, the underlying physical mechanisms of the anisotropic plasticity and ductile fracture can be revealed and investigated. Understanding the anisotropic behavior of aluminum alloys is important both in structural design and in numerical analyses of such components.
For a cast and homogenized alloy, grain size, elements in solid solution, hardening precipitates and constituent particles are all important for the stress-strain behavior. It is the variation in the aforementioned microscopical features, among others, that leads to differences in material behavior between alloys. When processing an alloy through e.g., rolling or extrusion, there are significant changes to the microstructure of the material, which again alter the macroscopic behavior. Changes to grain sizes and orientations as well as particle sizes and distributions come directly as a result of the processing, and the materials are given anisotropic properties. There are several microstructural features that are found to contribute to the anisotropic behavior of an alloy; however, the crystallographic texture is said to be the main factor [1]. The crystallographic texture, or simply texture, is the statistical distribution of the orientation of the grains. In the cast and homogenized condition, the alloys typically have an equi-axed grain structure and random texture [1,2], which make the materials isotropic. However, after processing, the texture is altered [2,3] and the alloys develop anisotropic plasticity and fracture.
Although the variation in yield stress, work hardening and plastic flow with orientation, also referred to as plastic anisotropy, is mainly caused by the crystallographic texture of the alloy [1,4], studies have found that the precipitate structure [5] and the grain morphology [6] may also influence the plastic anisotropy. When discussing the anisotropy in ductile fracture, there are three main sources of anisotropy that are important [7]. The first is plastic anisotropy, which is mainly related to the texture as addressed above. The influence of plastic anisotropy on ductile fracture is significant as the plastic deformation of the surrounding material influences the void growth [4]. The second is the morphological anisotropy, which is related to the shape of the voids and the particles from which the voids nucleate. For instance, in the case of an elongated particle, void nucleation depends on the direction of loading relative to the particle axes, where the load required to initiate void nucleation will be higher for the longitudinal loading case, and in this way causing fracture anisotropy [8,9]. The size and shape of the grains are also of importance. In general, a small grain size is preferable for ductility [3,10]. In the work by Lohne and Naess [10] it is indicated that in some alloys, voids nucleate at particles on the grain boundaries due to the weaker precipitate free zones, and that these voids grow and further coalesce into cracks that propagate along the grain boundaries. In finer grained materials, the high density of grain boundary nodes will slow down the crack growth by altering the failure mode from intergranular to transgranular. Thus, for materials with elongated grains, the grain morphology could lead to anisotropy in the failure strain, due to a possible change of the failure mode with the loading direction [11]. The third type of anisotropy is the topological anisotropy, which comes from the spatial distribution of constituent particles. Constituent particles typically break up and align in stringer-type clusters along the processing direction during rolling or extrusion [3,7,12]. Both the spacing between the particles within one cluster and the spacing between clusters are of importance for void coalescence [7,13]. The orientation of the stringer-type cluster is of high importance for the ductility, as loading transverse to the stringer’s longitudinal axis is found to give markedly lower failure strain than other loading directions [7,13].
Characterizing the anisotropic properties of an alloy experimentally is a laborious task as it requires repeat tests in several different orientations with respect to the principal axes of anisotropy. Most studies investigating anisotropic alloys typically perform tests in the processing, diagonal and transverse directions, see e.g., [14,15,16,17,18,19,20]. There are only a few thorough experimental campaigns which characterize the anisotropic behavior of rolled or extruded aluminum alloys in the literature, see e.g., [5,21,22,23,24,25,26]. These studies include mechanical tests in several different orientations with respect to the processing direction. Such studies are both expensive and time consuming, but yield important information of the behavior of anisotropic materials. As shown by e.g., Fourmeau et al. [22], it is necessary to use an anisotropic yield surface to properly describe the material behavior of an anisotropic alloy in finite element simulations. Morin et al. [27] showed that it is possible to describe anisotropic fracture by using an anisotropic Gurson model combined with localization analysis. The development of enhanced constitutive models for anisotropic plasticity and fracture of aluminum alloys is important for simulation of plastic forming and structural impact, which relies on extensive experimental data sets with accurate measurements of the stress-strain behavior to fracture.
In this work, the influence of the microstructure on plasticity and fracture of three aluminum alloys is studied experimentally, with special emphasis on the anisotropy after extrusion. The selected alloys are relevant for crash components in cars and represent a variation of microstructures within the 6000-series of aluminum alloys. Using smooth and notched samples, tension tests in several directions with respect to the extrusion direction are carried out. By local measurements inside the neck or notch of the cylindrical samples, the true stress-strain curves to fracture are obtained, revealing anisotropic plastic flow and work hardening at large strains and the anisotropy of the failure strain under multi-axial tension. The microstructure of the alloys, including the grain structure, the crystallographic texture and the size distribution of constituent particles, is characterized and applied to underpin the experimental findings. The experiments revealed marked anisotropic work hardening for the alloys with recrystallized microstructure and a stronger notch sensitivity of the failure strain than for the alloy with deformed, non-recrystallized microstructure. By comparison with experimental data from Thomesen et al. [28] for the same alloys in the cast and homogenized condition, the effects of the microstructural changes caused by the extrusion process on the stress-strain behavior and tensile ductility are demonstrated.

2. Materials

This study investigates the aluminum alloys AA6061, AA6063 and AA6110, which were produced at the laboratory casting facilities at Hydro R&D Sunndal. The chemical composition of the alloys is given in Table 1. The materials were provided as cylindrical DC-cast extrusion billets with a diameter of 95 mm, where the following procedure for homogenization had been applied to the billets before delivery. The billets were heated to 575 °C with a heating rate of 200 °C/h, held at this temperature for 2 h and 15 min, and then cooled to room temperature with a cooling rate of 400 °C/h. This procedure corresponds to industrial practice. The three alloys have previously been investigated in the cast and homogenized condition for temper T6 in Thomesen et al. [28], and the reader is referred there for additional details.
Using the vertical extrusion press of SINTEF Industry, the cast and homogenized billets were extruded into rectangular profiles with a thickness of 6 mm and a width of 40 mm. Right before extrusion, the billets were solution heat-treated and water quenching was provided 0.5 m below the press tool. The profiles were stored at room temperature for further processing and within 2 h after the solution heat treatment, the profiles were stretched to a total strain of 0.5% using a universal testing machine. For the following 48 h, the profiles were stored at room temperature, before artificially aged to the peak strength condition (temper T6). The temper condition was achieved by heating the profiles to 185 °C with a heating rate of 175 °C/h and further holding at this temperature for 8 h. The profiles were then air cooled to room temperature. Please note that alloy AA6061 did not achieve the desired microstructure after extrusion, and a new extrusion procedure was devised and applied for this alloy only. Further details regarding both extrusion processes are provided in the Supplementary Materials (refers to electronic Supplementary Materials), see also Thomesen [29].

3. Experimental Procedures

3.1. Microstructure Characterization

After the extrusion process, the alloys are expected to have anisotropic properties. Due to the anisotropy, it is of interest to investigate how the microstructure appears in different orientations with respect to the principal axes of anisotropy, the latter which are shown for the profiles in Figure 1a. Hence, for each alloy, two samples were extracted from the extruded profiles. One sample was taken along the ED (in the ED-ND plane), the other along the TD (in the TD-ND plane). The samples were cast in Epofix and further ground and polished down to 1 μm using SiC-paper and polishing pads, respectively. The samples were then prepared for grain structure imaging through electropolishing in A2 (Struers electrolyte) at 30 V for 3 s and anodizing at 20 V for 2 min. A Reichert MeF3 A optical microscope with a 10× objective was used to take the images of the grain structure. For both samples, the images were taken at locations corresponding to the center and the vicinity of the surface of the profile.
Images of the constituent particles were obtained for both samples. The anodized layer, used in the grain structure investigations, was removed by polishing the sample down to 1 μm. To find the size distribution of the constituent particles, only the sample along the TD was used. The distributions were obtained through image processing of backscattered electron micrographs. For the alloys AA6063 and AA6110, the images were taken using a Hitachi SU6600 Field Emission Scanning Electron Microscope (FESEM) operated at 5 kV, while a FEI Helios G4, operated at 10 kV, was used for alloy AA6061. In all cases, the images were taken along the center of the profile thickness.
The crystallographic texture was measured using the X-ray diffraction (XRD) method, providing an averaged texture, or macro-texture, over the measured volume. Samples measuring 14 mm × 22 mm in the ED and TD, respectively, were extracted from the extruded profiles. The samples were taken from the center of the TD, and were further ground down to the center of the thickness before polished. Further preparation of the surface included etching for 10 min using Alubeis (a mixture of NaOH and sugar) and etching for 20–30 s using HNO 3 [30]. A Siemens D5000 X-ray Diffractometer with a copper (Cu) anode was used to obtain the texture measurements. The instrument was operated at 40 kV, and had a diameter of the measurement spot of 2 mm. The diffractometer rotates about predefined angles so that all possible lattice planes are detected. A detector then registers the reflected K α X-ray signals from the sample. The rotation planes are directly related to the measured {111}, {200}, {220} and {311} pole figures, which later are used to obtain the data for the orientation distribution function (ODF).
The fracture surfaces of the failed tension test specimens were investigated from secondary electron images obtained using a Zeiss Gemini SUPRA 55VP FESEM operated at 20 kV. Before inserting the specimens in the vacuum chamber of the FESEM, they were all cleaned in an ultrasound bath using acetone.

3.2. Mechanical Testing

Tensile tests were performed using axisymmetric smooth and notched specimens. Two to four repeat tests were done for each combination of alloy and specimen geometry. The nominal geometries of the specimens are shown in Figure 2. A combination of spark erosion and turning was used to machine the specimens. After machining, the specimens were polished using emery paper with grit size P2000. The notched specimens have a notch radius of R n = 2.0 mm and R n = 0.8 mm and will be referred to in the following as specimen R2.0 and R0.8, respectively. To investigate the anisotropy of the alloys, test specimens were machined from different orientations α with respect to the ED. Coordinate systems applied for the profile and the specimens are shown in Figure 1. The thickness direction (ND) of the profile and the specimen coincided in all cases, while the specimen’s longitudinal direction (LD) made the angle α with the ED.
The following test program was carried out. Specimens were machined in the 0°, 45° and 90° direction for all specimen geometries, whereas smooth specimens were also machined in the 22.5° and 67.5° direction. The tests were performed at room temperature under displacement control in a Zwick Roell Z030 universal testing machine. All tests of the alloys AA6063 and AA6110 were carried out using a detachable Zwick 5 kN load cell, while for alloy AA6061 the 30 kN built-in load cell was used. To ensure quasi-static conditions, a constant crosshead velocity of 0.15 mm/min was used for the smooth specimen tests, corresponding to an initial strain rate of approximately ε ˙ = 5 × 10 4 s 1 . For the notched specimens, a velocity of 0.1 mm/min was used in all tests.
Continuous measurements of the force and diameters at the minimum cross-section were provided to fracture [23]. Measurements of the force F were obtained directly from the load cell, while the diameter measurements were acquired using a high-speed, contact-less AEROEL XLS13XY laser gauge with a resolution of 1 μm [3,23]. The laser gauge creates two perpendicular laser beams, each measuring 13 mm × 0.1 mm, which are pointed towards the detectors on the opposite side of the specimen. To ensure that the diameters of the minimum cross-section were measured at all times, the laser gauge was mounted on a mobile frame free to move vertically. The two laser beams were aligned with the ND and TD* of the specimen, and the measured diameters along these two directions were denoted D t and D w , respectively. Based on these measurements, the true stress and logarithmic strain were calculated. Please note that the stress and strain measures represent average values over the minimum cross-section for the smooth specimen after diffuse necking and for the notched specimens at all strains. The stress and strain measures were used to calculate the stress ratio (i.e., the normalized directional yield stress) and the strain ratio (i.e., the R-value or Lankford coefficient), which are used to evaluate the anisotropic behavior of the alloys. Further details can be found in the Supplementary Materials, see also [23,29].

4. Experimental Results

4.1. Initial Microstructure

Optical micrographs of the grain structure of the three alloys are presented in Figure 3. The images are taken in the center of the thickness of the extruded profiles, and show the grain structure in the ED-ND plane. Similar images in the TD-ND plane can be found in the Supplementary Materials. From the images it is clear that the three alloys have quite different grain structures. The alloys AA6061 and AA6063 both have a recrystallized grain structure. Where the grains of alloy AA6063 are only slightly elongated in the ED and TD compared to the ND, the grains are significantly longer in the ED and TD relative to the ND for alloy AA6061. However, for both alloys there are large areas where the optical microscope is unable to distinguish the grains from each other. The reason is small differences in the orientations between the grains, which give poor contrast in the microscope and make it difficult to measure the grain size of these two alloys. Alloy AA6110 has a non-recrystallized grain structure. The grains are flat and severely elongated in the ED. Transmission electron microscopy (TEM) studies on other aluminum alloys with non-recrystallized microstructure have shown that the grains are divided into small sub-grains [31,32]. Using the electron backscatter diffraction (EBSD) technique, more detailed information about the grain orientations could be obtained. For brevity, the results from the EBSD measurements are not presented in this paper, see Thomesen [29] for details, but the measurements were used to calculate the average grain sizes of the alloys presented in Table 2. The numbers confirm the general observations seen from the images in Figure 3. For alloy AA6110, most of the grains are severely elongated in the TD and to an even larger extent in the ED, where some grains are several millimeters long. However, other grains are less than 10 μm long. This is clearly seen from the inverse pole figure of alloy AA6110 presented in Figure 4. Please note that the cutoff value for individual grains is defined for a misorientation angle greater than 2°. The large variation makes it difficult to give a representative average grain size for alloy AA6110 in the ED and TD, and these numbers are therefore left out of Table 2.
Figure 5 displays images of the constituent particles in the three alloys. The images indicate that the particles are randomly distributed in the matrix material, unlike in the cast and homogenized condition where they were located on the grain boundaries [28]. Particle clustering along the ED in the form of stringers can be observed for all three alloys, although more prominently in alloy AA6110. Stringers are often observed in extruded alloys, see e.g., [3,7,12]. Both the aforementioned observations are results of the extrusion process. In alloy AA6063, a substantial fraction of the particles has significantly larger dimensions along the ED than in the ND. A considerable amount of the particles in the images obtained in the TD-ND plane also has dimensions where the aspect ratio deviates from unity; however, their orientation in the TD-ND plane is to a large extent random. These features are not as prominent in the other two alloys, but are to some extent also observed in alloy AA6110.
To determine the particle size distribution of the alloys, the obtained images in the TD-ND plane for the three alloys were analyzed using an in-house macro in the program ImageJ. The different types of constituent particles that form during processing were not distinguished. However, it is assumed that most of the constituent particles are α -phase constituent particles. The chemical composition of the constituent particles has been characterized in previous works by the authors, see Thomesen et al. [28] and Thomesen [29] for details. To avoid analyzing dispersoids, particles with an equivalent diameter smaller than 0.2 μm were omitted. The equivalent particle diameter was defined as D p = 4 A p / π , where A p is the measured area of the particle in the image plane. Converting the measured areas of the particles to circles with identical area was considered the best method to compare the distributions of the particle sizes, as the particles have highly irregular shape, as seen from the images in Figure 5. After removal of the particles with D p < 0.2 μm, a total of 868, 2901 and 3707 particles were analyzed for the alloys AA6061, AA6063 and AA6110, respectively. The obtained particle size distribution plots for the three alloys are shown in the rightmost column in Figure 5, where the area fraction of constituent particles is displayed against the equivalent particle diameter. Further details regarding the analysis of constituent particles are found in the Supplementary Materials. The constituent particles in all three alloys are considered to be relatively small, all with an equivalent diameter below 2.5 μm. However, the constituent particles are in general smaller for alloy AA6061 than for the other two alloys. The particle size distribution has a peak for particles with equivalent diameter of 0.5 μm for alloy AA6061, while for alloys AA6063 and AA6110, the peak is found for an equivalent diameter of 1 μm. By adding the area fractions of constituent particles for the different equivalent diameters, i.e., all the blue shaded bars in the particle size distribution plots, the total area fraction of constituent particles could be obtained. The values are presented in Table 2 along with the 95% confidence interval. The area fraction of alloy AA6061 is clearly the smallest, which could also be observed from the images of the particles in Figure 5.
From the XRD measurements, the crystallographic texture of the alloys could be obtained. The textures are displayed using orientation distribution functions (ODFs). Calculations of the ODFs were carried out using a harmonic series expansion and orthotropic sample symmetry with a series rank of 23 and Gaussian smoothing of 7° [1], and the resulting ODFs for the three alloys are presented in Figure 6. A strong cube texture with a marked Goss component is observed for the alloys AA6061 and AA6063, while the AA6110 alloy has a cube texture with orientations along the β -fiber, which go through the Brass, Copper and S components. The individual texture component locations are shown in Figure 6d. The obtained textures are typical for recrystallized (AA6061 and AA6063) and non-recrystallized (AA6110) extruded alloys. Similar textures have been observed by e.g., [3,33] for other extruded 6000-series aluminum alloys.

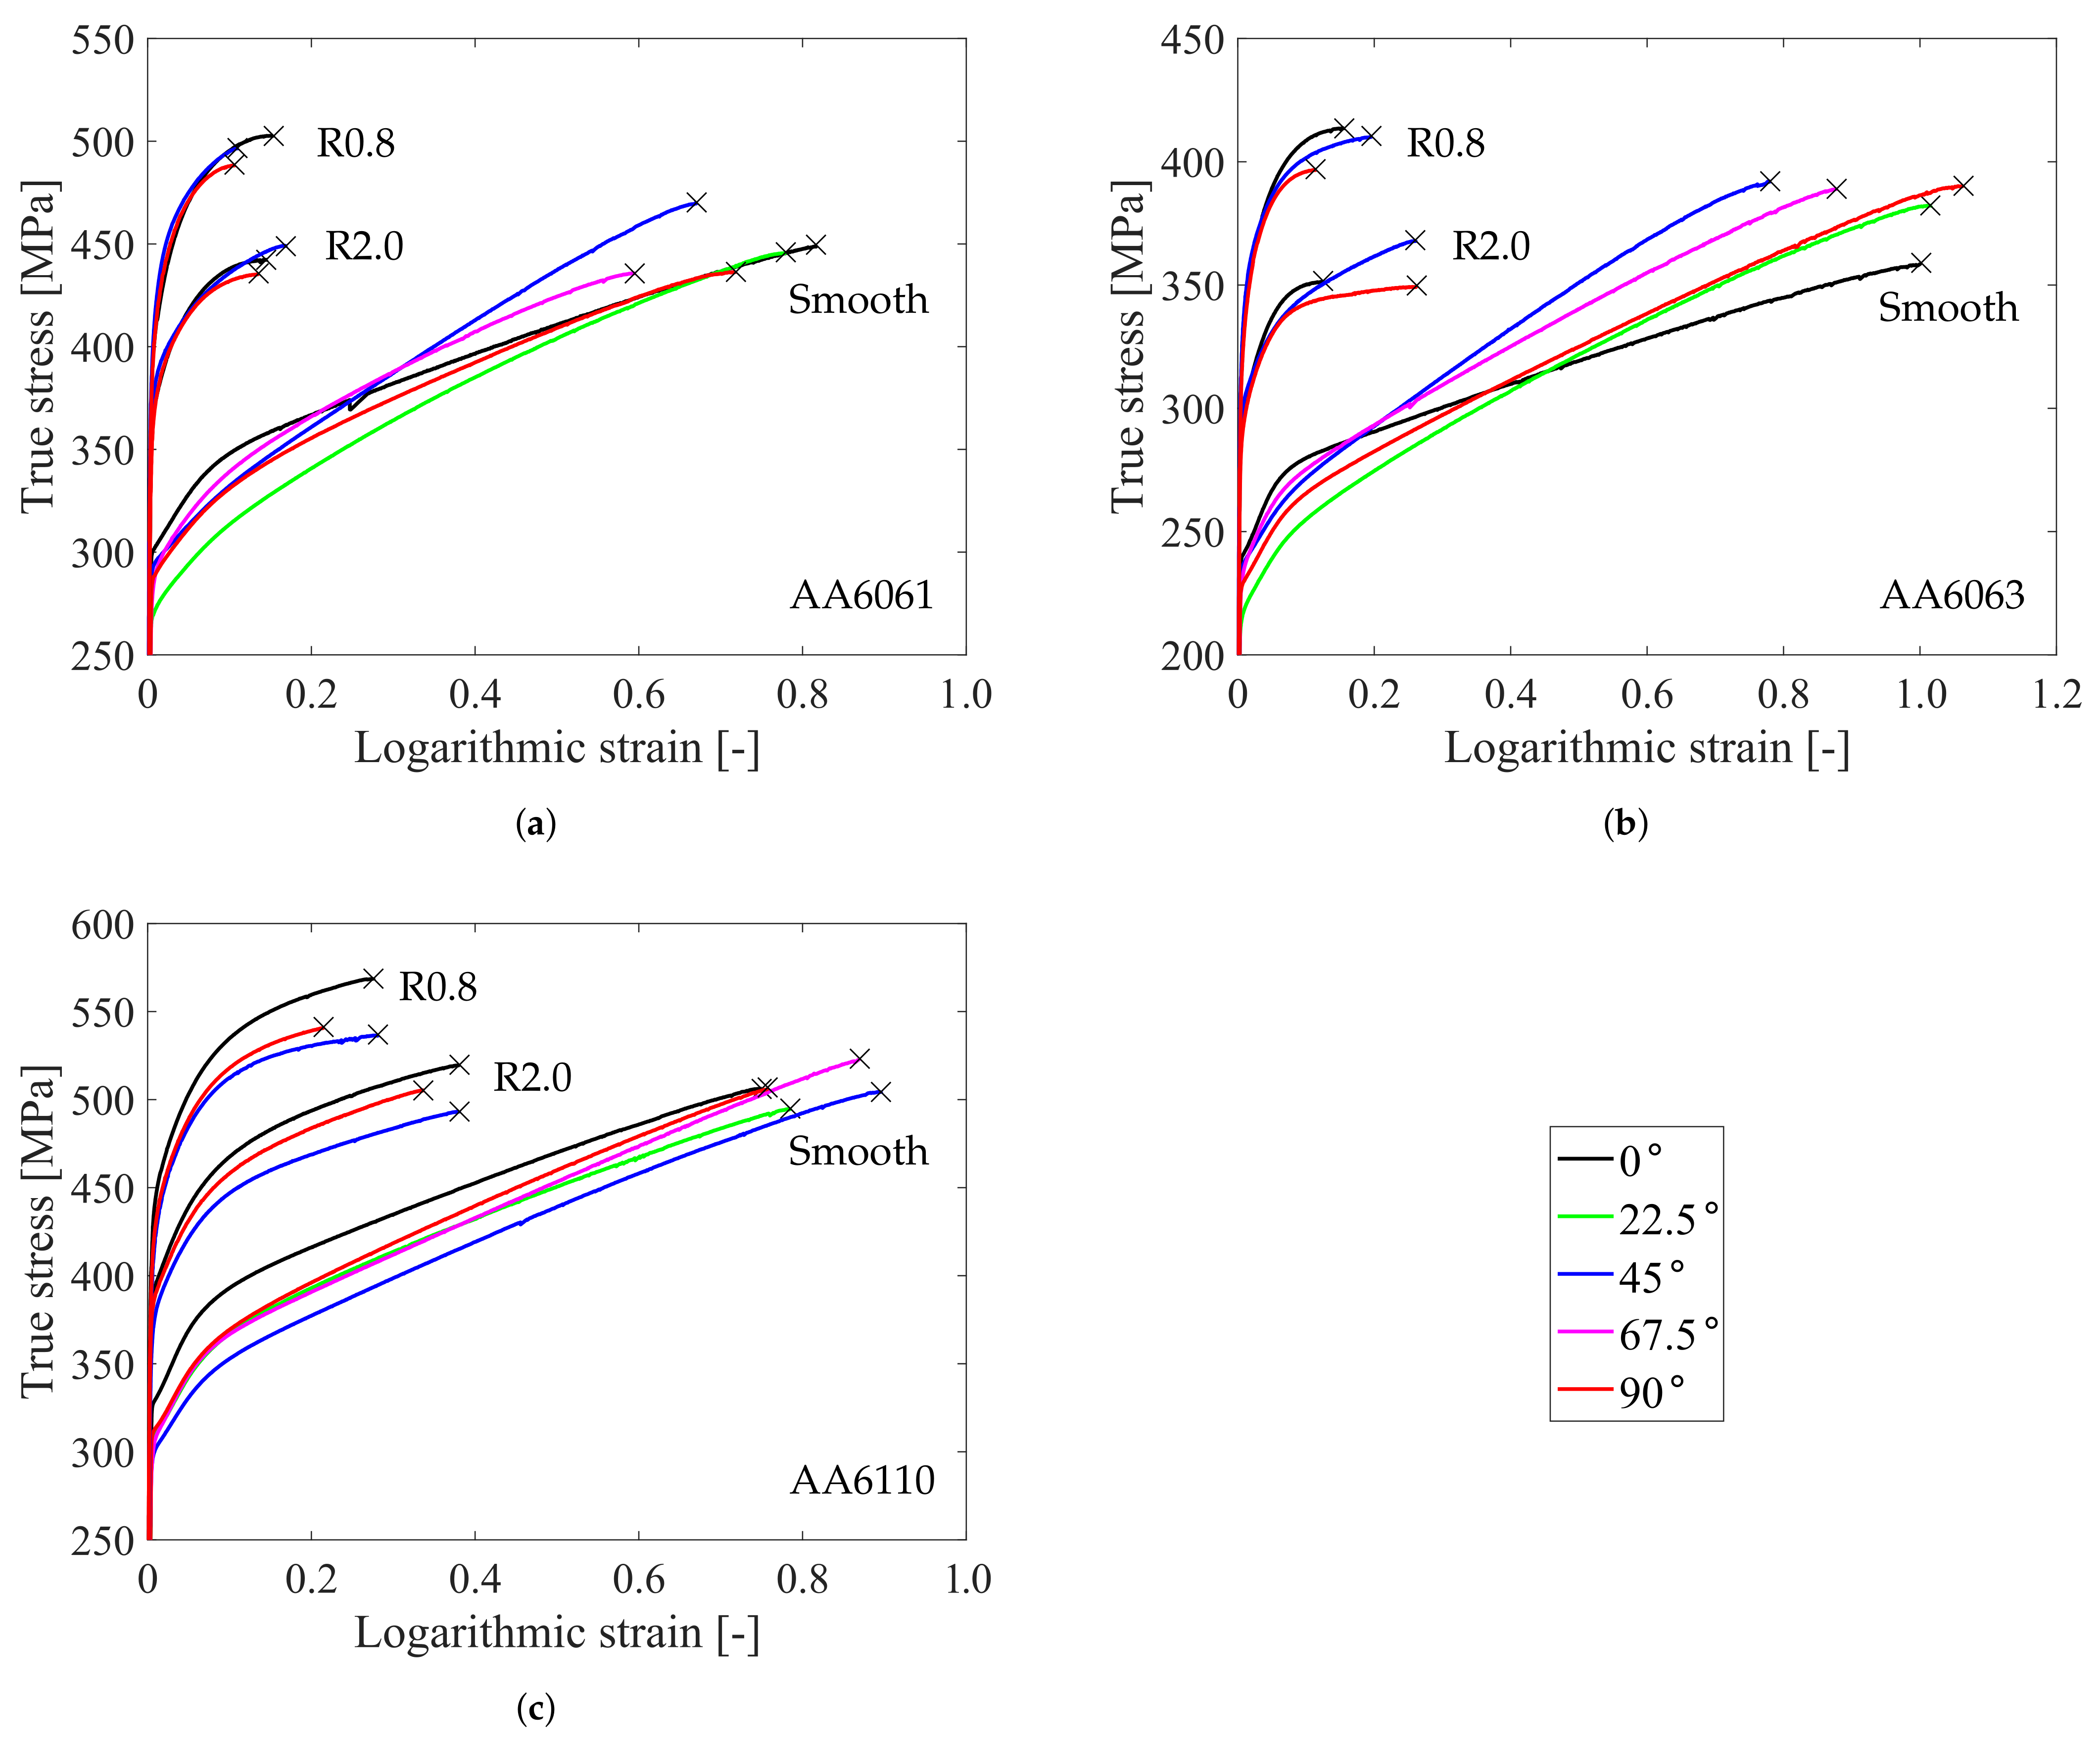
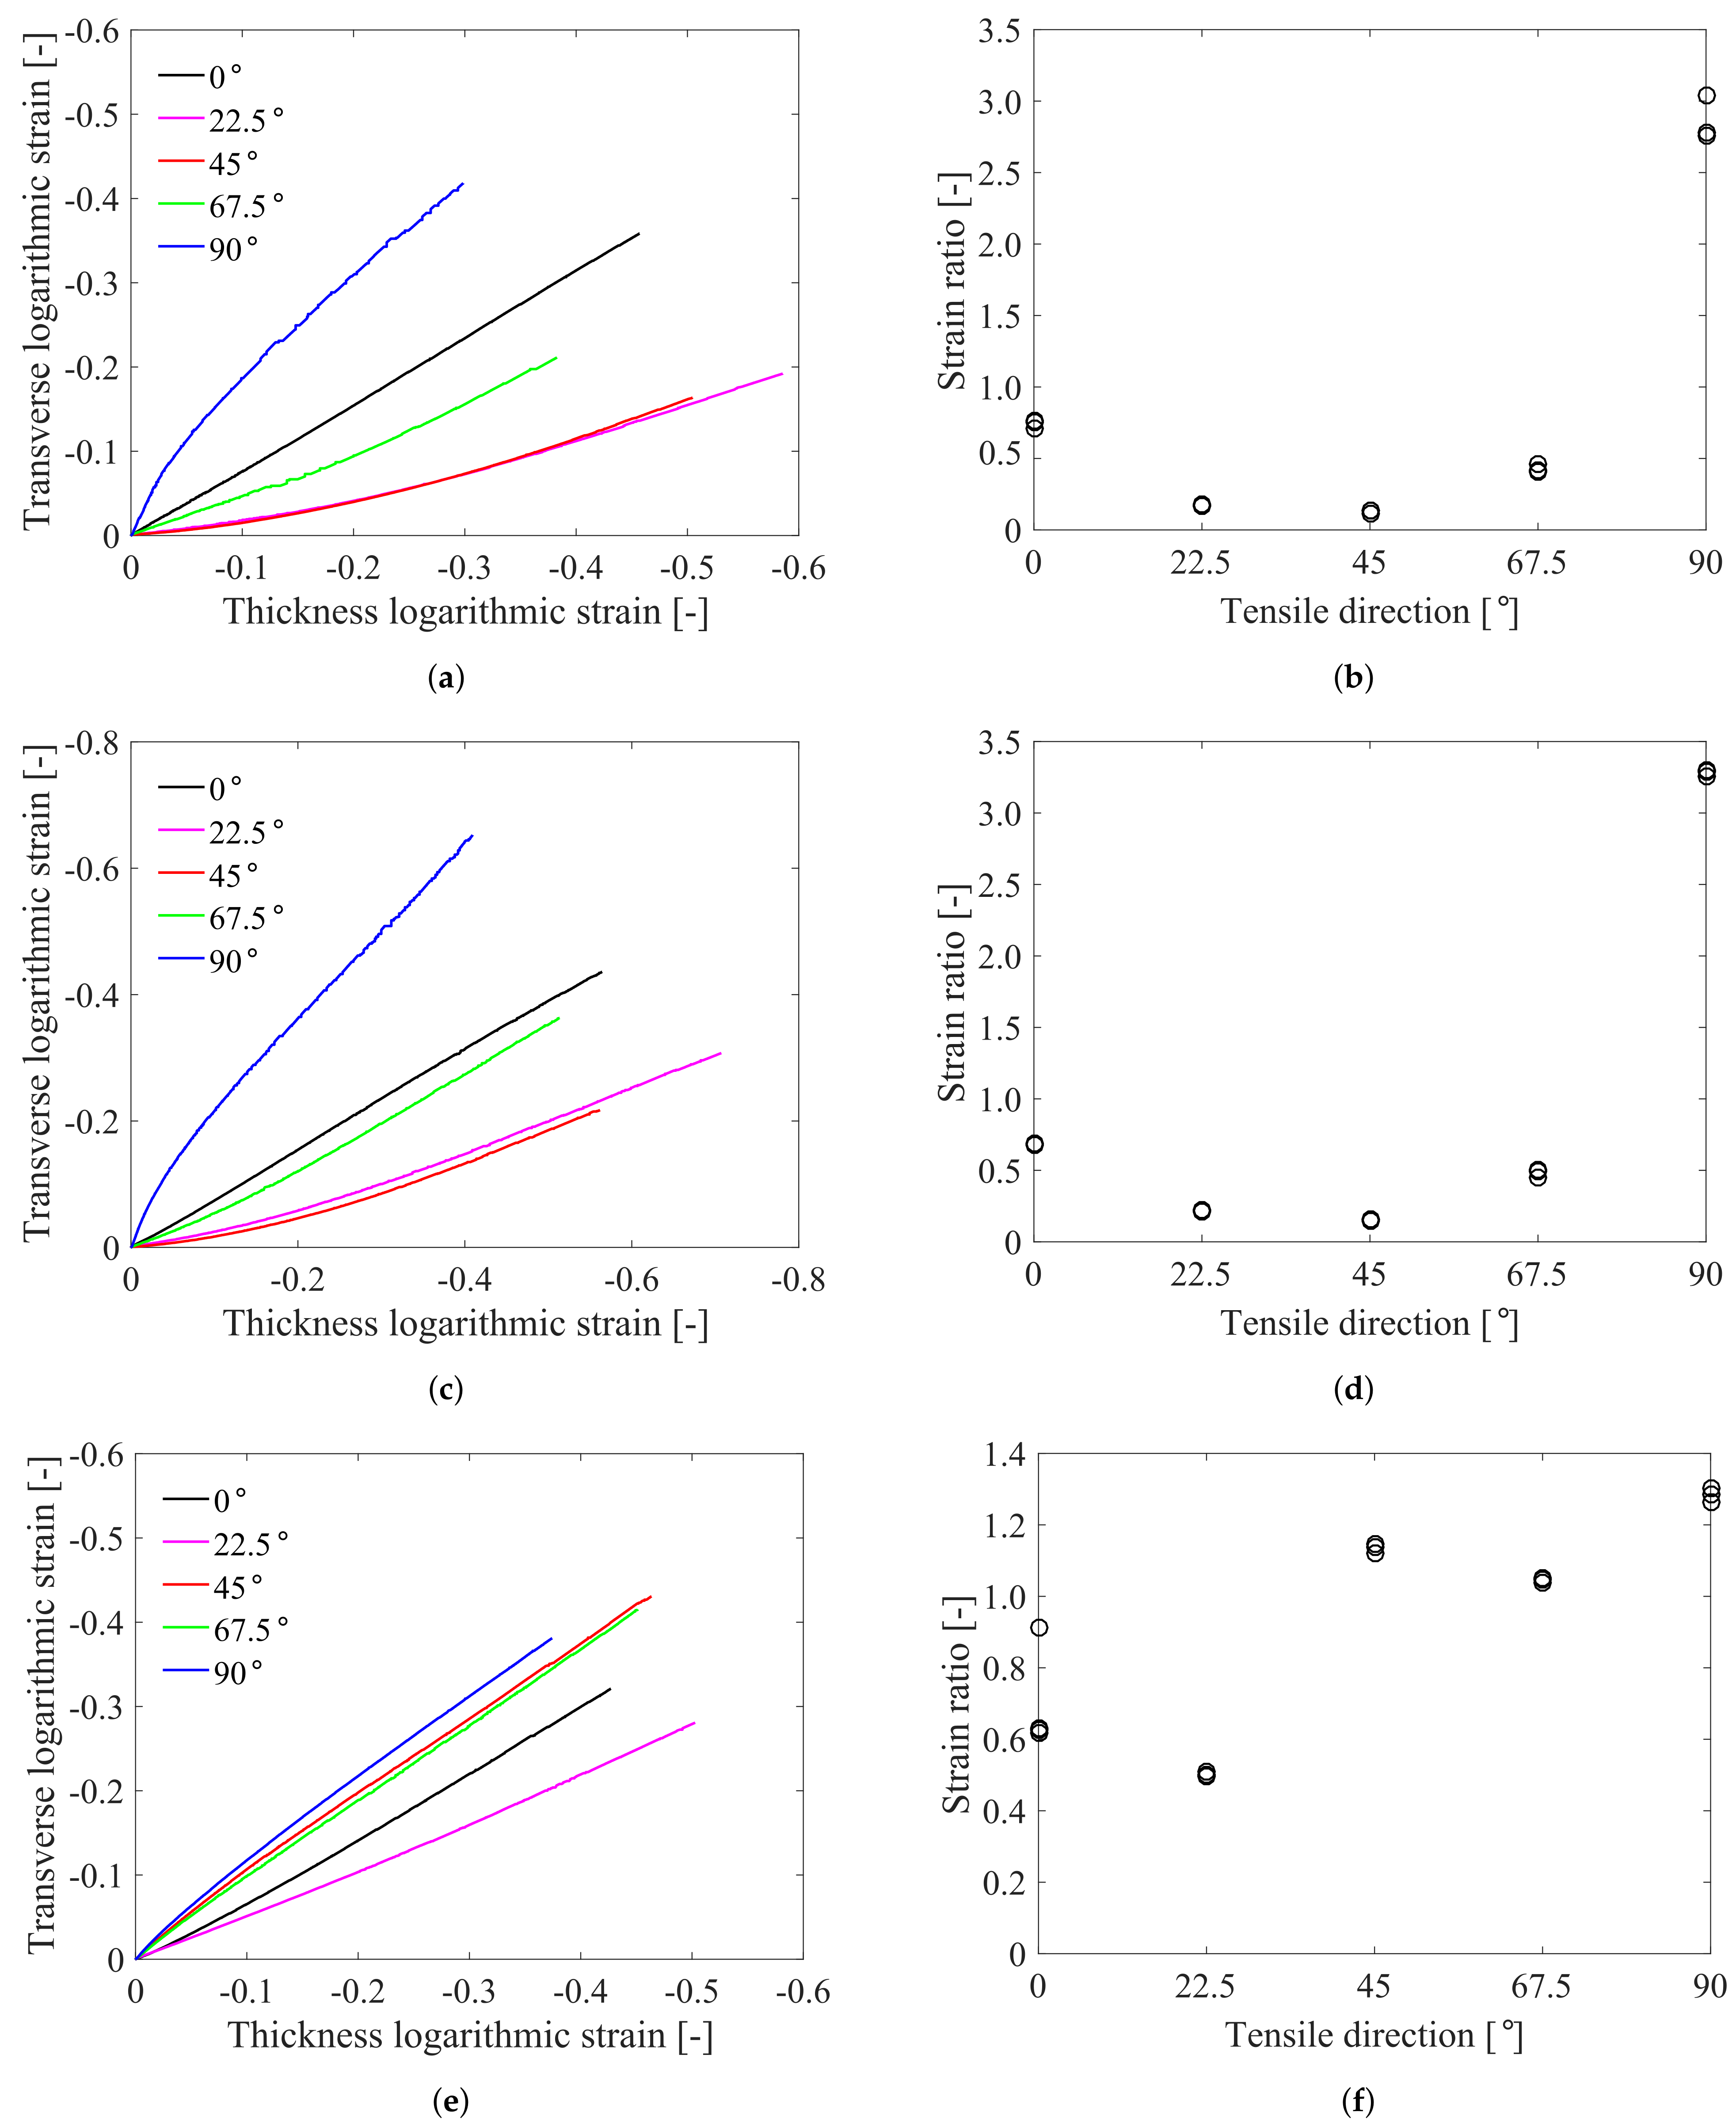
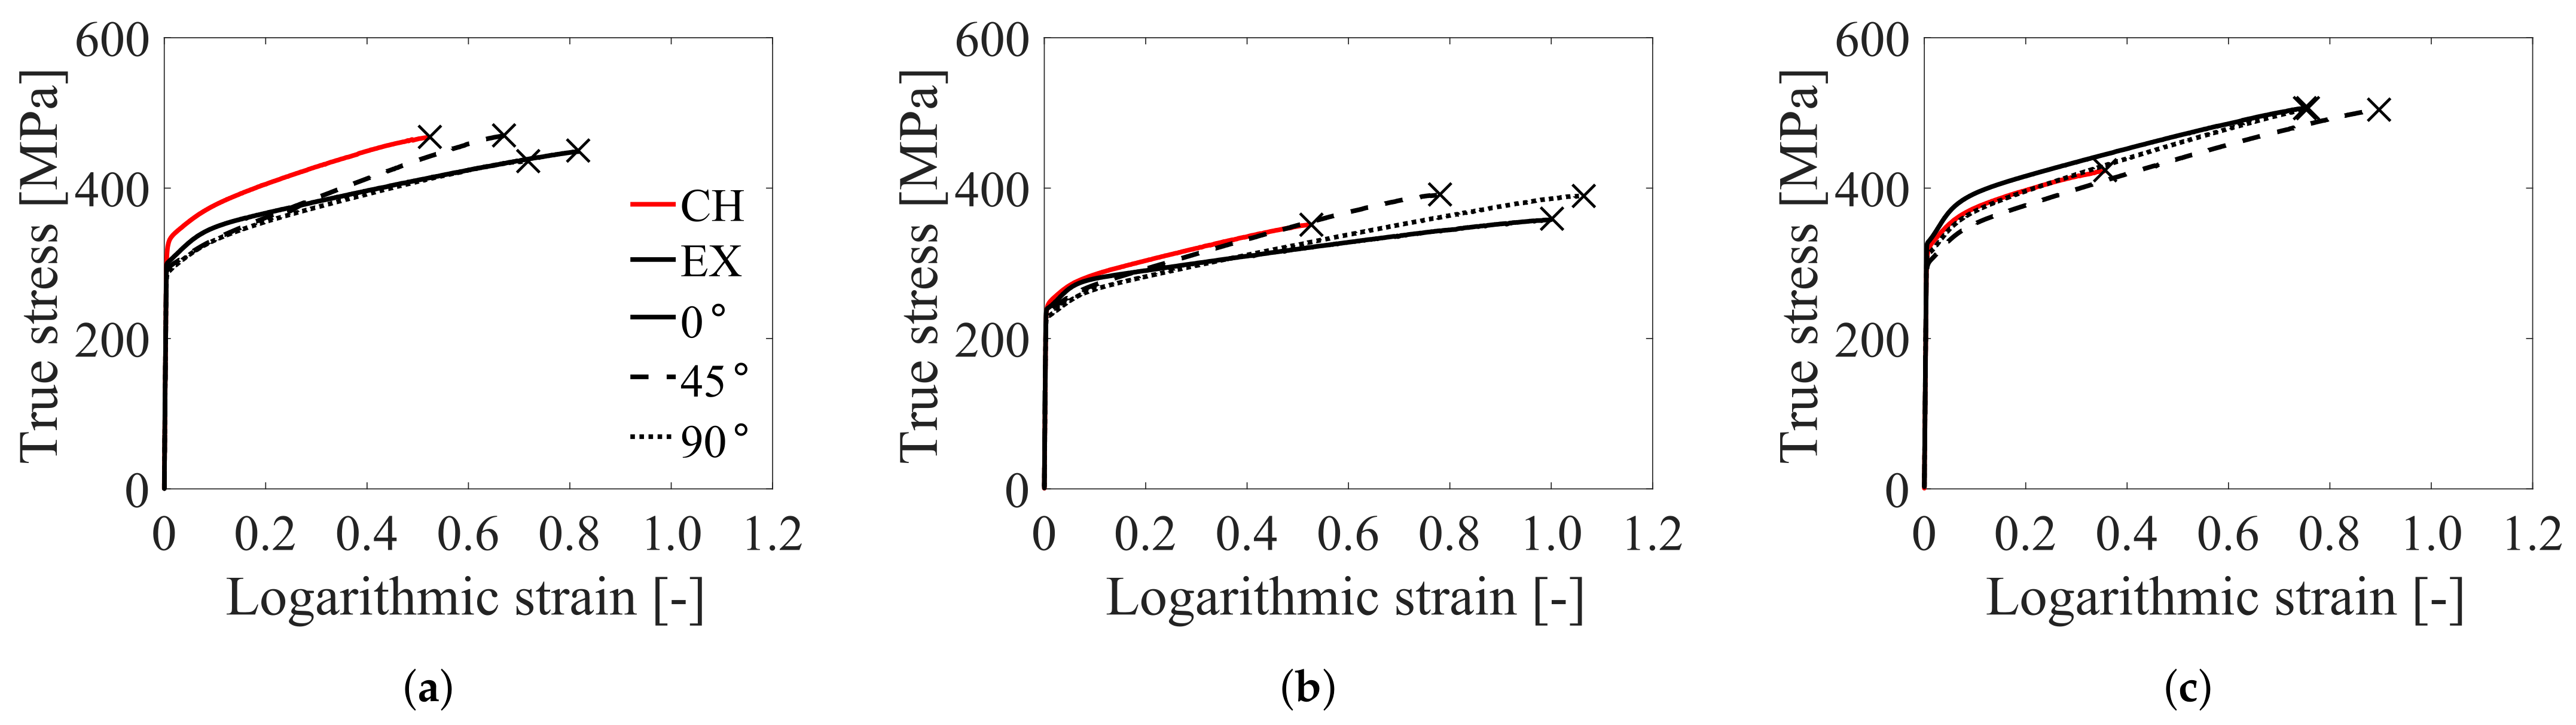
4.2. Mechanical Behavior

Based on the measurements acquired from the tensile tests, the stress-strain curves are plotted in terms of the true stress (i.e., force divided by current area) and the logarithmic strain. The true stress is not corrected for the triaxial stress state that is present in the smooth specimen after necking and in the notched specimen from the start of the test. Figure 7 presents the resulting stress-strain curves for the representative tests of each test series. Good repeatability of the stress level was in general observed, while some scatter was found in the strain to failure (at the maximum true stress). Selected stress and strain values from all repeat tests were extracted and tabulated, and can be used to study the scatter among the individual tension tests. These data can be found in the Supplementary Materials. It should be noted that the specimen cross-section was assumed elliptical in the post-processing, but observations after fracture showed that some of the notched specimens of alloy AA6063 had developed a diamond-shaped cross-section, see Section 4.3. The present test setup could not reveal at what point during the test the originally circular specimen cross-section developed into a diamond shape, and no separate measurements were carried out to investigate this development. This shape has been observed previously for 6000-series alloys by e.g., [3,34], where the strong cube texture combined with the superimposed triaxial stress state of a notched specimen has been found to cause the diamond shape observed. From crystal plasticity finite element simulations, it is observed that the development of the diamond shape occurs gradually towards fracture, and causes errors in the measured cross-section area at large strains. It is hard to quantify this uncertainty, but by considering the calculations performed by Frodal et al. [3], the maximum error in measured cross-section area at failure is about 10%.
The stress-strain curves in Figure 7 are cut at the point of maximum true stress, here defined as failure and marked by a black cross (×). The part of the curves between failure and fracture, the latter being defined by separation of the two specimen halves, was omitted due to the limited additional information the post-failure region of the stress-strain curves could provide in this study. Also, the sampling frequency of the tests was not high enough to give accurate results in this region, as deformation evolves rapidly after failure, leading to inaccuracies in the measurements. Examples of stress-strain curves to fracture are shown in the Supplementary Materials.
The directional stress-strain curves in Figure 7 clearly demonstrate the anisotropy in strength, work hardening and failure strain of the three alloys. For the recrystallized AA6061 alloy, substantial anisotropic work hardening is displayed for the smooth specimens in combination with anisotropy in strength and failure strain. The plastic anisotropy is markedly reduced for the notched specimens. Similar overall trends are seen for alloy AA6063, which is also recrystallized, but the anisotropic work hardening is even stronger. For this alloy, the plastic anisotropy prevails also for the notched specimens, which also show marked failure anisotropy. The non-recrystallized AA6110 alloy exhibits substantial anisotropy in strength and failure strain, whereas the anisotropy in work hardening is reduced compared with the two recrystallized alloys. It should be noted that there is some scatter in the stress-strain curves for each test series, especially in the failure strain, see Supplementary Materials for details; however, the above observations give the overall trends.
From Figure 7 it is seen that the notch strengthening effect is prominent for all three alloys, i.e., the yield stress increases with increasing initial stress triaxiality. However, the increased stress level comes at the cost of ductility. The notch sensitivity of the materials is shown in Figure 8, which presents the normalized failure strain of the two notched specimens with respect to the failure strain of the smooth specimen in the given direction. Here, the average normalized failure strain of all repeat tests in each test series is represented by the bars, while the scatter bars indicate the data range. The normalized failure strains of the notched specimens of alloy AA6110 are the highest for all three tensile directions, revealing generally less notch sensitivity for this alloy relative to the other two. The overall trend for the three alloys is a higher normalized failure strain for specimen R2.0 than for specimen R0.8, except for the alloys AA6061 and AA6063 in the 0° direction where the normalized failure strain is similar or slightly higher for the R0.8 specimen. Some variation in the notch sensitivity with tensile direction is found for all alloys, but is most significant for alloy AA6063.
Directional differences in the yield stress, i.e., strength anisotropy, were observed for all three alloys. A good measure of this anisotropy is the stress ratio, see Supplementary Materials for details. The stress ratios for the repeat tests of the smooth specimen in the five different directions are presented in Figure 9 for the three alloys. The stress ratios (i.e., normalized directional yield stresses) were calculated for a plastic strain of 1%. Due to the small scatter in the flow stress level for the three alloys, the trends of the strength anisotropy are clear. By definition, the stress ratio for the reference test in the 0 direction is always equal to unity. As observed from the figure, the yield stress is the highest in the 0° direction for all three materials as the other stress ratios are less than unity. The largest deviation from the reference test is found in the 22.5° direction for the alloys AA6061 and AA6063, while it is the 45° direction that deviates the most from the reference test for alloy AA6110. In all cases, the maximum deviation in stress ratio is about 10%. The trend in the distribution of stress ratios with orientation is very similar for the alloys AA6061 and AA6063, while for alloy AA6110 the distribution is clearly different. The latter observation is explained by the different textures of the alloys.
Figure 10a,c,e show the specimen transverse versus thickness logarithmic strain curves to failure for the representative test of the smooth specimen in each tensile direction for the alloys AA6061, AA6063 and AA6110, respectively. The slope of these curves coincides with the strain ratio, see Supplementary Materials for details. The repeatability was in general good for the different test series, although some scatter was observed. It is the initial texture of the alloys that gives the curves different initial slope in the various orientations, and the curvature/straightness of the curves indicate how the texture evolves in each orientation. Similar curves were obtained for the notched specimens, but are not shown here for brevity. These curves are generally more straight compared to the curves for the smooth specimen, and with less difference between the strains in the transverse and thickness directions. It appears as the complex triaxial stress field in the notched specimens reduces the macroscopic anisotropy in plastic flow [22].
To display the anisotropy in plastic flow, average strain ratios for the alloys AA6061, AA6063 and AA6110 are estimated by linear regression to the curves in Figure 10a,c,e, respectively. The strain ratios are good indicators of the plastic anisotropy of a material as they describe the differences in plastic flow in various directions. Average values of the strain ratios were estimated up to necking, representing the initial anisotropy in plastic flow, and are shown for all repeat tests of the smooth specimens for the alloys AA6061, AA6063 and AA6110 in Figure 10b,d,f, respectively. In general, anisotropy in plastic flow is caused mainly by the crystallographic texture of the material [1,5]. The distribution of strain ratios is relatively similar for the alloys AA6061 and AA6063 due to their similar textures, while the distribution is completely different for alloy AA6110 as its texture differs from that of the other alloys.
In Figure 11, the failure strain ε f is plotted against tensile direction α for all repeat tests of the smooth specimen. Although there is some scatter in the failure strain within each test series, the trends are clear and the fracture anisotropy is significant in the tensile tests on the smooth specimen for all three alloys. For the two alloys with a recrystallization texture, i.e., alloys AA6061 and AA6063, the failure strain distribution shows similar trends despite some differences around the 90° direction. As revealed in Section 4.1, there are clear differences between the two alloys when putting their similar texture aside. This will be discussed in more detail in Section 5.2. For the non-recrystallized alloy AA6110, the trend in failure strain distribution differs from the recrystallized alloys. The qualitatively different failure strain distribution for alloy AA6110 compared with the two other alloys is mainly explained by the different texture. However, the literature suggests that also the differences in grain and constituent particle characteristics of the alloys can give rise to differences in the fracture anisotropy, see e.g., [7,8,9,10].

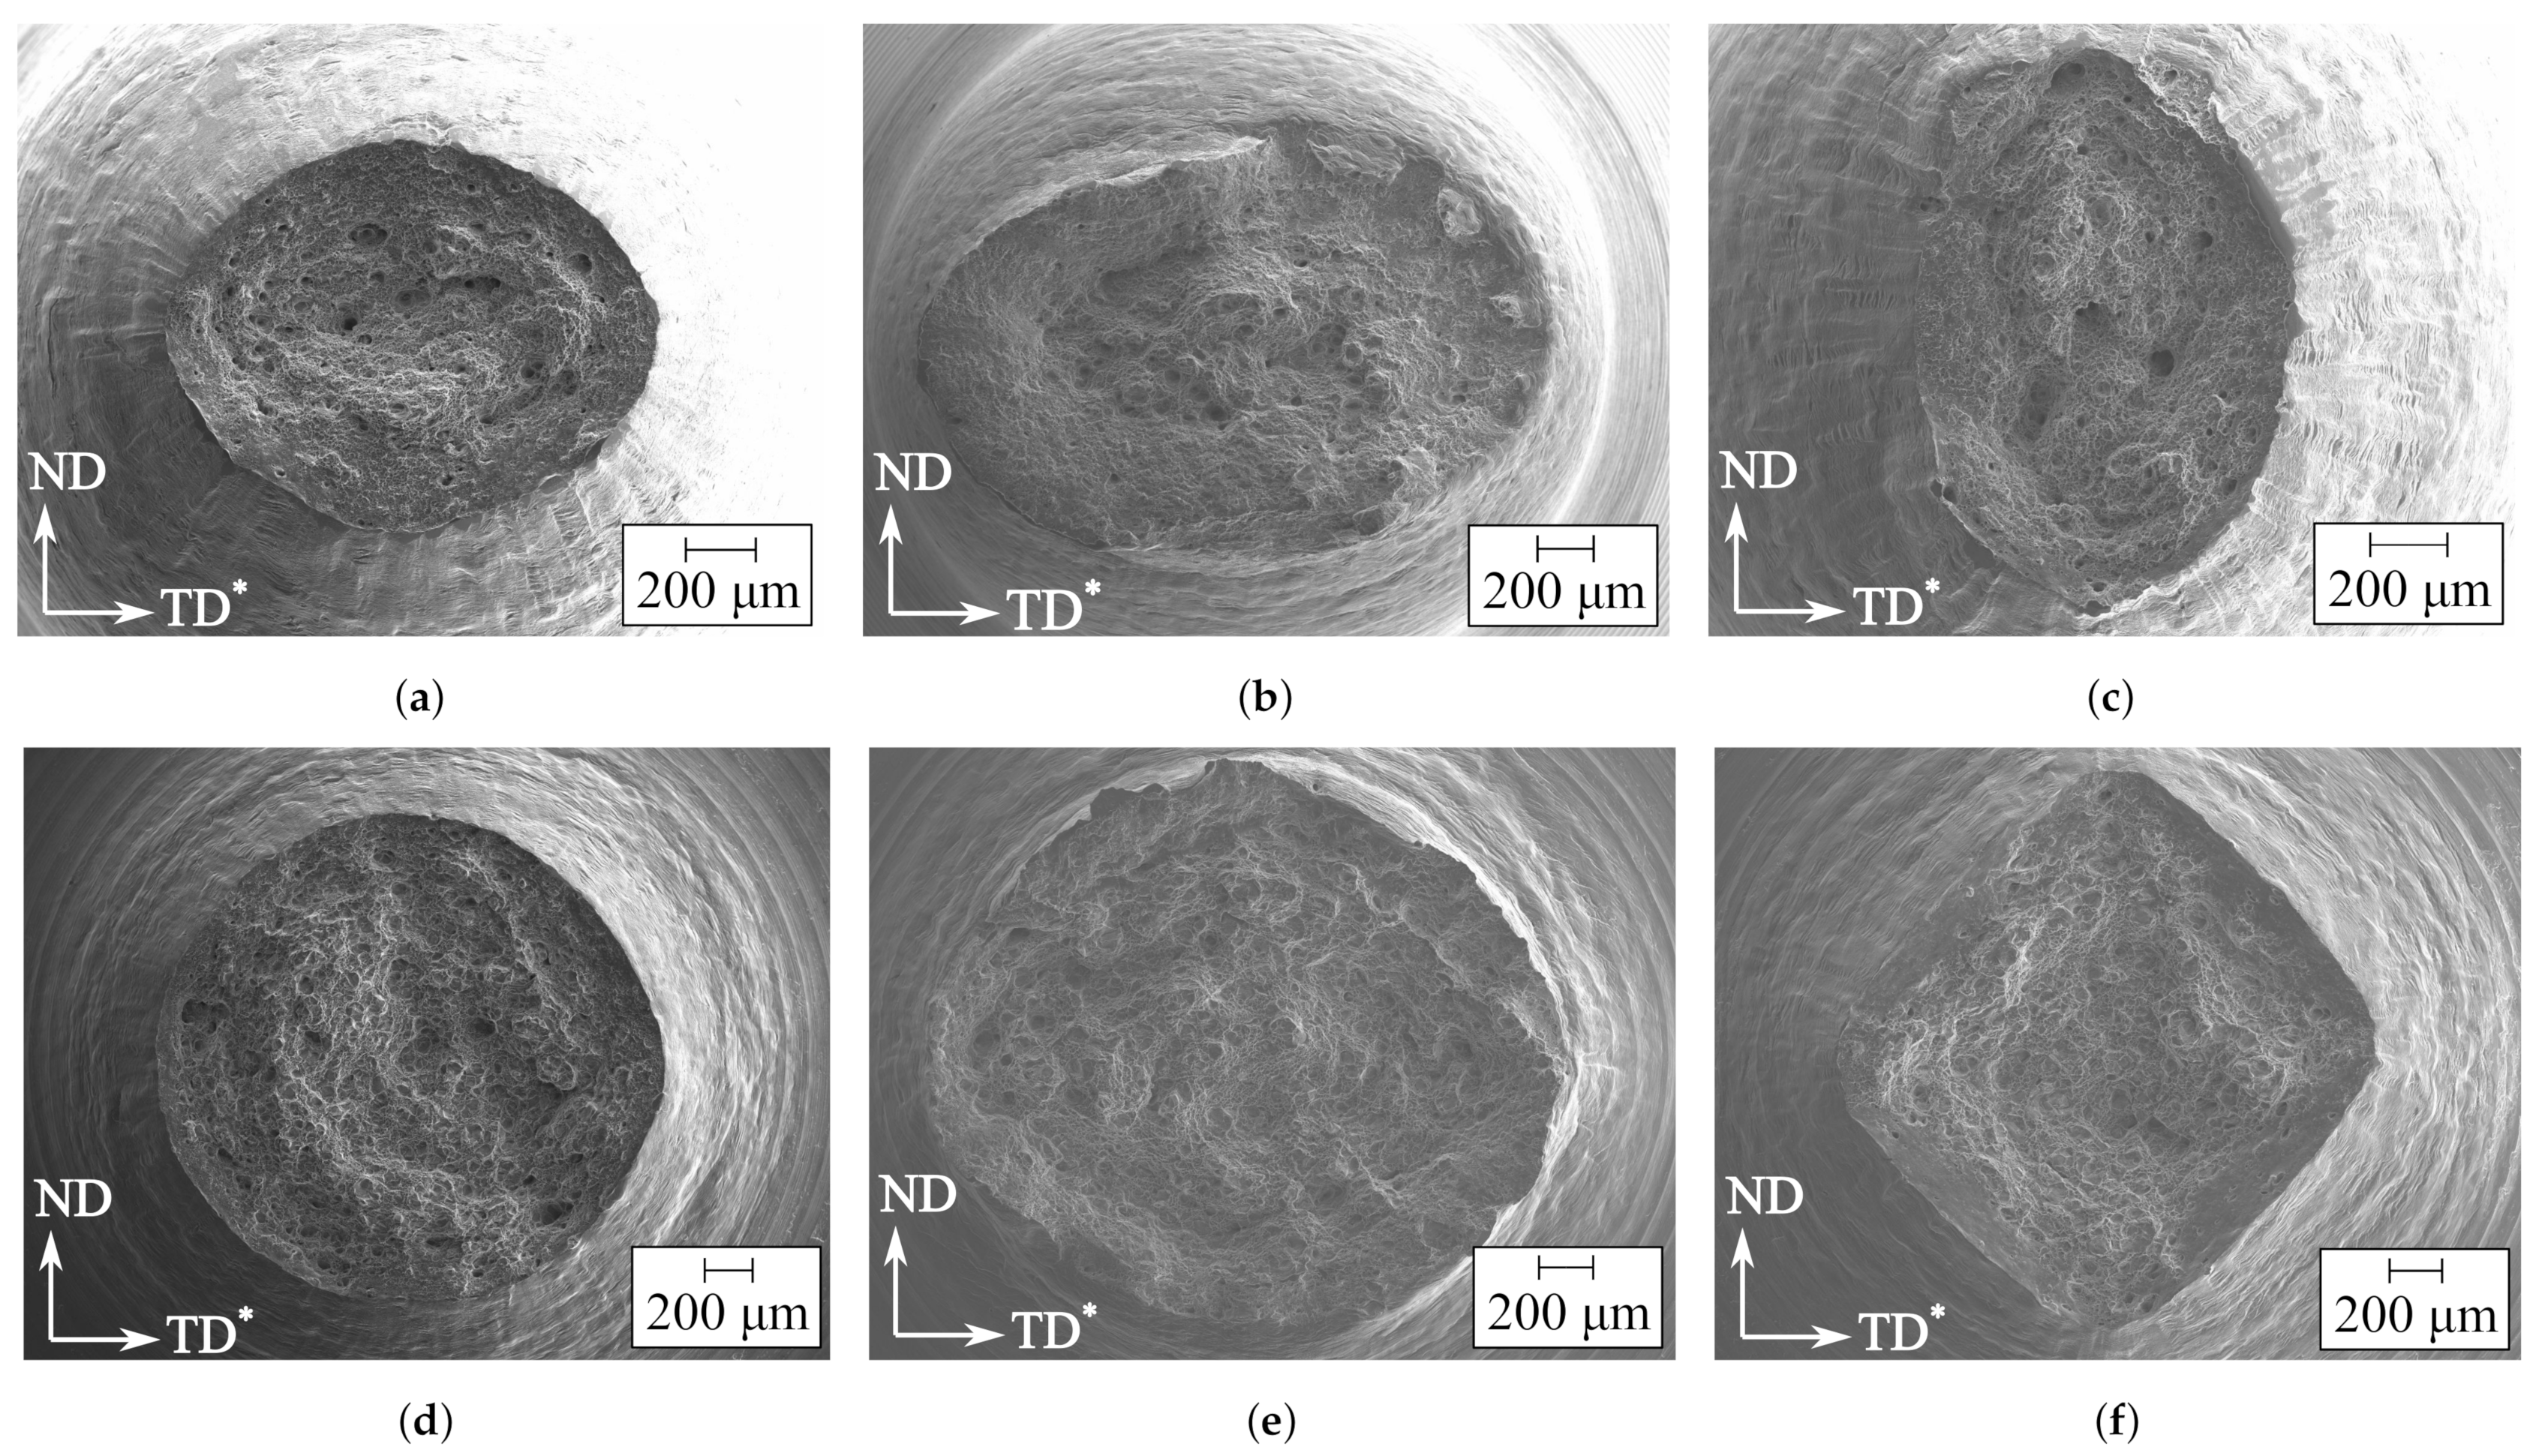
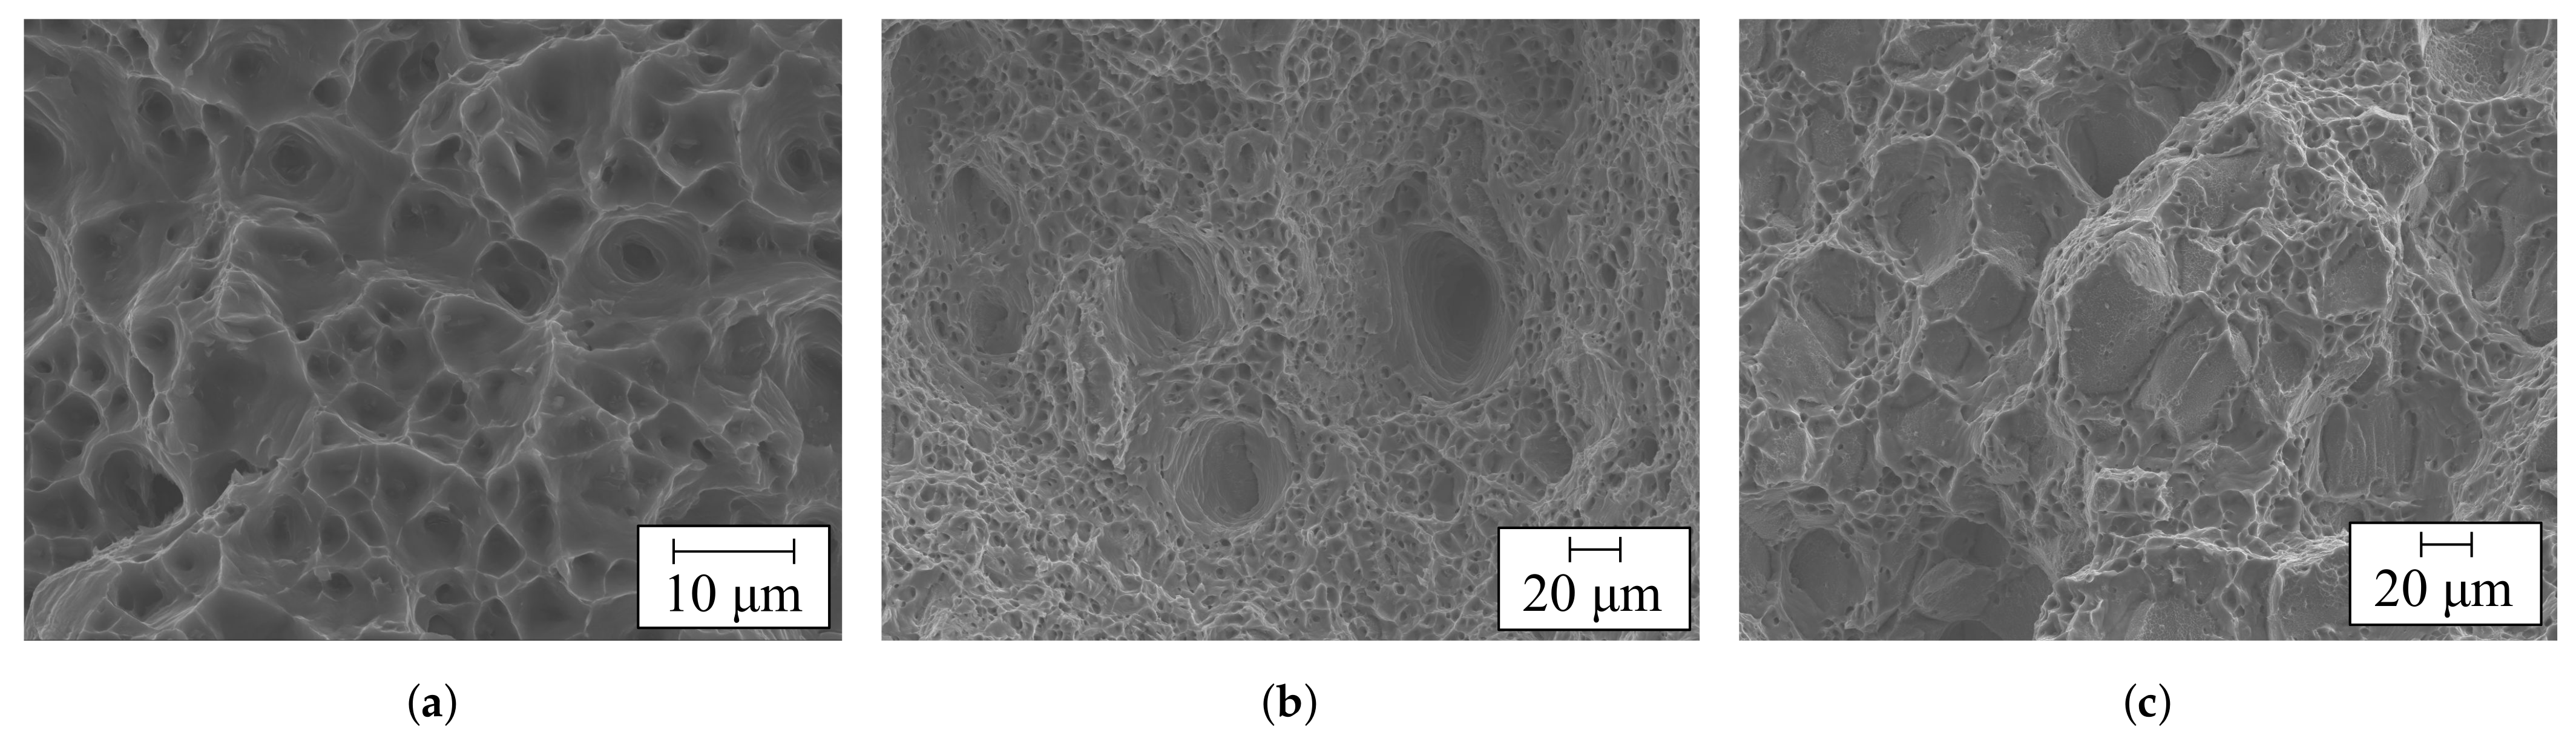
4.3. Fracture Surface

Fracture surfaces of the failed smooth and notched specimens from the tensile tests are presented below. One representative test from each test series was investigated; however, only a selection of images are presented here for brevity, showing only the overall trends. Figure 12, Figure 13 and Figure 14 show the selected fracture surfaces for the alloys AA6061, AA6063 and AA6110, respectively. The figures display overview images of the fracture surfaces, indicating their overall shape. The selection of images are taken in the 0°, 45° and 90° directions for the smooth and the R0.8 specimens. The reason for including only one of the notched specimens is that the overall observations were similar for these two specimen geometries. Please note that the overview images for the representative tests of the R2.0 specimen are included in the Supplementary Materials and can be studied to reveal further details of the fracture surfaces. See also Thomesen [29] for more details.
For the alloys AA6061 and AA6063, the global shape of the fracture surface of the smooth specimen is clearly elliptical, showing a marked effect of the plastic anisotropy, while the shape is closer to circular for alloy AA6110. The various shapes of the fracture surfaces are caused by the difference in strains in the TD* and ND, and are as expected based on the results previously presented in Figure 10 for the three alloys.
The notched specimens have typically more circular fracture surfaces for all three alloys as the effect of the plastic anisotropy is markedly reduced through the introduction of a pre-machined notch. However, for the tests in the 90° direction of alloy AA6063, the R2.0 and R0.8 specimens have diamond-shaped cross sections after fracture, due to the strong cube texture and the multi-axial stress state within the notch [3,34]. For alloy AA6110, all specimens are circular or elliptical and spirals are observed on the fracture surfaces of all specimen types. This feature has been observed previously by e.g., [35].
Images at higher magnification were obtained in addition to the overview images to investigate the fracture mechanisms. A classic dimple structure was found for all alloys and specimen geometries, indicating ductile fracture. An example is shown in Figure 15a for the smooth specimen of alloy AA6061 in the 90° direction. For all alloys, the dimples observed on the fracture surface of the smooth and notched specimens have somewhat different shape and size. In particular, the dimples on the fracture surface of the notched specimens are shallower, which indicates that these specimens are less ductile due to the higher stress triaxiality. The images also reveal two categories of dimples. One is the large dimples which are present in low densities, while the other is the high density of small dimples found in-between the large dimples. This is a feature that is common to observe, see e.g., [35], and is present in all three investigated alloys, although it is more prominent in the AA6110 alloy. At the bottom of many of the larger sized dimples it is possible to observe particles. Constituent particles are considered to be nucleation sites for voids due to particle cracking [2,35,36] and/or de-cohesion between the particles and the matrix [37]. The large number of particles observed in the dimples of the fracture surfaces show that failure occurs by nucleation, growth and coalescence of voids around the constituent particles [38].
Large oversized dimples can be observed, mainly for the smooth specimen of alloy AA6063, but also for other alloys and specimen geometries. Figure 15b displays these dimples for a smooth specimen in the 22.5° direction for alloy AA6063. Westermann et al. [35] also observed oversized dimples and found that they were caused by large voids originating from constituent particles. In the images of alloy AA6063, some of the oversized dimples appear to have facets at the bottom, which is an indication of grain boundary fracture. Facets are caused by intergranular fracture, meaning that the fracture follows the grain boundaries [38]. It is possible to observe facets for alloy AA6063 also outside the oversized dimples, but only for the notched specimens. The facets are spread over the fracture surface of the notched specimens as shown in Figure 15c for the R2.0 specimen in the 0° direction. A possible explanation for the observed facets in alloy AA6063 is the low Mg:Si ratio of 1.06, which is significantly lower than the optimal value of 1.73 and that, according to Remøe et al. [39], will lead to excess Si forming coarse Si particles at the grain boundaries and thus promote intergranular fracture. However, this possible fracture mechanism was not investigated in this study.
Although most of the specimens of the extruded alloys have elliptical or diamond-shaped fracture surfaces, the overall shape of the fracture surface was circular for the three alloys in the cast and homogenized condition. The latter results were previously published in Thomesen et al. [28]. The classical dimpled structure with particles at the bottom is observed for all alloys in both conditions, with only small local differences. However, neither facets, oversized dimples nor spirals were observed in the cast and homogenized condition.

5. Discussion

5.1. Strength, Plastic Flow and Work Hardening

Figure 9 shows the strength anisotropy of the three alloys in terms of the stress ratio, i.e., the directional yield stress normalized by the representative yield stress in the ED. The strong similarity between the distribution of the stress ratio for alloys AA6061 and AA6063 and the markedly different distribution for the AA6110 are caused mainly by the crystallographic texture. Although alloys AA6061 and AA6063 exhibit a strong recrystallization texture, the AA6110 alloy displays a typical deformation texture [3,33]. It was shown by Khadyko et al. [5] that also natural and artificial ageing influences the strength anisotropy in addition to the crystallographic texture. However, as the alloys studied here have been given the same heat treatment, this effect is assumed to be negligible. Another source of strength anisotropy could be the difference in grain structure between the alloys. Alloys AA6063 and AA6061 have a recrystallized grain structure with equi-axed and somewhat elongated grains, respectively, while alloy AA6110 has a deformed grain structure with flat, pancake-shaped grains. However, crystal plasticity finite element simulations by Saai et al. [40] have indicated that the effects of grain structure are small compared to the effect of crystallographic texture on the strength anisotropy.
The anisotropy in plastic flow (or plastic strain) is depicted in Figure 10 in terms of the transverse versus thickness strain curves and the distribution of the strain ratios. The marked difference in anisotropy in plastic flow between the alloys with recrystallized microstructure, AA6061 and AA6063, and the alloy with deformed microstructure, AA6110, is apparent from the plots of the strain ratios. The extremely low strain ratio in the 45° direction for alloys AA6061 and AA6063 indicates a strong tendency for thinning, i.e., the transverse straining takes place almost entirely in the ND of the extruded profile. In Fourmeau et al. [23], it was noted that a low strain ratio correlated with low directional tensile ductility for an AA7075 alloy. The plastic flow is mainly determined by the crystallographic texture of the alloy [11,41], and a substantial curvature of the transverse versus thickness strain curves indicates texture evolution. Based on this measure, the texture of the AA6110 alloy remains more stable, while there is texture evolution to various degree for the AA6061 and AA6063 alloys. The exception is the transverse versus thickness strain curve in the ED which is entirely straight for both AA6061 and AA6063, indicating a more stable texture throughout the deformation process.
Figure 7 reveals anisotropic work hardening for alloys AA6061 and AA6063 with considerably higher work-hardening rate in the 45° direction than in the ED, while the work-hardening rate in the TD is intermediate. For alloy AA6110, the work hardening is notably less anisotropic, but there are also here some directional differences, namely a somewhat higher work-hardening rate in the TD than in the other two directions. It is the crystallographic texture and its evolution with deformation that is the main source for the anisotropic work hardening [42,43].
Figure 16 compares the stress-strain curves from the tensile tests of the smooth specimen for the three alloys in the cast and homogenized condition from Thomesen et al. [28] with the directional stress-strain curves in the extruded condition. Please note that while the geometry of the smooth tensile specimens was different in the two test series, it was found by Thomesen et al. [44] to have no influence on the measured stress-strain and fracture behavior beyond the expected scatter of a material. The alloys have random texture in the cast and homogenized condition [2]. For the AA6061 and AA6063 alloys, the work hardening in the cast and homogenized condition is similar to the work hardening in the 45° direction after extrusion. As shown by Khadyko et al. [45], the Taylor factor will be approximately constant for uniaxial tension along the extrusion direction (i.e., 0° direction) for an alloy with a cube texture, indicating that the texture evolution is limited. The reason is that the cube texture is stable in the ED and TD due to crystallographic symmetry. In contrast, for a material with random texture, the Taylor factor, and thus the texture, evolves significantly. For alloys AA6061 and AA6063 with strong cube texture, the work-hardening rate is somewhat higher in the TD than in the ED, which is attributed to the Goss texture component which responds differently to deformation in the two directions. This effect is most pronounced for alloy AA6063. The grains are more prone to rotation in tension tests in the 45° direction for materials with strong cube texture, and the work hardening in this orientation is similar to that found for a random texture, indicating similar evolution of the Taylor factor. For the non-recrystallized alloy AA6110, there are smaller differences in the work hardening at large strains between the two conditions and between all tensile directions of the extruded material. It appears as if the Taylor factor evolves similarly at large strains for this alloy in the cast and homogenized condition with random texture and the extruded condition with deformation texture, which is in overall agreement with polycrystal plasticity simulations by Khadyko et al. [45].

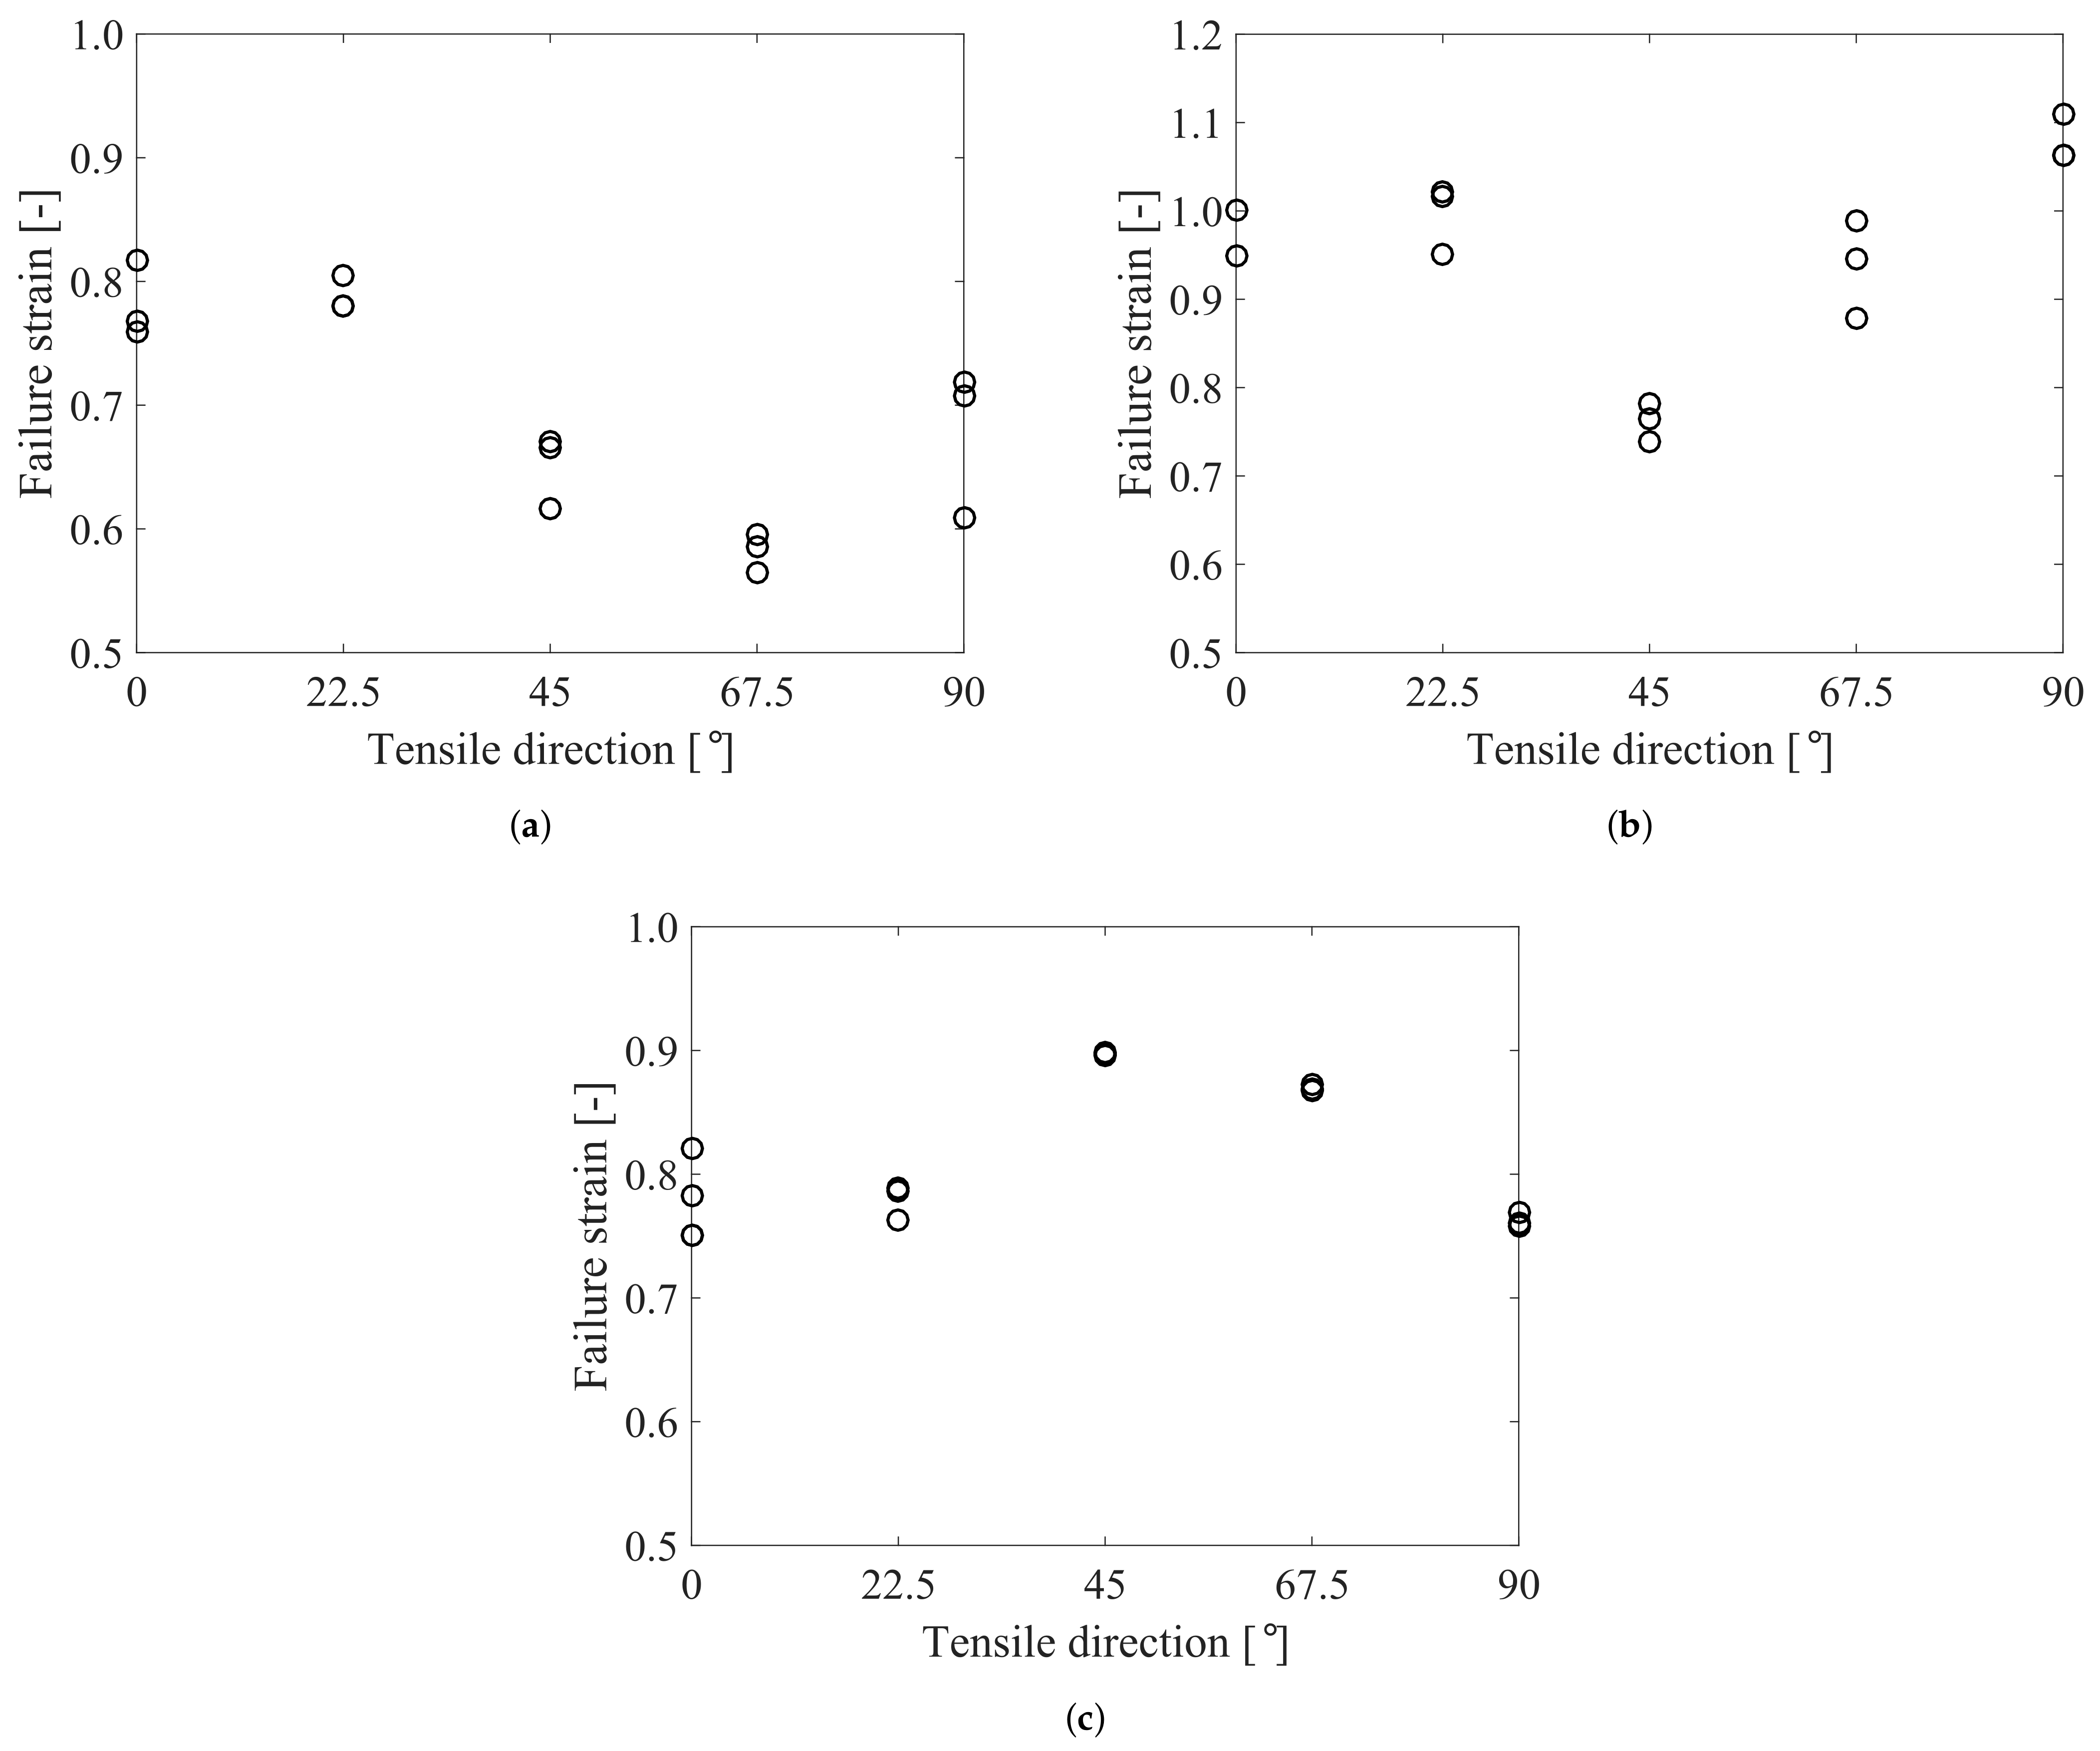
5.2. Ductility and Fracture

The directional variation of the failure strain of the three alloys is shown in Figure 11, which displays failure anisotropy with different trends for the alloys with recrystallized and deformed microstructure. The AA6061 and AA6063 alloys with recrystallized microstructure have lower failure strain in the 45° direction than in the ED, while the opposite is the case for the AA6110 alloy with deformed microstructure. In a numerical study, Frodal et al. [4] found that the plastic anisotropy caused by the crystallographic texture has a marked influence on the tensile ductility and leads to failure anisotropy. The main trends seen in these numerical simulations for alloys with recrystallized and deformed microstructure, respectively, are in overall agreement with the trends in Figure 11. Thus, the differences in failure anisotropy are mainly attributed to the different crystallographic texture of the alloys. The crystallographic texture governs to a large extent the plastic anisotropy of an alloy and thereby affects the failure anisotropy.
However, there are differences in the failure anisotropy between the two alloys with recrystallized microstructure which cannot be explained by differences in crystallographic texture. The ductility in the TD is lower than the ductility in the ED for alloy AA6061, while the opposite is the case for alloy AA6063. In addition to plastic anisotropy, the shape of the grains, voids and constituent particles (i.e., morphological anisotropy) and the alignment of the constituent particles in stringer-type clusters (i.e., topological anisotropy) are factors that affect the failure anisotropy to various degree [7]. Table 2 shows that while the grains of alloy AA6063 are nearly equi-axed, the grains of alloy AA6061 are elongated in the ED and TD relative to the ND. This morphological anisotropy of the AA6061 alloy is a plausible reason for the lower ductility in the TD relative to the ED for this alloy. Topological anisotropy in the form of stringer-type clusters along the ED are observed to a larger extent for alloy AA6063 than for alloy AA6061 (see examples in Figure 5). In addition, a large fraction of the constituent particles imaged in the ED-ND and TD-ND planes of alloy AA6063 was elongated. However, while the particles in the ED-ND plane were oriented along the ED, the orientation in the TD-ND plane appeared to be random. In contrast, the constituent particles were mostly equi-axed for alloy AA6061. The topological and morphological anisotropy of alloy AA6063 caused by the constituent particles is expected to give a reduced ductility in the TD [7,8,9,13], which is not evident from the experimental data in Figure 11. A possible reason for the relatively high ductility in the TD for alloy AA6063 is the anisotropic work hardening. The work-hardening rate at large strains is considerably higher in the TD compared to the ED for alloy AA6063, while for alloy AA6061 the work-hardening rate is more similar in these directions. The work hardening is known to be important for the ductility as a high work hardening increases the failure strain by spreading the plasticity and thus leading to a larger resistance against strain localization [4].
Another difference between the alloys AA6061 and AA6063 is the diamond-shaped fracture surface of the two notched specimens of alloy AA6063 in the 90° direction. It has been shown by Khadyko et al. [34] using crystal plasticity finite element simulations that the evolution of the diamond-shaped cross-section is caused by the strong cube texture of the material, in combination with the superimposed triaxial stress state of the notched specimen [3]. Both alloys have a strong cube texture, but none of the specimens of alloy AA6061 developed a diamond-shaped fracture surface. From crystal plasticity finite element simulations, it is observed that the development of the diamond shape occurs gradually towards fracture. The reason for the observed difference is assumed to be the lower fracture strain of alloy AA6061, i.e., the strain measured after separation of the specimen into two parts, which implies that fracture occurs before the diamond shape has developed. In the Supplementary Materials, the fracture strain calculated from post-experimental measurements of the fractured cross-section is tabulated for all tests and further, some stress-strain curves are plotted to fracture to support this conjecture.
The introduction of a notch reduces the ductility substantially for all materials, cf. Figure 7, which is caused by the increased stress triaxiality of the stress state within the notch region. The failure strain of the notch specimens relative to the smooth specimen, i.e., the normalized failure strain, is shown in Figure 8. It revealed a generally lower notch sensitivity of alloy AA6110 relative to the other two alloys. Recall that alloy AA6110 has a deformed microstructure with flat, pancake-shaped grains, while the other two alloys have a recrystallized microstructure with comparably large equi-axed or somewhat elongated grains. It is known that the grain size could be important for the ductility, and that smaller grains are preferable [3]. The deformed microstructure of alloy AA6110 appears to be more favorable for ductility than the recrystallized microstructure of the other two alloys when subjected to the multi-axial stress state that occurs in the notch. The stress level is also known to be important for the nucleation of voids in aluminum alloys [38], where both the flow stress and the hydrostatic stress are of importance. For alloy AA6110, the stress level is possibly sufficiently high to make void nucleation a favorable mechanism for damage evolution in all specimen geometries. The stress level of alloy AA6063 is much lower, making void nucleation a less favorable mechanism for the smooth specimen, while for the notched specimens, the higher stress triaxiality, or hydrostatic stress, is more likely to promote void nucleation. This difference may contribute to the markedly different notch sensitivity of these two alloys. Regarding alloy AA6061, the stress level is similar to in alloy AA6110, but the notch sensitivity is much higher. It is possible that the smaller-sized particles of alloy AA6061 may require even higher stress levels for void nucleation, and in that sense change the behavior more towards what was observed for alloy AA6063.

5.3. Effects of Extrusion on Ductility

The stress-strain curves of the three alloys in the cast and homogenized condition from Thomesen et al. [28] were compared with the directional stress-strain curves after extrusion in Figure 16. In the cast and homogenized condition, the alloys AA6061 and AA6063 failed at approximately the same strain, while the failure strain of alloy AA6110 was significantly lower. From the particle characterization of the alloys in the cast and homogenized condition, see Thomesen et al. [28], it was found that the AA6061 and AA6063 alloys both had a large number of smaller particles, while only small amounts of large particles were found. In general, the particles were the smallest and the highest in number for alloy AA6061. This was in contrast to the AA6110 alloy where higher fractions of large particles were found in combination with a reduced number of smaller particles. Also, the area fraction of constituent particles was the highest for alloy AA6110. The combination of a high area fraction of particles and a high number of large particles is believed to be the main reason for the low ductility of alloy AA6110 compared to the alloys AA6061 and AA6063 in the cast and homogenized condition. Although all three alloys show a marked fracture anisotropy after extrusion, the overall trend is that the ductility is significantly higher than the ductility in the cast and homogenized condition. The increase in ductility with extrusion is clearly seen in Figure 16, and is mainly caused by the breaking of the larger particles during the extrusion process [2]. The shift in particle size distribution was evident when comparing the particle size distribution plots in Figure 5 to the corresponding plots for the alloys in the cast and homogenized condition presented in Thomesen et al. [28]. In addition, the extrusion process leads to a more homogeneous distribution of the particles in the materials.
Figure 16 shows that the relative increase in ductility after extrusion is more significant for the alloys AA6063 and AA6110 than for alloy AA6061. This finding is attributed to the relative shift in particle sizes. For alloy AA6061 there were mainly smaller particles before extrusion, hence the breaking of the largest particles gives a smaller positive contribution to the ductility. This is in contrast to the other alloys, and especially alloy AA6110, where the number of larger particles was significantly higher before extrusion. In addition, the grain structure, i.e., the size and shape of the grains, is deemed to be of importance for the ductility of the alloys [3,10]. The average grain size of the alloys AA6061 and AA6063 was reduced to near half the size after extrusion (somewhat less reduction in ED for alloy AA6061). For alloy AA6110, the grain structure changed from equi-axed grains in the cast and homogenized condition to a non-recrystallized structure with flat, pancake-shaped grains after extrusion, which could explain the comparably large increase in ductility of the AA6110 alloy after extrusion.

6. Concluding Remarks

The effect of anisotropy on plasticity and ductile fracture of three extruded 6000-series aluminum alloys, i.e., AA6061, AA6063 and AA6110, has been investigated through comprehensive characterizations of the microstructure and the macroscopic stress-strain behavior under multi-axial stress states. Lines were drawn to the same materials in the cast and homogenized condition to reveal the effect of the extrusion process on material properties and microstructural features. The main observations are summarized in the following:
  • The plastic anisotropy represented by the distribution of the stress ratios (i.e., normalized directional yield stresses) and strain ratios (i.e., R-values or Lankford coefficients) was similar for the AA6061 and AA6063 alloys with recrystallization texture and markedly different for the AA6110 alloy with deformation texture.
  • The AA6061 and AA6063 alloys with recrystallized microstructure exhibited substantial anisotropic work hardening which was attributed to differences in the texture evolution between the tensile directions. A smaller amount of anisotropic hardening was found for the AA6110 alloy with deformed, non-recrystallized microstructure.
  • The three alloys exhibited failure anisotropy which was markedly influenced by the plastic anisotropy and thus by the crystallographic texture. The differences in the failure anisotropy between the AA6061 and AA6063 alloys with recrystallization texture were attributed to morphological and topological anisotropy and anisotropic work hardening.
  • A general increase in ductility was observed for all three alloys after extrusion, which was mostly attributed to the breaking-up and redistribution of the constituent particles as a result of the extrusion process. The increase in ductility after extrusion was the least for alloy AA6061 which experienced less reduction in particle size and grain size than the other two alloys.
  • The notch sensitivity of alloy AA6110 was somewhat higher in the cast and homogenized condition, while after extrusion this alloy displayed a markedly lower notch sensitivity than the other two alloys in all tensile directions. The main reason for the significant change in notch sensitivity of alloy AA6110, which was non-recrystallized after extrusion, is assumed to be a more favorable grain structure. In addition, there are significant differences in the stress levels and average particle sizes between the alloys. These differences may impact void nucleation, thus affecting the notch sensitivity.

Supplementary Materials

The following are available online at https://www.mdpi.com/article/10.3390/met11040557/s1, Figure S1: Grain structure in the ND-TD plane obtained using an optical microscope for the alloys (a) AA6061, (b) AA6063 and (c) AA6110, Figure S2: True stress versus logarithmic strain curves for the recrystallized alloys AA6061 and AA6063 in the 90° direction for the notched specimens (a) R2.0, and (b) R0.8. The curves are presented to fracture, defined by separation of the two specimen halves. Failure is marked by an ( × ), and indicates the point at maximum true stress, Figure S3: Fracture surfaces of representative tension tests in the 0°, 45° and 90° directions of the R2.0 specimen for alloy AA6061, Figure S4: Fracture surfaces of representative tension tests in the 0°, 45° and 90° directions of the R2.0 specimen for alloy AA6063, Figure S5: Fracture surfaces of representative tension tests in the 0°, 45° and 90° directions of the R2.0 specimen for alloy AA6110, Table S1: Particle size measurements for the extruded materials, Table S2: Characteristic stress and strain values from the tension tests of alloy AA6061 given at 0.2% plastic strain, necking and failure, in addition to the strain at fracture calculated from post-experimental measurements of the fractured cross-section area, Table S3: Characteristic stress and strain values from the tension tests of alloy AA6063 given at 0.2% plastic strain, necking and failure, in addition to the strain at fracture calculated from post-experimental measurements of the fractured cross-section area, Table S4: Characteristic stress and strain values from the tension tests of alloy AA6110 given at 0.2% plastic strain, necking and failure, in addition to the strain at fracture calculated from post-experimental measurements of the fractured cross-section area.

Author Contributions

Conceptualization, O.S.H. and T.B.; formal analysis, S.T.; investigation, S.T.; writing—original draft preparation, S.T., O.S.H. and T.B.; writing—review and editing, S.T., O.S.H. and T.B.; visualization, S.T.; supervision, O.S.H. and T.B. All authors have read and agreed to the published version of the manuscript.

Funding

The authors gratefully appreciate the financial support from Norwegian University of Science and Technology (NTNU) and the Research Council of Norway through the FRINATEK Program FractAl, Project No. 250553.

Institutional Review Board Statement

Not applicable.

Informed Consent Statement

Not applicable.

Data Availability Statement

The raw/processed data required to reproduce these findings cannot be shared at this time as the data also forms part of an ongoing study. However, the data used to support the findings of this study may be made available from the corresponding author upon request.

Conflicts of Interest

The authors declare no conflict of interest.

References

  1. Engler, O.; Randle, V. Introduction to Texture Analysis: Macrotexture, Microtexture, and Orientation Mapping, 2nd ed.; CRC Press, Taylor & Francis Group: Boca Raton, FL, USA, 2010. [Google Scholar]
  2. Pedersen, K.O.; Westermann, I.; Furu, T.; Børvik, T.; Hopperstad, O.S. Influence of microstructure on work-hardening and ductile fracture of aluminium alloys. Mater. Des. 2015, 70, 31–44. [Google Scholar] [CrossRef]
  3. Frodal, B.H.; Pedersen, K.O.; Børvik, T.; Hopperstad, O.S. Influence of pre-compression on the ductility of AA6xxx aluminium alloys. Int. J. Fract. 2017, 206, 131–149. [Google Scholar] [CrossRef]
  4. Frodal, B.H.; Morin, D.; Børvik, T.; Hopperstad, O.S. On the effect of plastic anisotropy, strength and work hardening on the tensile ductility of aluminium alloys. Int. J. Solids Struct. 2020, 188–189, 118–132. [Google Scholar] [CrossRef]
  5. Khadyko, M.; Marioara, C.D.; Dumoulin, S.; Børvik, T.; Hopperstad, O.S. Effects of heat-treatment on the plastic anisotropy of extruded aluminium alloy AA6063. Mater. Sci. Eng. A 2017, 708, 208–221. [Google Scholar] [CrossRef]
  6. Delannay, L.; Melchior, M.A.; Signorelli, J.W.; Remacle, J.F.; Kuwabara, T. Influence of grain shape on the planar anisotropy of rolled steel sheets—Evaluation of three models. Comput. Mater. Sci. 2009, 45, 739–743. [Google Scholar] [CrossRef]
  7. Hannard, F.; Simar, A.; Maire, E.; Pardoen, T. Quantitative assessment of the impact of second phase particle arrangement on damage and fracture anisotropy. Acta Mater. 2018, 148, 456–466. [Google Scholar] [CrossRef]
  8. Benzerga, A.A.; Besson, J.; Pineau, A. Anisotropic ductile fracture. Part I: Experiments. Acta Mater. 2004, 52, 4623–4638. [Google Scholar] [CrossRef]
  9. Beremin, F.M. Cavity formation from inclusions in ductile fracture of A508 steel. Metall. Trans. A 1981, 12, 723–731. [Google Scholar] [CrossRef]
  10. Lohne, O.; Naess, O.J. The Effect of Dispersoids and Grain Size on Mechanical Properties of AlMgSi Alloys. In Strength of Metals and Alloys; Pergamon: Oxford, UK, 1979; pp. 781–788. [Google Scholar]
  11. Frodal, B.H.; Christiansen, E.; Myhr, O.R.; Hopperstad, O.S. The role of quench rate on the plastic flow and fracture of three aluminium alloys with different grain structure and texture. Int. J. Eng. Sci. 2020, 150, 103257. [Google Scholar] [CrossRef]
  12. Westermann, I.; Snilsberg, K.E.; Sharifi, Z.; Hopperstad, O.S.; Marthinsen, K.; Holmedal, B. Three-Point Bending of Heat-Treatable Aluminum Alloys: Influence of Microstructure and Texture on Bendability and Fracture Behavior. Metall. Mater. Trans. A 2011, 42, 3386–3398. [Google Scholar] [CrossRef] [Green Version]
  13. Thomson, C.I.A.; Worswick, M.J.; Pilkey, A.K.; Lloyd, D.J. Void coalescence within periodic clusters of particles. J. Mech. Phys. Solids 2003, 51, 127–146. [Google Scholar] [CrossRef]
  14. Clausen, A.H.; Børvik, T.; Hopperstad, O.S.; Benallal, A. Flow and fracture characteristics of aluminium alloy AA5083-H116 as function of strain rate, temperature and triaxiality. Mater. Sci. Eng. A 2004, 364, 260–272. [Google Scholar] [CrossRef]
  15. Steglich, D.; Brocks, W.; Heerens, J.; Pardoen, T. Anisotropic ductile fracture of Al 2024 alloys. Eng. Fract. Mech. 2008, 75, 3692–3706. [Google Scholar] [CrossRef] [Green Version]
  16. Kuwabara, T.; Mori, T.; Asano, M.; Hakoyama, T.; Barlat, F. Material modeling of 6016-O and 6016-T4 aluminum alloy sheets and application to hole expansion forming simulation. Int. J. Plast. 2017, 93, 164–186. [Google Scholar] [CrossRef]
  17. Erice, B.; Roth, C.C.; Mohr, D. Stress-state and strain-rate dependent ductile fracture of dual and complex phase steel. Mech. Mater. 2018, 116, 11–32. [Google Scholar] [CrossRef]
  18. Perez-Martin, M.J.; Holmen, J.K.; Thomesen, S.; Hopperstad, O.S.; Børvik, T. Dynamic Behaviour of a High-Strength Structural Steel at Low Temperatures. J. Dyn. Behav. Mater. 2019, 5, 241–250. [Google Scholar] [CrossRef] [Green Version]
  19. Kristoffersen, M.; Costas, M.; Koenis, T.; Brøtan, V.; Paulsen, C.O.; Børvik, T. On the ballistic perforation resistance of additive manufactured AlSi10Mg aluminium plates. Int. J. Impact Eng. 2020, 137, 103476. [Google Scholar] [CrossRef]
  20. Costas, M.; Morin, D.; de Lucio, M.; Langseth, M. Testing and simulation of additively manufactured AlSi10Mg components under quasi-static loading. Eur. J. Mech. A/Solids 2020, 81, 103966. [Google Scholar] [CrossRef]
  21. Achani, D.; Hopperstad, O.S.; Lademo, O.G. Behaviour of extruded aluminium alloys under proportional and non-proportional strain paths. J. Mater. Process. Technol. 2009, 209, 4750–4764. [Google Scholar] [CrossRef]
  22. Fourmeau, M.; Børvik, T.; Benallal, A.; Lademo, O.G.; Hopperstad, O.S. On the plastic anisotropy of an aluminium alloy and its influence on constrained multiaxial flow. Int. J. Plast. 2011, 27, 2005–2025. [Google Scholar] [CrossRef]
  23. Fourmeau, M.; Børvik, T.; Benallal, A.; Hopperstad, O.S. Anisotropic failure modes of high-strength aluminium alloy under various stress states. Int. J. Plast. 2013, 48, 34–53. [Google Scholar] [CrossRef] [Green Version]
  24. Luo, M.; Rousselier, G. Modeling of large strain multi-axial deformation of anisotropic metal sheets with strength-differential effect using a Reduced Texture Methodology. Int. J. Plast. 2014, 53, 66–89. [Google Scholar] [CrossRef]
  25. Khadyko, M.; Myhr, O.R.; Hopperstad, O.S. Work hardening and plastic anisotropy of naturally and artificially aged aluminium alloy AA6063. Mech. Mater. 2019, 136, 103069. [Google Scholar] [CrossRef]
  26. Khadyko, M.; Morin, D.; Børvik, T.; Hopperstad, O.S. Tensile ductility of extruded aluminium alloy AA6063 in different tempers. Mater. Sci. Eng. A 2019, 744, 500–511. [Google Scholar] [CrossRef]
  27. Morin, D.; Fourmeau, M.; Børvik, T.; Benallal, A.; Hopperstad, O.S. Anisotropic tensile failure of metals by the strain localization theory: An application to a high-strength aluminium alloy. Eur. J. Mech. A/Solids 2018, 69, 99–112. [Google Scholar] [CrossRef]
  28. Thomesen, S.; Hopperstad, O.S.; Myhr, O.R.; Børvik, T. Influence of stress state on plastic flow and ductile fracture of three 6000-series aluminium alloys. Mater. Sci. Eng. A 2020, 783, 139295. [Google Scholar] [CrossRef]
  29. Thomesen, S. Plastic Flow and Fracture of Isotropic and Anisotropic 6000-Series Aluminium Alloys: Experiments and Numerical Simulations. Ph.D. Thesis, Norwegian University of Science and Technology, Trondheim, Norway, 2019. [Google Scholar]
  30. Sample Preparation for Texture Measurements in Siemens Diffractometer D5000. Available online: https://www.ntnu.no/wiki/display/imtlab/XRD?preview=/82478244/127993077/sample_preparation.pdf (accessed on 7 June 2019).
  31. Chen, Y.; Pedersen, K.O.; Clausen, A.H.; Hopperstad, O.S. An experimental study on the dynamic fracture of extruded AA6xxx and AA7xxx aluminium alloys. Mater. Sci. Eng. A 2009, 523, 253–262. [Google Scholar] [CrossRef]
  32. Fourmeau, M.; Marioara, C.D.; Børvik, T.; Benallal, A.; Hopperstad, O.S. A study of the influence of precipitate-free zones on the strain localization and failure of the aluminium alloy AA7075-T651. Philos. Mag. 2015, 95, 3278–3304. [Google Scholar] [CrossRef]
  33. Khadyko, M.; Dumoulin, S.; Børvik, T.; Hopperstad, O.S. An experimental-numerical method to determine the work-hardening of anisotropic ductile materials at large strains. Int. J. Mech. Sci. 2014, 88, 25–36. [Google Scholar] [CrossRef]
  34. Khadyko, M.; Dumoulin, S.; Børvik, T.; Hopperstad, O.S. Simulation of large-strain behaviour of aluminium alloy under tensile loading using anisotropic plasticity models. Comput. Struct. 2015, 157, 60–75. [Google Scholar] [CrossRef] [Green Version]
  35. Westermann, I.; Pedersen, K.O.; Furu, T.; Børvik, T.; Hopperstad, O.S. Effects of particles and solutes on strength, work-hardening and ductile fracture of aluminium alloys. Mech. Mater. 2014, 79, 58–72. [Google Scholar] [CrossRef]
  36. Maire, E.; Zhou, S.; Adrien, J.; Dimichiel, M. Damage quantification in aluminium alloys using in situ tensile tests in X-ray tomography. Eng. Fract. Mech. 2011, 78, 2679–2690. [Google Scholar] [CrossRef]
  37. Pineau, A.; Benzerga, A.A.; Pardoen, T. Failure of metals I: Brittle and ductile fracture. Acta Mater. 2016, 107, 424–483. [Google Scholar] [CrossRef] [Green Version]
  38. Anderson, T.L. Fracture Mechanics: Fundamentals and Applications, 3rd ed.; CRC Press, Taylor & Francis Group: Boca Raton, FL, USA, 2005. [Google Scholar]
  39. Remøe, M.S.; Marthinsen, K.; Westermann, I.; Pedersen, K.; Røyset, J.; Marioara, C. The effect of alloying elements on the ductility of Al-Mg-Si alloys. Mater. Sci. Eng. A 2017, 693, 60–72. [Google Scholar] [CrossRef] [Green Version]
  40. Saai, A.; Hopperstad, O.S.; Dumoulin, S.; Tabourot, L. Numerical Study on the Influence of Crystallographic Texture and Grain Shape on the Yield Surface of Textured Aluminum Sheet Material. In Proceedings of the Aluminium Alloys 2014—ICAA14, Trondheim, Norway, 15–19 June 2014; Volume 794, pp. 584–589. [Google Scholar]
  41. Frodal, B.H.; Dæhli, L.E.B.; Børvik, T.; Hopperstad, O.S. Modelling and simulation of ductile failure in textured aluminium alloys subjected to compression-tension loading. Int. J. Plast. 2019, 118, 36–69. [Google Scholar] [CrossRef]
  42. Barlat, F.; Ferreira Duarte, J.M.; Gracio, J.J.; Lopes, A.B.; Rauch, E.F. Plastic flow for non-monotonic loading conditions of an aluminum alloy sheet sample. Int. J. Plast. 2003, 19, 1215–1244. [Google Scholar] [CrossRef]
  43. Plunkett, B.; Lebensohn, R.A.; Cazacu, O.; Barlat, F. Anisotropic yield function of hexagonal materials taking into account texture development and anisotropic hardening. Acta Mater. 2006, 54, 4159–4169. [Google Scholar] [CrossRef]
  44. Thomesen, S.; Hopperstad, O.S.; Børvik, T. On the Material Characterization of an Aluminium Alloy Using Different Specimens and Identification Methods. In Proceedings of the 18th International Conference on Experimental Mechanics, Brussels, Belgium, 1–5 July 2018; Volume 2, p. 400. [Google Scholar]
  45. Khadyko, M.; Myhr, O.R.; Dumoulin, S.; Hopperstad, O.S. A microstructure-based yield stress and work-hardening model for textured 6xxx aluminium alloys. Philos. Mag. 2016, 96, 1047–1072. [Google Scholar] [CrossRef] [Green Version]
Figure 1. Coordinate system of (a) the extruded profiles, and (b) the axisymmetric tensile test specimens. The asterisk (*) differentiates the transverse direction of the profile (TD) from the transverse direction of the specimen (TD*).
Metals 11 00557 g001
Figure 2. Nominal geometries of the (a) smooth, (b) notch R2.0 and (c) notch R0.8 tension test specimens. The red line in the rightmost figure in each sub-figure represents the ND of the extruded profile, and was marked physically on the specimens. All measures are in mm.
Metals 11 00557 g002
Figure 3. Optical micrographs of the grain structure after extrusion of the alloys (a) AA6061, (b) AA6063 and (c) AA6110, showing recrystallized (AA6061 and AA6063) and non-recrystallized (AA6110) grain structures.
Metals 11 00557 g003
Figure 4. Grain orientation mapping for alloy AA6110 obtained from EBSD measurements, showing the non-recrystallized grain structure of the alloy. Please note that the cutoff value for individual grains is defined for a misorientation angle greater than 2°.
Metals 11 00557 g004
Figure 5. Results from the characterization of the constituent particles of the extruded alloys (a) AA6061, (b) AA6063 and (c) AA6110. The figure shows images of constituent particles in the alloys (two leftmost columns) along with their respective particle size distribution plots (rightmost column) in terms of area fraction of constituent particles versus equivalent diameter. The bar plots are based on the images in the ND-TD plane, and each bar represents a 0.25 μm interval of the equivalent diameter. Please note that particles with an equivalent diameter smaller than 0.2 μm were omitted to avoid analyzing dispersoids.
Metals 11 00557 g005
Figure 6. Orientation distribution functions (ODFs) for the alloys (a) AA6061, (b) AA6063 and (c) AA6110, indicating their crystallographic texture, where (d) show the location of the individual texture components. The scale bar gives the intensity of the function, where the maximum intensity Fmax of the ODF is given at the top of each sub-figure.
Metals 11 00557 g006
Figure 7. Representative stress-strain curves for all tested combinations of tensile direction and specimen geometry of alloy (a) AA6061, (b) AA6063 and (c) AA6110. The × marks failure at maximum true stress.
Metals 11 00557 g007
Figure 8. Notch sensitivity in terms of normalized failure strain of an alloy as function of specimen type, shown for the (a) 0° direction, (b) 45° direction and (c) 90° direction. The normalized failure strain is defined as the failure strain of the notched specimen (R2.0 or R0.8) divided by the failure strain of the smooth specimen. Average values of the normalized failure strain for all repeat tests are represented by the bars, while the scatter bars indicate the data range.
Metals 11 00557 g008
Figure 9. Stress ratio versus tensile direction from the tensile tests on the smooth specimen in the various tensile directions of alloy (a) AA6061, (b) AA6063 and (c) AA6110.
Metals 11 00557 g009
Figure 10. Transverse versus thickness strain curves plotted to failure (left column) for the alloys (a) AA6061, (c) AA6063 and (e) AA6110, and average strain ratio (R-value) up to necking versus tensile direction (right column) for the alloys (b) AA6061, (d) AA6063 and (f) AA6110, all taken from the tensile tests on the smooth specimen for the three alloys.
Metals 11 00557 g010
Figure 11. Failure strain versus tensile direction from the tensile tests on the smooth specimen of the alloys (a) AA6061, (b) AA6063 and (c) AA6110.
Metals 11 00557 g011
Figure 12. Fracture surfaces of representative tension tests for alloy AA6061. (a) Smooth, 0°, (b) Smooth, 45°, (c) Smooth, 90°, (d) R0.8, 0°, (e) R0.8, 45°, (f) R0.8, 90°.
Metals 11 00557 g012
Figure 13. Fracture surfaces of representative tension tests for alloy AA6063. (a) Smooth, 0°, (b) Smooth, 45°, (c) Smooth, 90°, (d) R0.8, 0°, (e) R0.8, 45°, (f) R0.8, 90°.
Metals 11 00557 g013
Figure 14. Fracture surfaces of representative tension tests for alloy AA6110. (a) Smooth, 0°, (b) Smooth, 45°, (c) Smooth, 90°, (d) R0.8, 0°, (e) R0.8, 45°, (f) R0.8, 90°.
Metals 11 00557 g014
Figure 15. Fracture surfaces showing (a) a classic dimple structure (AA6061, smooth, 90°), (b) large oversized dimples (AA6063, smooth, 22.5°) and (c) facets due to intergranular fracture (AA6063, R2.0, 0°).
Metals 11 00557 g015
Figure 16. Representative stress-strain curves from the tension tests on the smooth specimen for the three alloys in the extruded (EX) and the cast and homogenized (CH) conditions. The stress-strain curves of the two conditions are compared for each alloy: (a) AA6061, (b) AA6063 and (c) AA6110. The legend in sub-figure (a) is valid for all sub-figures.
Metals 11 00557 g016
Table 1. Chemical compositions of the alloys in wt%.
AlloyMgSiFeCuMnZnTiCrAl
AA60610.9030.6210.2090.2040.0380.0540.1060.060Bal.
AA60630.4700.5120.2060.0010.0470.0030.0060.001Bal.
AA61100.8280.7200.1960.2030.5060.0030.0260.157Bal.
Table 2. Average grain size found from EBSD measurements and total area fraction of constituent particles along with the 95% confidence interval (CI).
AlloyAverage Grain Size [μm]Constituent Particles
NDTDEDArea Fraction95% CI
AA60613464970.0042[0.0037, 0.0047]
AA60633036400.0063[0.0059, 0.0067]
AA61104– *– *0.0079[0.0074, 0.0084]
* Average grain size could not be accurately obtained.
Publisher’s Note: MDPI stays neutral with regard to jurisdictional claims in published maps and institutional affiliations.

