
Tests and Finite Element Simulation of Yield Anisotropy and Tension-Compression Strength Difference of an Extruded ZK60 Mg Alloy

Abstract
:1. Introduction
2. Materials and Methods
2.1. Materials
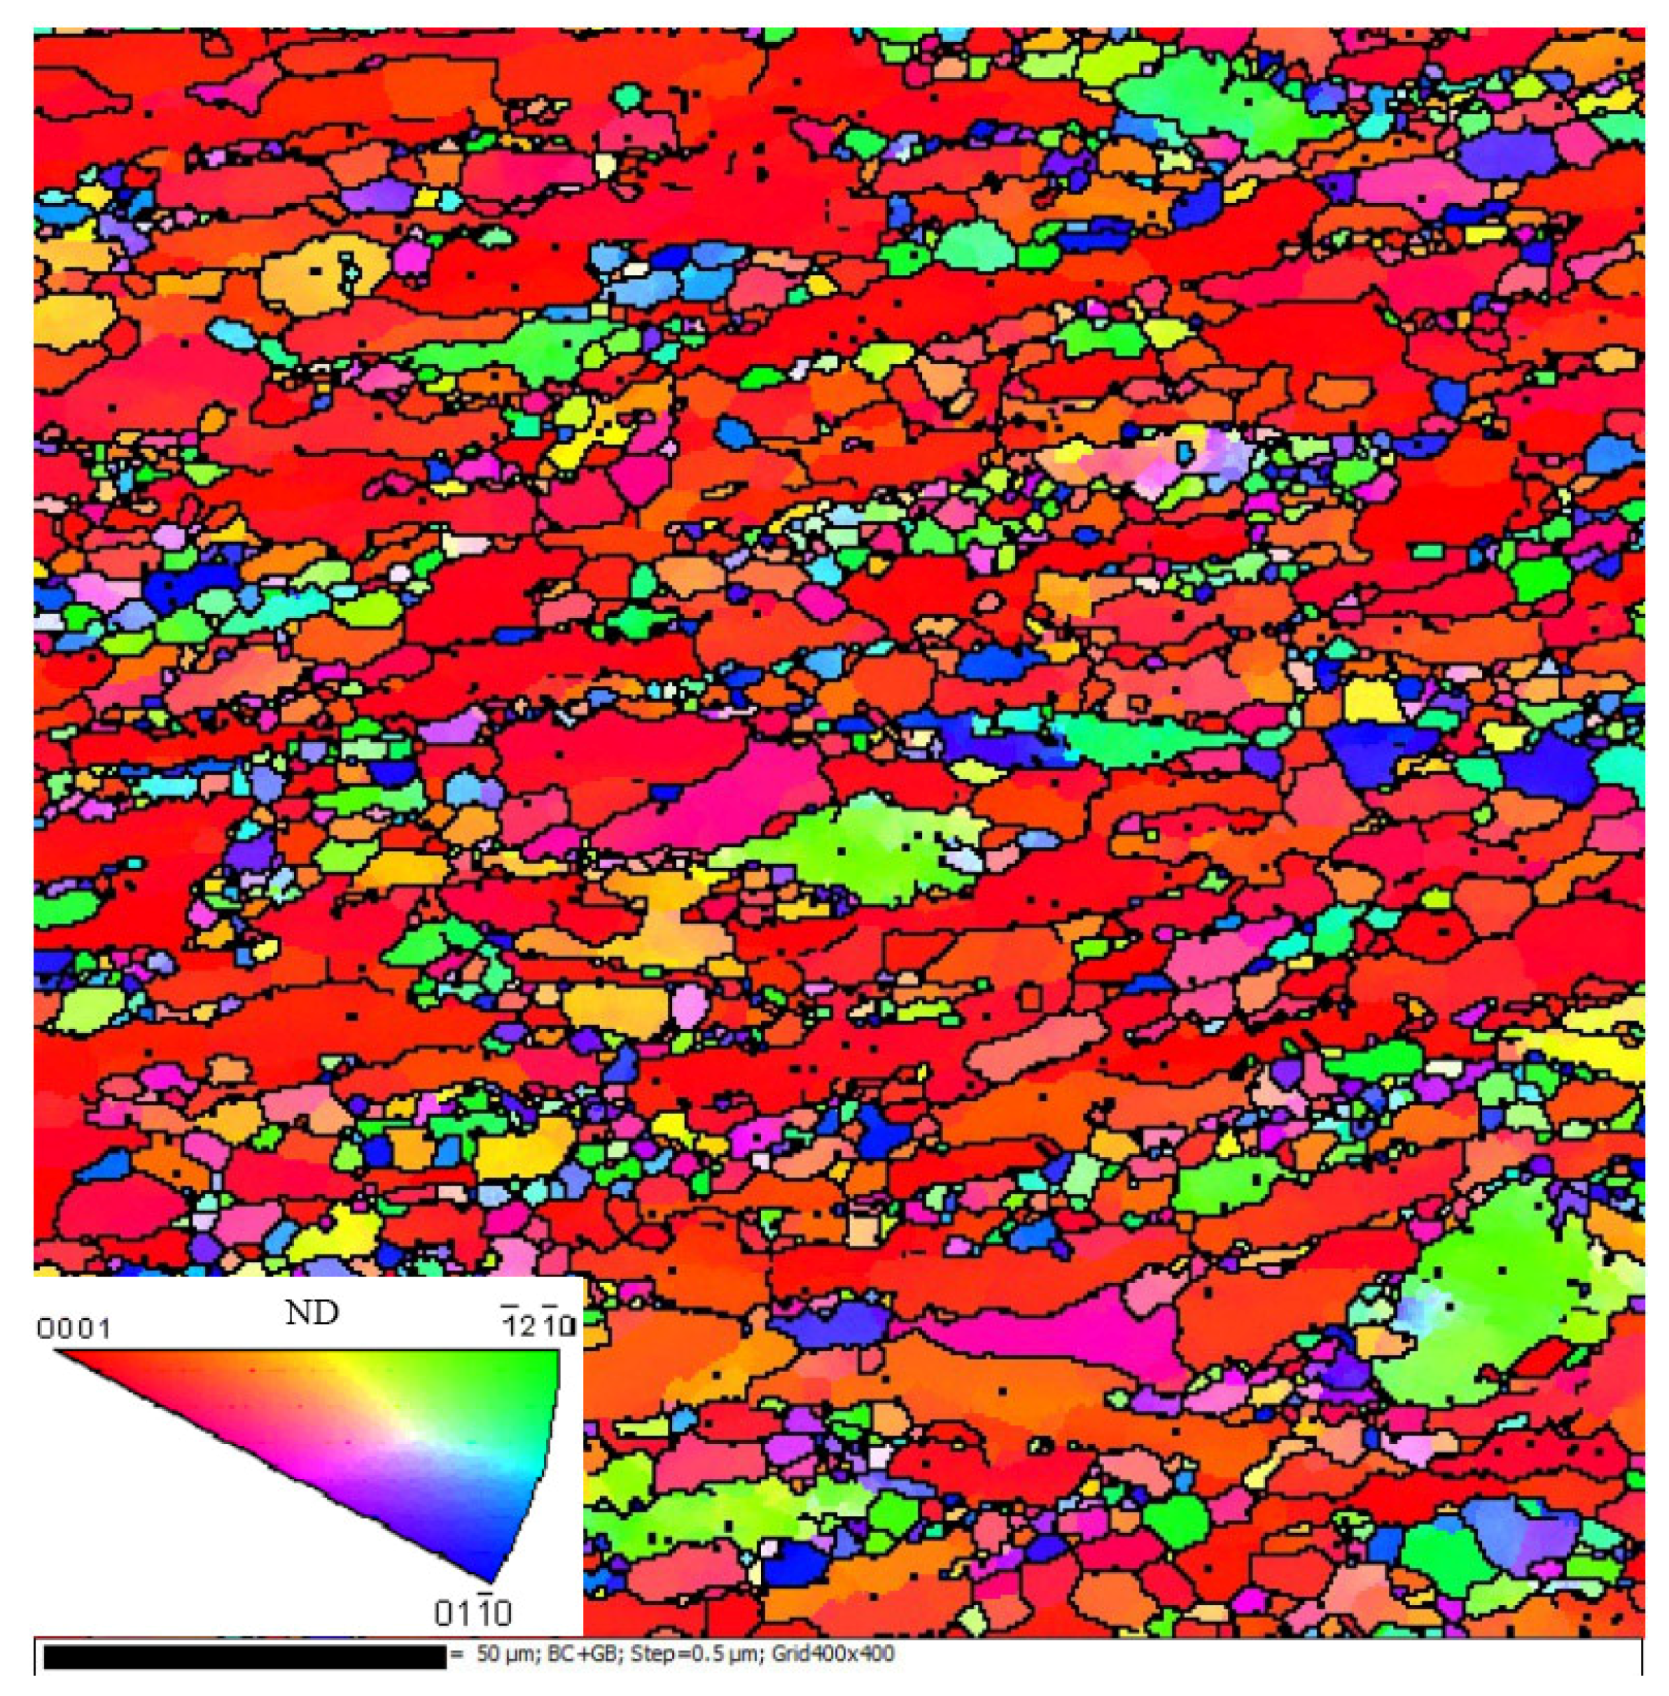
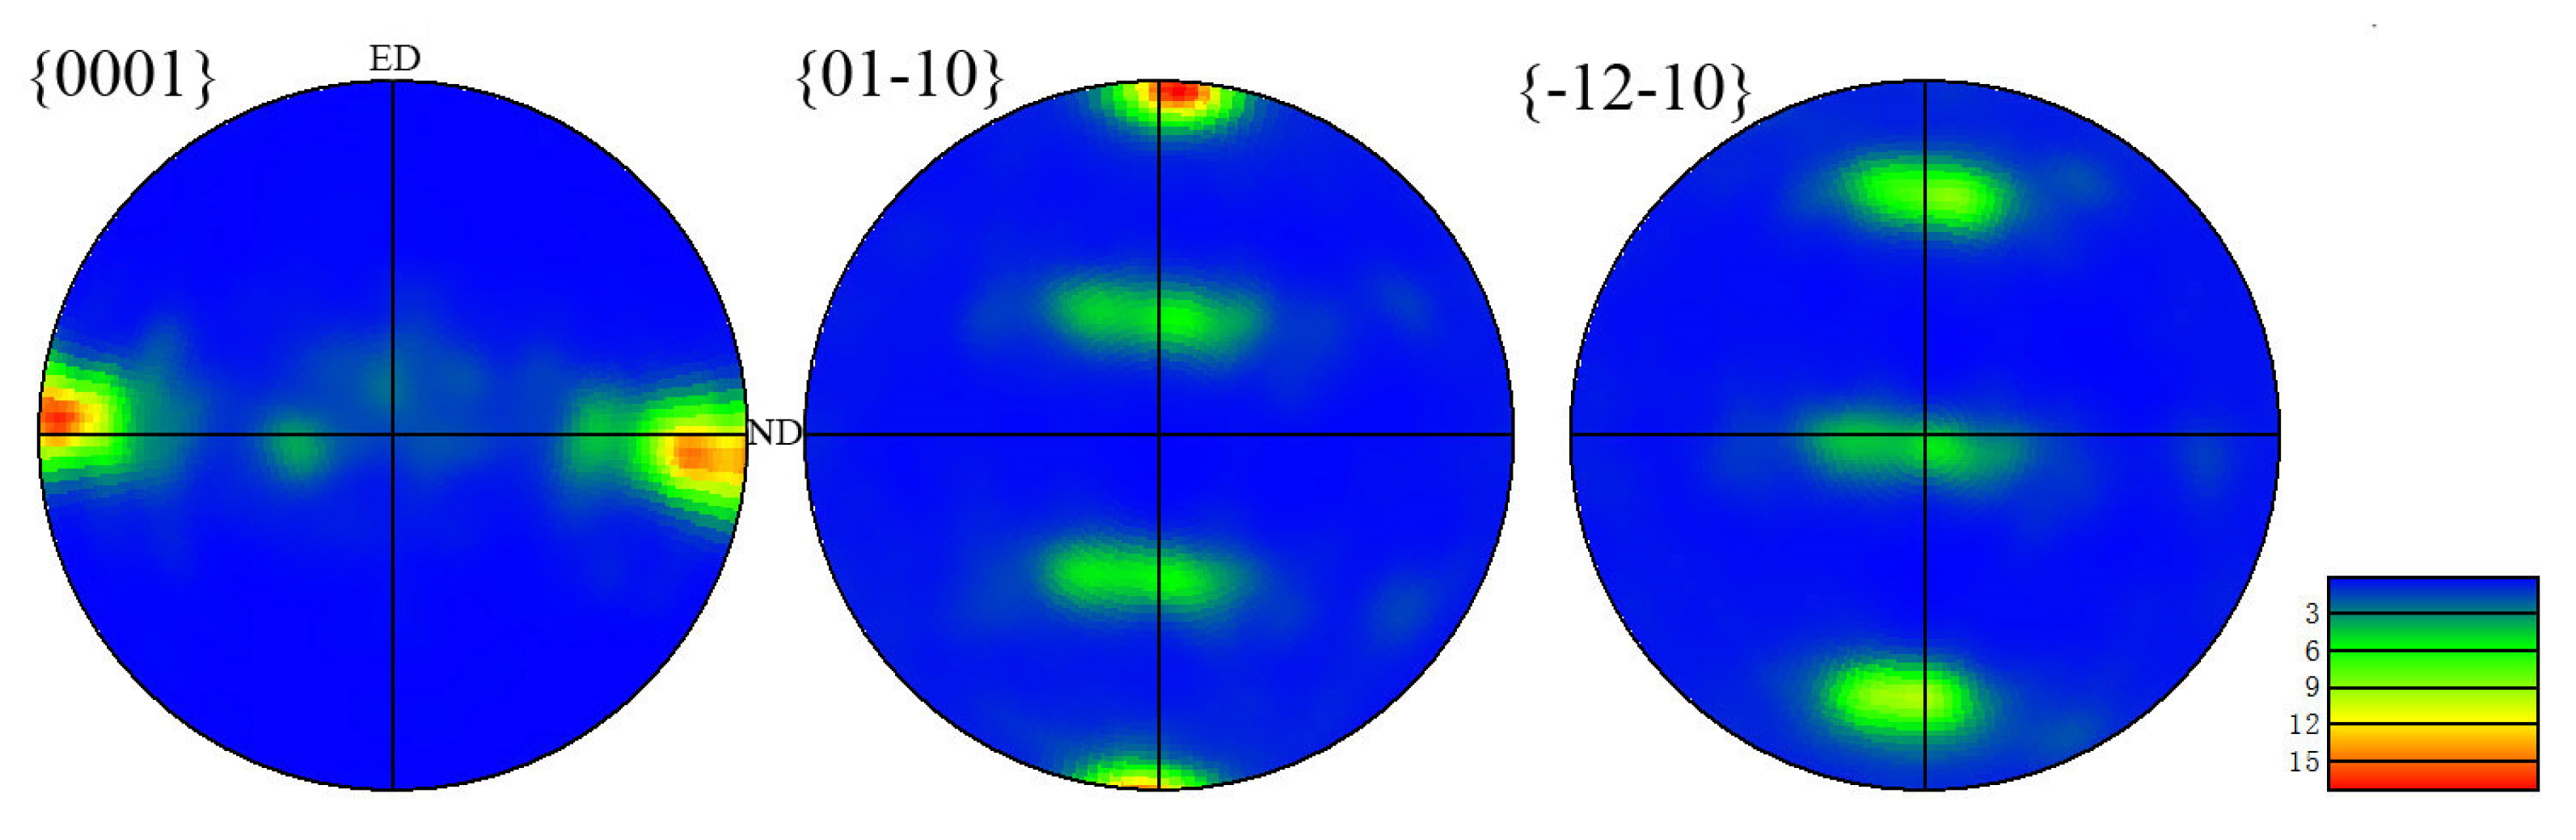
2.2. Electron Backscatter Diffraction Characterization
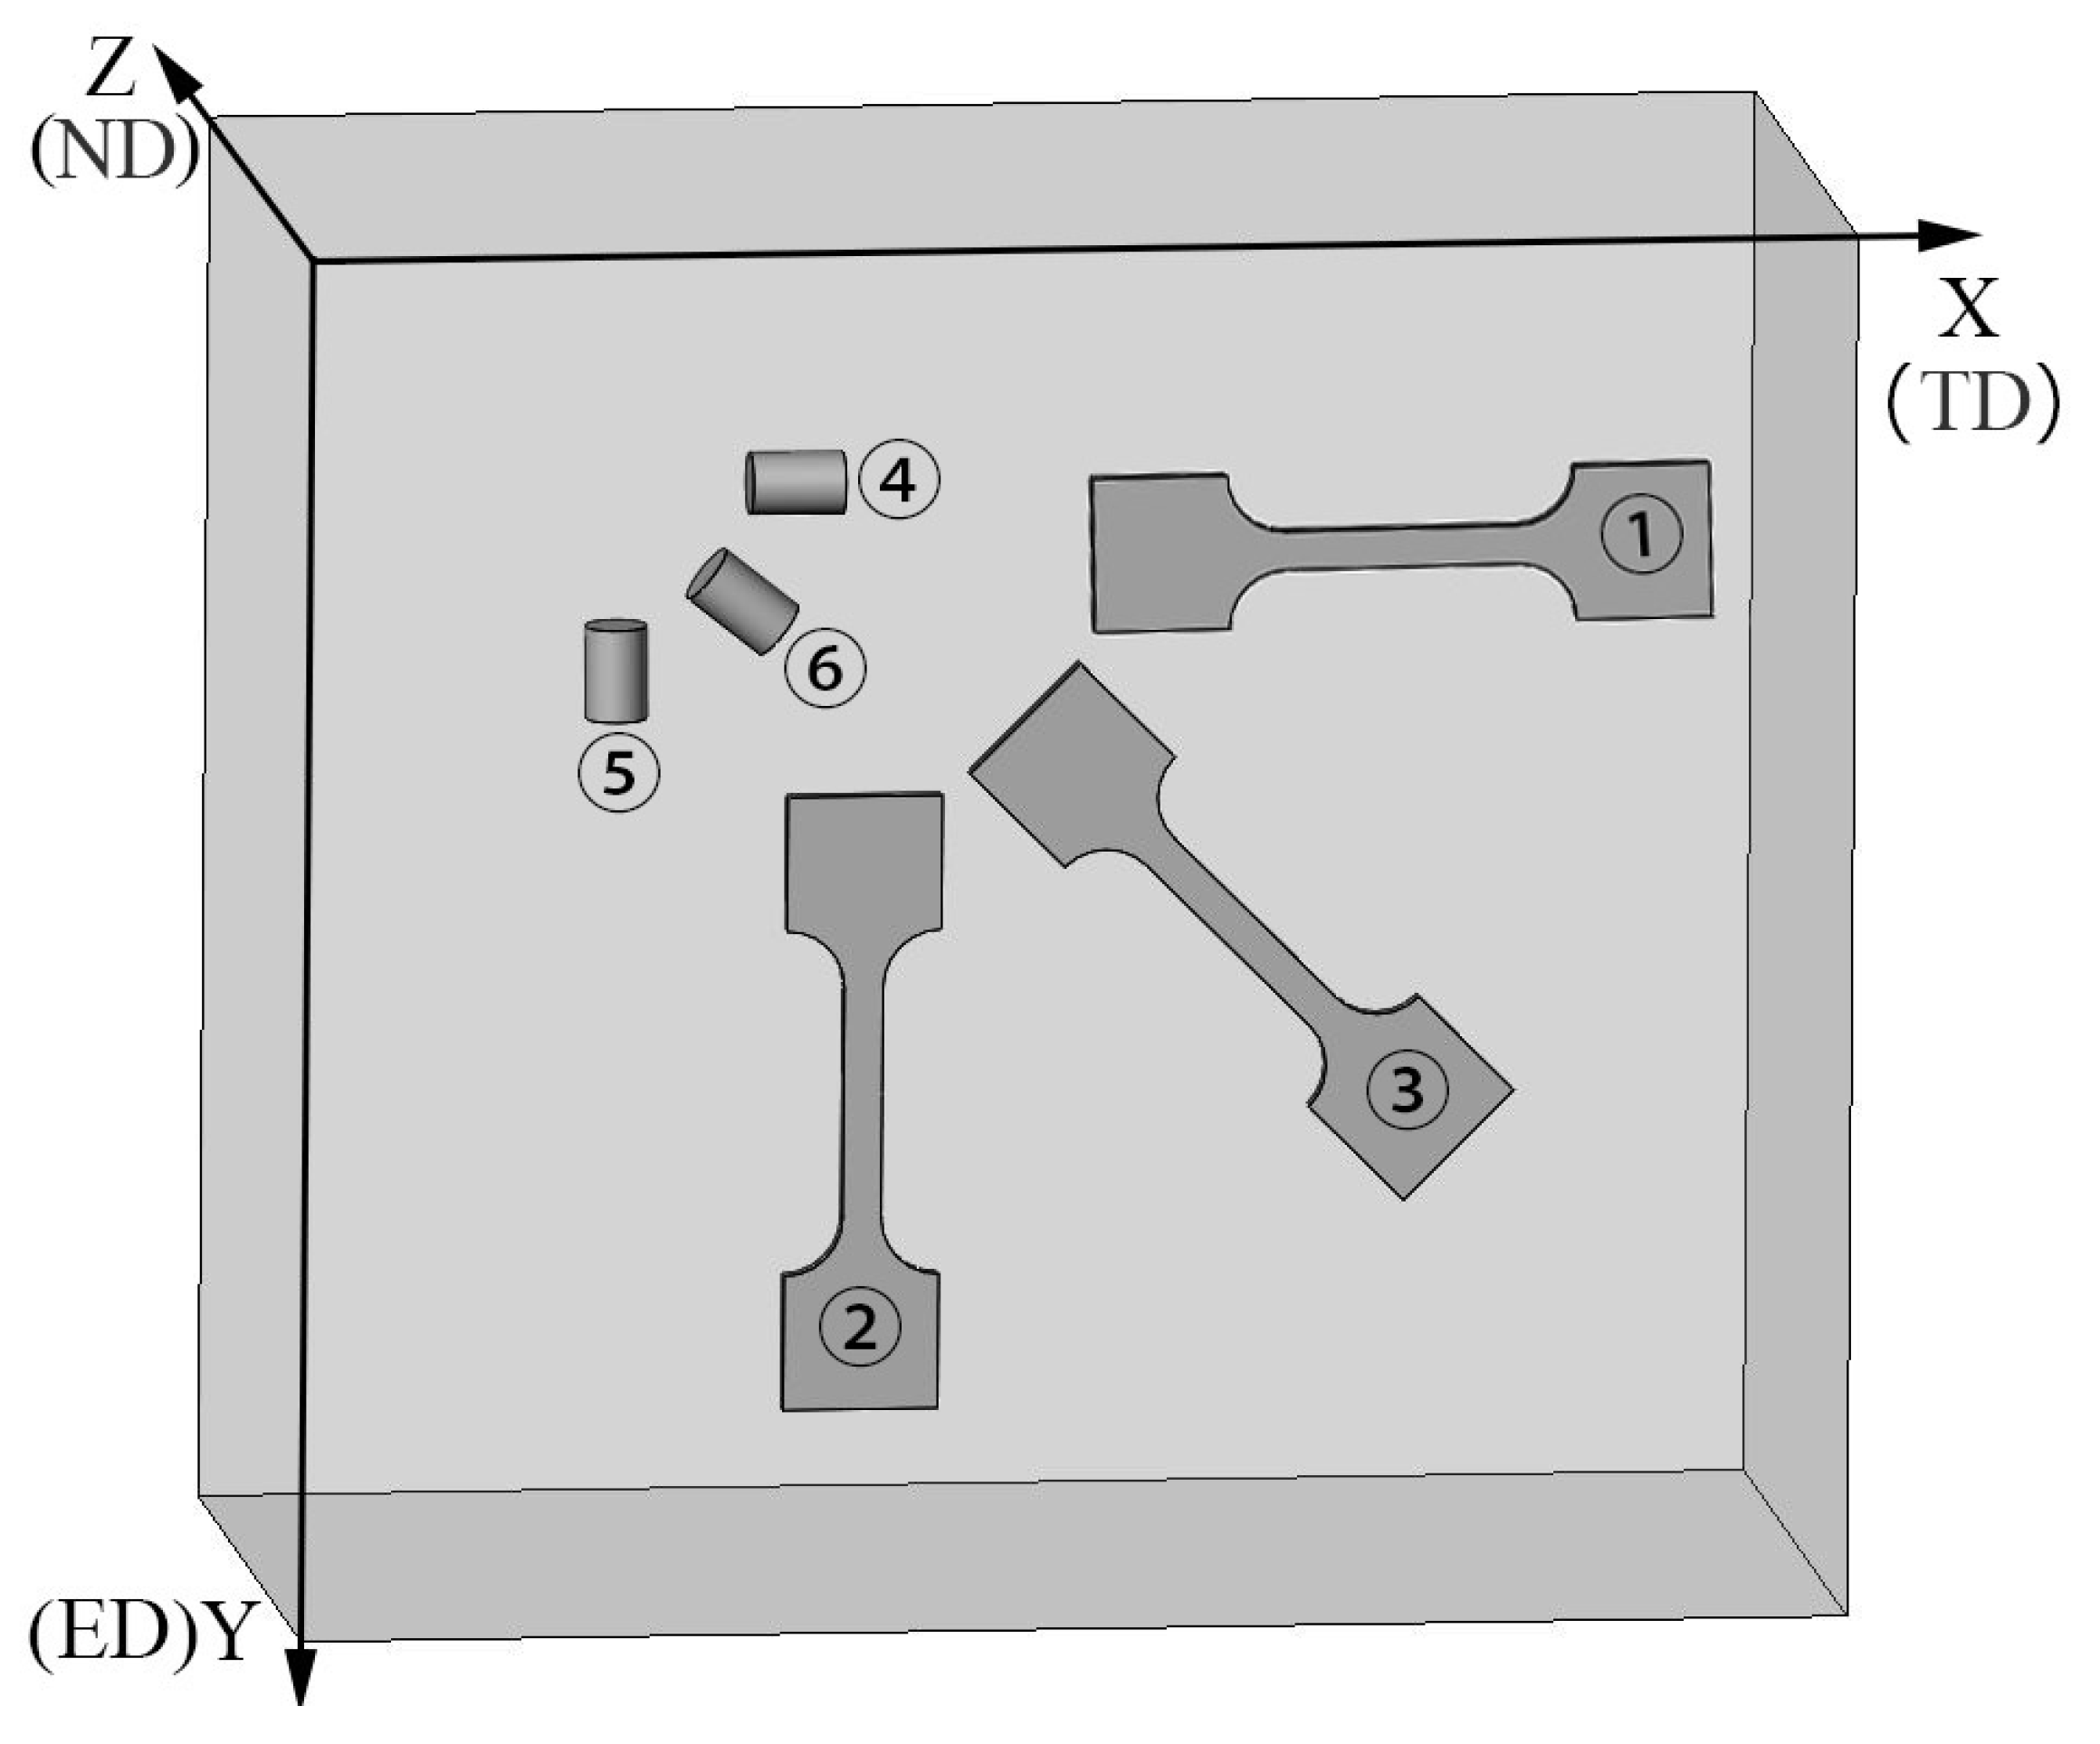
2.3. Compression and Tension Tests
2.4. Large Deformation Constitutive Relationship
2.5. FE Algorithm
3. Results and Discussion
3.1. Yield Surfaces
3.2. FE Simulation
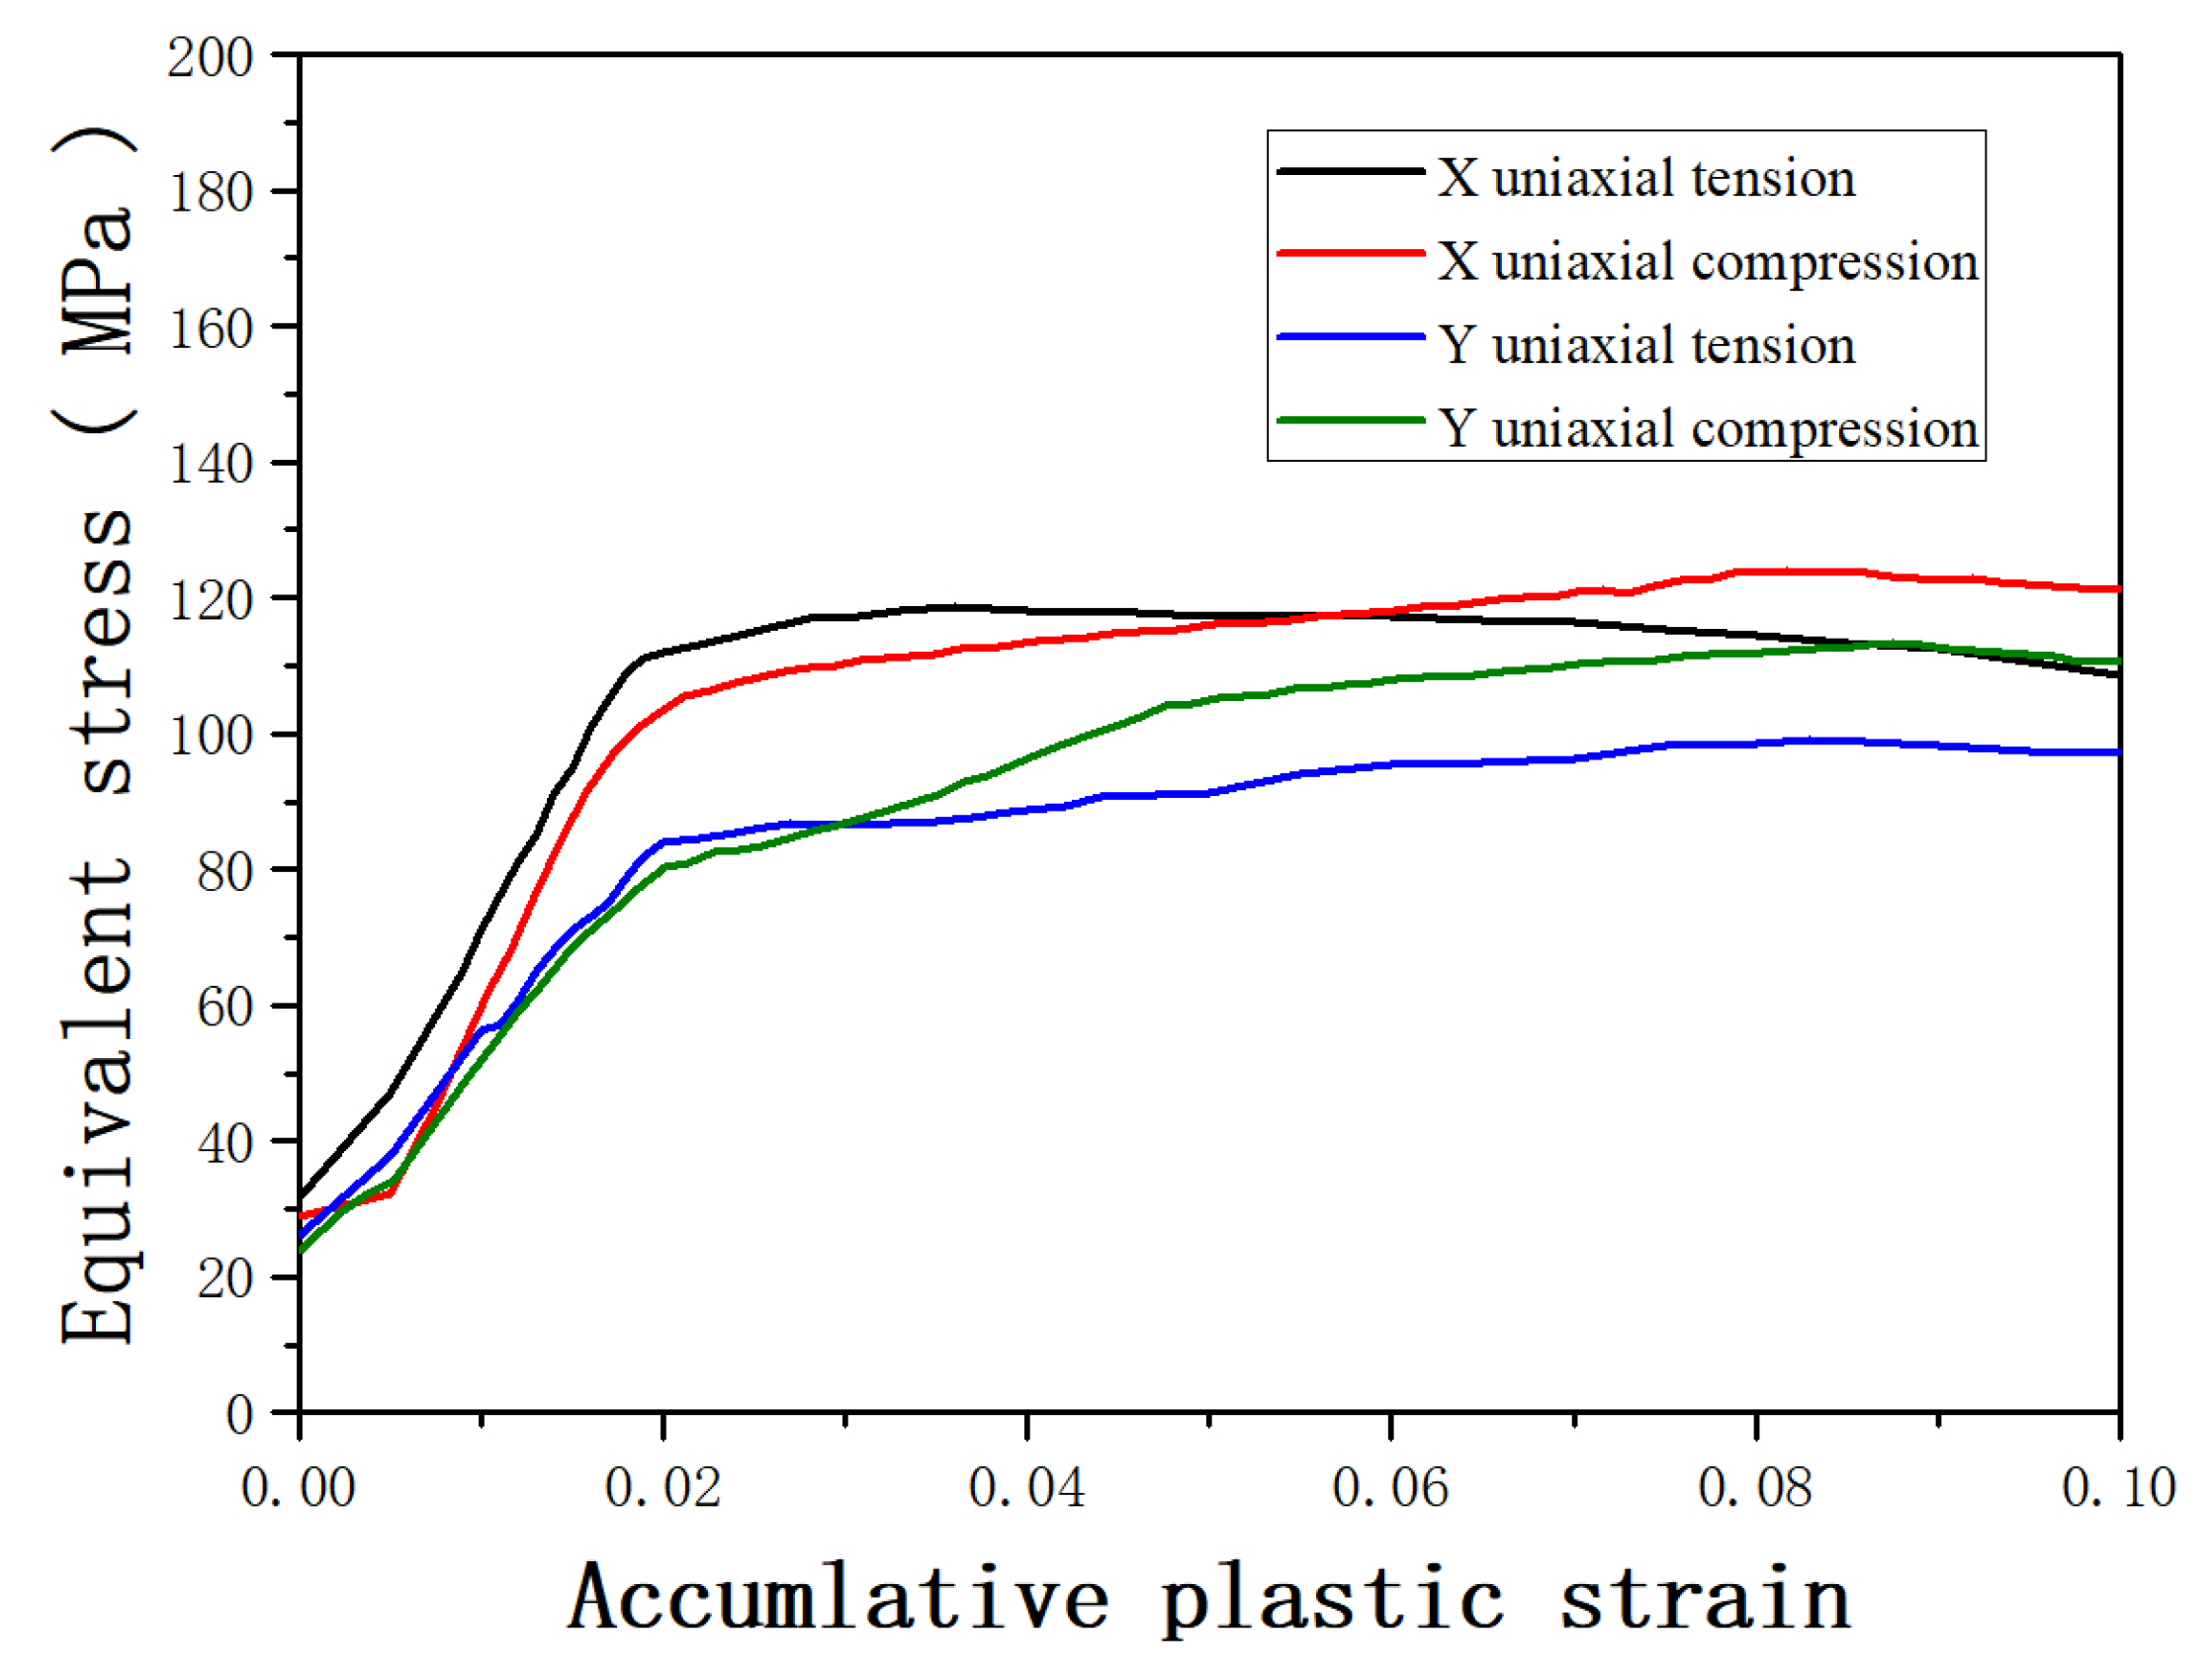
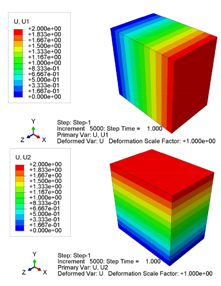
3.2.1. Uniaxial Loading
3.2.2. Biaxial Loading
3.2.3. Loading-Reverse Loading
3.2.4. Orthogonal Loading
4. Conclusions
- (1)
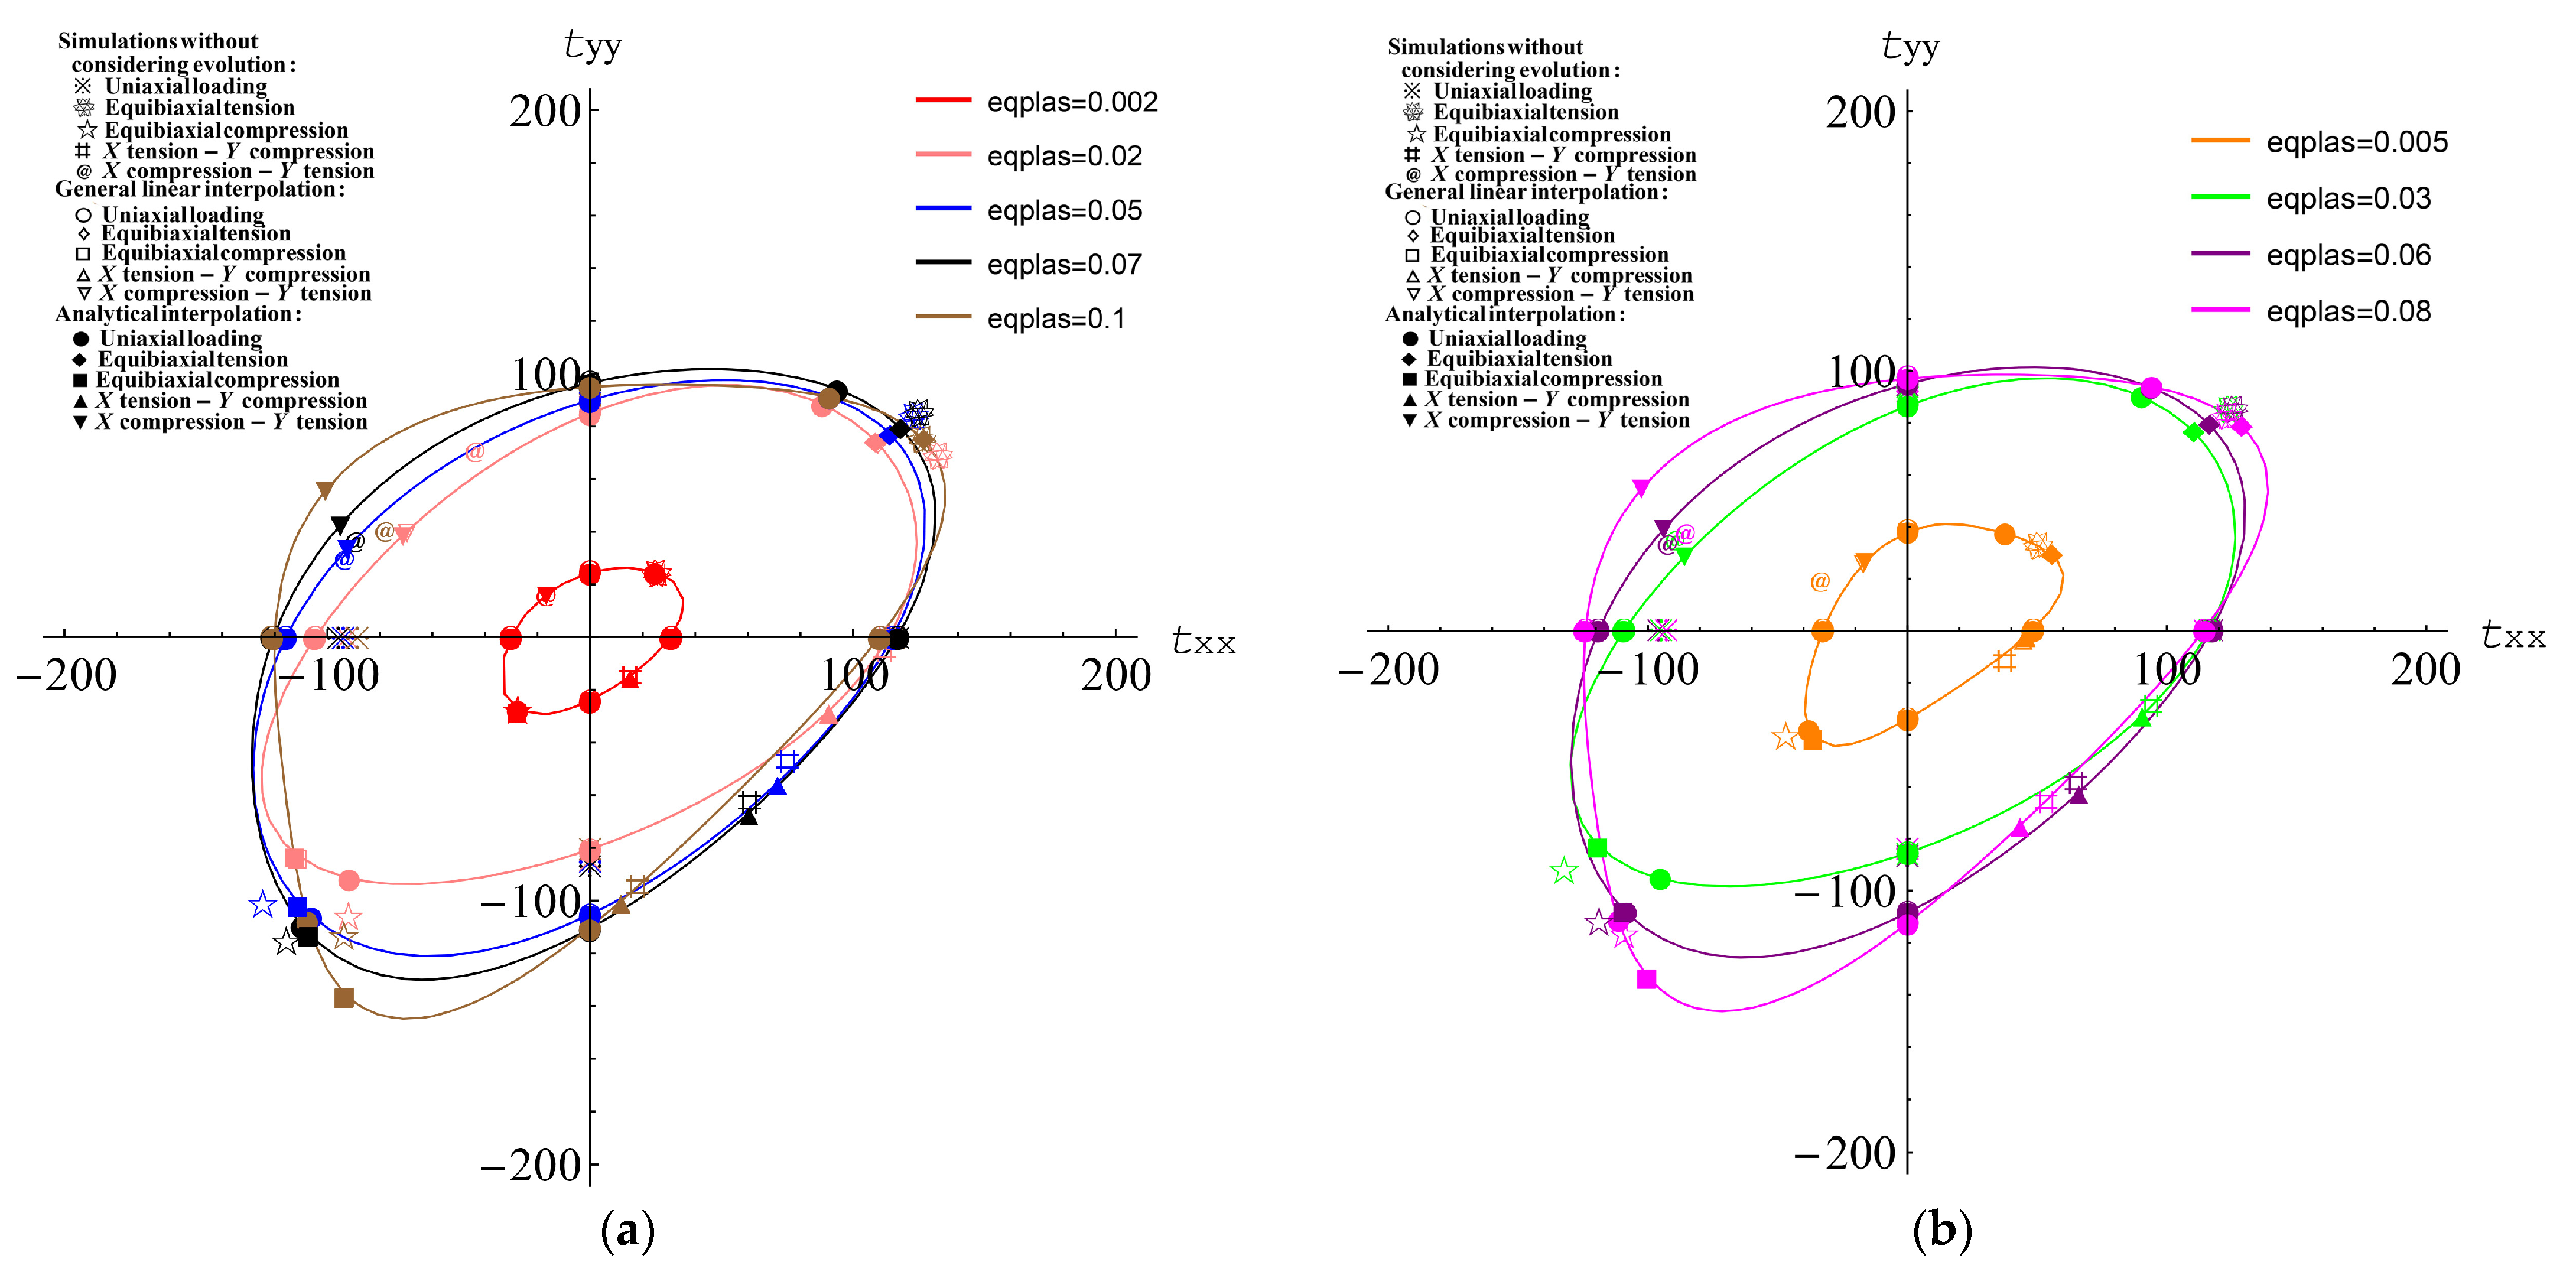
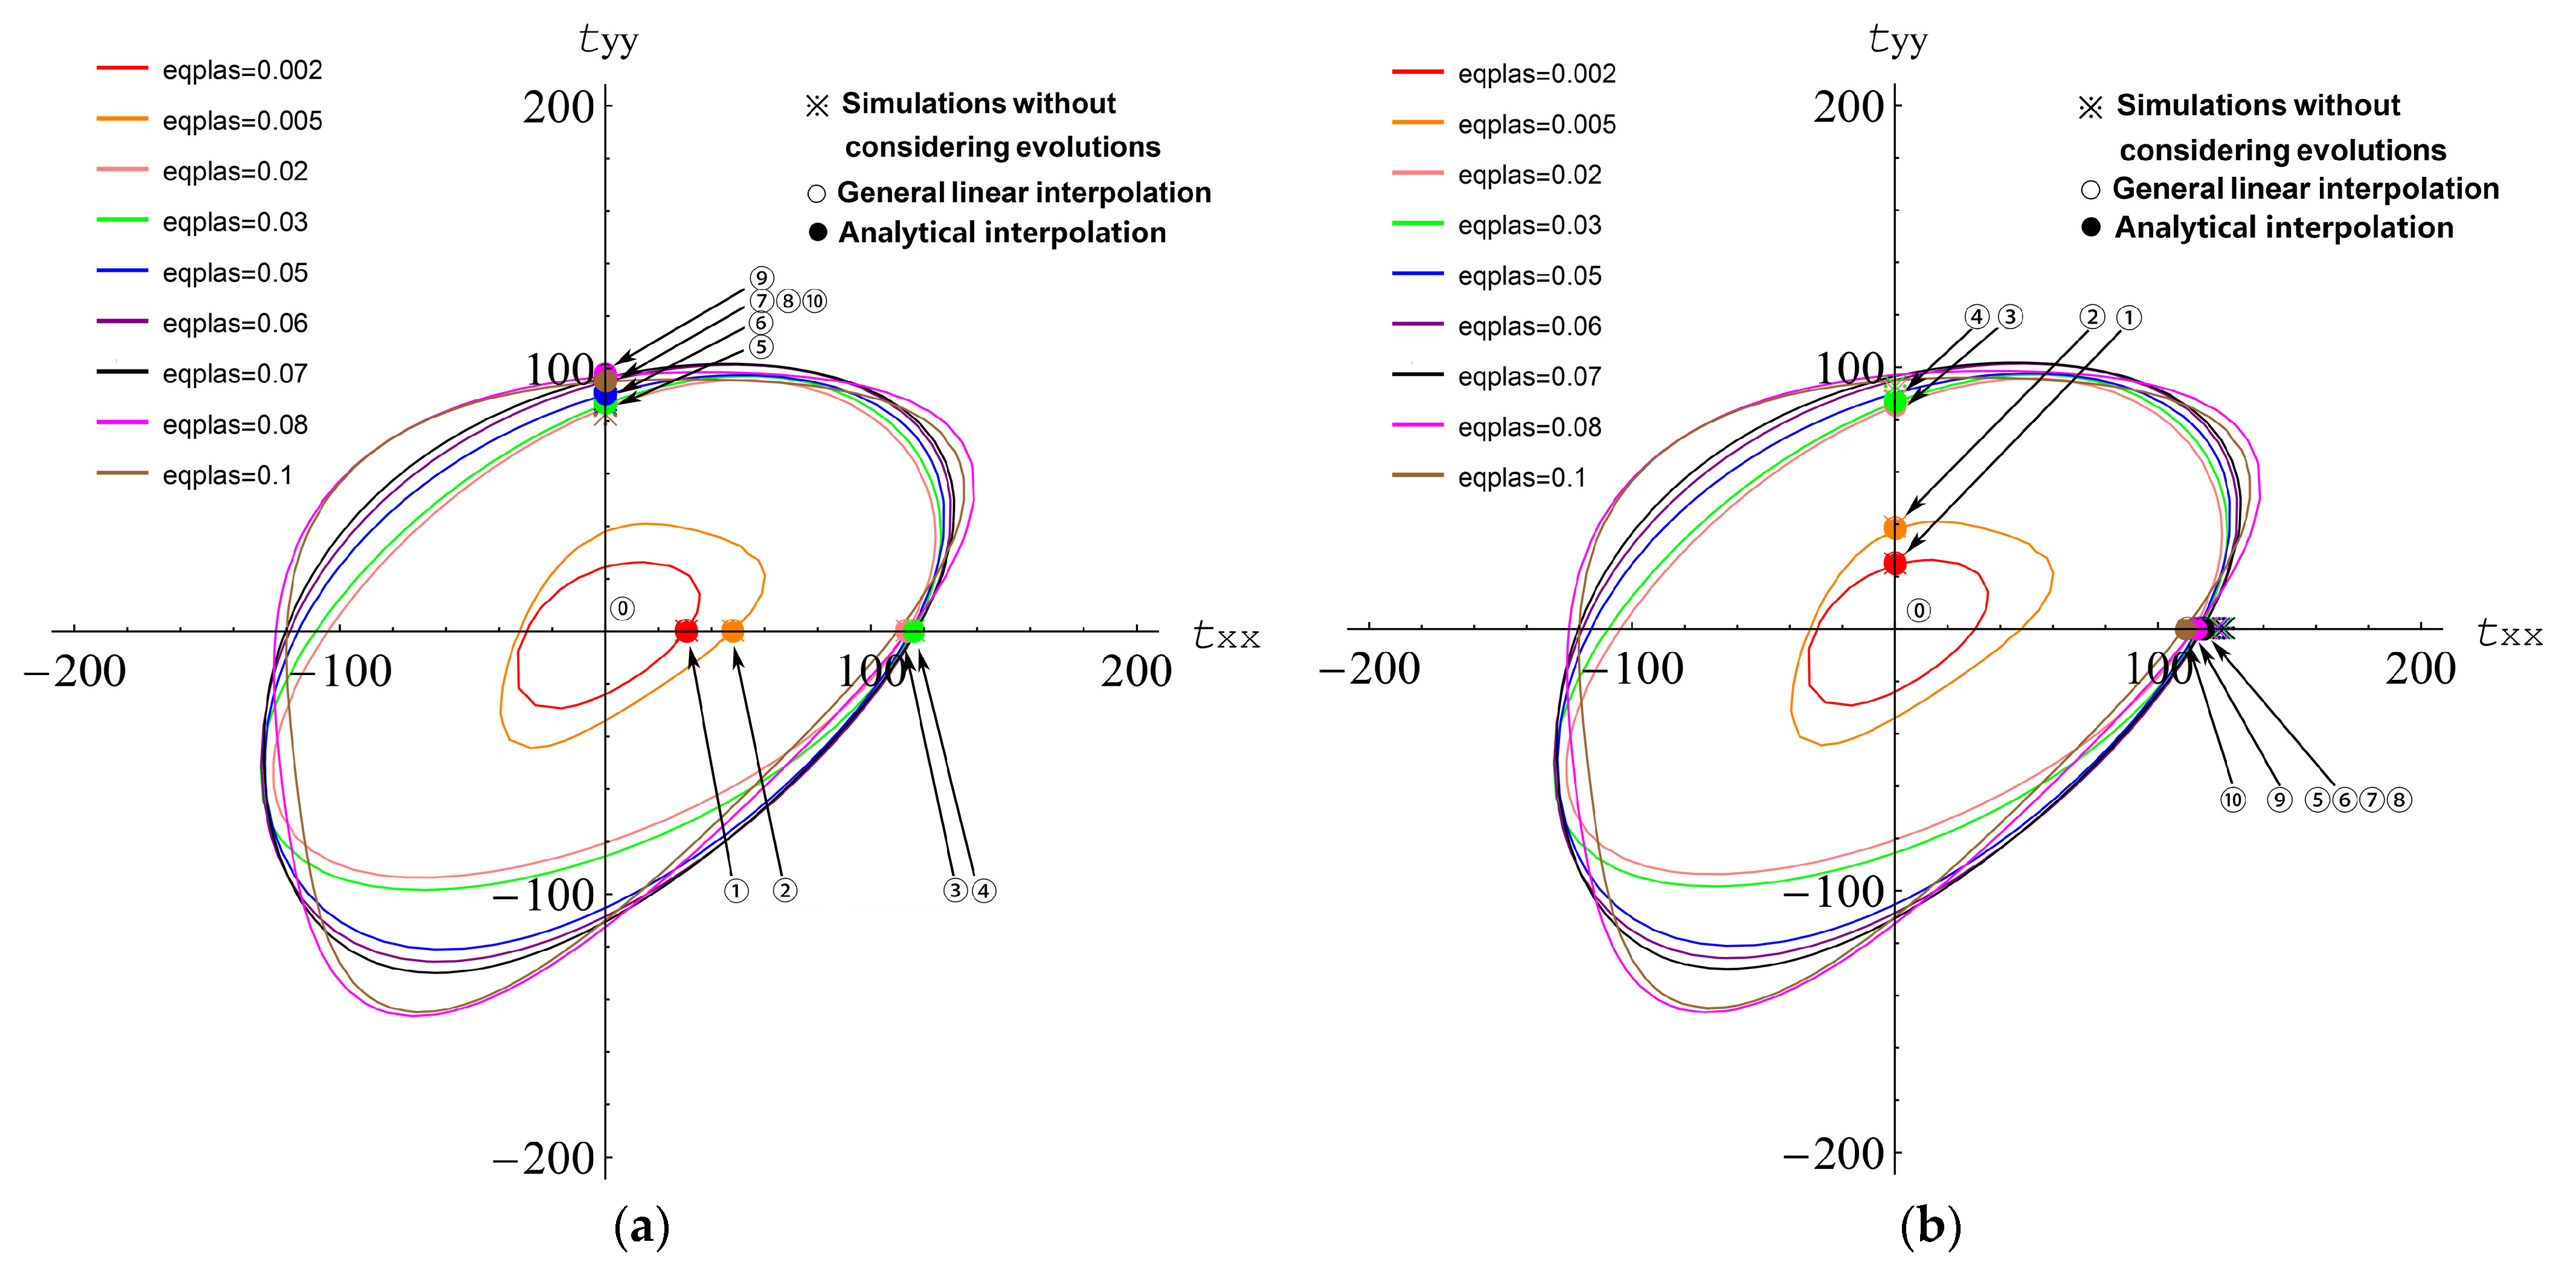
- As a typical plain Mg alloy, extruded ZK60 alloy exhibited significant anisotropy, tension-compression SDE, and evolution effect during low-temperature continuous large deformation yield. At an accumulative strain of 0.002, the shape of the yield surface in 2D stress space approximated an ellipse. As the accumulative plastic strain increased, the yield surface not only expanded or shrank in proportion to the ratio of the X uniaxial tensile stresses but also simultaneously rotated and distorted, evolving into convex and smooth closed curves with various shapes. At an accumulative strain of 0.02, the yield difference between X uniaxial compression and Y uniaxial compression was 24.0 MPa and the relative difference was as high as 29.81%. At an accumulative strain of 0.03, the yield difference between X uniaxial tension and Y uniaxial tension was 29.5 MPa and the relative difference reached 34.1%. At an accumulative strain of 0.005, the X tension-compression yield difference was 15.5 MPa and the relative difference reached 47.69%. At a strain of 0.08, the Y tension-compression yield difference was 15.5 MPa and the relative difference reached 15.98%.
- (2)
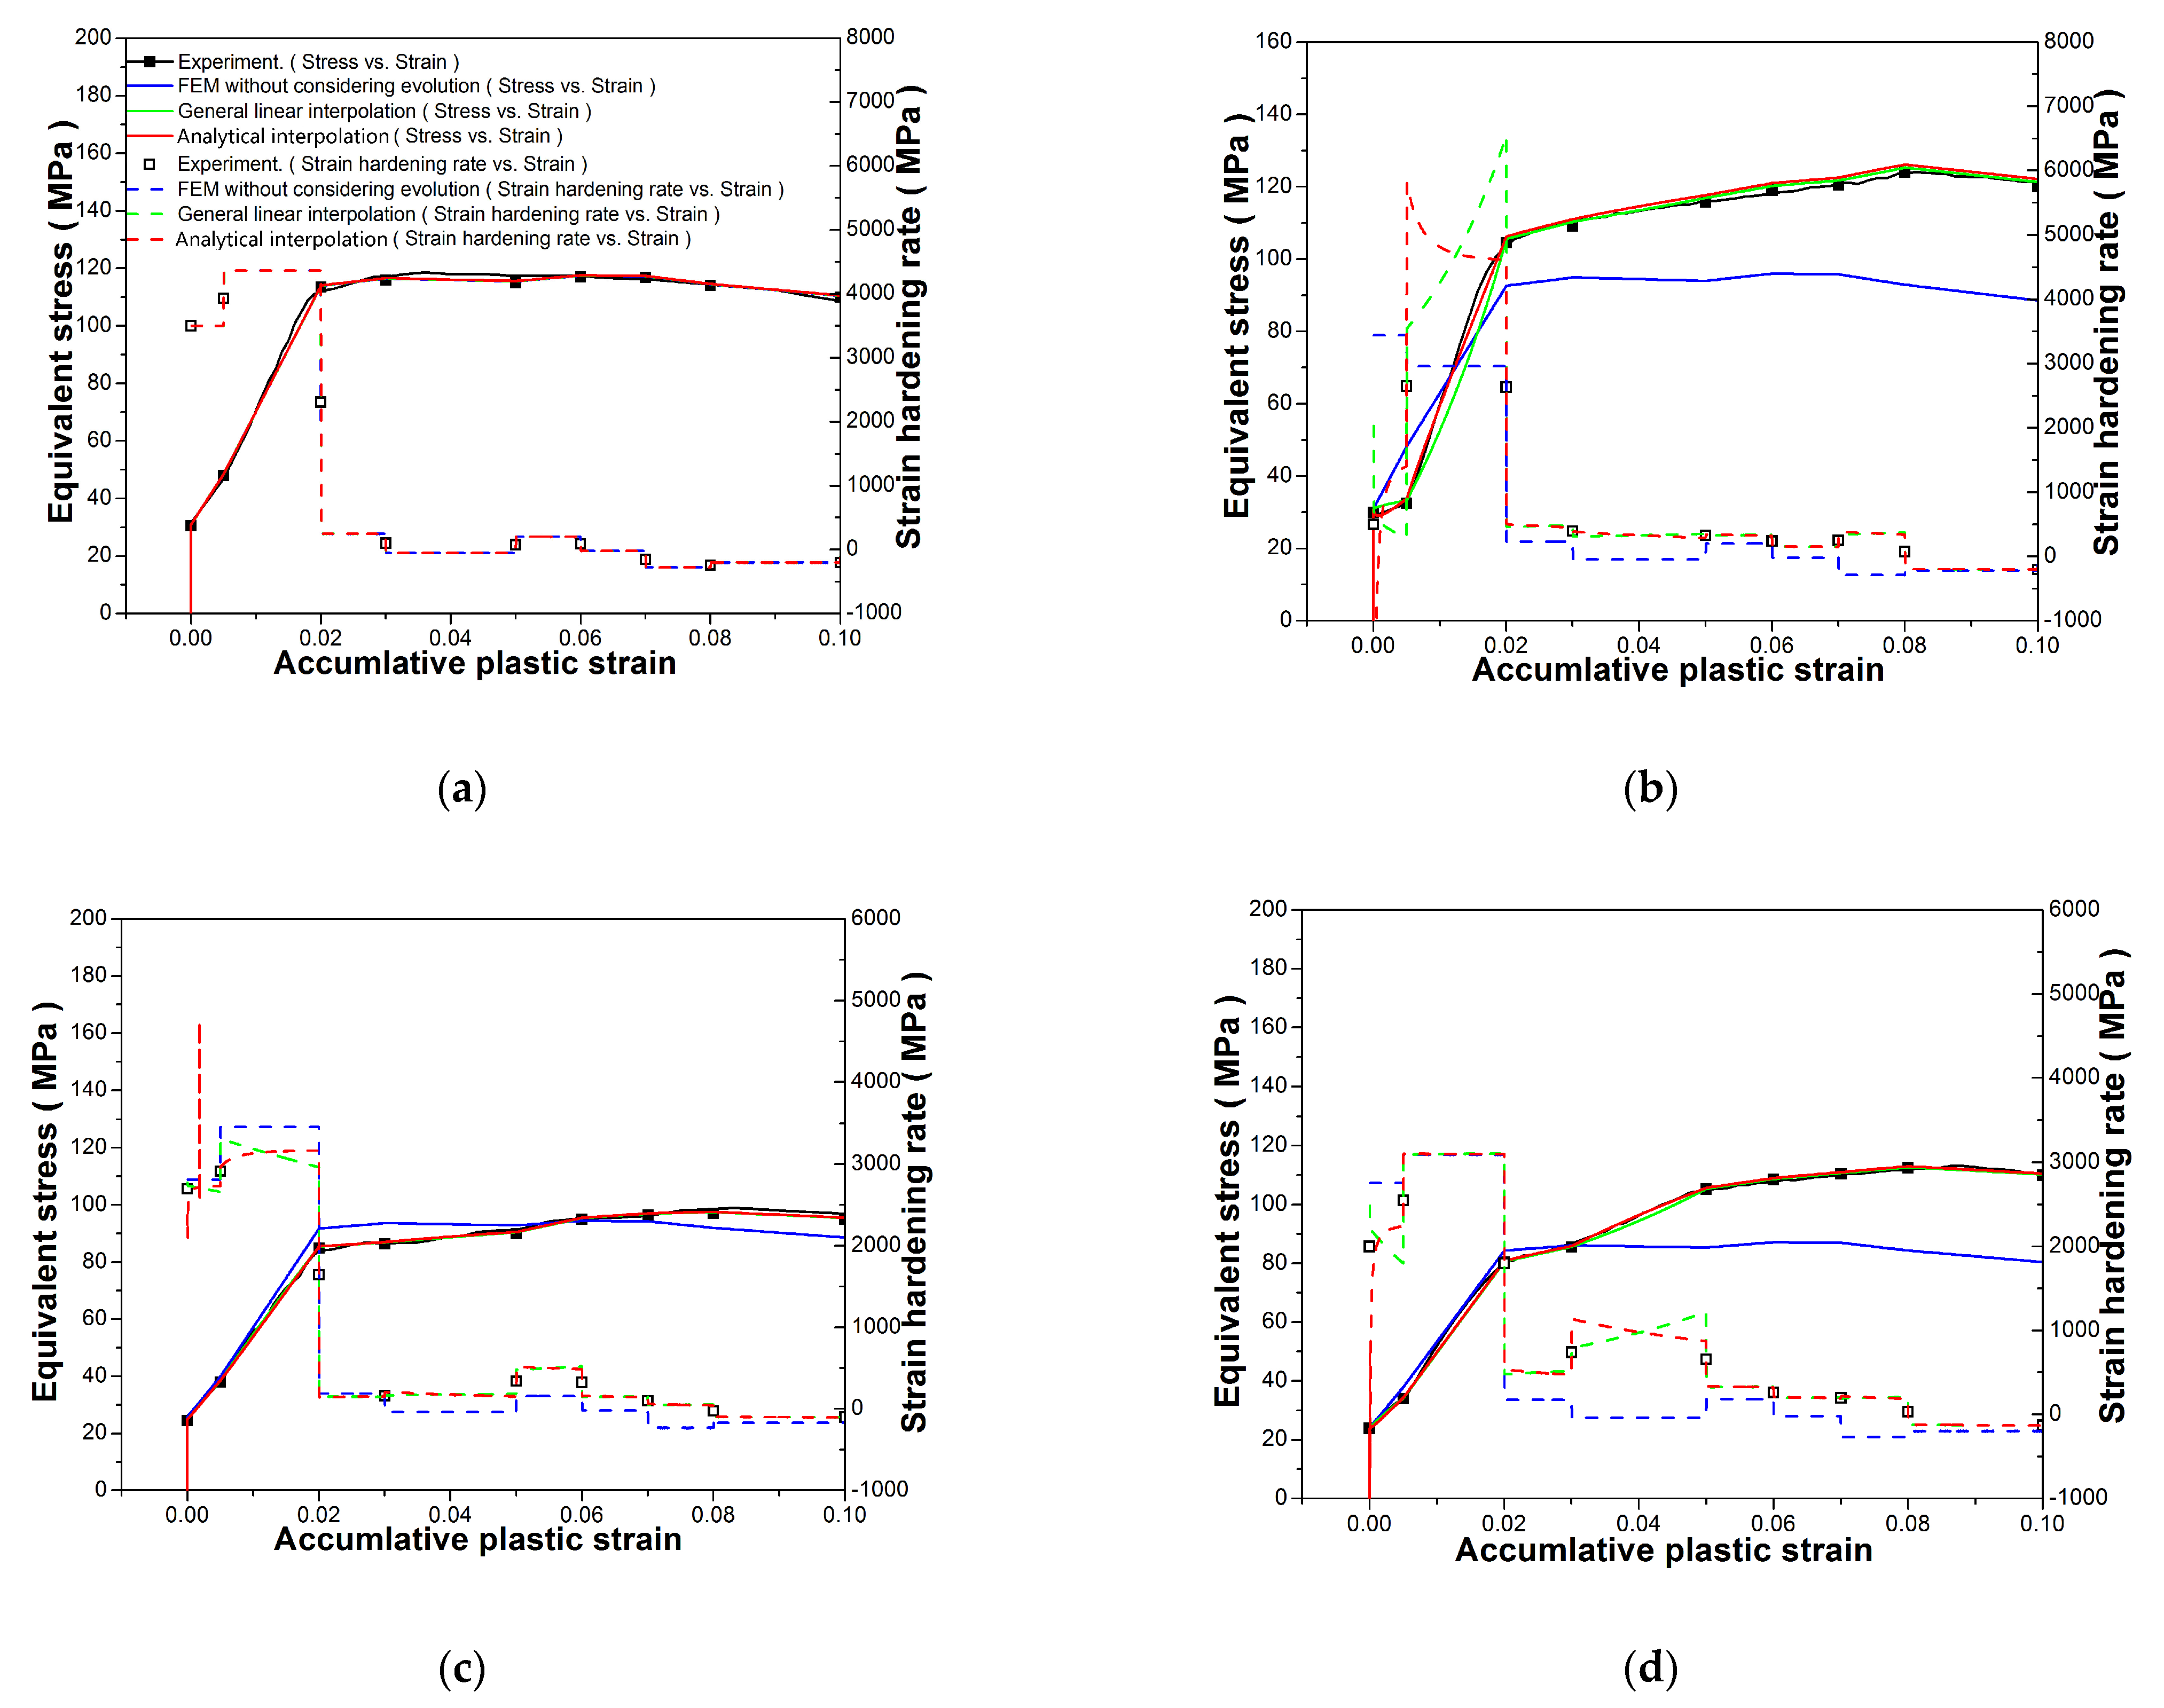
- For the stress-strain relationships and hardening rates of all loading routes, the simulation results considering the yield surface evolution effect were approximately the same as the experiments, and the analytical interpolation approach was more reasonable and accurate than the linear interpolation approach. When the accumulative plastic strain was large, the simulation results without considering the evolution effect, excluding X uniaxial tension, clearly deviated from the experiments (X uniaxial tension loading route had no evolution effect).
Author Contributions
Funding
Institutional Review Board Statement
Informed Consent Statement
Data Availability Statement
Acknowledgments
Conflicts of Interest
Appendix A. Anisotropic Parameters

| Accumulative Strain | ||||||
|---|---|---|---|---|---|---|
| 0.002 | 2.4471 | 1.5893 | 1.8993 | −3.0488 | 1.8039 | 0.1907 |
| 0.005 | 2.3012 | 2.0952 | 2.3461 | −3.5066 | 3.3914 | 1.7276 |
| 0.02 | 2.7272 | 1.5982 | 2.0132 | 1.9202 | −2.5080 | 1.0119 |
| 0.03 | 2.6899 | 1.6051 | 1.9641 | 1.3268 | −2.6129 | 0.4817 |
| 0.05 | 4.0847 | −1.9385 | −1.5062 | −3.6341 | 1.0257 | −0.6727 |
| 0.06 | −4.0161 | 1.5390 | 1.8903 | −3.3660 | 1.3945 | −0.6182 |
| 0.07 | 2.2631 | 1.7445 | 1.6669 | −3.3561 | 1.7480 | −0.6018 |
| 0.08 | 2.1797 | 1.7119 | 1.6179 | −3.6647 | 2.6909 | −0.5138 |
| 0.1 | 2.1489 | 1.7298 | 1.5953 | −3.6777 | 2.7790 | −0.4869 |
References
- Tu, J.; Zhang, X.Y.; Zhou, Z.M.; Huang, C. Structural characterization of {10–12} twin tip in deformed magnesium alloy. Mater. Character. 2015, 110, 39–43. [Google Scholar] [CrossRef]
- Xu, L.; Xiang, M.H.; Wang, J.; Zhang, J.; Wang, C.N.; Xie, C. Analysis and characterization on dynamic recrystallization in casting AZ31 mg alloys under plane strain compression. Materials 2020, 13, 522. [Google Scholar] [CrossRef] [PubMed] [Green Version]
- Wang, C.Y.; Wang, X.J.; Chang, H.; Wu, K.; Zheng, M.Y. Processing maps for hot working of ZK60 magnesium alloy. Mater. Sci. Eng. A 2007, 464, 52–58. [Google Scholar] [CrossRef]
- Mao, P.L.; Liu, Z.; Wang, C.Y. Texture effect on high strain rates tension and compression deformation behavior of extruded AM30 alloy. Mater. Sci. Eng. A 2012, 539, 13–21. [Google Scholar] [CrossRef]
- Lee, M.G.; Wagoner, R.H.; Lee, J.K.; Chung, K.; Kim, H.Y. Constitutive modeling for anisotropic/asymmetric hardening behavior of magnesium alloy sheets. Int. J. Plast. 2007, 24, 545–582. [Google Scholar] [CrossRef]
- Xie, C.; He, J.M.; Zhu, B.W.; Liu, X.; Zhang, J.; Wang, X.F.; Fang, Q.H. Transition of dynamic recrystallization mechanisms of as-cast AZ31 Mg alloys during hot compression. Int. J. Plast. 2018, 111, 211–233. [Google Scholar] [CrossRef]
- Liu, X.; Zhu, B.W.; Xie, C.; Zhang, J.; Tang, C.P.; Chen, Y.Q. Twinning, dynamic recrystallization, and crack in AZ31 magnesium alloy during high strain rate plane strain compression across a wide temperature. Mater. Sci. Eng. A 2018, 733, 98–107. [Google Scholar] [CrossRef]
- Yu, G.; Liu, Y.L.; Li, Y.; Ye, L.Y.; Guo, X.H.; Zhao, L. Corrosion and protection of magnesium alloys. Chin. J. Nonfer. Metal 2002, 12, 1087–1098. [Google Scholar]
- Kim, W.J.; Moon, I.K.; Han, S.H. Ultrafine-grained Mg–Zn–Zr alloy with high strength and high-strain-rate superplasticity. Mater. Sci. Eng. A 2012, 538, 374–385. [Google Scholar] [CrossRef]
- Kim, W.J.; Lee, H.W.; Yoo, S.J.; Park, Y.B. Texture and mechanical properties of ultrafine-grained Mg–3Al–1Zn alloy sheets prepared by high-ratio differential speed rolling. Mater. Sci. Eng. A 2011, 528, 874–879. [Google Scholar] [CrossRef]
- Kim, W.J.; Kim, M.J.; Wang, J.Y. Superplastic behavior of a fine-grained ZK60 magnesium alloy processed by high-ratio differential speed rolling. Mater. Sci. Eng. A 2009, 527, 322–327. [Google Scholar] [CrossRef]
- Kim, W.J.; Lee, B.H.; Lee, J.B.; Lee, M.J.; Park, Y.B. Synthesis of high-strain-rate superplastic magnesium alloy sheets using a high-ratio differential speed rolling technique. Scripta Mater. 2010, 63, 772–775. [Google Scholar] [CrossRef]
- Kang, Z.X.; Zhou, L.L.; Zhang, J.Y. Achieving high strain rate superplasticity in Mg-Y-Nd-Zr alloy processed by homogenization treatment and equal channel angular pressing. Mater. Sci. Eng. A 2015, 633, 59–62. [Google Scholar] [CrossRef]
- Langdon, T.G. Achieving superplasticity in ultrafine-grained metals. Mech. Mater. 2013, 67, 2–8. [Google Scholar] [CrossRef]
- Mohan, A.; Yuan, W.; Mishra, R.S. High strain rate superplasticity in friction stir processed ultrafine grained Mg–Al–Zn alloys. Mater. Sci. Eng. A 2013, 562, 69–76. [Google Scholar] [CrossRef]
- Yang, Q.; Xiao, B.L.; Zhang, Q.; Zheng, M.Y.; Ma, Z.Y. Exceptional high-strain-rate superplasticity in Mg–Gd–Y–Zn–Zr alloy with long-period stacking ordered phase. Scripta Mater. 2013, 69, 801–804. [Google Scholar] [CrossRef]
- Al-Zubaydi, A.-S.J.; Zhilyaev, A.P.; Wang, S.C.; Reed, P.A. Superplastic behaviour of AZ91 magnesium alloy processed by high-pressure torsion. Mater. Sci. Eng. A 2015, 637, 1–11. [Google Scholar] [CrossRef]
- Huang, Y.; Pereira, P.H.R.; Figueiredo, R.B.; Baudin, T.; Helbert, A.; Brisset, F.; Langdon, T.G. An evaluation of high temperature tensile properties for a magnesium AZ31 alloy processed by high-pressure torsion. Lett. Mater. 2015, 5, 341–346. [Google Scholar] [CrossRef] [Green Version]
- Mekonen, M.N.; Steglich, D.; Bohlen, J.; Letzig, D.; Mosler, J. Mechanical characterization and constitutive modeling of Mg alloy sheets. Mater. Sci. Eng. A 2012, 540, 174–186. [Google Scholar] [CrossRef] [Green Version]
- Galiyev, A.; Kaibyshev, R.; Gottstein, G. Correlation of plastic deformation and dynamic recrystallization in magnesium alloy ZK60. Acta Mater. 2001, 49, 1199–1207. [Google Scholar] [CrossRef]
- Robson, J. Anisotropy and asymmetry of yield in magnesium alloys at room temperature. Mater. Trans. A 2014, 45, 5226–5235. [Google Scholar] [CrossRef]
- Yin, S.M.; Wang, C.H.; Diao, Y.D.; Wu, S.D.; Li, S.X. Influence of grain size and texture on the yield asymmetry of Mg-3Al-1Zn alloy. J. Mater. Sci. Technol. 2011, 27, 29–34. [Google Scholar] [CrossRef]
- Lv, C.L.; Liu, T.M.; Liu, D.J.; Jiang, S.; Zeng, W. Effect of heat treatment on tension–compression yield asymmetry of AZ80 magnesium alloy. Mater. Des. 2011, 33, 529–533. [Google Scholar] [CrossRef]
- Kleiner, S.; Uggowitzer, P.J. Mechanical anisotropy of extruded Mg–6% Al–1% Zn alloy. Mater. Sci. Eng. A 2004, 379, 258–263. [Google Scholar] [CrossRef]
- Li, H.; Hu, X.; Yang, H.; Li, L. Anisotropic and asymmetrical yielding and its distorted evolution: Modeling and applications. Int. J. Plast. 2016, 82, 127–158. [Google Scholar] [CrossRef]
- Li, X.Q.; Ren, L.; Le, Q.C.; Biao, L.; Jin, P.P.; Wang, P.; Cheng, C.L.; Zhou, X.; Hu, C.L. Reducing the yield asymmetry in Mg-5Li-3Al-2Zn alloy by hot-extrusion and multi-pass rolling. J. Magn. Alloy. 2020, in press. [Google Scholar] [CrossRef]
- Barlat, F.; Maeda, Y.; Chung, K.; Yanagawa, M.; Brem, J.C.; Hayashida, Y.; Makosey, S. Yield function development for aluminum alloy sheets. J. Mech. Phys. Solid. 1997, 45, 1727–1763. [Google Scholar] [CrossRef]
- Banabic, D.; Aretz, H.; Comsa, D.S.; Paraianu, L. An improved analytical description of orthotropy in metallic sheets. Int. J. Plast. 2005, 21, 493–512. [Google Scholar] [CrossRef]
- Barlat, F.; Aretz, H.; Yoon, J.W.; Karabin, M.E.; Brem, J.C.; Dick, R.E. Linear transformation-based anisotropic yield functions. Int. J. Plast. 2005, 21, 1009–1039. [Google Scholar] [CrossRef]
- Lou, Y.S.; Zhang, S.J.; Yoon, J.W. A reduced Yld2004 function for modeling of anisotropic plastic deformation of metals under triaxial loading. Int. J. Mech. Sci. 2019, 161, 105027. [Google Scholar] [CrossRef]
- Plunkett, B.; Lebensohn, R.A.; Cazacu, O.; Barlat, F. Anisotropic yield function of hexagonal materials taking into account texture development and anisotropic hardening. Acta Mater. 2006, 54, 4159–4169. [Google Scholar] [CrossRef]
- Nixon, M.E.; Cazacu, O.; Lebensohn, R.A. Anisotropic response of high-purity a-titanium: Experimental characterization and constitutive modeling. Int. J. Plast. 2010, 26, 516–532. [Google Scholar] [CrossRef]
- Yoon, J.; Cazacu, O.; Mishra, R.K. Constitutive modeling of AZ31 sheet alloy with application to axial crushing. Mater. Sci. Eng. A 2013, 565, 203–212. [Google Scholar] [CrossRef]
- Yoon, J.W.; Lou, Y.; Yoon, J.; Glazoff, M.V. Asymmetric yield function based on the stress invariants for pressure sensitive metals. Int. J. Plast. 2014, 56, 184–202. [Google Scholar] [CrossRef]
- Tari, D.G.; Worswick, M.J.; Ali, U.; Gharghouri, M.A. Mechanical response of AZ31B magnesium alloy: Experimental characterization and material modeling considering proportional loading at room temperature. Int. J. Plast. 2014, 55, 247–267. [Google Scholar] [CrossRef]
- Xie, C.; Xiang, M.H.; Du, J.K.; Yan, W.T.; Shen, L.J.; Chen, J.K.; Shu, X.D.; Fang, Q.H. Asymmetric yield effect evolving with internal variables during continuous large deformations and its FEM validation. Int. J. Plast. 2020, 130, 102723. [Google Scholar] [CrossRef]
- Yang, Q.; Xiao, B.L.; Ma, Z.Y.; Chen, R.S. Achieving high strain rate superplasticity in Mg–Zn–Y–Zr alloy produced by friction stir processing. Scripta Mater. 2011, 65, 335–338. [Google Scholar] [CrossRef]
- Evans, R.W.; Scharning, P.J. Axisymmetric compression test and hot working properties of alloys. Mater. Sci. Tech. 2001, 17, 995–1004. [Google Scholar] [CrossRef]
- Wan, Z.P.; Hu, L.; Sun, L.X.; Wang, T.; Li, Z. Hot deformation behavior and processing workability of a Ni-based alloy. J. Alloys Comp. 2018, 769, 367–375. [Google Scholar] [CrossRef]
- Churyumov, A.Y.; Khomutov, M.G.; Tsar’Kov, A.A.; Pozdnyakov, A.V.; Solonin, A.N.; Efimov, V.M.; Mukhanov, E.L. Study of the structure and mechanical properties of corrosion-resistant steel with a high concentration of boron at elevated temperatures. Phys. Metal. Metall. 2014, 115, 809–813. [Google Scholar] [CrossRef]
- Lou, Y.; Yoon, J.W. Anisotropic yield function based on stress invariants for BCC and FCC metals and its extension to ductile fracture criterion. Int. J. Plast. 2018, 101, 125–155. [Google Scholar] [CrossRef]
- Spitzig, W.A.; Sober, R.J.; Richmond, O. Pressure dependence of yielding and associated volume expansion in tempered martensite. Acta Metall. 1975, 23, 885–893. [Google Scholar] [CrossRef]
- Stoughton, T.B.; Yoon, J.W. A pressure-sensitive yield criterion under a non-associated flow rule for sheet metal forming. Int. J. Plast. 2004, 20, 705–731. [Google Scholar] [CrossRef]
- Nelder, J.A.; Mead, R. A simplex method for function minimization. Comp. J. 1965, 7, 308–313. [Google Scholar] [CrossRef]
- Belytschko, T.; Liu, W.K.; Moran, B.; Elkhodary, K. Nonlinear Finite Elements for Continua and Structures; Wiley: Hoboken, NJ, USA, 2013. [Google Scholar]


| Zr | Zn | Al | Si | Fe | Cu | Ni | Mg |
|---|---|---|---|---|---|---|---|
| 0.48 | 5.70 | 0.01 | 0.01 | 0.008 | 0.007 | 0.004 | Balance |
| Uniaxial loading: boundary conditions imposed on end faces | X Uniaxial Tension | X Uniaxial Compression | Y Uniaxial Tension | Y Uniaxial Compression |
| Biaxial loading: boundary conditions imposed on end faces | Equibiaxial Tension | Equibiaxial Compression | X Tension-Y Compression | X Compression-Y Tension |
| X Uniaxial Tension (A = 2) | X Uniaxial Compression (B = 2) | Y Uniaxial Tension (A = 2) | Y Uniaxial Compression (B = 2) |
 |  |  |  |
| Equibiaxial Tension (C = 2) | Equibiaxial Compression (C = 2) | X Tension-Y Compression (D = 2) | X Compression-Y Tension (D = 2) |
 | 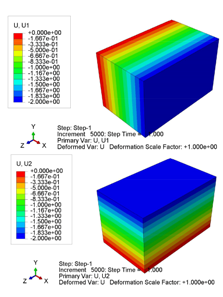 |  | 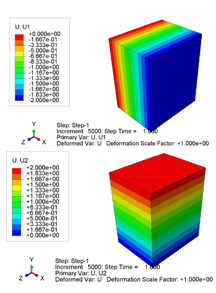 |
| Accumulative Plastic Strain | X Uniaxial Compression (MPa) | X Uniaxial Tension (MPa) | Y Uniaxial Compression (MPa) | Y Uniaxial Tension (MPa) | Relative Difference between X Tension and X Compression | Relative Difference between Y Tension and Y Compression | Relative Difference between X Tension and Y Tension | Relative Difference between X Compression and Y Compression |
|---|---|---|---|---|---|---|---|---|
| 0.002 | 30.0 | 30.5 | 24.0 | 24.5 | 1.67% | 2.08% | 24.49% | 25.00% |
| 0.005 | 32.5 | 48.0 | 34.0 | 38.0 | 47.69% | 11.76% | 26.32% | 4.62% |
| 0.02 | 104.5 | 113.5 | 80.5 | 85.0 | 8.61% | 5.59% | 33.53% | 29.81% |
| 0.03 | 109.2 | 116.0 | 85.5 | 86.5 | 6.23% | 1.17% | 34.10% | 27.72% |
| 0.05 | 115.7 | 115.0 | 105.2 | 90.0 | 0.61% | 16.89% | 27.78% | 9.98% |
| 0.06 | 119.0 | 117.0 | 108.5 | 95.0 | 1.71% | 14.21% | 23.16% | 9.68% |
| 0.07 | 120.5 | 116.8 | 110.5 | 96.5 | 3.17% | 14.51% | 21.04% | 9.05% |
| 0.08 | 124.0 | 114.0 | 112.5 | 97.0 | 8.77% | 15.98% | 17.53% | 10.22% |
| 0.1 | 120.0 | 110.0 | 110.0 | 95.0 | 9.09% | 15.79% | 15.79% | 9.09% |
Publisher’s Note: MDPI stays neutral with regard to jurisdictional claims in published maps and institutional affiliations. |
© 2021 by the authors. Licensee MDPI, Basel, Switzerland. This article is an open access article distributed under the terms and conditions of the Creative Commons Attribution (CC BY) license (https://creativecommons.org/licenses/by/4.0/).
Share and Cite
Wang, J.; Tang, Y.; Ye, J.; Xie, C. Tests and Finite Element Simulation of Yield Anisotropy and Tension-Compression Strength Difference of an Extruded ZK60 Mg Alloy. Metals 2021, 11, 576. https://doi.org/10.3390/met11040576
Wang J, Tang Y, Ye J, Xie C. Tests and Finite Element Simulation of Yield Anisotropy and Tension-Compression Strength Difference of an Extruded ZK60 Mg Alloy. Metals. 2021; 11(4):576. https://doi.org/10.3390/met11040576
Chicago/Turabian StyleWang, Jun, Yan Tang, Jianhui Ye, and Chao Xie. 2021. "Tests and Finite Element Simulation of Yield Anisotropy and Tension-Compression Strength Difference of an Extruded ZK60 Mg Alloy" Metals 11, no. 4: 576. https://doi.org/10.3390/met11040576