Improvement of Impact Toughness and Abrasion Resistance of a 3C-25Cr-0.5Mo Alloy Using a Design of Experiment Statistical Technique: Microstructural Correlations after Heat Treatments

 , , and
Abstract
:1. Introduction
2. Materials and Methods
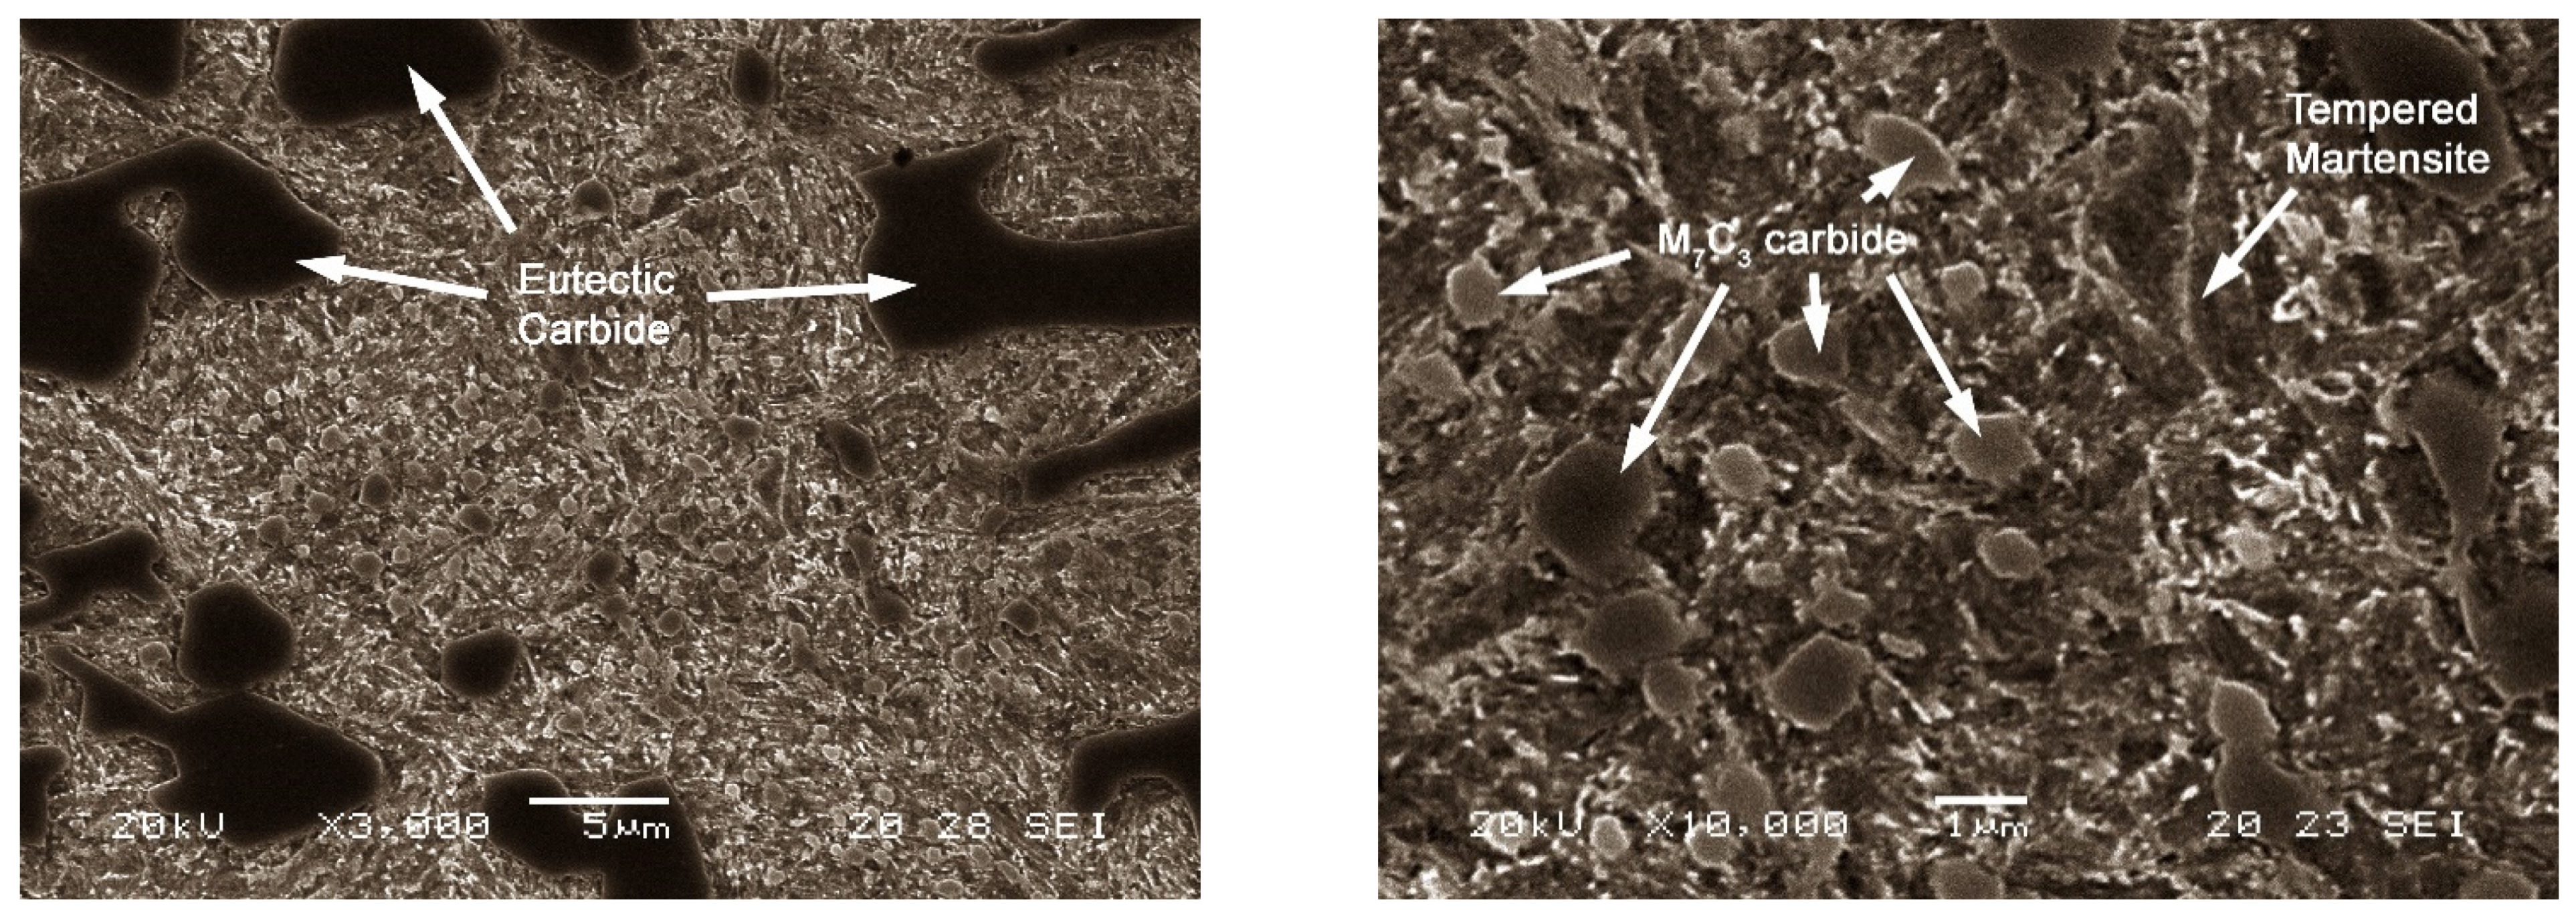
- Microstructural features being evaluated:
- ○
- Percentage in weight of retained austenite and tempered martensite.
- ○
- Cell unit volume of tempered martensite
- ○
- Percentage in weight of the carbides of the following types M7C3, M23C6 and M2C.
- Mechanical properties tested:
- ○
- The Vickers microhardness of the matrix constituent, with 50gf (0.49N), averaging the results of 24 indentations.
- ○
- The abrasive wear resistance by means of the dry sand/rubber wheel abrasion test, executed in accordance with the ASTM G065-16 standard, with the following test parameters: Rubber wheel diameter: 228.6 mm; Shore A hardness of rubber: 60 ± 2; Silica sand (AF50/70); Sand flow: 300–400 g/min; Rate of revolution: 200 rpm; Test time: 30 min.
- ○
- High strain-rate impact test in a Hounsfield pendulum on un-notched round bars of 8 mm in diameter. The test was conducted on 3 un-notched specs typical for brittle materials for each experiment, and its average value reported.
3. Results
4. Conclusions
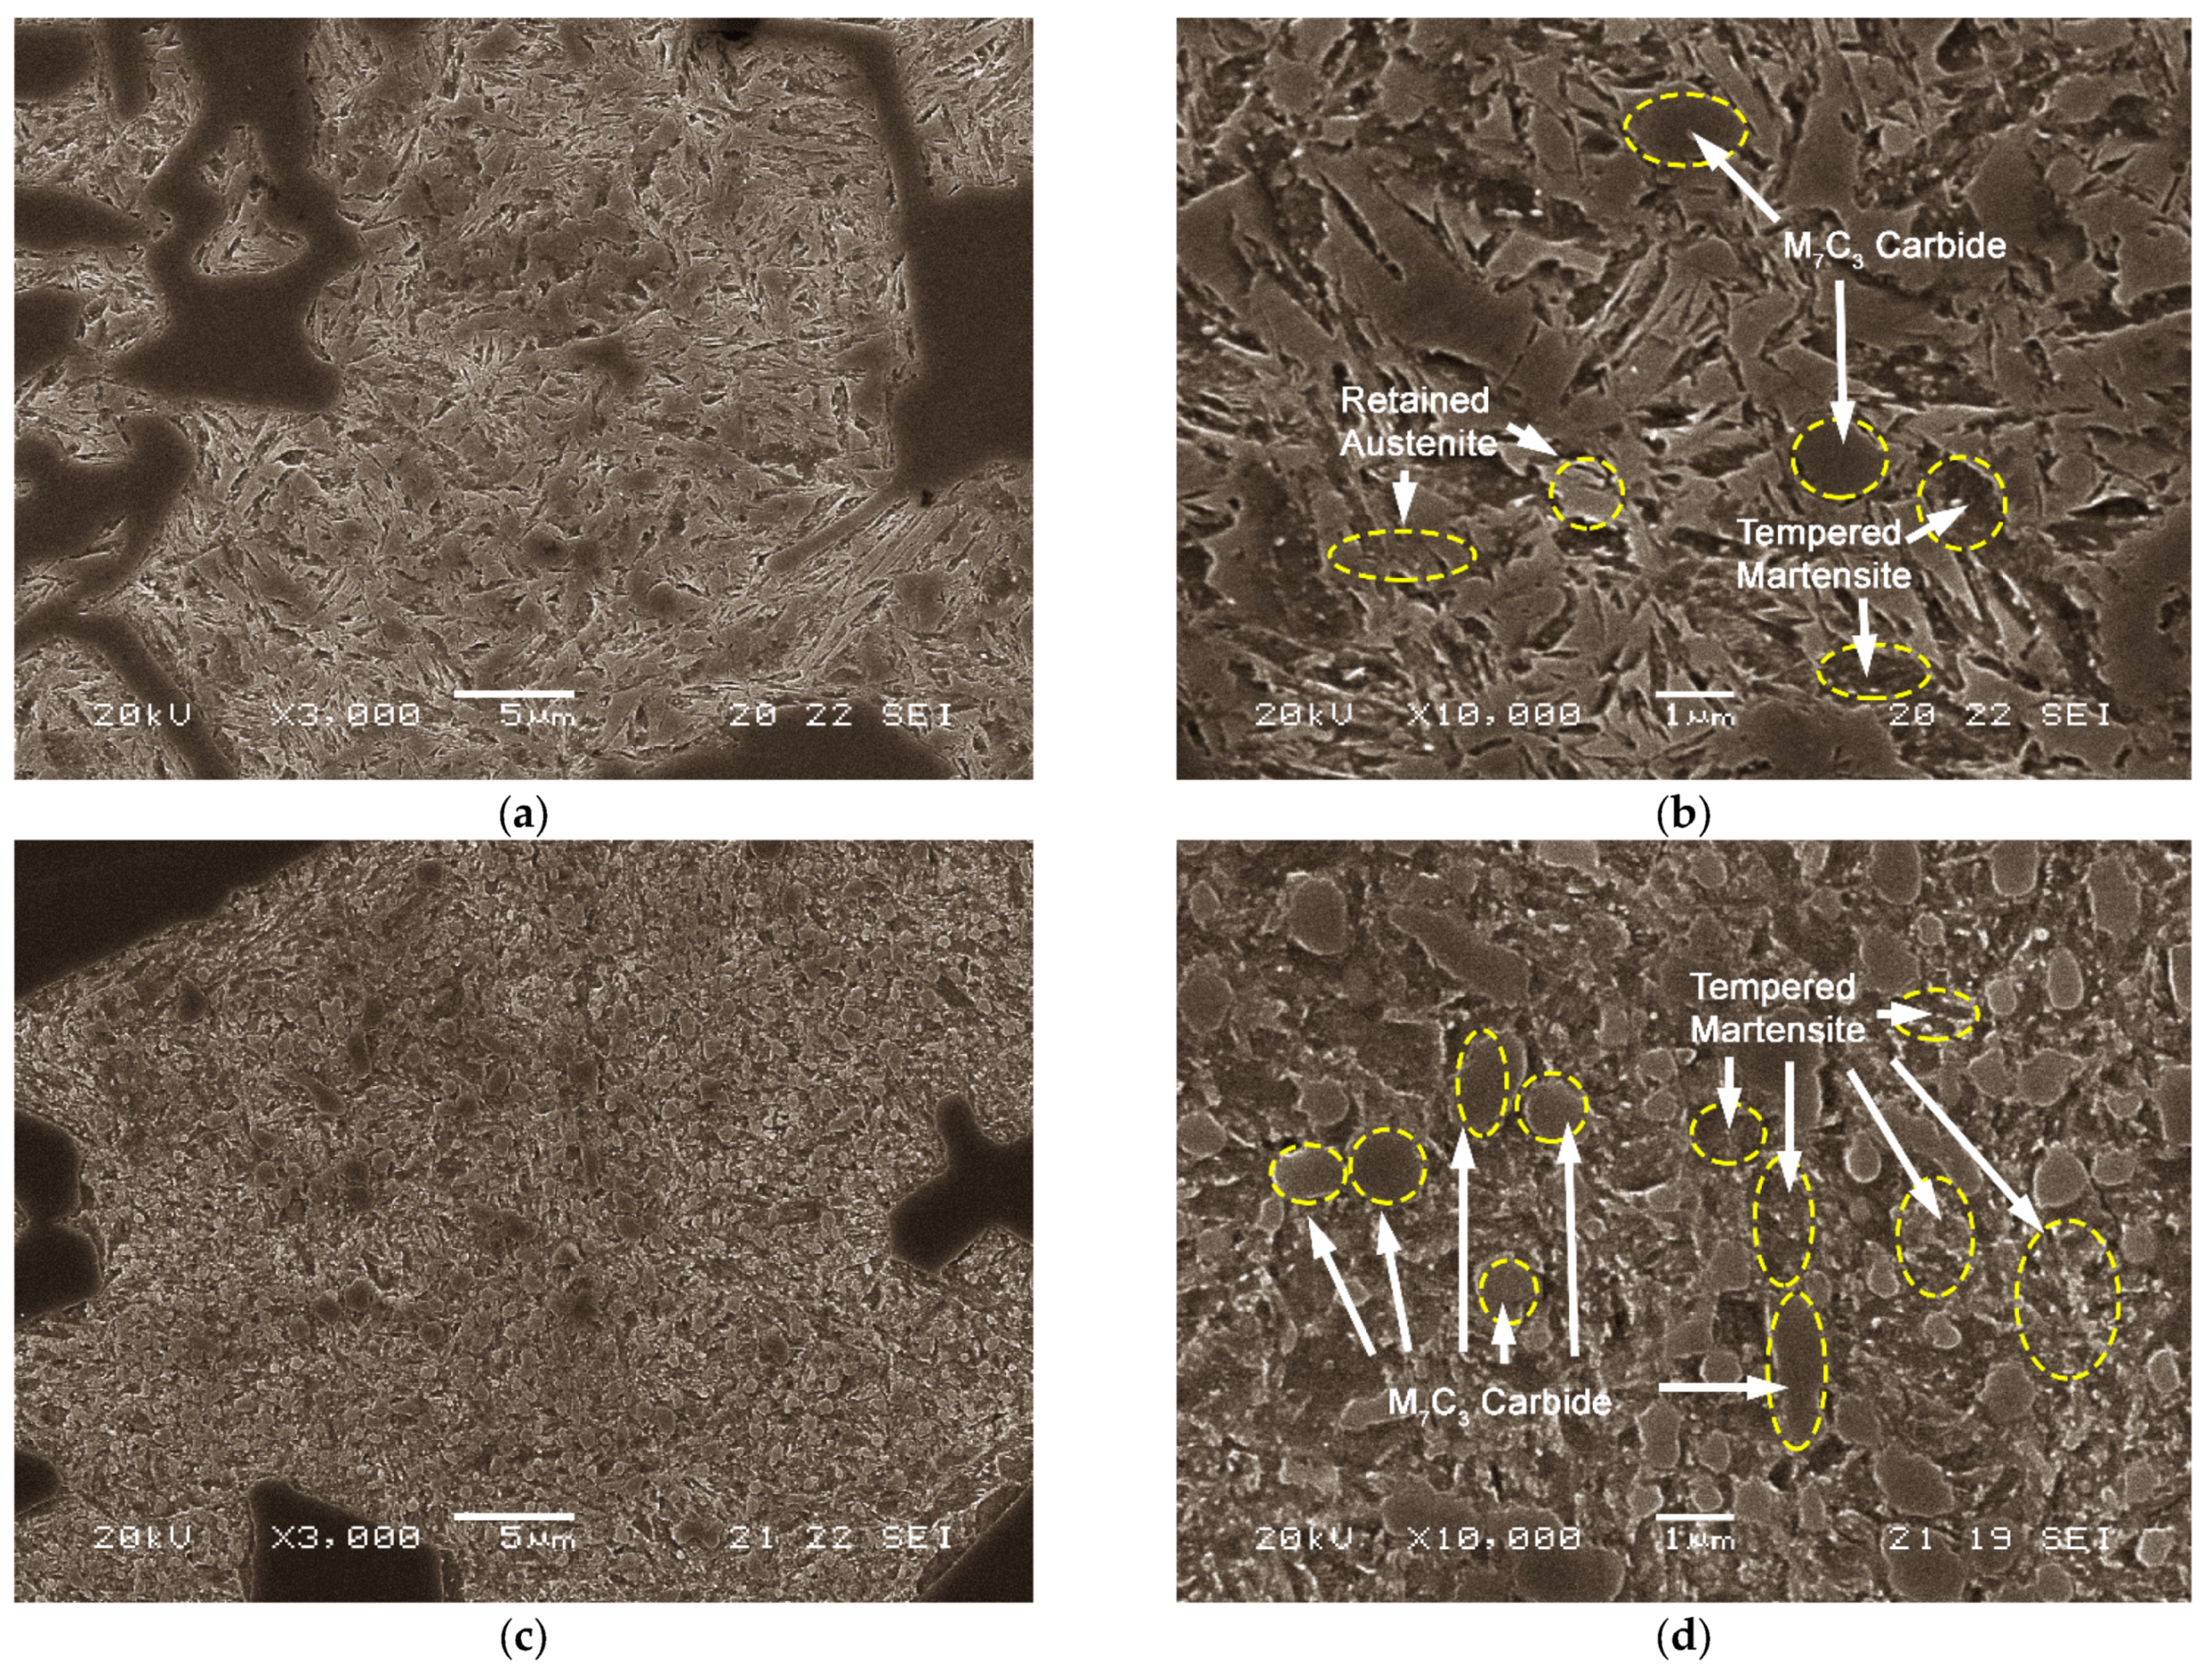
- The use of high destabilisation temperatures, around 1050 °C, followed by cooling in hot air at 150 °C. Destabilisation at 1050 °C allows secondary M7C3 carbide precipitation from supersaturated austenite accompanied by partial solubilisation of non-equilibrium eutectic carbides which form during solidification. The after cooling that follows if taking place within an air convection furnace set at 150 °C, seemed to favour further carbide formation in the range of 400–600 °C.
- Abrasion resistance is also favoured by low tempering temperatures (400 °C) and shorter tempering times (2 h). They both seem to favour a fine and dispersed precipitation. From X-ray diffraction analysis, the tempering conditions seemed insufficient for complete ageing of martensite as has been shown by the lattice results which indicate the existence of slender tetragonal lattice remaining after treatment. Thus, its possible contribution to the matrix hardness.
- Quenching in gently stirred oil at ambient temperature has been checked to promote full conversion of destabilised austenite into martensite i.e., to favour the absence of retained austenite after quench. This retained austenite is found to be highly alloyed and with accumulated plastic deformation due to the adjacent presence of tetragonal martensite, thus the need for the absence of residual austenite for better impact response.
- Tempering at 550 °C and long dwell tempering times of around 6 h, helped to complete full ageing of martensite thus the increase of overall toughness.
Author Contributions
Funding
Data Availability Statement
Conflicts of Interest
References
- Standard Specification for Abrasion-Resistant Cast Irons; A532/A532M-10; ASM International: West Conshohocken, PA, USA, 2019. [CrossRef]
- Amorim, P.; Santos, H.; Santos, J.; Coimbra, S.; Sá, C. Soft Annealing of High Chromium White Cast Iron. Mater. Sci. Forum 2004, 455–456, 290–294. [Google Scholar] [CrossRef]
- Abdel-Aziz, K.; El-Shennawy, M.; Omar, A.A. Microstructural characteristics and mechanical properties of heat treated high-cr white cast iron alloys. Int. J. Appl. Eng. Res. 2017, 12, 4675–4686. [Google Scholar]
- Nayak, U.P.; Guitar, M.A.; Mücklich, F. A comparative study on the influence of chromium on the phase fraction and elemental distribution in as-cast high chromium cast irons: Simulation vs. experimentation. Metals 2020, 10, 30. [Google Scholar] [CrossRef] [Green Version]
- Jones, M.; Llewellyn, R.J. Erosion-corrosion assessment of materials for use in the resources industry. Wear 2009, 267, 2003–2009. [Google Scholar] [CrossRef]
- Llewellyn, R.J.; Yick, S.K.; Dolman, K.F. Scouring erosion resistance of metallic materials used in slurry pump service. Wear 2004, 256, 592–599. [Google Scholar] [CrossRef]
- Zhang, J.-C.; Zhang, T.; Yang, Y.T. Microstructure and properties evolution of Nb-bearing medium Cr wear-resistant cast steel during heat treatment. J. Iron Steel Res. Int. 2020. [Google Scholar] [CrossRef]
- Poolthong, N.; Nomura, H.; Takita, M. Effect of heat treatment on microstructure and properties of semi-solid chromium cast iron. Mater. Trans. 2004, 45, 880–887. [Google Scholar] [CrossRef]
- Karantzalis, A.E.; Lekatou, A.; Mavros, H. Microstructural Modifications of As-Cast High-Chromium White Iron by Heat Treatment. J. Mater. Eng. Perform. 2009, 18, 174–181. [Google Scholar] [CrossRef]
- Pero-Sanz, J.A. Fundiciones Férreas; Dossat: Madrid, Spain, 1994; pp. 123, 129. [Google Scholar]
- Tang, X.H.; Chung, R.; Li, D.Y.; Hinckley, B.; Dolman, K. Variations in microstructure of high chromium cast irons and resultant changes in resistance to wear, corrosion and corrosive wear. Wear 2009, 267, 116–121. [Google Scholar] [CrossRef]
- Hanlon, D.N.; Rainforth, W.M.; Sellars, C.M. The rolling/sliding wear response of conventionally processed and spray formed high chromium content cast iron at ambient and elevated temperature. Wear 1999, 225–229, 587–599. [Google Scholar] [CrossRef]
- Kopyciński, D.; Guzik, E.; Szczȩsny, A. Equiaxed and oriented microstructure in high chromium cast iron. Arch. Metall. Mater. 2014, 59, 723–726. [Google Scholar] [CrossRef] [Green Version]
- Walker, C.I.; Hambe, M. Influence of particle shape on slurry wear of white iron. Wear 2015, 332–333, 1021–1027. [Google Scholar] [CrossRef]
- Doǧan, Ö.N.; Hawk, J.A. Effect of carbide orientation on abrasion of high Cr white cast iron. Wear 1995, 189, 136–142. [Google Scholar] [CrossRef] [Green Version]
- Zum Gahr, K.H.; Eldis, G.T. Abrasive wear of white cast irons. Wear 1980, 64, 175–194. [Google Scholar] [CrossRef]
- Thorpe, W.R.; Chicco, B. The Fe-rich corner of the metastable C-Cr-Fe liquidus surface. Metall. Trans. A 1985, 16, 1541–1549. [Google Scholar] [CrossRef]
- Kadhim, M.J.; Abood, A.N.; Yaseen, R.S. The role of manganese on microstructure of high chromium white cast iron. Mod. Appl. Sci. 2011, 5, 179–185. [Google Scholar] [CrossRef]
- Pearce, J.T.H. The use of transmission electron microscopy to study the effects of abrasive wear on the matrix structure of a high chromium cast iron. Wear 1983, 89, 333–344. [Google Scholar] [CrossRef]
- Sinatora, A.; Pohl, M.; Waldherr, E.U. Wear induced martensite in high chromium cast iron. Scr. Metall. Mater. 1995, 32, 857–861. [Google Scholar] [CrossRef]
- Zhang, M.X.; Kelly, P.M.; Gates, J.D. The effect of heat treatment on the toughness, hardness and microstructure of low carbon white cast irons. J. Mater. Sci. 2001, 36, 3865–3875. [Google Scholar] [CrossRef]
- Davis, J.R. Metallurgy and properties of high alloy white irons. ASM Specially Hand Book, Cast Irons; ASM International: Materials Park, OH, USA, 1996; pp. 107–130. [Google Scholar]
- Chung, R.J.; Tang, X.; Li, D.Y.; Hinckley, B.; Dolman, K. Microstructure refinement of hypereutectic high Cr cast irons using hard carbide-forming elements for improved wear resistance. Wear 2013, 301, 695–706. [Google Scholar] [CrossRef]
- Karantzalis, A.E.; Lekatou, A.; Diavati, E. Effect of destabilization heat treatments on the microstructure of high-chromium cast iron: A microscopy examination approach. J. Mater. Eng. Perform. 2009, 18, 1078–1085. [Google Scholar] [CrossRef]
- Tabrett, C.P.; Sare, I.R. Fracture toughness of high-chromium white irons: Influence of cast structure. J. Mater. Sci. 2000, 35, 2069–2077. [Google Scholar] [CrossRef]
- Gonzalez-Pociño, A.; Alvarez-Antolin, F.; Asensio-Lozano, J. Erosive wear resistance regarding different destabilization heat treatments of austenite in high chromium white cast iron, alloyed with Mo. Metals 2019, 9, 522. [Google Scholar] [CrossRef] [Green Version]
- Powell, G. Improved Wear-Resistant High-Alloyed White Irons-a Historical Perspective. In Proceedings of the International Congress on Abrasion Wear Resistance Alloyed White Cast Iron for Rolling and Pulverizing Mills, Fukuoka, Japan, 16–20 August 2002; pp. 1–10. [Google Scholar]
- Wang, J.; Li, C.; Liu, H.; Yang, H.; Shen, B.; Gao, S.; Huang, S. The precipitation and transformation of secondary carbides in a high chromium cast iron. Mater. Charact. 2006, 56, 73–78. [Google Scholar] [CrossRef]
- Oanh, N.T.H.; Viet, N.H. Precipitation of M23C6 secondary carbide particles in Fe-Cr-Mn-C alloy during heat treatment process. Metals 2020, 10, 157. [Google Scholar] [CrossRef] [Green Version]
- Tabrett, C.P.; Sare, I.R.; Ghomashchi, M.R. Microstructure-property relationships in high chromium white iron alloys. Int. Mater. Rev. 2014, 41, 59–82. [Google Scholar] [CrossRef]
- Pero-Sanz, J.A. Aceros. Metalurgia Física, Selección y Diseño; Dossat: Madrid, Spain, 2004; pp. 70–71, 128–142. [Google Scholar]
- Bhadeshia, H.K.D.H.; Honeycombe, R.W.K. Steels: Microstructure and Properties; Butterworth-Heinemann (Elsevier): London, UK, 2006; pp. 101, 193–195. [Google Scholar]
- Prat-Bartés, A.; Tort-Martorell, X.; Grima-Cintas, P.; Pozueta-Fernández, L.; Solé-Vidal, I. Métodos Estadísticos, 2nd ed.; UPC: Barcelona, Spain, 2004; p. 376. [Google Scholar]
- Stephens, P.W. Phenomenological model of anisotropic peak broadening in powder diffraction. J. Appl. Crystallogr. 1999. [Google Scholar] [CrossRef]
- Pero-Sanz Elorz, J.A. Ciencia e Ingeniería de Materiales, 5th ed.; Cie-Dossat: Madrid, Spain, 2006; p. 237. [Google Scholar]
- González-Pociño, A.; Alvarez-Antolin, F.; Asensio-Lozano, J. The joint effects of nitriding and parameters related to the destabilisation of austenite on wear resistance in white cast iron with 25% cr. Metals 2021, 11, 85. [Google Scholar] [CrossRef]
- Gonzalez-Pociño, A.; Alvarez-Antolin, F.; Asensio-Lozano, J. Optimization, by means of a design of experiments, of heat processes to increase the erosive wear resistance of white hypoeutectic cast irons alloyed with Cr and Mo. Metals 2019, 9, 403. [Google Scholar] [CrossRef] [Green Version]
- Zhou, X.; Fang, F.; Gang, L.I.; Jiang, J. Morphology and properties of M2C eutectic carbides in AISI M2 steel. ISIJ Int. 2010, 50, 1151–1157. [Google Scholar] [CrossRef] [Green Version]


| C | Si | Mn | Cr | Mo |
|---|---|---|---|---|
| 2.7 | 1.2 | 0.8 | 25.1 | 0.5 |
| Factors | Levels | ||
|---|---|---|---|
| Code | Metallurgical Parameter (Factors) | Level −1 | Level +1 |
| A | Destabilisation temperature of austenite (°C) for 5h | 950 | 1050 |
| B | Cooling media from austenite destabilizing | Air convection within a furnace set @150 °C | gently stirred oil at R.T. |
| C | Tempering temperature (°C) | 400 | 550 |
| D | Dwell time at tempering temperature (h) | 2 | 6 |
| No | A | B | C | D | Restricted Confounding Patterns |
|---|---|---|---|---|---|
| 1 | −1 | −1 | −1 | −1 | A B C D AB + CD AC + BD AD + BC |
| 2 | +1 | −1 | −1 | +1 | |
| 3 | −1 | +1 | −1 | +1 | |
| 4 | +1 | +1 | −1 | −1 | |
| 5 | −1 | −1 | +1 | +1 | |
| 6 | +1 | −1 | +1 | −1 | |
| 7 | −1 | +1 | +1 | −1 | |
| 8 | +1 | +1 | +1 | +1 |
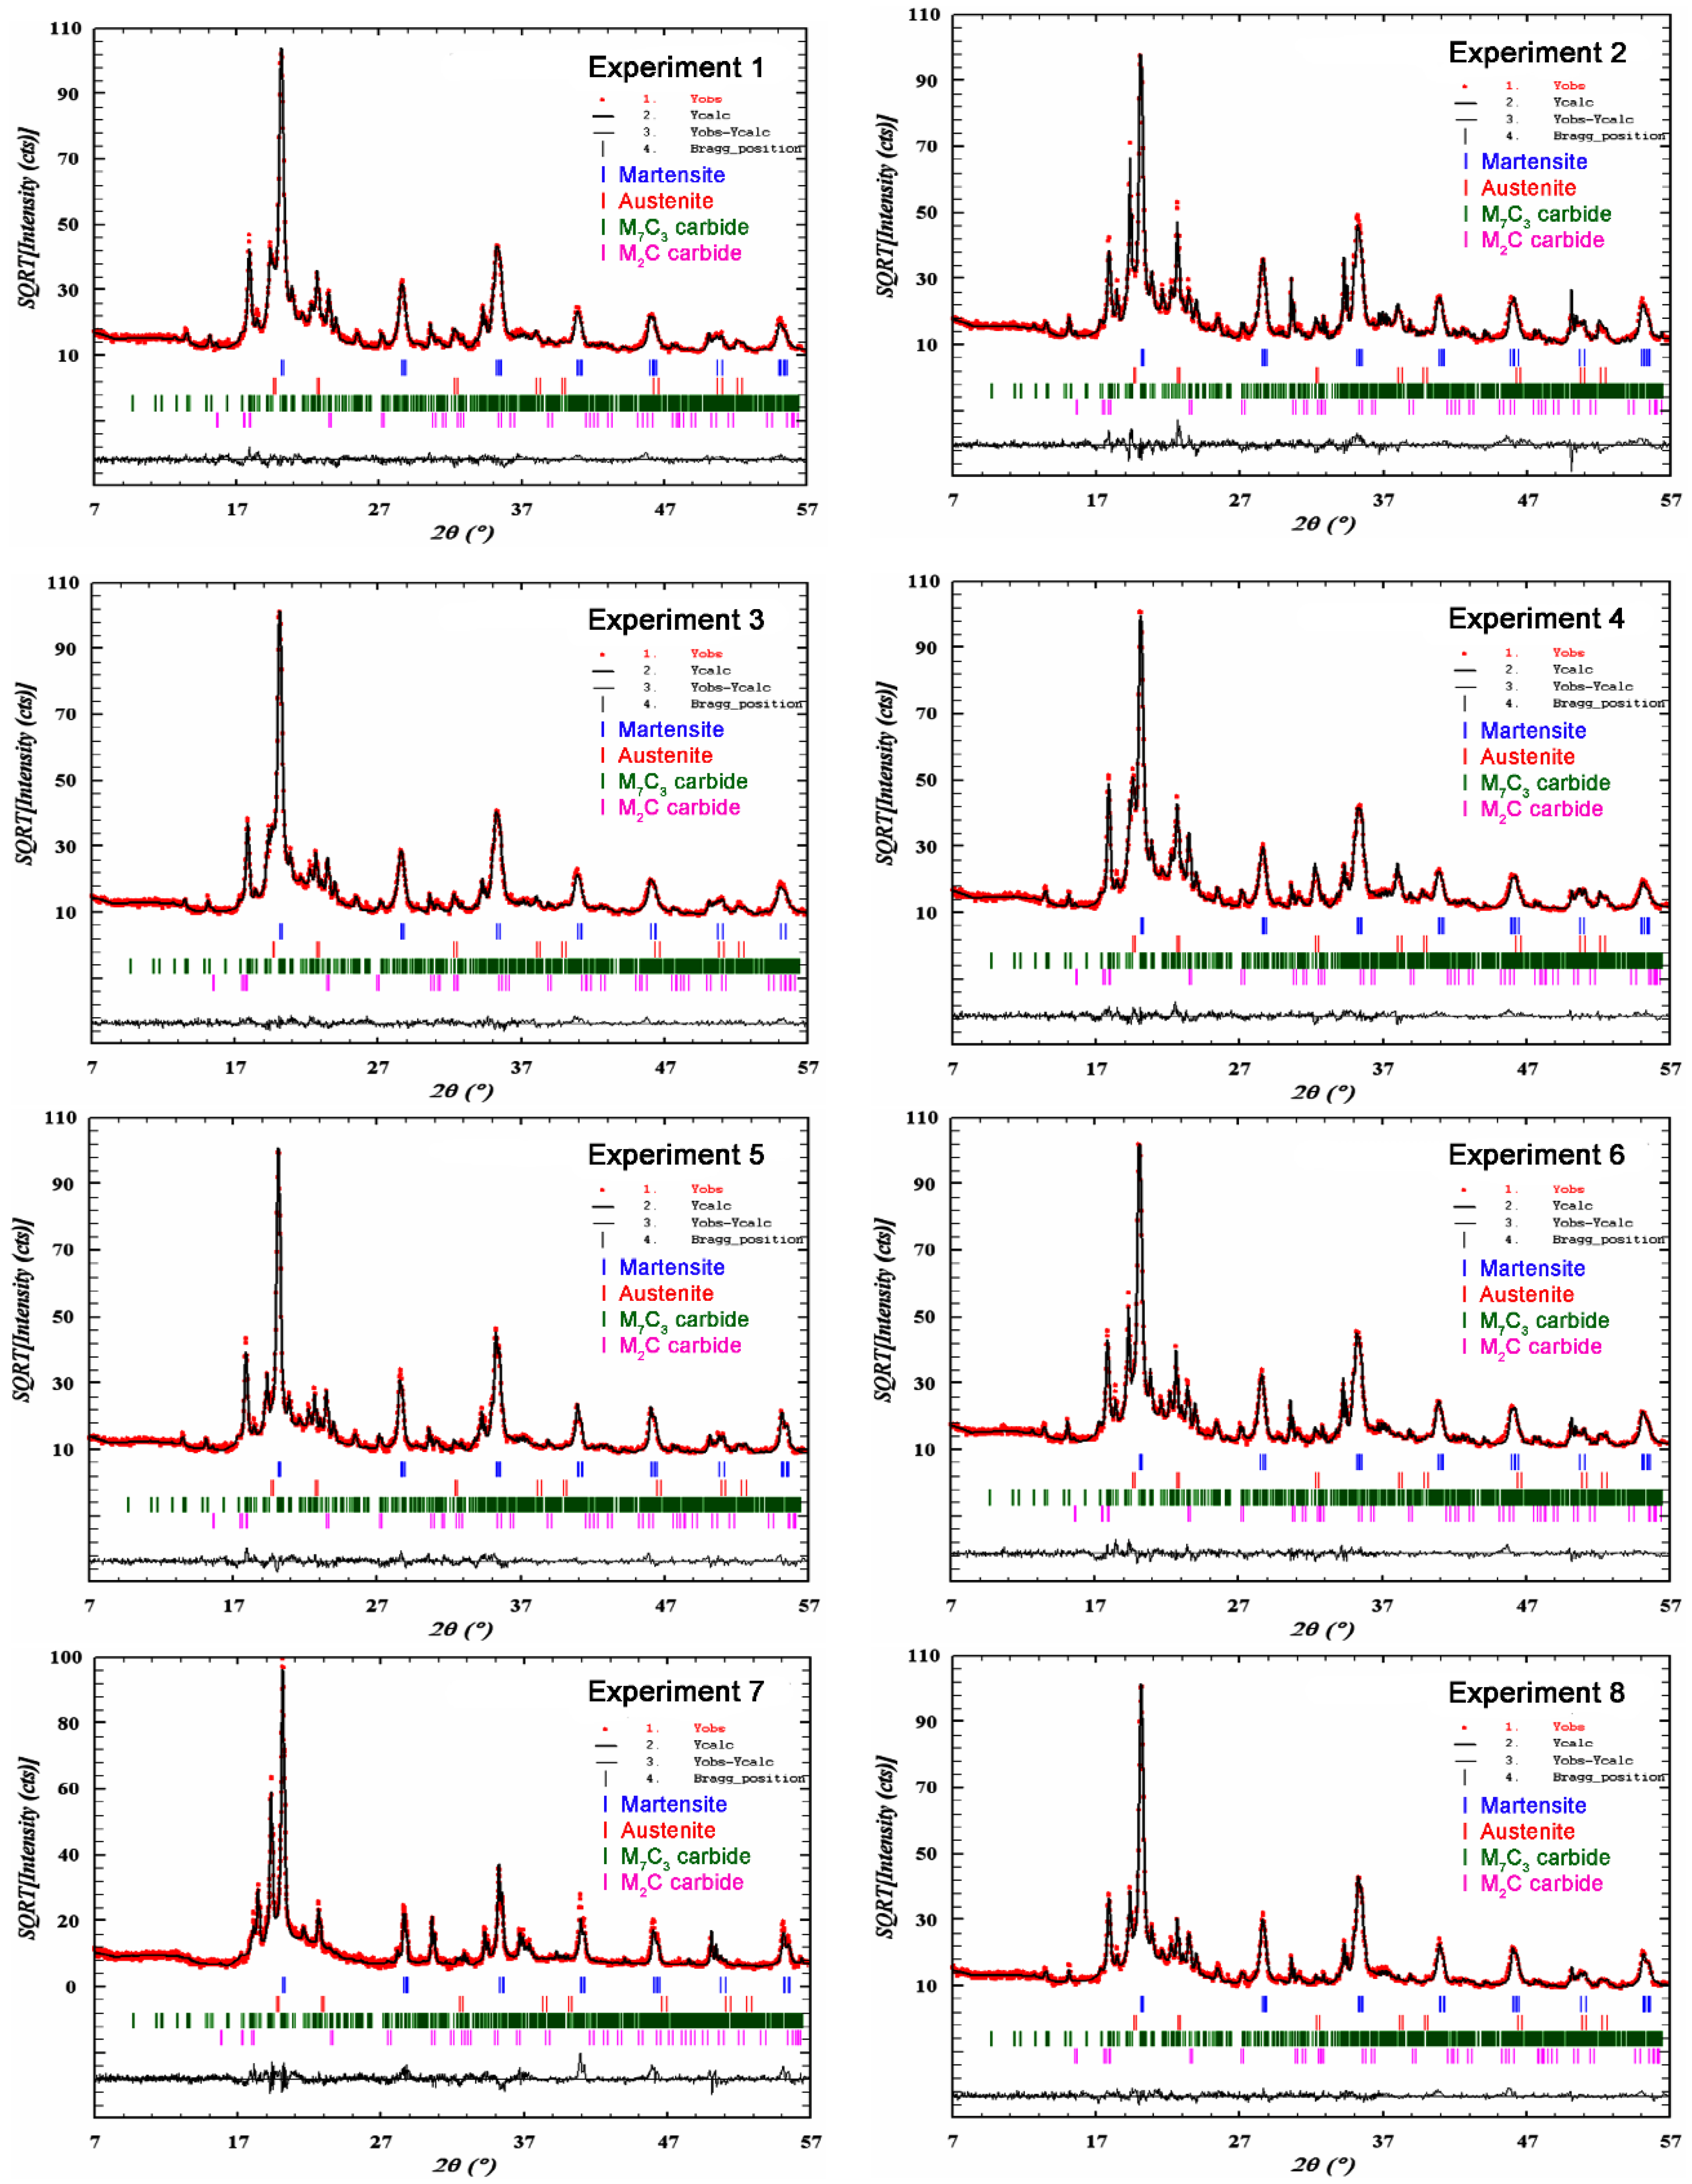
| Experiment | Rietveld Refinement | Phases | Lattice Volume of Martensite (Å3) | wt. % |
|---|---|---|---|---|
| 1 | Rwp = 11.6 Rexp = 7.40 Chi2 = 2.46 | Martensite | 23.58 (±0.006) | 54.64 (±1.99) |
| Austenite | - | 5.61 (±0.62) | ||
| M7C3 carbide | - | 38.86 (±1.45) | ||
| M2C carbide | - | 0.90 (±0.13) | ||
| 2 | Rwp = 15.6 Rexp = 7.15 Chi2 = 4.79 | Martensite | 23.67 (±0.005) | 20.99 (±0.66) |
| Austenite | - | 9.70 (±0.8) | ||
| M7C3 carbide | - | 68.83 (±1.82) | ||
| M2C carbide | - | 0.48 (±0.09) | ||
| 3 | Rwp = 10.5 Rexp = 7.84 Chi2 = 1.81 | Martensite | 23.61 (±0.006) | 68.07 (±2.53) |
| Austenite | - | 6.22 (±0.34) | ||
| M7C3 carbide | - | 25.06 (±0.94) | ||
| M2C carbide | - | 0.65 (±0.07) | ||
| 4 | Rwp = 11.3 Rexp = 7.19 Chi2 = 2.48 | Martensite | 23.64 (±0.01) | 53.85 (±2.30) |
| Austenite | - | 18.16 (±0.89) | ||
| M7C3 carbide | - | 27.40 (±1.15) | ||
| M2C carbide | - | 0.58 (±0.11) | ||
| 5 | Rwp = 14.4 Rexp = 8.63 Chi2 = 2.78 | Martensite | 23.53 (±0.003) | 69.47 (±3.05) |
| Austenite | - | 0.40 (±0.32) | ||
| M7C3 carbide | - | 29.50 (±1.26) | ||
| M2C carbide | - | 0.63 (±0.13) | ||
| 6 | Rwp = 11.9 Rexp = 7.35 Chi2 = 2.60 | Martensite | 23.61 (±0.005) | 46.36 (±1.78) |
| Austenite | - | 1.12 (±0.39) | ||
| M7C3 carbide | - | 52.09 (±1.45) | ||
| M2C carbide | - | 0.43 (±0.09) | ||
| 7 | Rwp = 20.7 Rexp = 9.96 Chi2 = 4.33 | Martensite | 23.56 (±0.001) | 23.69 (±0.38) |
| Austenite | - | 0.1 (±0.08) | ||
| M7C3 carbide | - | 76.11 (±1.68) | ||
| M2C carbide | - | 0.10 (±0.02) | ||
| 8 | Rwp = 11.8 Rexp = 8.34 Chi2 = 2.00 | Martensite | 23.53 (±0.005) | 64.73 (±2.51) |
| Austenite | - | 0.99 (±0.18) | ||
| M7C3 carbide | - | 34.03 (±1.14) | ||
| M2C carbide | - | 0.24 (±0.09) |
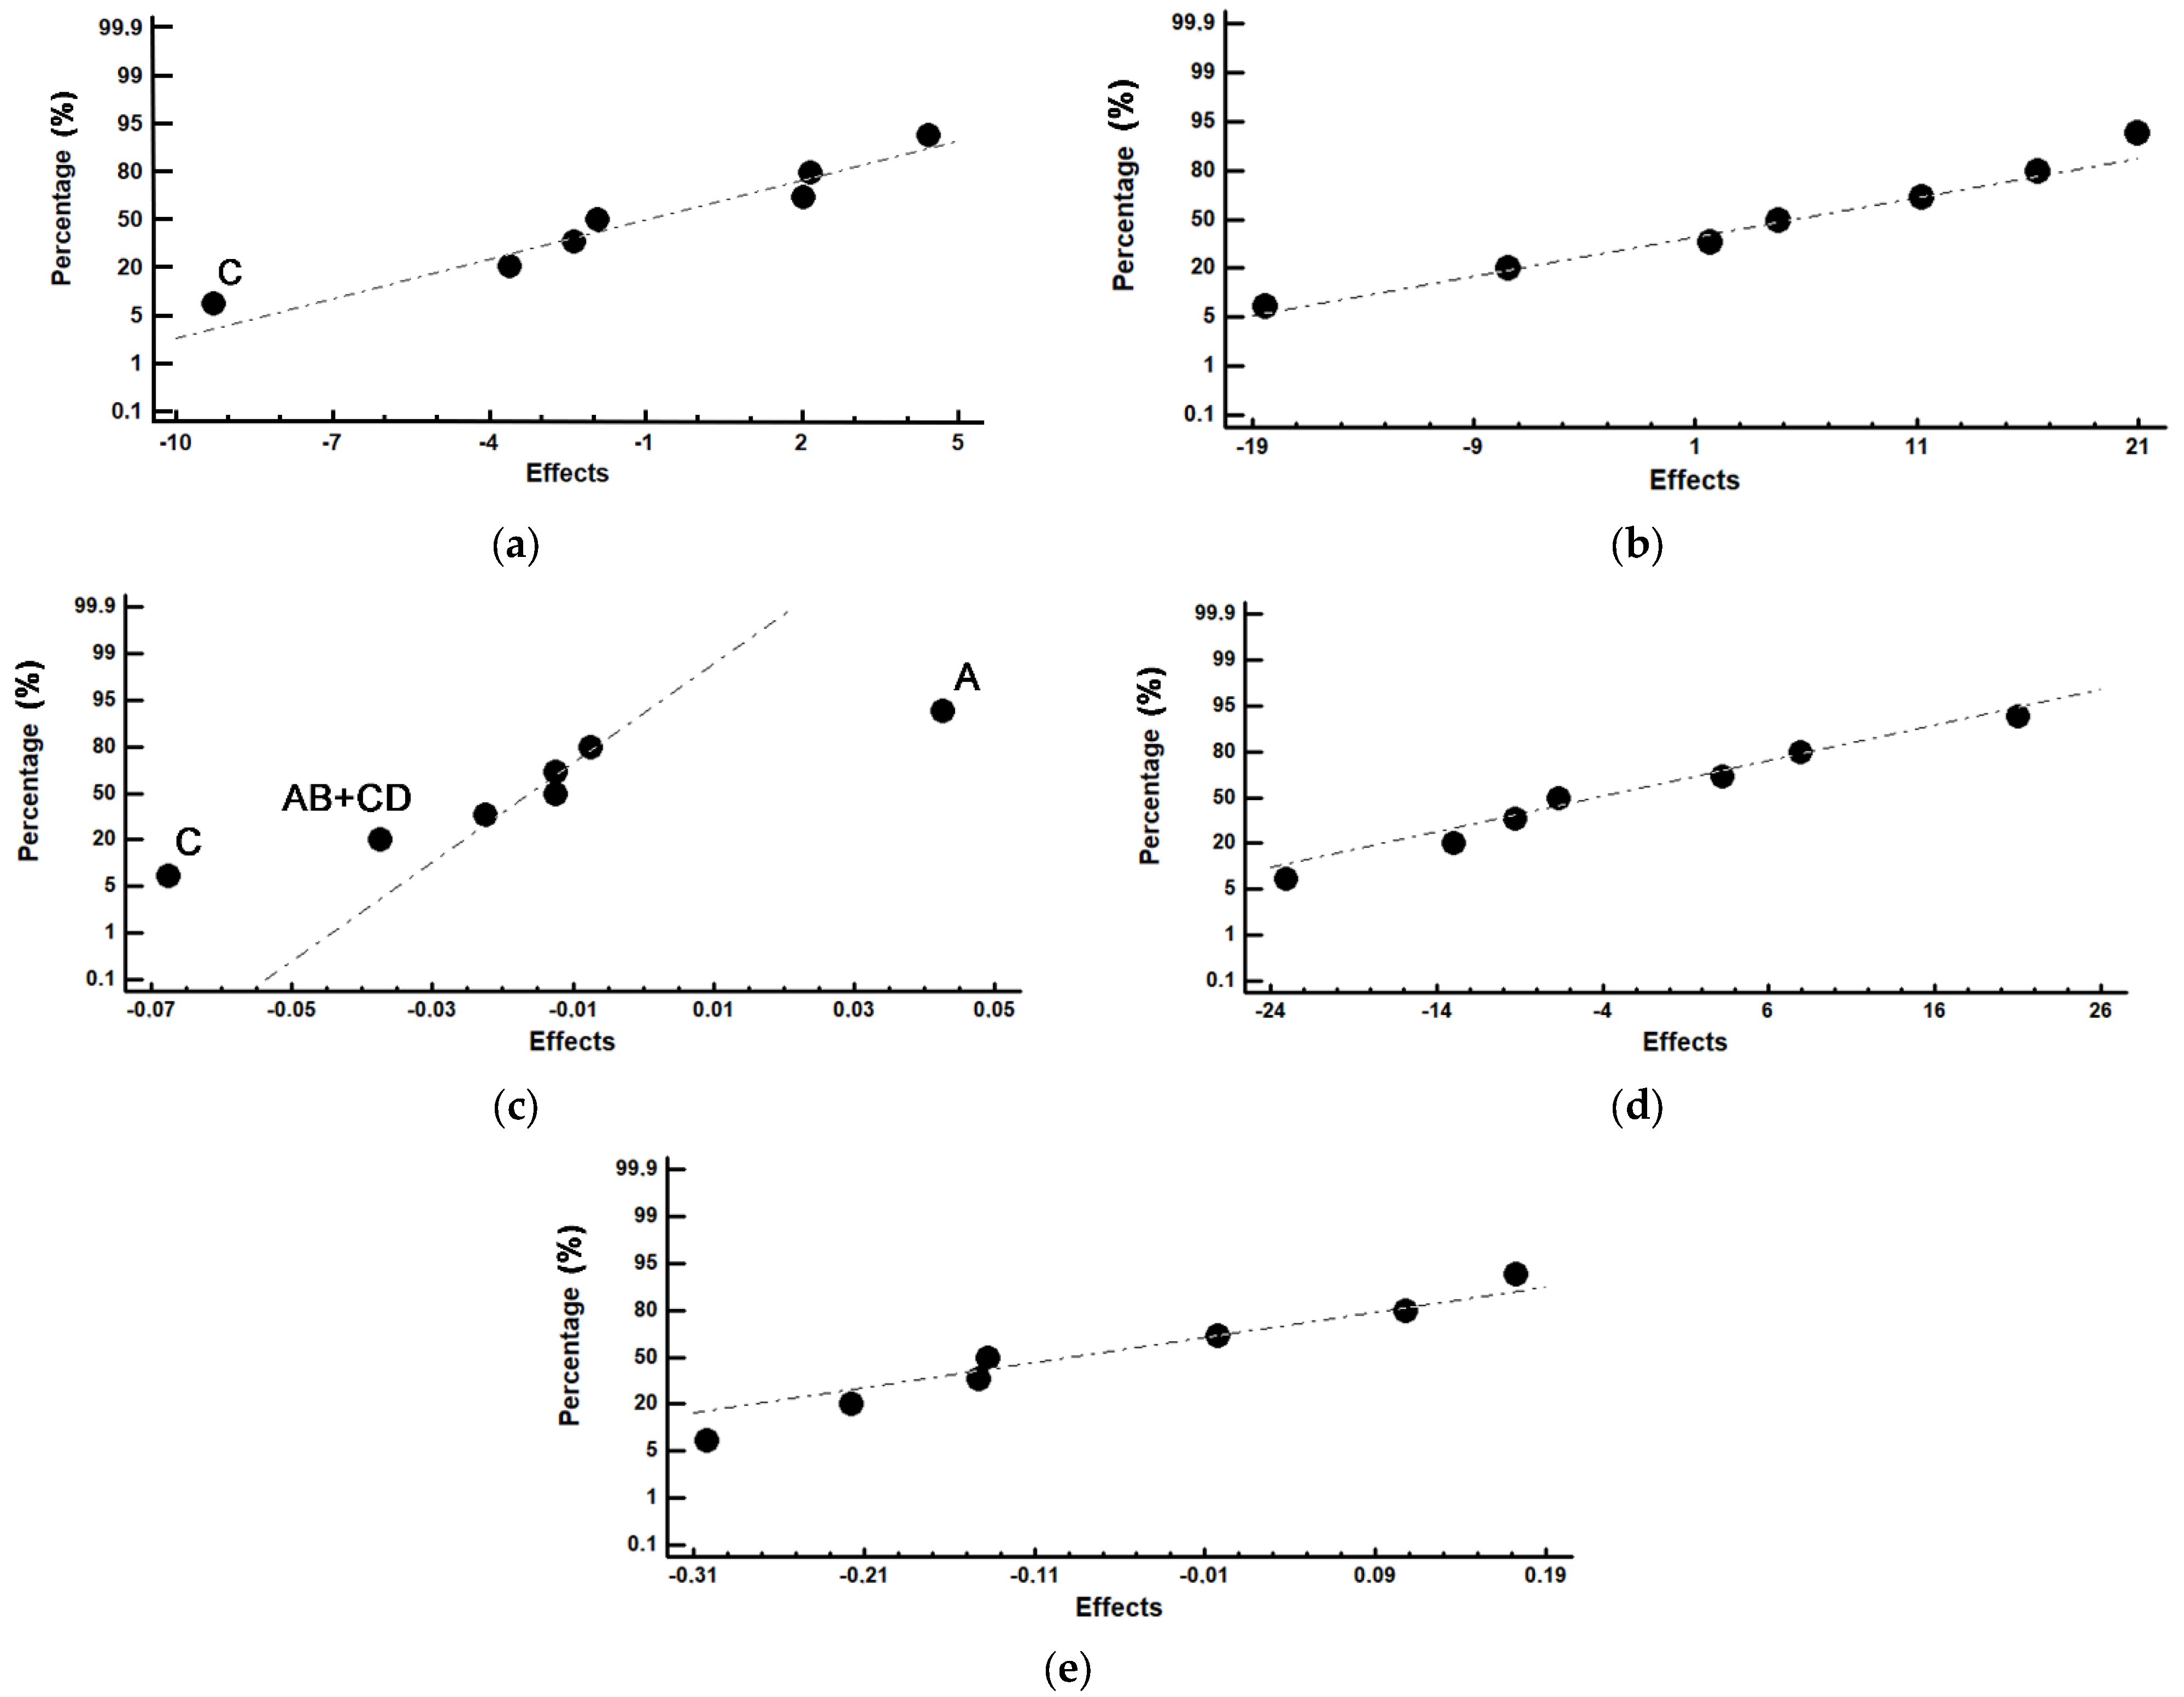
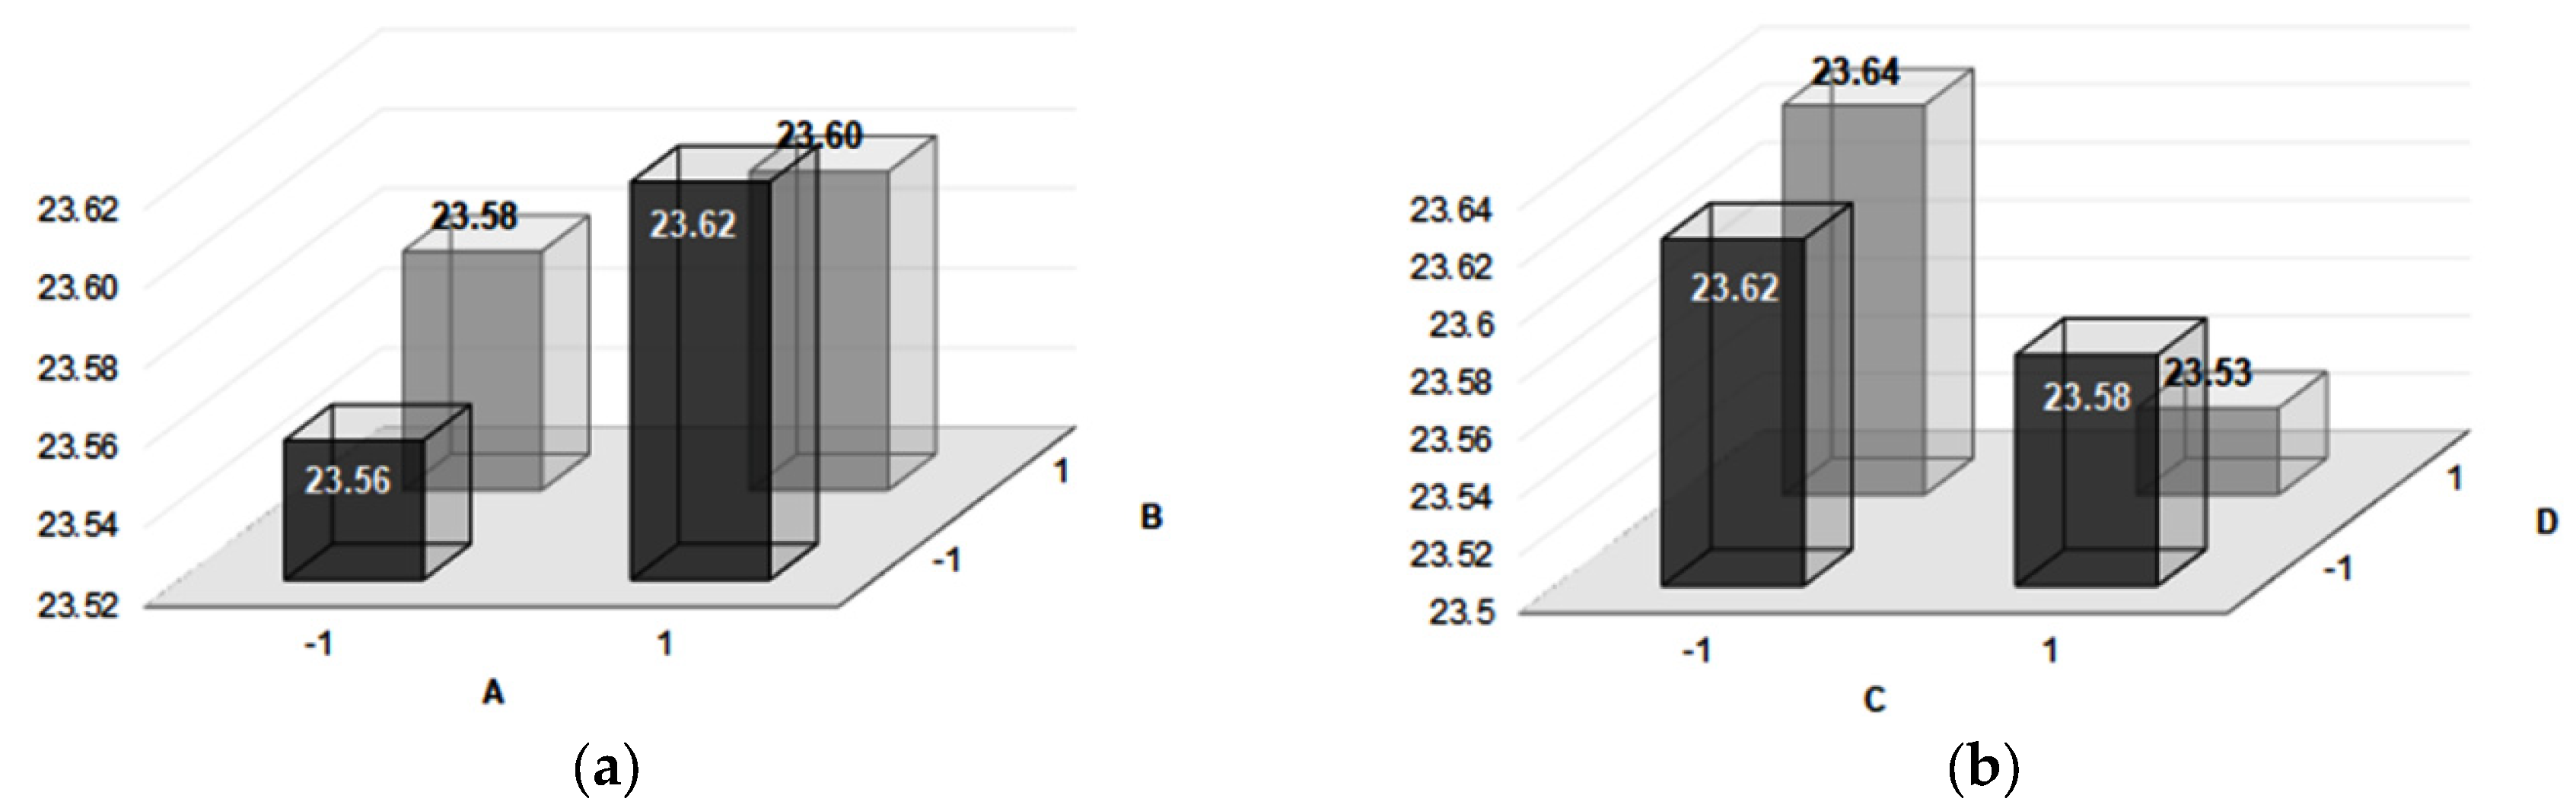
| (a) Weight percentage of tempered martensite and retained austenite | |||||||
| Experiment Number | Austenite | Martensite | Confounding Pattern | ||||
| wt.% | Effects | wt.% | Effects | vol.% | Effects | ||
| 1 | 5.61 | 5.29 | 54.64 | 50.23 | 23.58 | 23.58 | Average |
| 2 | 9.70 | 4.41 | 20.99 | −7.49 | 23.67 | 0.04 | A |
| 3 | 6.22 | 2.16 | 68.07 | 4.72 | 23.60 | −0.01 | B |
| 4 | 18.16 | −9.27 | 53.85 | 1.68 | 23.64 | −0.07 | C |
| 5 | 0.40 | −1.92 | 69.47 | 11.18 | 23.53 | −0.01 | D |
| 6 | 1.12 | 2.01 | 46.36 | 20.90 | 23.6 | −0.04 | AB + CD |
| 7 | 0.10 | −3.61 | 23.69 | 16.45 | 23.56 | −0.02 | AD + BC |
| 8 | 1.00 | −2.38 | 64.73 | −18.43 | 23.53 | −0.01 | AC + BD |
| (b) Weight percentage of M7C3 and M2C carbides | |||||||
| Experiment Number | M7C3 Carbide | M2C Carbide | Confounding Pattern | ||||
| wt.% | Effects | wt.% | Effects | ||||
| 1 | 38.86 | 44.00 | 0.89 | 0.50 | Average | ||
| 2 | 68.83 | 3.21 | 0.48 | −0.14 | A | ||
| 3 | 25.06 | −6.67 | 0.65 | −0.22 | B | ||
| 4 | 27.40 | 7.90 | 0.59 | −0.30 | C | ||
| 5 | 29.50 | −9.26 | 0.63 | 0.00 | D | ||
| 6 | 52.09 | −23.08 | 0.43 | 0.17 | AB + CD | ||
| 7 | 76.11 | −12.95 | 0.10 | 0.11 | AD + BC | ||
| 8 | 34.03 | 20.95 | 0.24 | −0.14 | AC + BD | ||
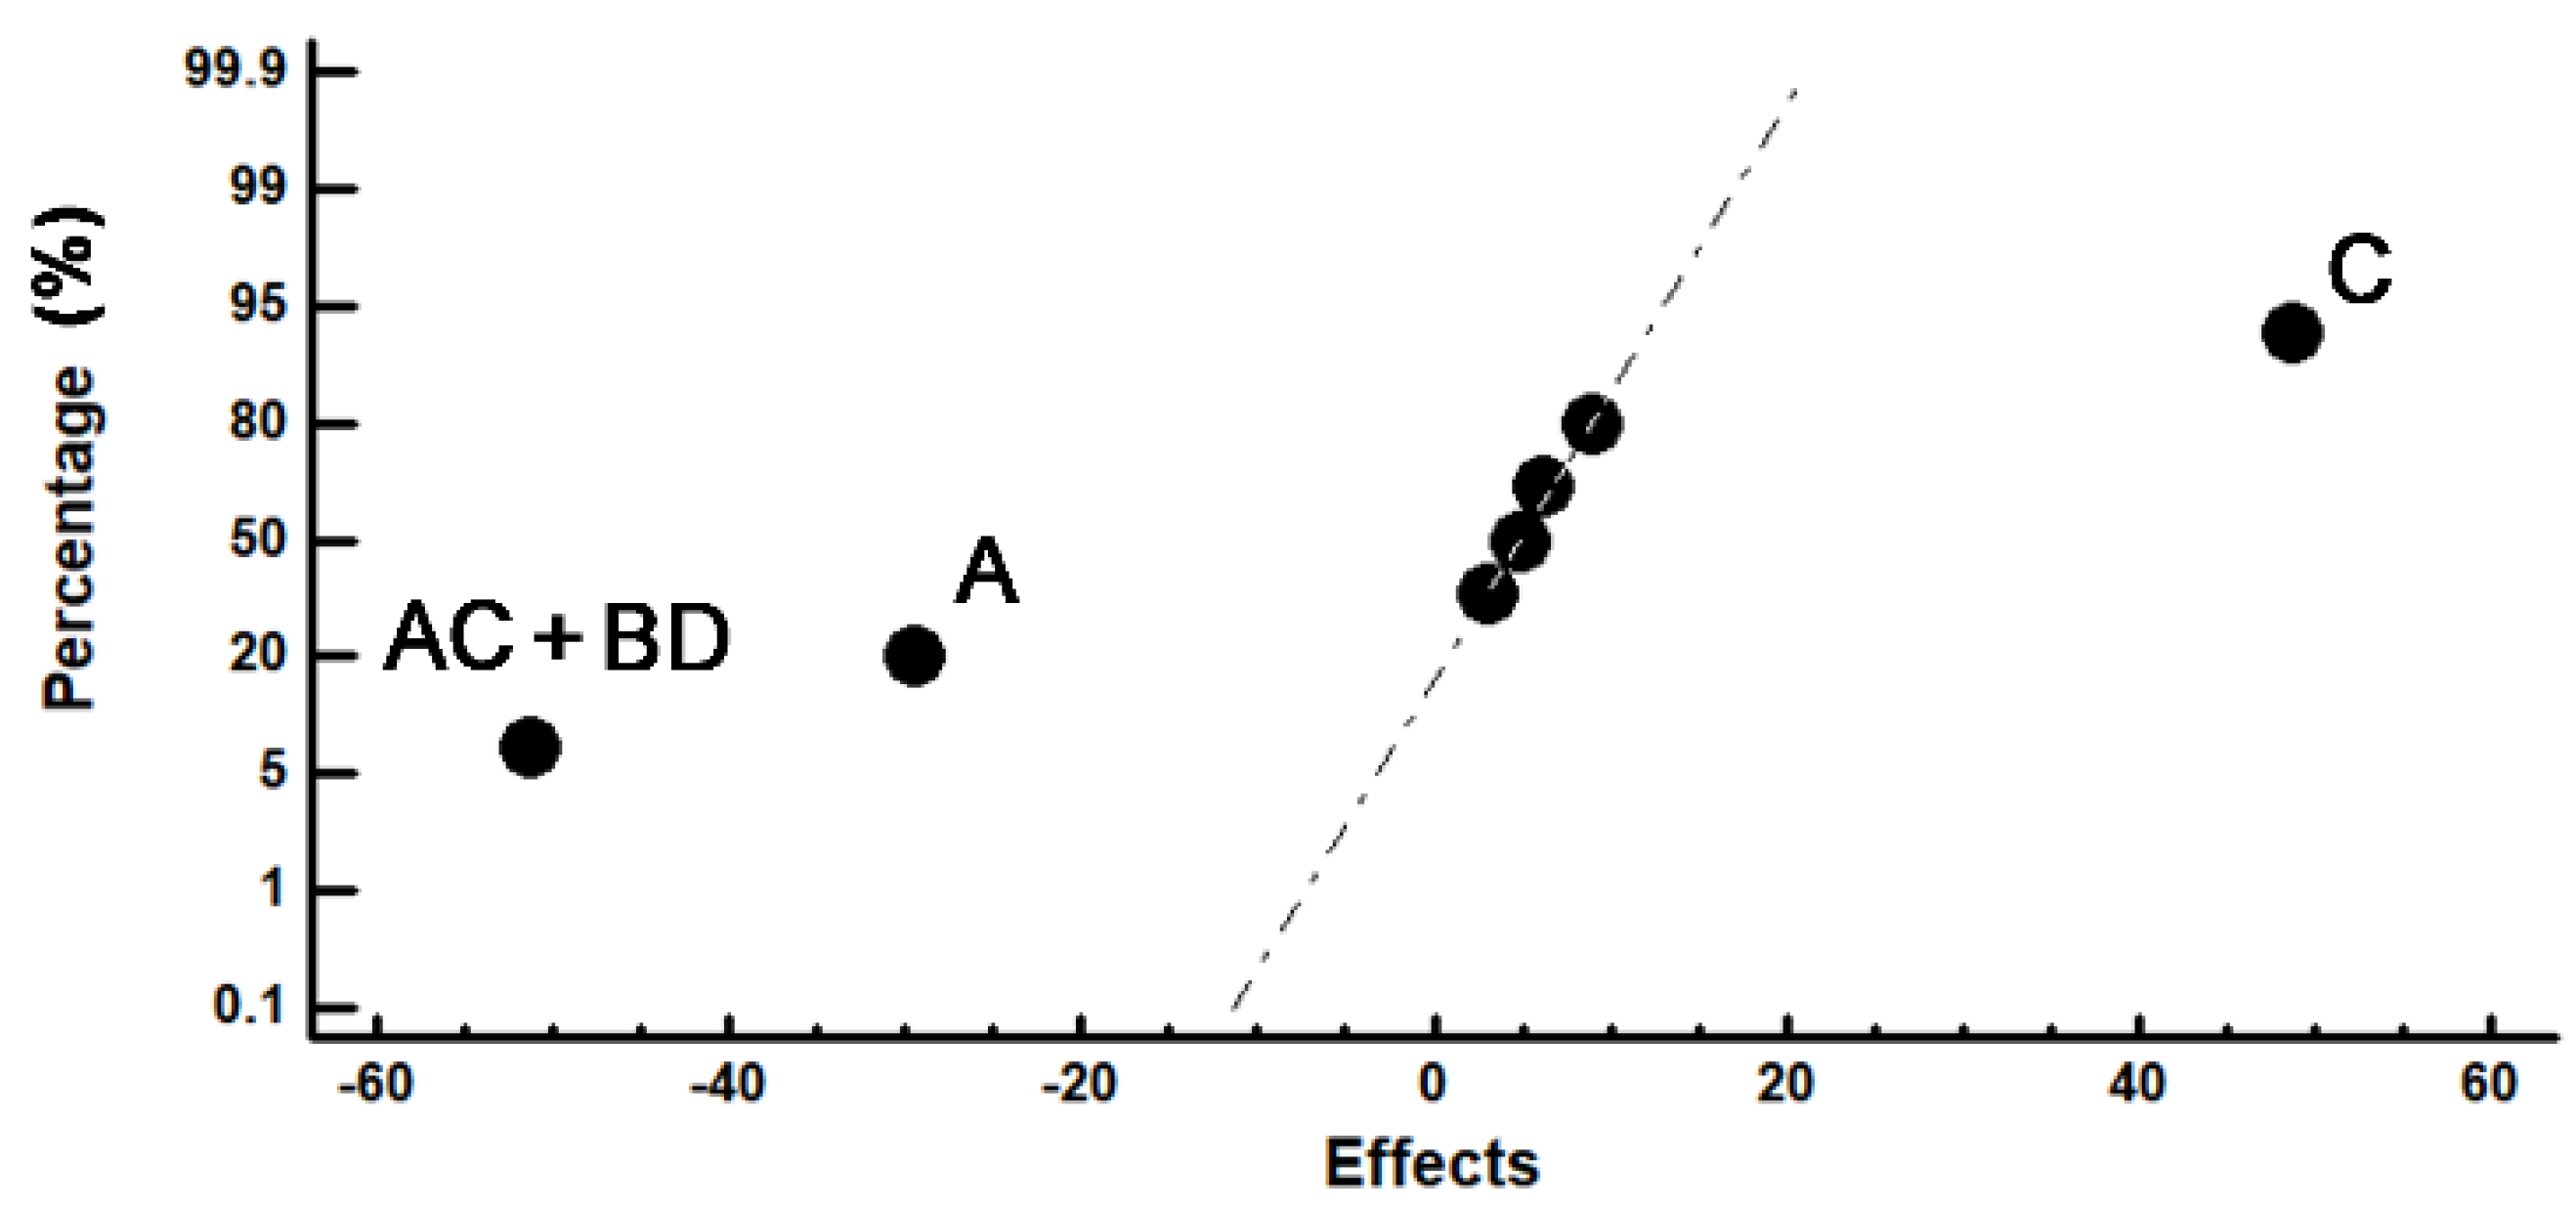
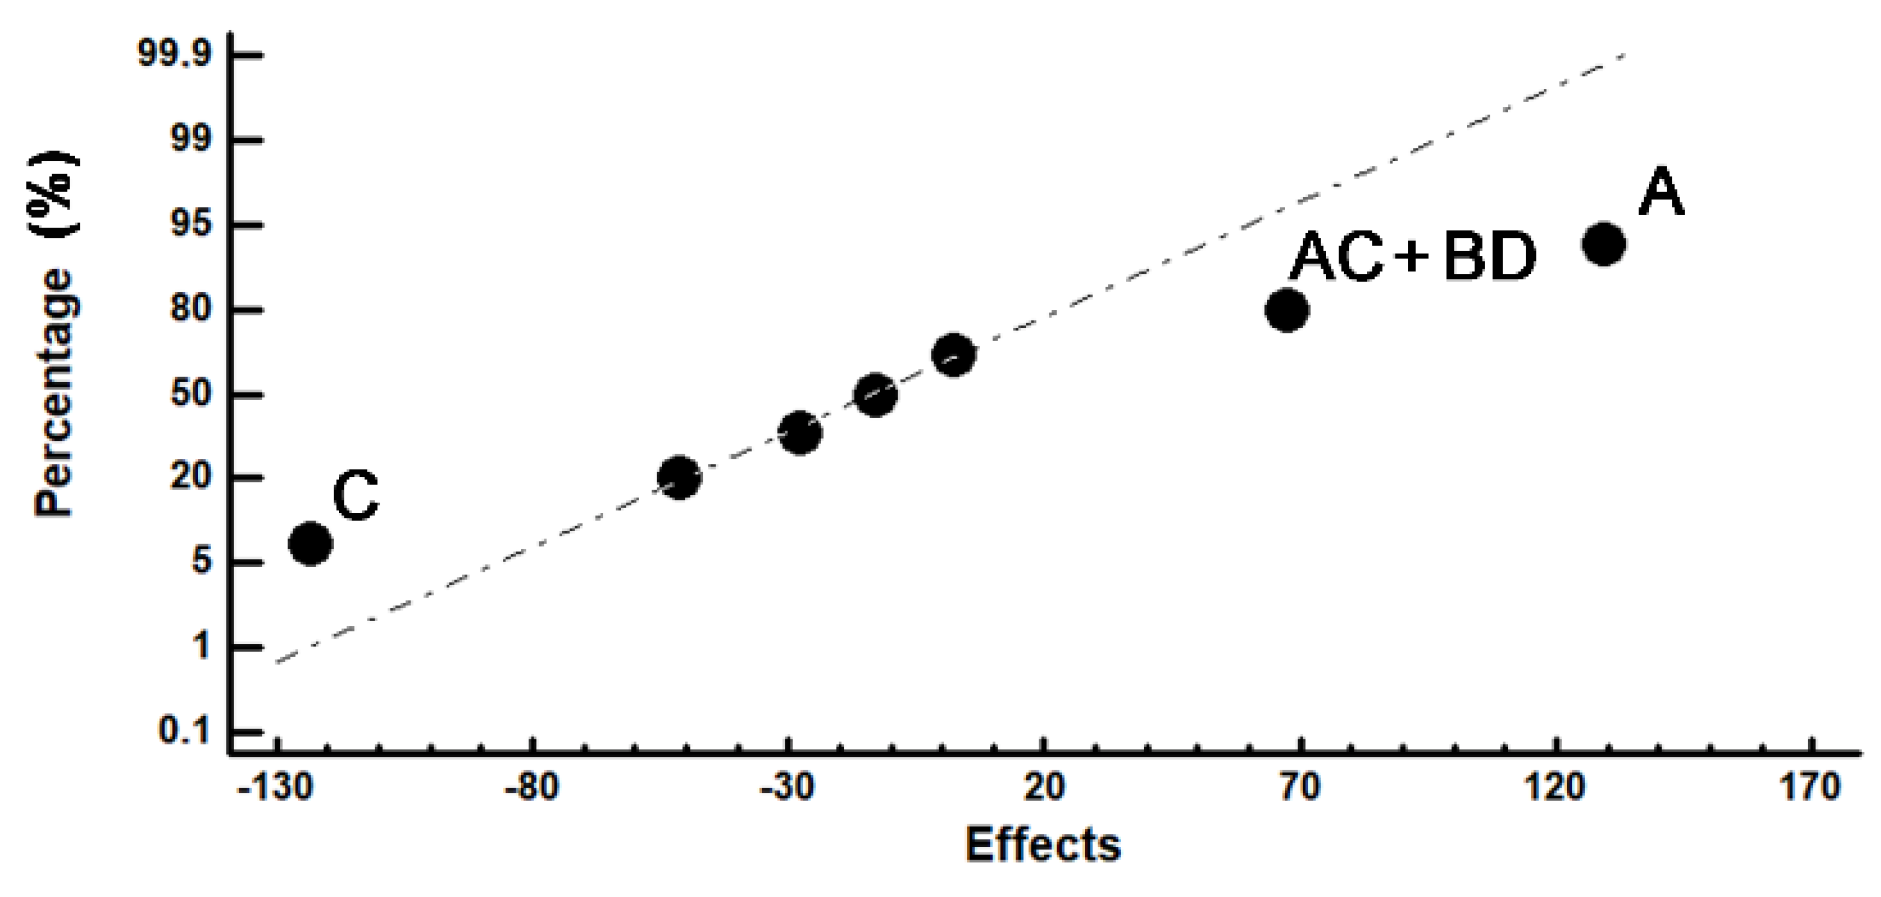
| Experiment Number | Wear Loss (30 min) | Confounding Patterns | ||
|---|---|---|---|---|
| mg | CL (95%) | Effects | ||
| 1 | 97.08 | ±0.75 | 130.02 | Average A B C D AB + CD AC + BD AD + BC |
| 2 | 120.30 | ±1.45 | −29.415 | |
| 3 | 92.35 | ±2.10 | 3.03 | |
| 4 | 113.00 | ±0.20 | 48.675 | |
| 5 | 194.33 | ±1.47 | 6.27 | |
| 6 | 102.31 | ±1.75 | 4.985 | |
| 7 | 195.15 | ±0.37 | −51.35 | |
| 8 | 125.64 | ±1.16 | 9.045 | |
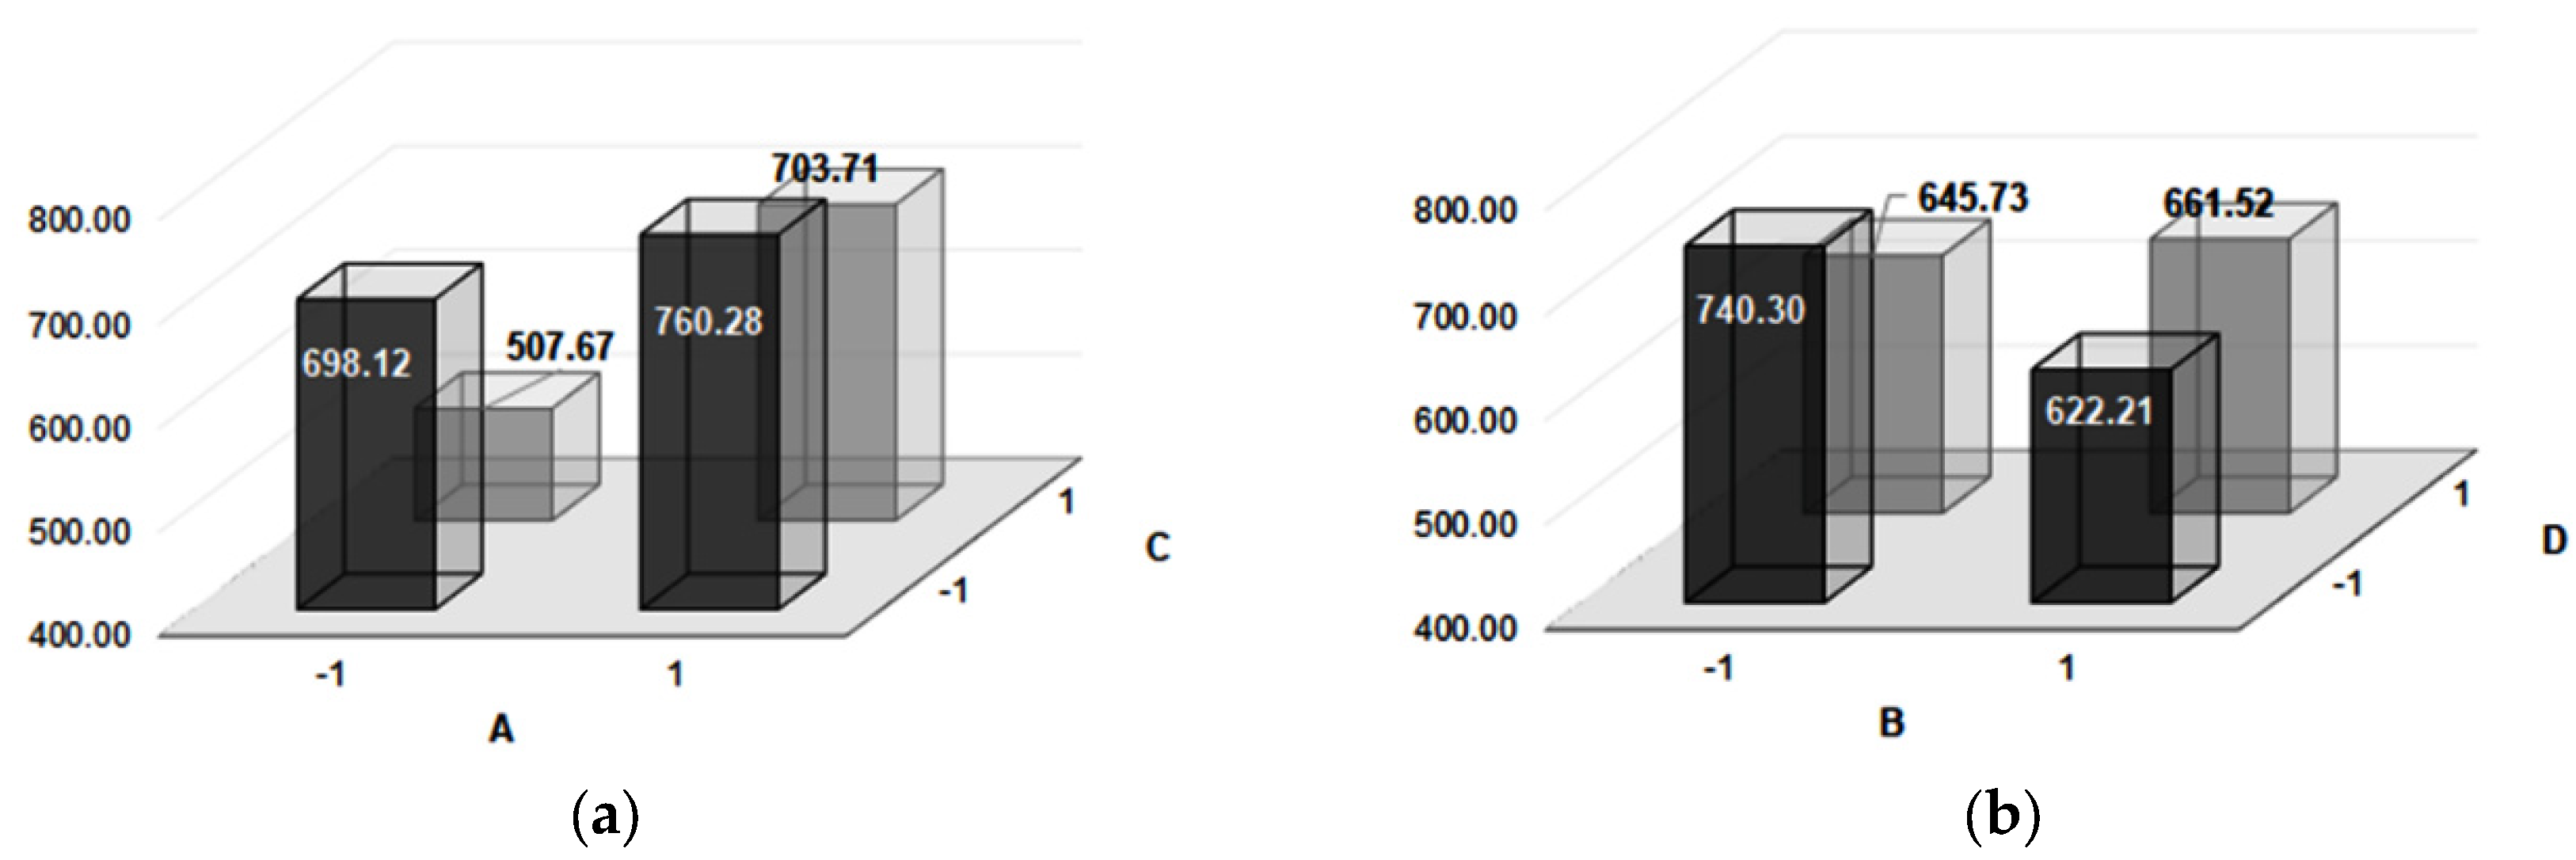
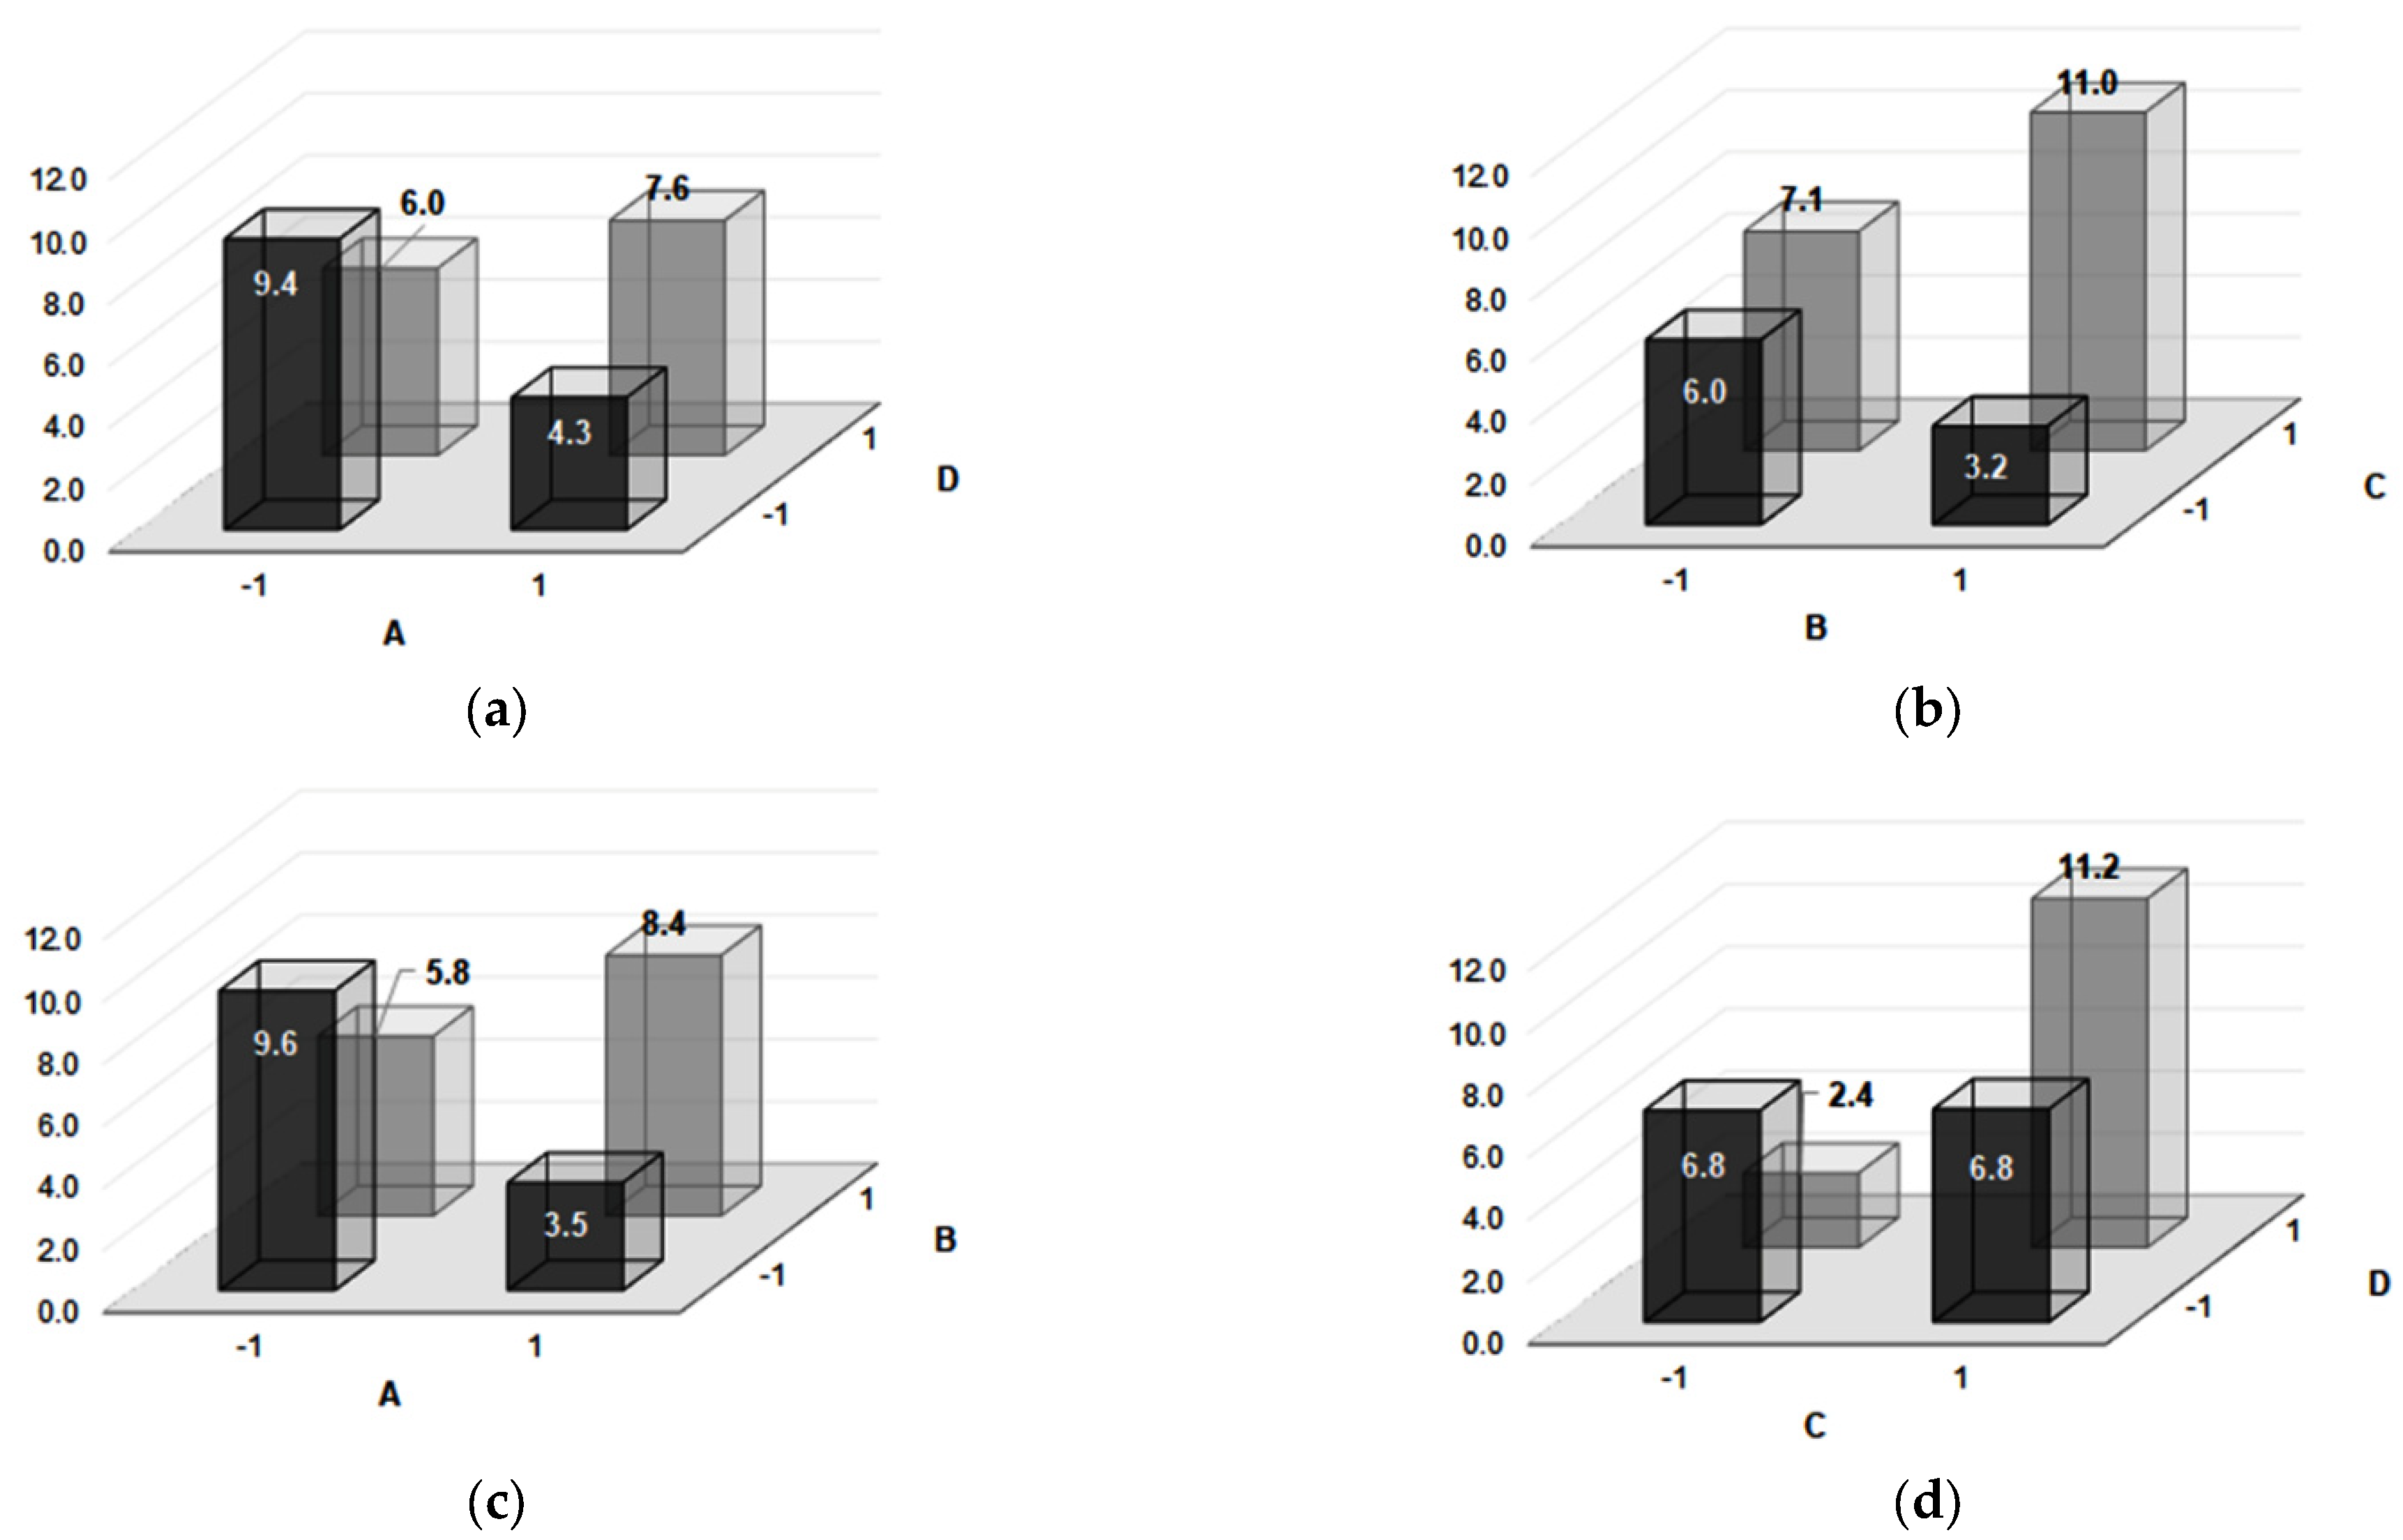
| Experiment Number | Microhardness | Impact Toughness | Confounding Pattern | ||||
|---|---|---|---|---|---|---|---|
| HV | CL (95%) | Effect | J/cm2 | CL (95%) | Effect | ||
| 1 | 732 | ±15 | 667.0 | 8.85 | ±1 | 6.8 | Average |
| 2 | 764 | ±17 | 129.2 | 3.12 | ±0.27 | −1.8 | A |
| 3 | 664 | ±30 | −51.2 | 1.66 | ±0.18 | 0.5 | B |
| 4 | 756 | ±23 | −123.2 | 4.73 | ±0.5 | 4.4 | C |
| 5 | 527 | ±7 | −27.7 | 10.41 | ±1.5 | 0.0 | D |
| 6 | 749 | ±20 | 2.2 | 3.79 | ±0.4 | 4.4 | AB + CD |
| 7 | 488 | ±14 | 67.2 | 9.89 | ±1 | −0.5 | AD + BC |
| 8 | 659 | ±10 | −13.2 | 12.03 | ±1.7 | 3.3 | AC + BD |
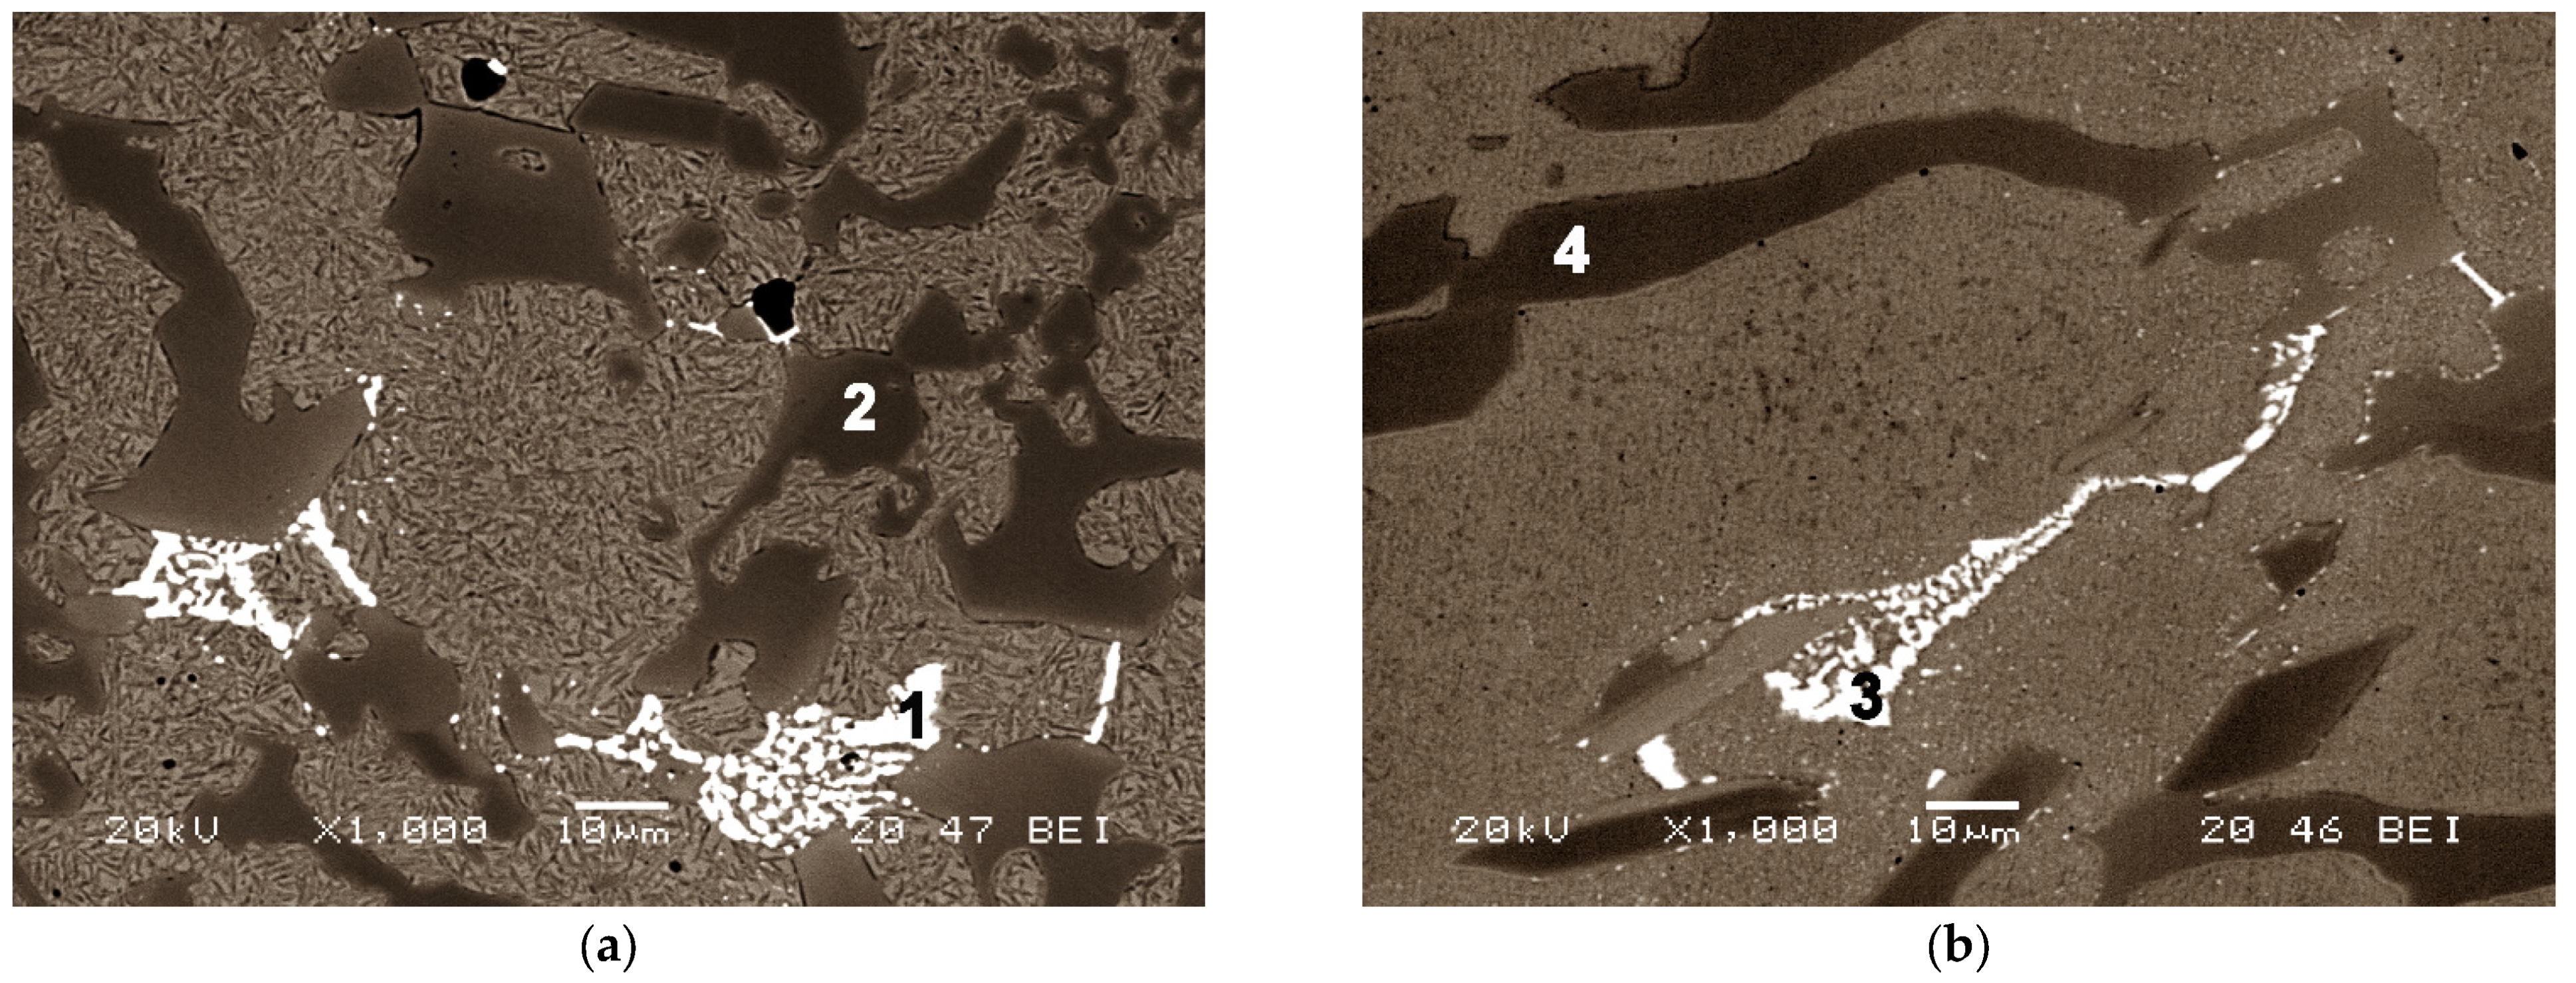
| Spectrum | C | Cr | Fe | Mo |
|---|---|---|---|---|
| 1 | 45.24 | 4.88 | 23.70 | 26.18 |
| 2 | 34.27 | 39.12 | 26.61 | - |
| 3 | 40.62 | 11.51 | 24.18 | 23.69 |
| 4 | 31.56 | 40.43 | 28.01 | - |
Publisher’s Note: MDPI stays neutral with regard to jurisdictional claims in published maps and institutional affiliations. |
© 2021 by the authors. Licensee MDPI, Basel, Switzerland. This article is an open access article distributed under the terms and conditions of the Creative Commons Attribution (CC BY) license (https://creativecommons.org/licenses/by/4.0/).
Share and Cite
González-Pociño, A.; Asensio-Lozano, J.; Álvarez-Antolín, F.; García-Diez, A. Improvement of Impact Toughness and Abrasion Resistance of a 3C-25Cr-0.5Mo Alloy Using a Design of Experiment Statistical Technique: Microstructural Correlations after Heat Treatments. Metals 2021, 11, 595. https://doi.org/10.3390/met11040595
González-Pociño A, Asensio-Lozano J, Álvarez-Antolín F, García-Diez A. Improvement of Impact Toughness and Abrasion Resistance of a 3C-25Cr-0.5Mo Alloy Using a Design of Experiment Statistical Technique: Microstructural Correlations after Heat Treatments. Metals. 2021; 11(4):595. https://doi.org/10.3390/met11040595
Chicago/Turabian StyleGonzález-Pociño, Alejandro, Juan Asensio-Lozano, Florentino Álvarez-Antolín, and Ana García-Diez. 2021. "Improvement of Impact Toughness and Abrasion Resistance of a 3C-25Cr-0.5Mo Alloy Using a Design of Experiment Statistical Technique: Microstructural Correlations after Heat Treatments" Metals 11, no. 4: 595. https://doi.org/10.3390/met11040595