Article

Effect of Pre-Stretching on Residual Stresses and Microstructures of Inconel 718 Superalloy

School of Materials Science and Engineering, Hunan University, Changsha 410082, China
*
Author to whom correspondence should be addressed.
Metals 2021, 11(4), 614; https://doi.org/10.3390/met11040614
Submission received: 16 March 2021 / Revised: 31 March 2021 / Accepted: 2 April 2021 / Published: 9 April 2021

Abstract

:
The residual stress generated in a superalloy during heat treatment affects the subsequent processing of the workpiece and may even adversely affect its performance. This paper investigates the effects of pre-stretching (in the range from 0% to 9%) before aging treatment on residual stress generated during quenching process and microstructure of Inconel 718 superalloy. After pre-stretching treatment, the residual stress deriving from quenching process can be well reduced. When the pre-stretch level was 3%, the quenching residual stress reached a maximum reduction of 72%, and the strength increased by 7.1%, while the product of strength and elongation hardly changed. Simultaneously, the microstructures of the pre-stretched specimens are observed by electron back scatter diffraction (EBSD) and transmission electron microscopy (TEM). It was found that the fraction of high-angle grain boundaries in the alloy decreased while that of low-angle grain boundaries increased with increasing pre-stretch level. As the pre-stretch level was further increased to 9%, the proliferating entanglement of internal dislocations in the specimen was intensified, resulting in rod-shaped γ″ precipitates coarsening and volume fraction reduction of precipitates, which further led to a reduction in the product of strength and elongation of material.

1. Introduction

Inconel 718 alloy (IN718) is a nickel-based high-temperature alloy, which has not only good high-temperature oxidation and corrosion resistance, but also high high-temperature strength, creep strength and endurance strength, as well as good fatigue resistance. Due to its excellent mechanical properties, it is widely used in components that operate under high temperatures and has become a key material for a large number of applications in the aerospace, nuclear energy, and petroleum fields [1,2,3,4,5].
In particular, IN718, is a precipitation-strengthened nickel-based superalloy composed of γ matrix, δ phase, carbide, γ ( Ni 3 Nb ) , and γ ( Ni 3 ( Al ,   Ti ,   Nb ) . Among them, the δ   ( Ni 3 Nb ) phase is mainly precipitated at the grain boundary, controls the grain size of the superalloy, and hinders the movement of dislocations [6,7]. The main strengthening phase γ   ( Ni 3 Nb ,   DO 22 ) is a metastable phase with a body-centered tetragonal ordered structure, which is dispersed and coherently precipitated in the matrix in the form of a disc. The amount of secondary strengthening phases γ   ( Ni 3   ( Al ,   Ti ,   Nb ) ,   LI 2 ) is inferior to that of γ phases, which are dispersed in a spherical shape and play a role in the strengthening of the alloy.
In industrial applications, in order to provide the IN718 parts with appropriate strength, one of the commonly used heat treatment methods is followed, which is solution treatment at a temperature range of 926 to 1010 °C, followed by rapid cooling (i.e., water quenching). For aeroengine or energy industry applications, the final forging stage of IN718 usually takes place at 980 °C, which is just below the δ solvus temperature, followed by water quenching. Selecting this temperature is imperative to control the grain size through grain boundary pinning by the existing δ -phase at the grain boundaries [8,9]. Water quenching from the solution treatment temperature is used to control the size and distribution of γ for the subsequent age hardening heat treatments. The growth rate and volume fraction of the major age hardening phase (i.e., γ ) depend strongly on the cooling rate from the solution treatment temperature (i.e., 980 °C), since a faster cooling rate results in the faster nucleation and growth of γ [10]. However, water quenching can lead to residual stress generation of significant magnitudes [11,12]. During quenching, due to the surface layer of the specimen being in direct contact with the quenching medium, the cooling rate of the outer surface is faster than that of the core, which results in a gradient of tensile and compressive residual stress. Staron et al. [13] and Dye et al. [14] characterized the compressive residual stress on the surface of IN718 alloy after quenching by the neutron diffraction method and a finite element model at around 440–500 MPa. It was found that the size and shape have little effect on the distribution of residual stress on the specimen surface. In addition, the residual stress generated in a part by quenching can introduce micro-cracks and local yield, affecting its mechanical properties [15,16]. First, these will affect the fatigue performance of the components, which can be beneficial but also harmful. More specifically, the presence of a residual compressive stress field will help improve the fatigue life of a component and delay the initiation and propagation of cracks [17]. On the other hand, the presence of residual tensile stress will facilitate crack initiation and crack growth rate acceleration, which should be avoided [18,19,20,21]. Second, since material removal can cause the relaxation of residual stress, excessive residual stress can usually cause deformation and deviation of the structure geometric from its design in subsequent processing stages. So far, some studies have focused on the reduction of residual stress. Li et al. [22] found that cryogenic treatment not only effects the mechanical properties and microstructure of IN718 alloy but also has a great influence on the residual stress of the alloy. Aba-Perea et al. [11] studied the evolution of residual stress during annealing treatment (at 750 °C for 8 h). The measurements revealed that most stress relaxation occurs during the heating stage as a result of a combination of plasticity and early-stage creep relaxation. Even if the subsequent heat treatments are performed after quenching to eliminate the stress through creep deformation [23], the residual stress field will be difficult to relax entirely. Nevertheless, if the residual stress can be reduced before mechanical processing, its impact on subsequent processing deformation will be effectively decreased.
The purpose of this study is to reduce the residual stress caused by water quenching through pre-stretching to facilitate subsequent machining. When the amount of pre-stretch is appropriate, the original residual stress inside the material will be reduced. However, as the strain applied to the material exceeds the critical strain, slip lines will be produced on the material surface [24] and new residual stress will be generated simultaneously. This study aims to achieve the maximum residual stress reduction without affecting the static mechanical properties of parts, providing guidance for the control of residual stress in IN718 superalloy.

2. Basic Hypothesis

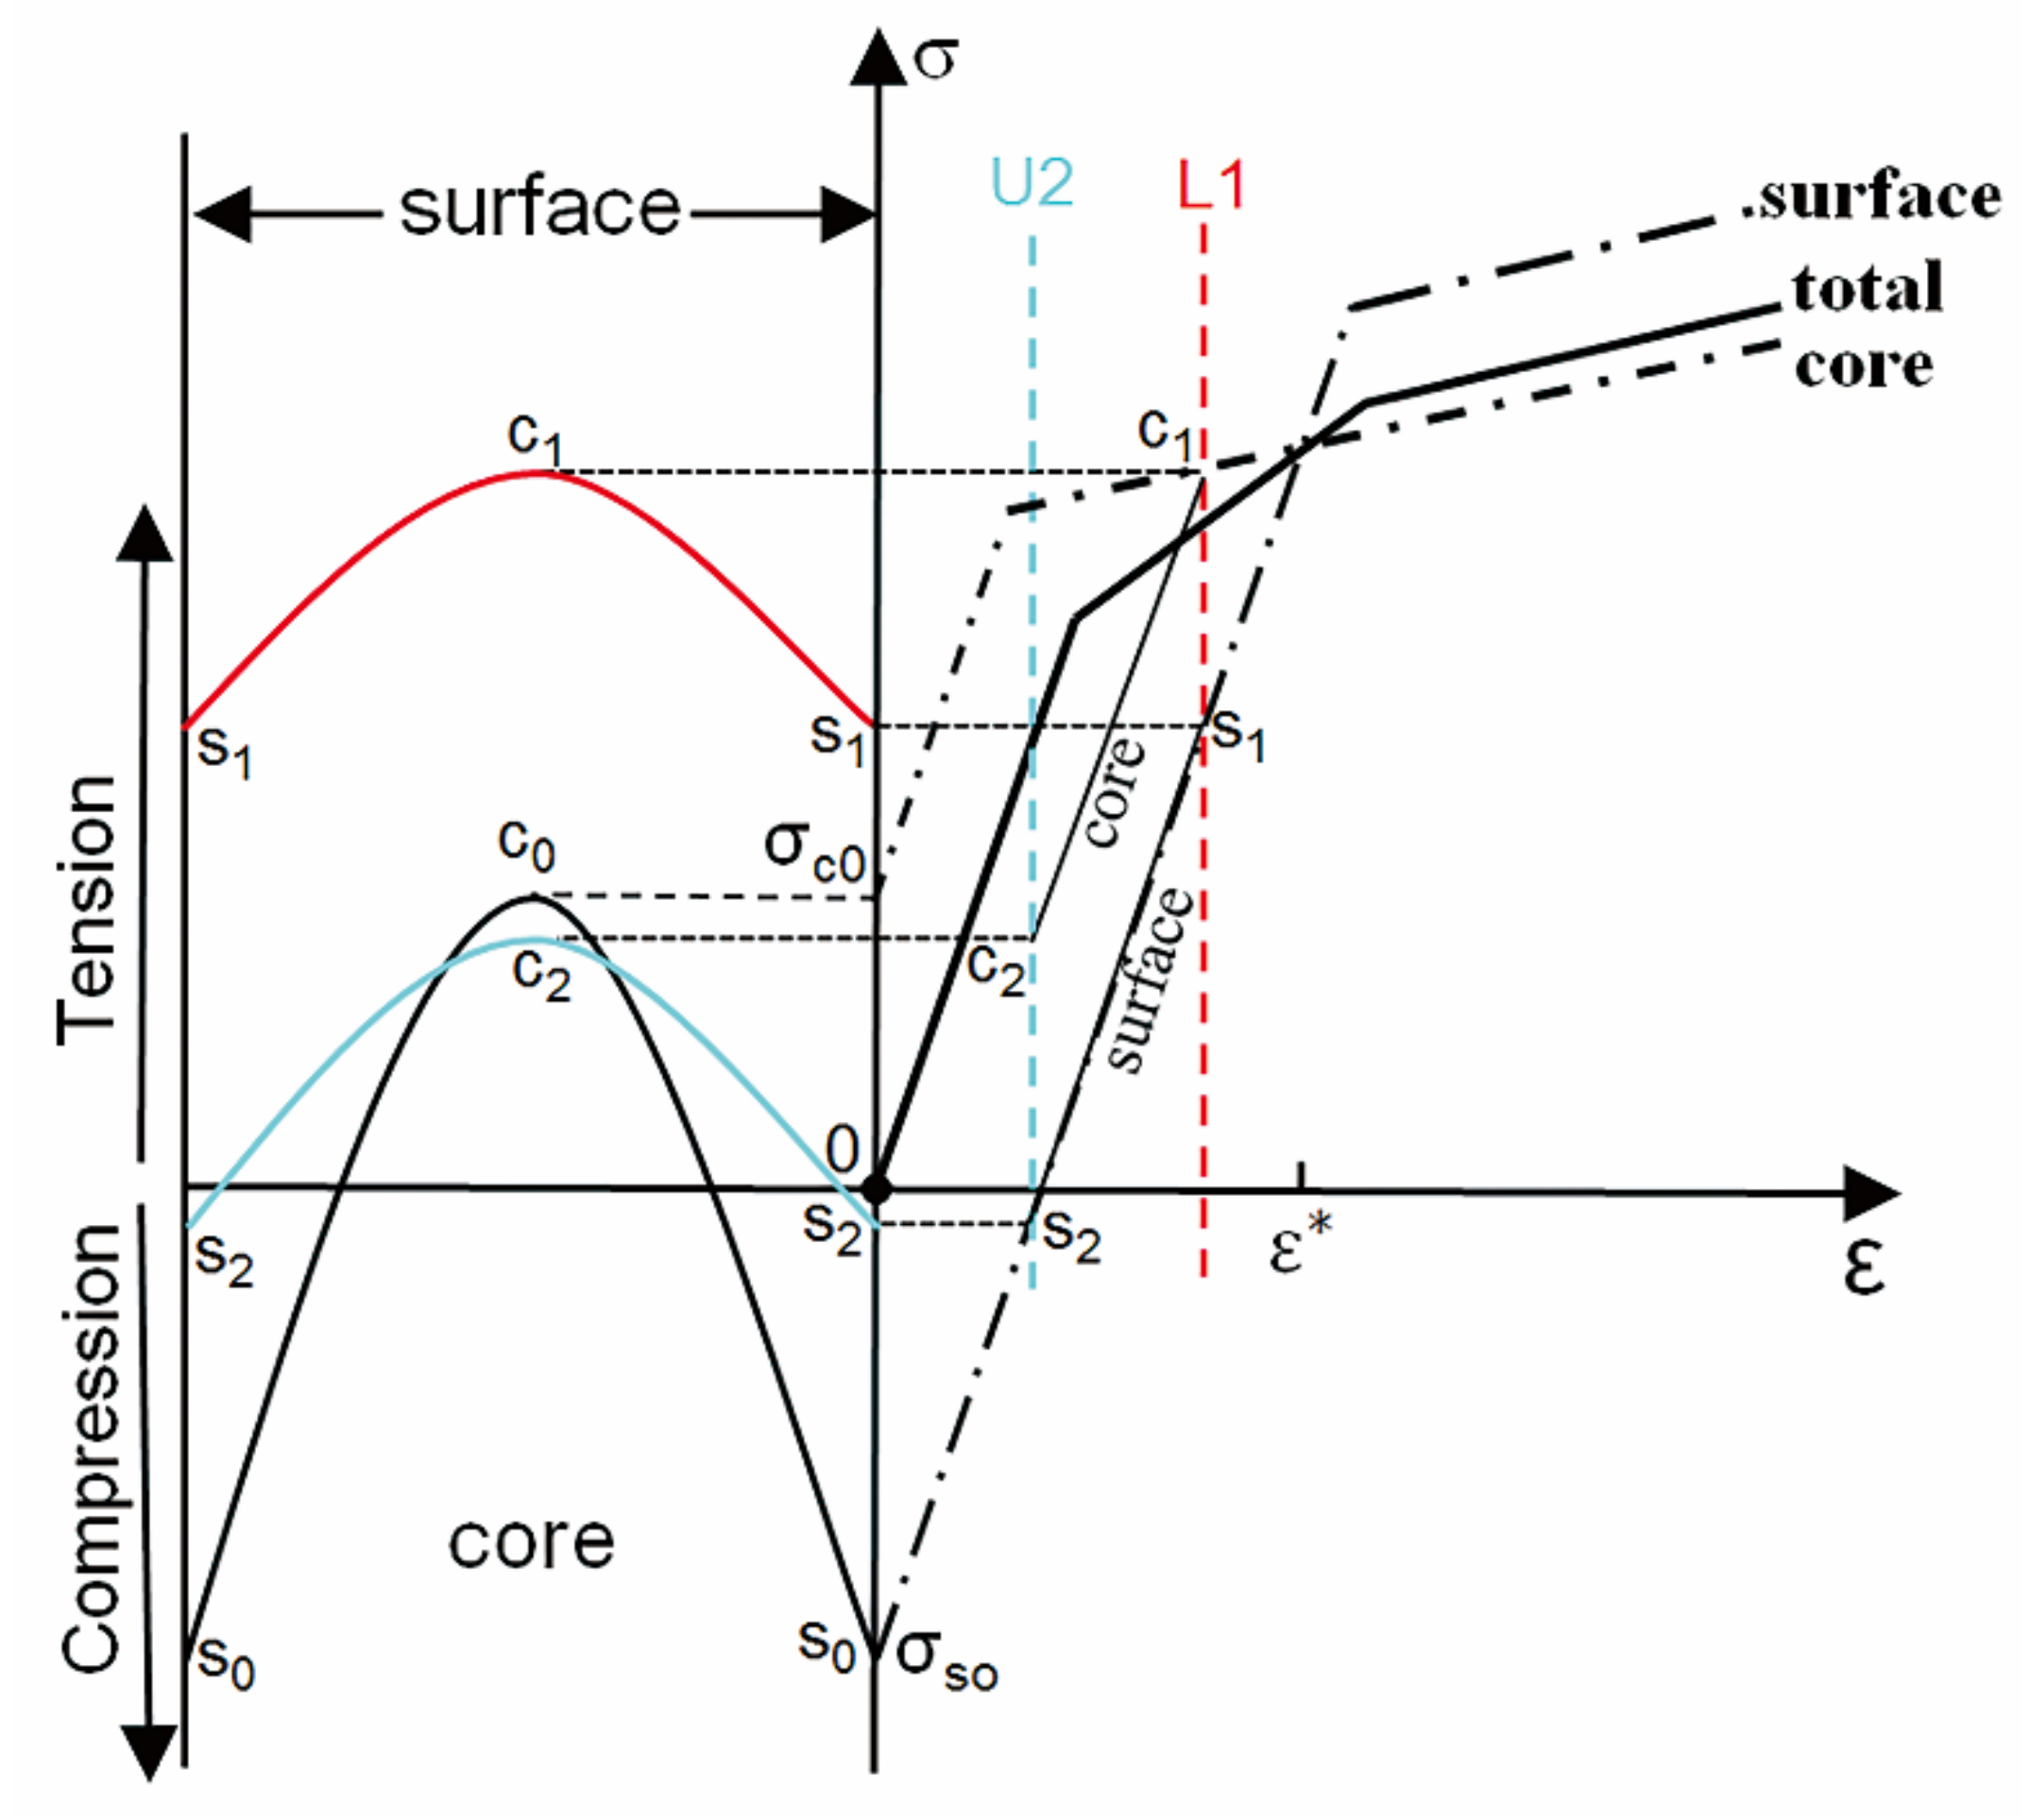
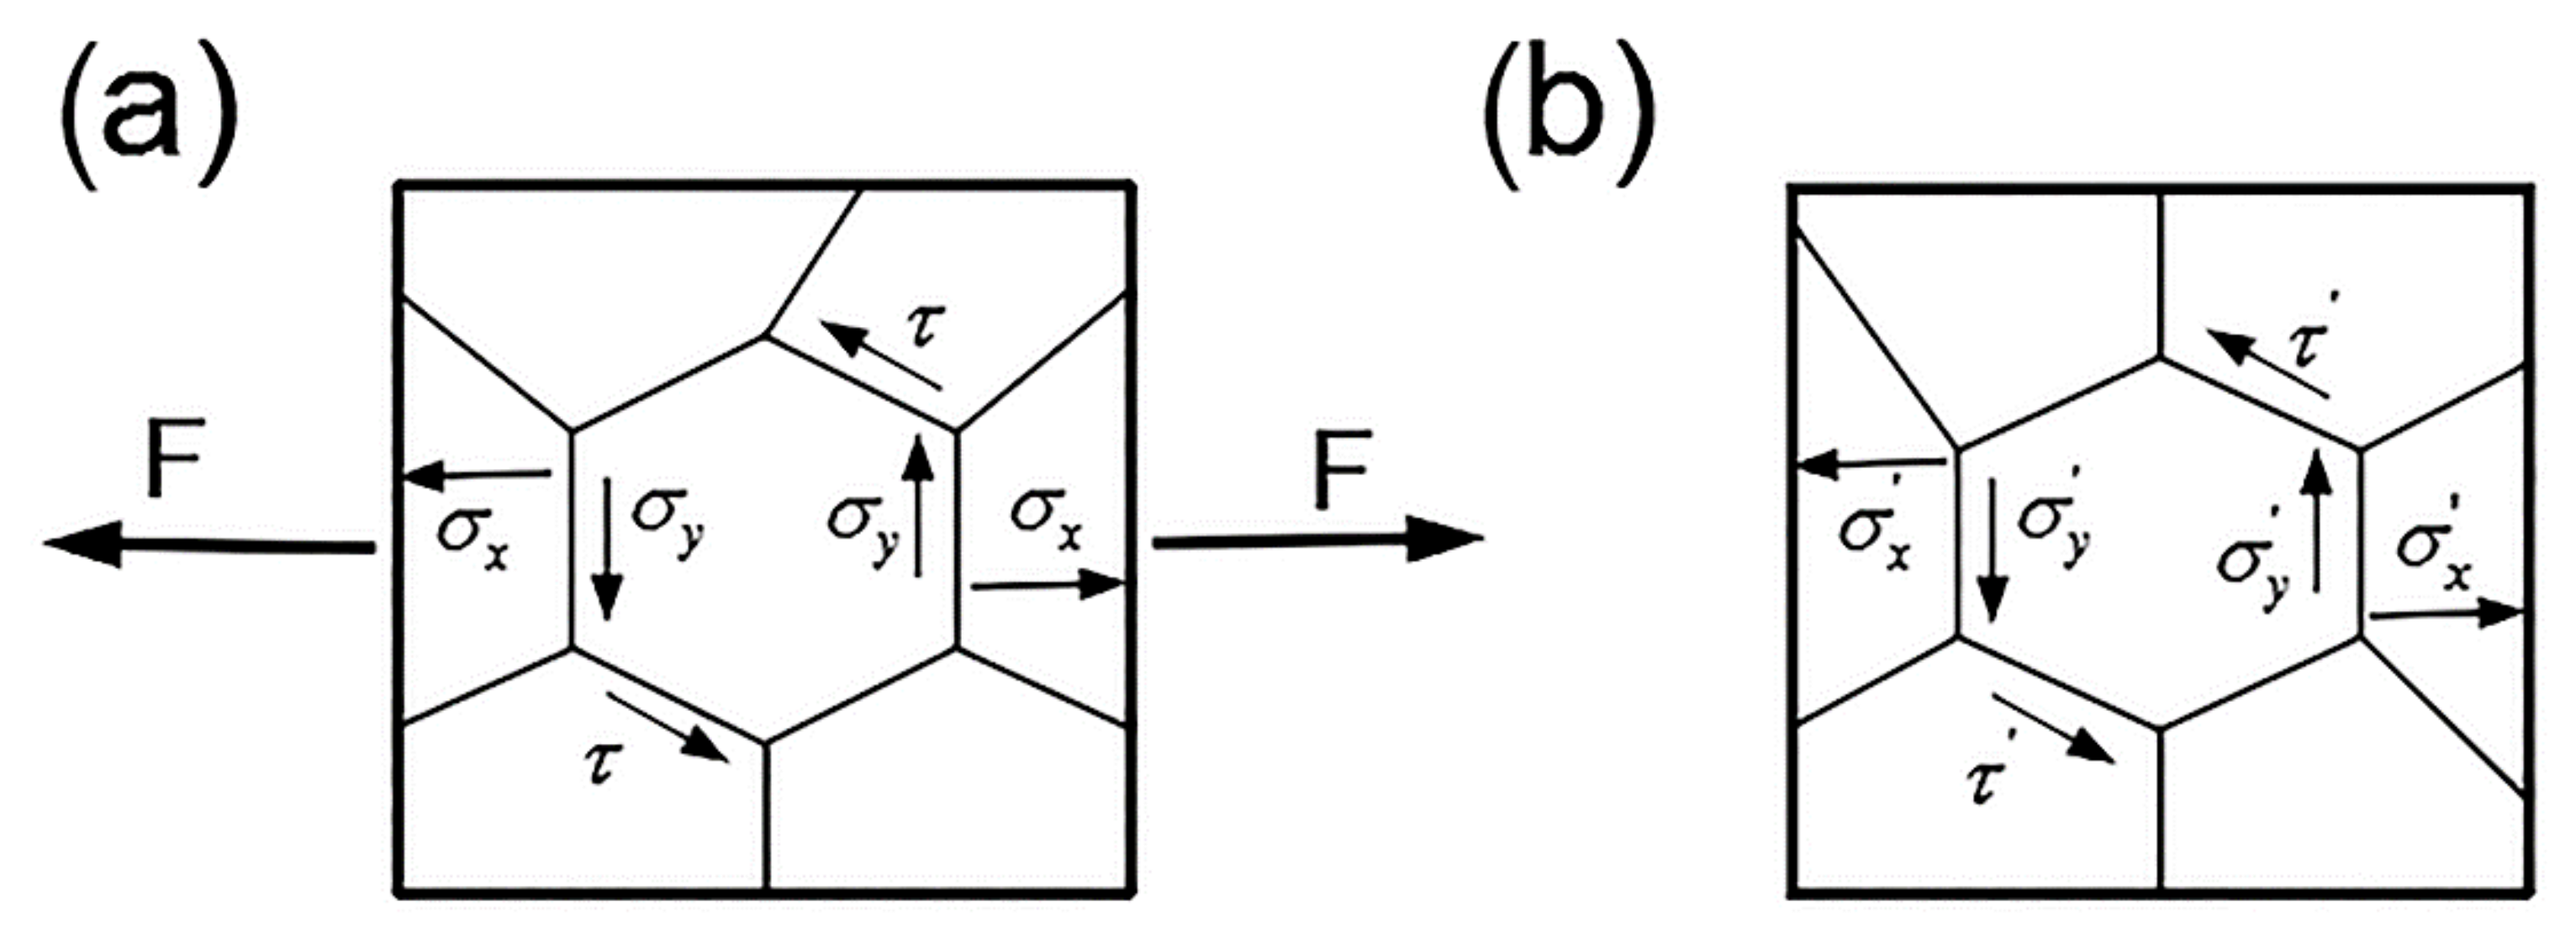
2.1. General Mechanical Model of the Stretching Process

From the macro-mechanical perspective, the main factors affecting the residual stress of the pre-stretched plate are the original residual stress, the amount of stretch, and the mechanical properties of the plate. Mechanical relaxation depends on the level of the initial residual stress along the plate thickness and the unevenness of the mechanical properties [25,26]. During quenching, the surface layer of the plate is in direct contact with the quenching medium. As a result, its plastic deformation is the most severe, which leads to the strength and hardness of the plate surface being higher than those in its core ( σ S s   >   σ S c ) [27]. In the elastic deformation stage, the internal stress of the plate is independent of the strain path. Therefore, an elastic constitutive model can be used to directly determine the stress from the strain state. As for the deformation during stretching, the stress-strain state change diagram is illustrated in Figure 1.
Initially, when the specimen is not loaded, the residual stress on its surface is σ s 0 , and that in its core is σ c 00 . The overall cross-sectional area A of the plate is divided into a surface area A s (surface layer region) and a core area A c . At this point, the internal stress of the plate satisfies the force balance given by Equation (1):
A c σ c 0 + A S σ S 0 = 0 ,
When the specimen is loaded to the L1 state, the stress distribute curve is s 1 c 1 s 1 . The residual stress of the specimen surface along the tensile direction is σ s 1 , and that of the core is σ c 1 . It is assumed that the residual stresses of the surface and the core are constant in the surface area A s and the core area A c , respectively, and both areas are affected by the same total strain. Then, the average residual stress of the plate during the loading stage can be calculated by
σ Tol 1 = 1 A ( A c σ c 1 + A s σ s 1 ) ,
In addition, it is assumed that the axial strain in the tensile direction is uniaxial. When the external load is removed, the specimen shrinks elastically, its final state is U2, and the corresponding stress distribution curve is s 2 c 2 s 2 . After pre-stretching, the final residual stress on the surface and core of the specimen are σ s 2 and σ c 2 , respectively. During the entire stretching stage:
σ c 2 σ s 2 = σ c 1 σ s 1 ,
As a whole, the internal stress of the specimen should satisfy the force balance as given by Equation (4):
A c σ c 2 + A S σ S 2 = 0 ,
By combining Equations (3) and (4), the final surface residual stress distribution of the pre-stretched specimen can be obtained:
σ s 2 = A c A ( σ s 1 σ c 1 ) ,

2.2. Simplified Mechanical Model of the Stretching Process

Under the assumption that the yield strength is constant, the core and surface of the specimen have the same yield point and exhibit an ideal elastoplastic behavior [25]. First, the surface stress, core stress and average total stress of the specimen increase linearly with total strain. According to Hooke’s law, the critical strain for the residual stress relaxation of the specimen can be calculated as:
ε   = 1 E ( σ S Tol + σ s 2 ) ,
where ε is the critical strain for the stress relaxation of the specimen during stretching, E is the elastic modulus, σ S Tol is the yield strength of the entire specimen, and σ s 2 is the surface residual stress after the specimen unloaded during stretched. When the specimen is unloaded below the critical strain, the residual stress will be reduced overall. After reduction, the final residual stress of the specimen is
σ Tol 2 = σ S Tol σ c 2 ,
where σ Tol 2 is the average residual stress of the specimen after unloading, σ S Tol is the yield strength of the entire specimen, and σ c 2 is the residual stress of the core after the specimen has been unloaded.
When the specimen is loaded above the critical strain, it will undergo plastic deformation under a constant yield stress, and after unloading, there will be no residual macroscopic stress in it. Finally, the overall average stress of the specimen will be
σ Tol 2 = σ S Tol = σ S s = σ S c ,
where σ S s and σ S c are the yield strength of the specimen surface layer and core, respectively.

3. Materials and Methods

3.1. Material and Experimental Procedure

In this study, a double vacuum smelting process was conducted to produce IN718 alloy ingots, followed by a high-temperature diffusion annealing process. Finally, the ingots were forged into bar with a diameter of Φ300 mm. Table 1 shows the chemical composition of the materials, while Figure 2 shows the microstructure and composition of the as-received materials. Zeiss AxioCam MRc5 optical microscope (OM) (Carl Zeiss Microscopy Deutschland GmbH, Oberkochen, Germany) and FEI Inspect F50 field emission scanning electron microscope (FE-SEM) (ThermoFisher Scientific, Hillsboro, OR, USA) were used for microstructure observation. The purpose of this experiment was to obtain a plate-shaped plane specimen in order to facilitate the use of an X-ray diffractometer (Proto Manufacturing Ltd., Oldcastle, Canada) to test the residual stress distribution on the specimen surface and reduce the test error. The plate-shaped tensile specimen was prepared from the bar with location at the half radius and the length of tensile specimen was parallel to the longitudinal direction of bar. Finally, the specimen was subjected to solution heat treatment, pre-stretching and aging treatment in sequence.
Figure 3a is a schematic diagram illustrating the specimen dimensions. The sample thickness was 5 mm, and the gauge length was 69 mm. Figure 3b illustrates the shape of the specimen. The specimen was first solution-treated at 970 °C for 1 h, quenched in water at room temperature, and then pre-stretched along the X axis from 0% to 9%. Finally, a standard aging treatment was performed, where all specimens were heated at 720 °C for 8 h, and furnace cooled to 620 °C at a rate of 50 °C/h, at which temperature they were held for 8 h to precipitate the γ and γ strengthening phases, which was followed by air quenching.

3.2. Pre-Stretching and Tensile Test

Pre-stretching and performance tests at a displacement rate of 0.017 mm/s were performed on an Instron-3382 tensile tester (Instron, Norwood, MA, USA). After the specimen was assembled, the different test pieces were stretched at a constant rate, and after reaching the target deformation, they were unloaded. The pre-stretch test was repeated twice for each state. According to the requirements of the standard test methods for tensile testing of metallic materials at room temperature [28], the material was formed into a flat shaped specimen with a gauge length of 8 mm, width of 3 mm and thickness of 3 mm.

3.3. Residual Stress Test

The specimens before and after pre-stretching were tested using a high-speed X-ray diffraction residual stress analyzer manufactured by Proto iXRD (Proto Manufacturing Ltd., Oldcastle, Canada), according to the requirements of the European Union X-ray Diffraction Residual Stress Measurement Standard [29]. When the residual stress on the surface layer of the IN718 alloy was measured, the radiation was Mn-Kα; the wavelength was 2.103 Å; the spot size was Φ2 mm; the X-ray tube voltage and current were, respectively, 25 kV and 5 mA; the diffraction crystal plane was (311); the Bragg angle was at 151.88°; and the number of Psi angles was 9. The detailed residual stress test point location is shown in Figure 3a, and 5 points are measured on each sample.

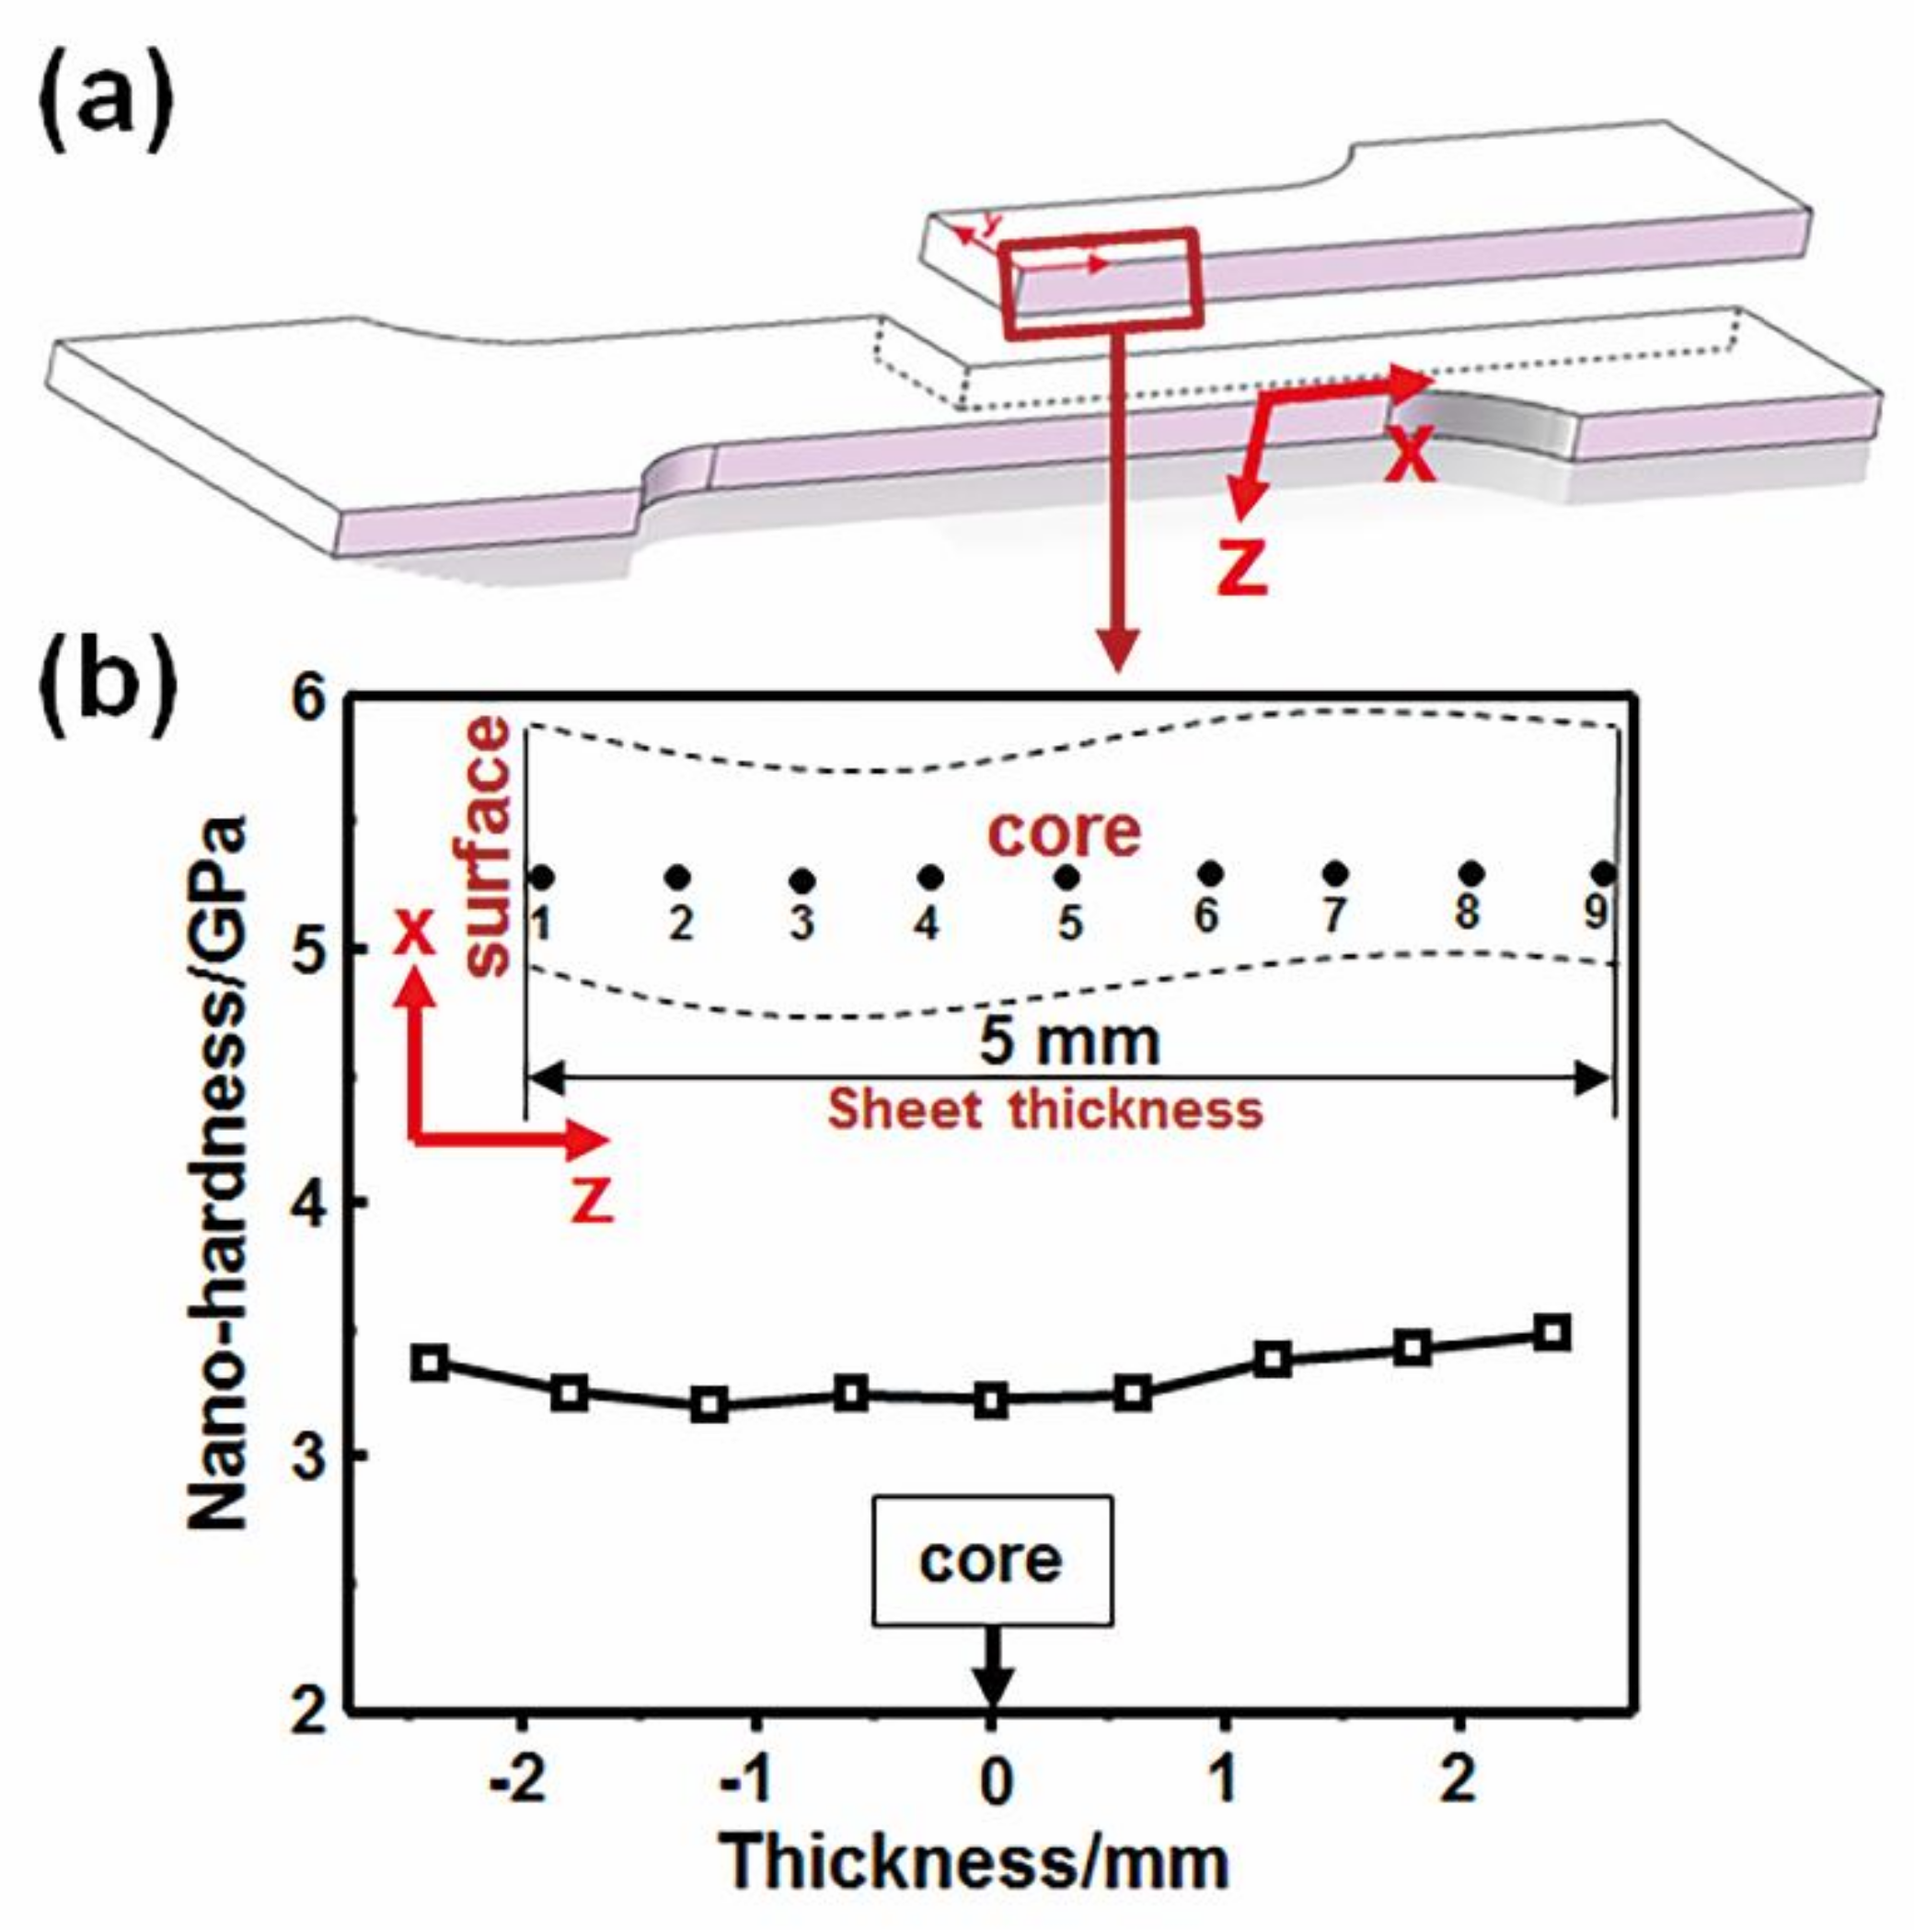
3.4. Nano-Hardness Test

To confirm whether the yield stress was constant or modified during the manufacturing process of the specimen, nano-hardness tests were conducted on the longitudinal section of the sample (indicated as the shadow region in Figure 3b on a UNHT manufactured by CSM in Switzerland (TI-950, UNHT, CMS, Switzerland). In order to reduce the experimental error, the average of the three test results was used as the final test result of each sample.

3.5. Microstructure Characterization

The microstructure of the non-stretched and stretched materials was characterized using electron backscatter diffraction (EBSD). For the EBSD analyses, specimens were cut from the non-stretched and stretched materials along the stretching direction, and then were mechanically ground and polished to a mirror-finish condition. Subsequently, the specimens were electrolytically polished with a solution of 10 vol% perchloric acid and 90 vol% methanol until the outer stress layer was removed. The EBSD maps were acquired using a fully automated HKL-EBSD system (ThermoFisher Scientific, Hillsboro, OR, USA), interfaced to a FEI Quanta-200 field emission (ThermoFisher Scientific, Hillsboro, OR, USA) gun scanning electron microscope (SEM) (ThermoFisher Scientific, Hillsboro, OR, USA), with an accelerating voltage of 20 kV and a 100-µm-diameter aperture. The acquisition time was set to 40 ms and at least 1 frame was captured for each point. The step size was 2 μm, and the low-angle grain boundary range was 2–15°. At least 4 maps were collected per specimen, and in all cases, a minimum of 97% of the scanned areas with a typical size of 205 µm × 205 µm was indexed.
Different specimens, including a non-stretched aged specimen and aged specimens with an initial strain of 9%, were examined using transmission electron microscopy (TEM) (JEM-3010, JEOL, TOKYO, Japan). The specimens were firstly ground to a thickness of 60 μm, punched into disks 3 mm in diameter, and finally milled using the PIPS ion milling machine (Gatan Inc., Pleasanton, CA, USA). Afterwards, electro-polishing was performed at 25 V and −30 °C with a solution of 10 vol% perchloric acid and 90 vol% methanol to prepare the specimens. The specimens were observed with a JEM-3010 scanning electron microscope (JEOL, TOKYO, Japan) at 200 kV. The average lengths of the precipitates in the specimens were determined by measuring 80 randomly selected precipitates in four TEM images of each specimen.

4. Results

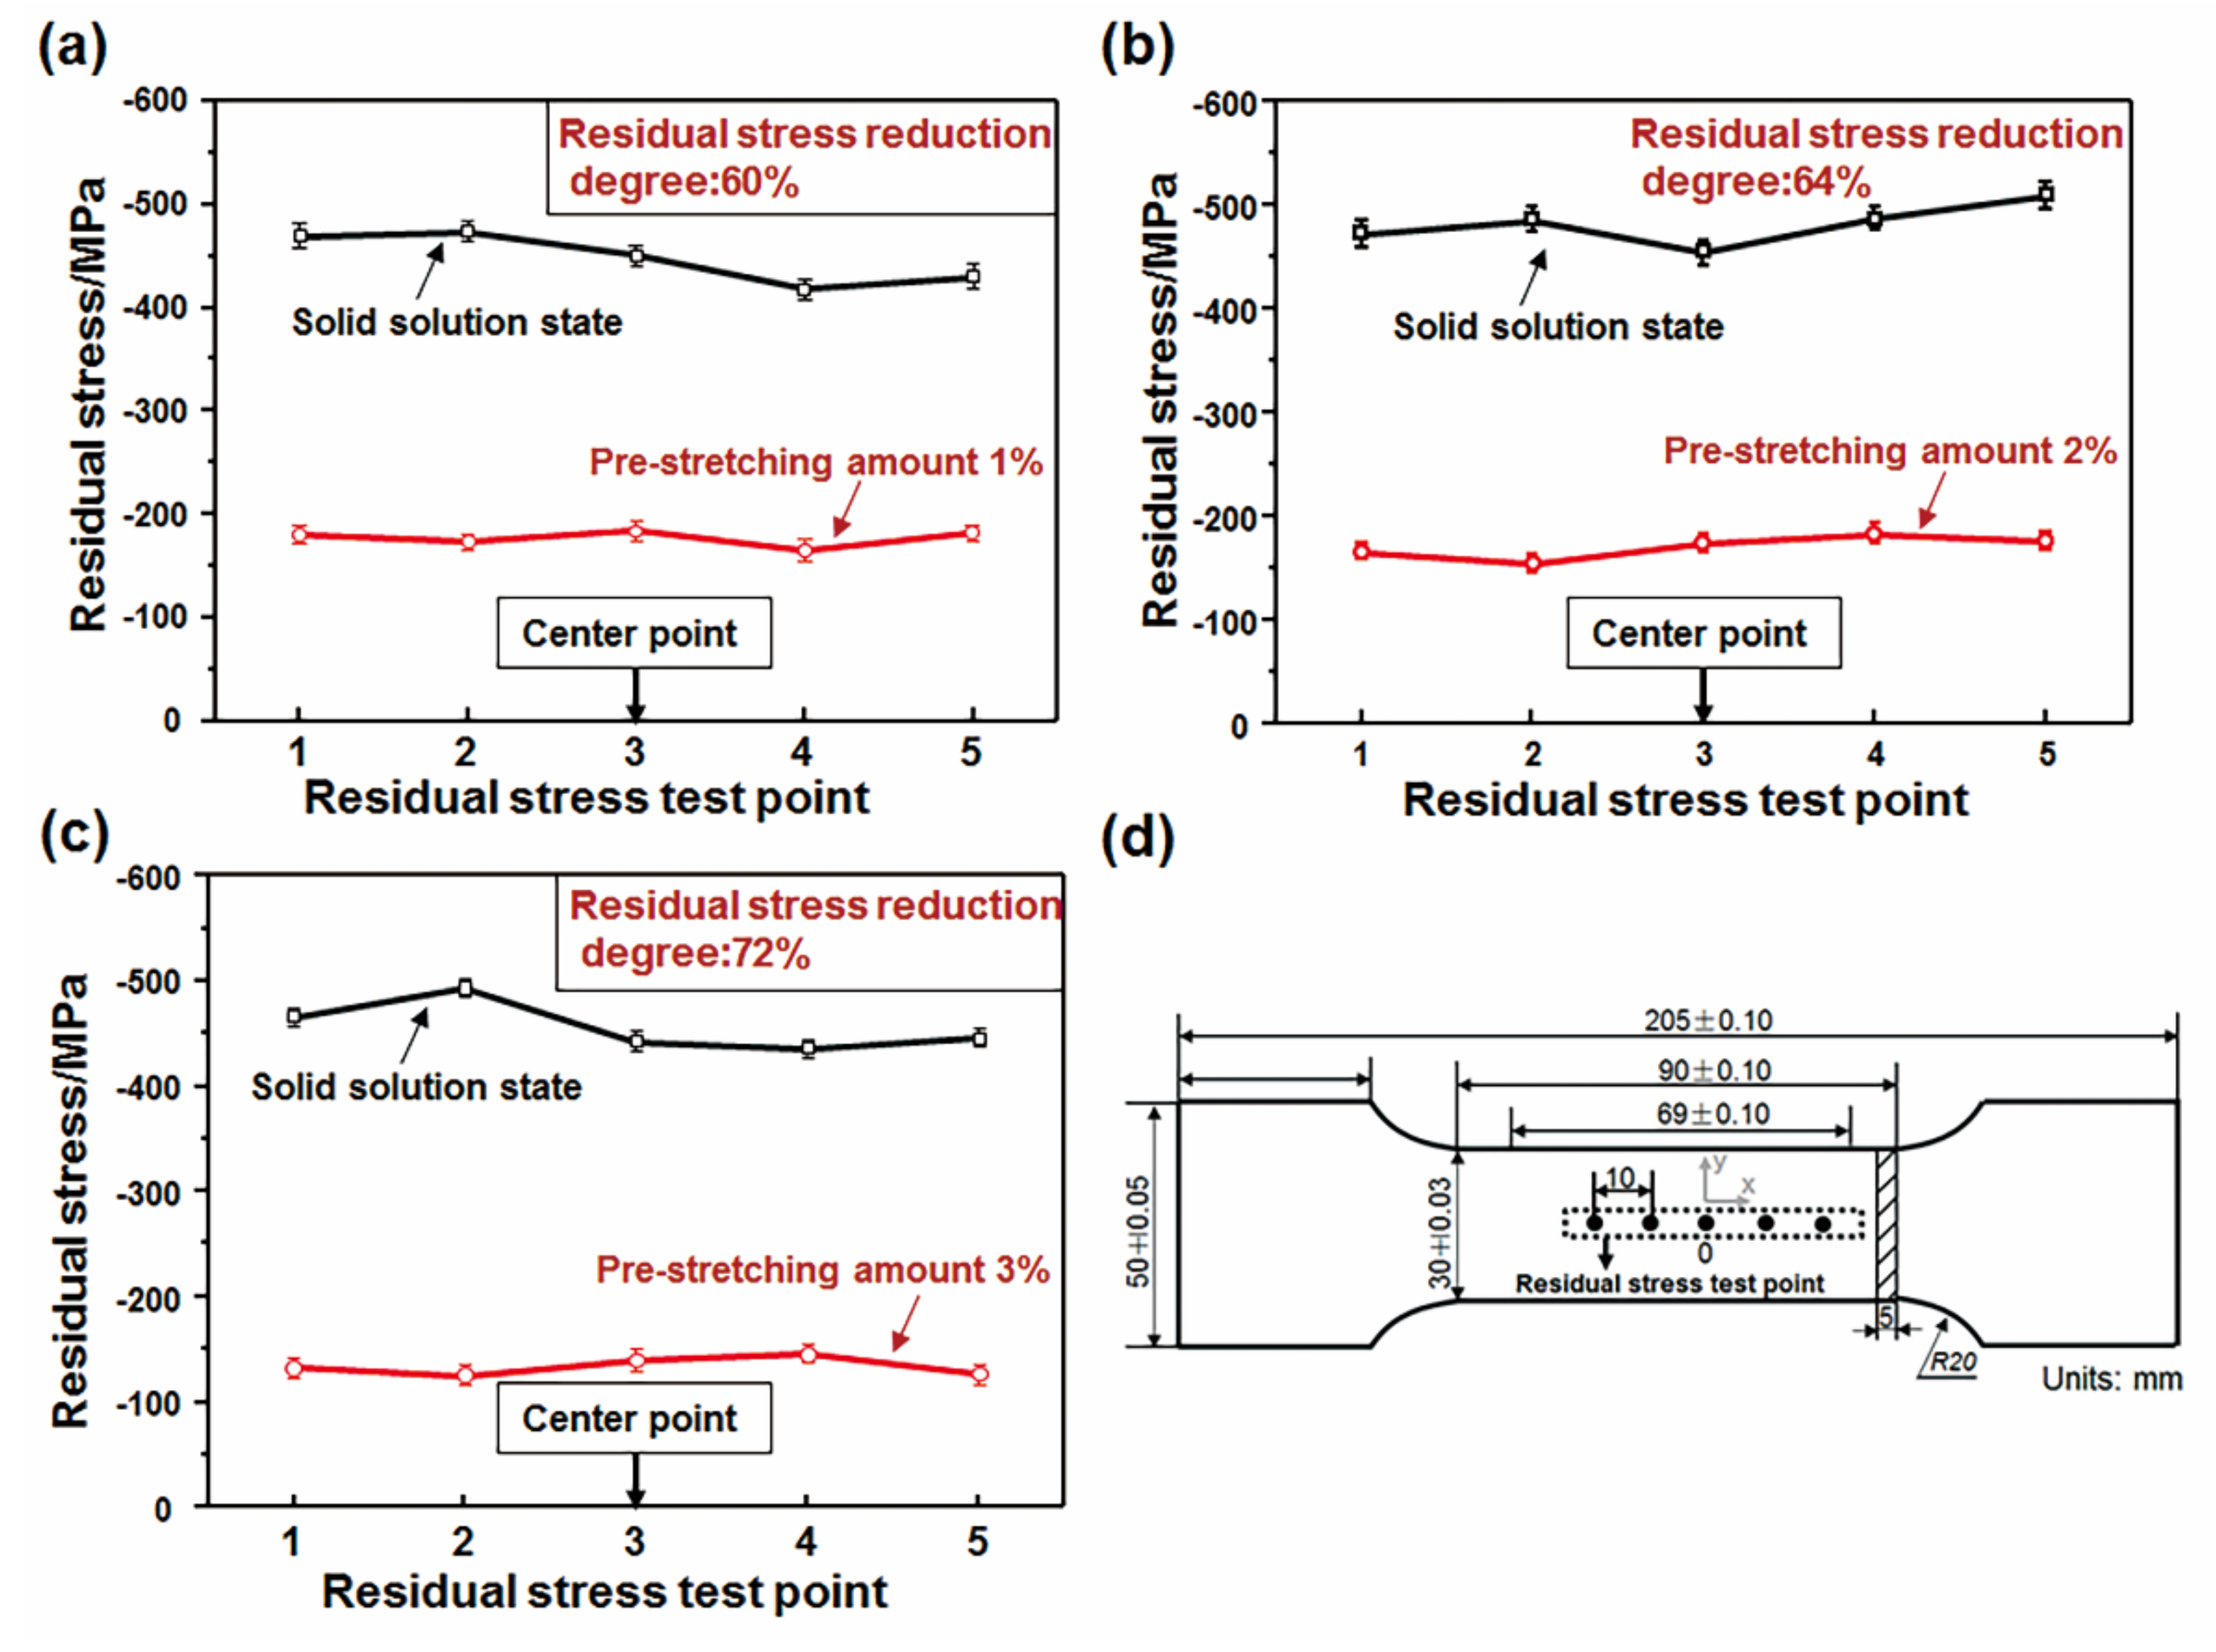
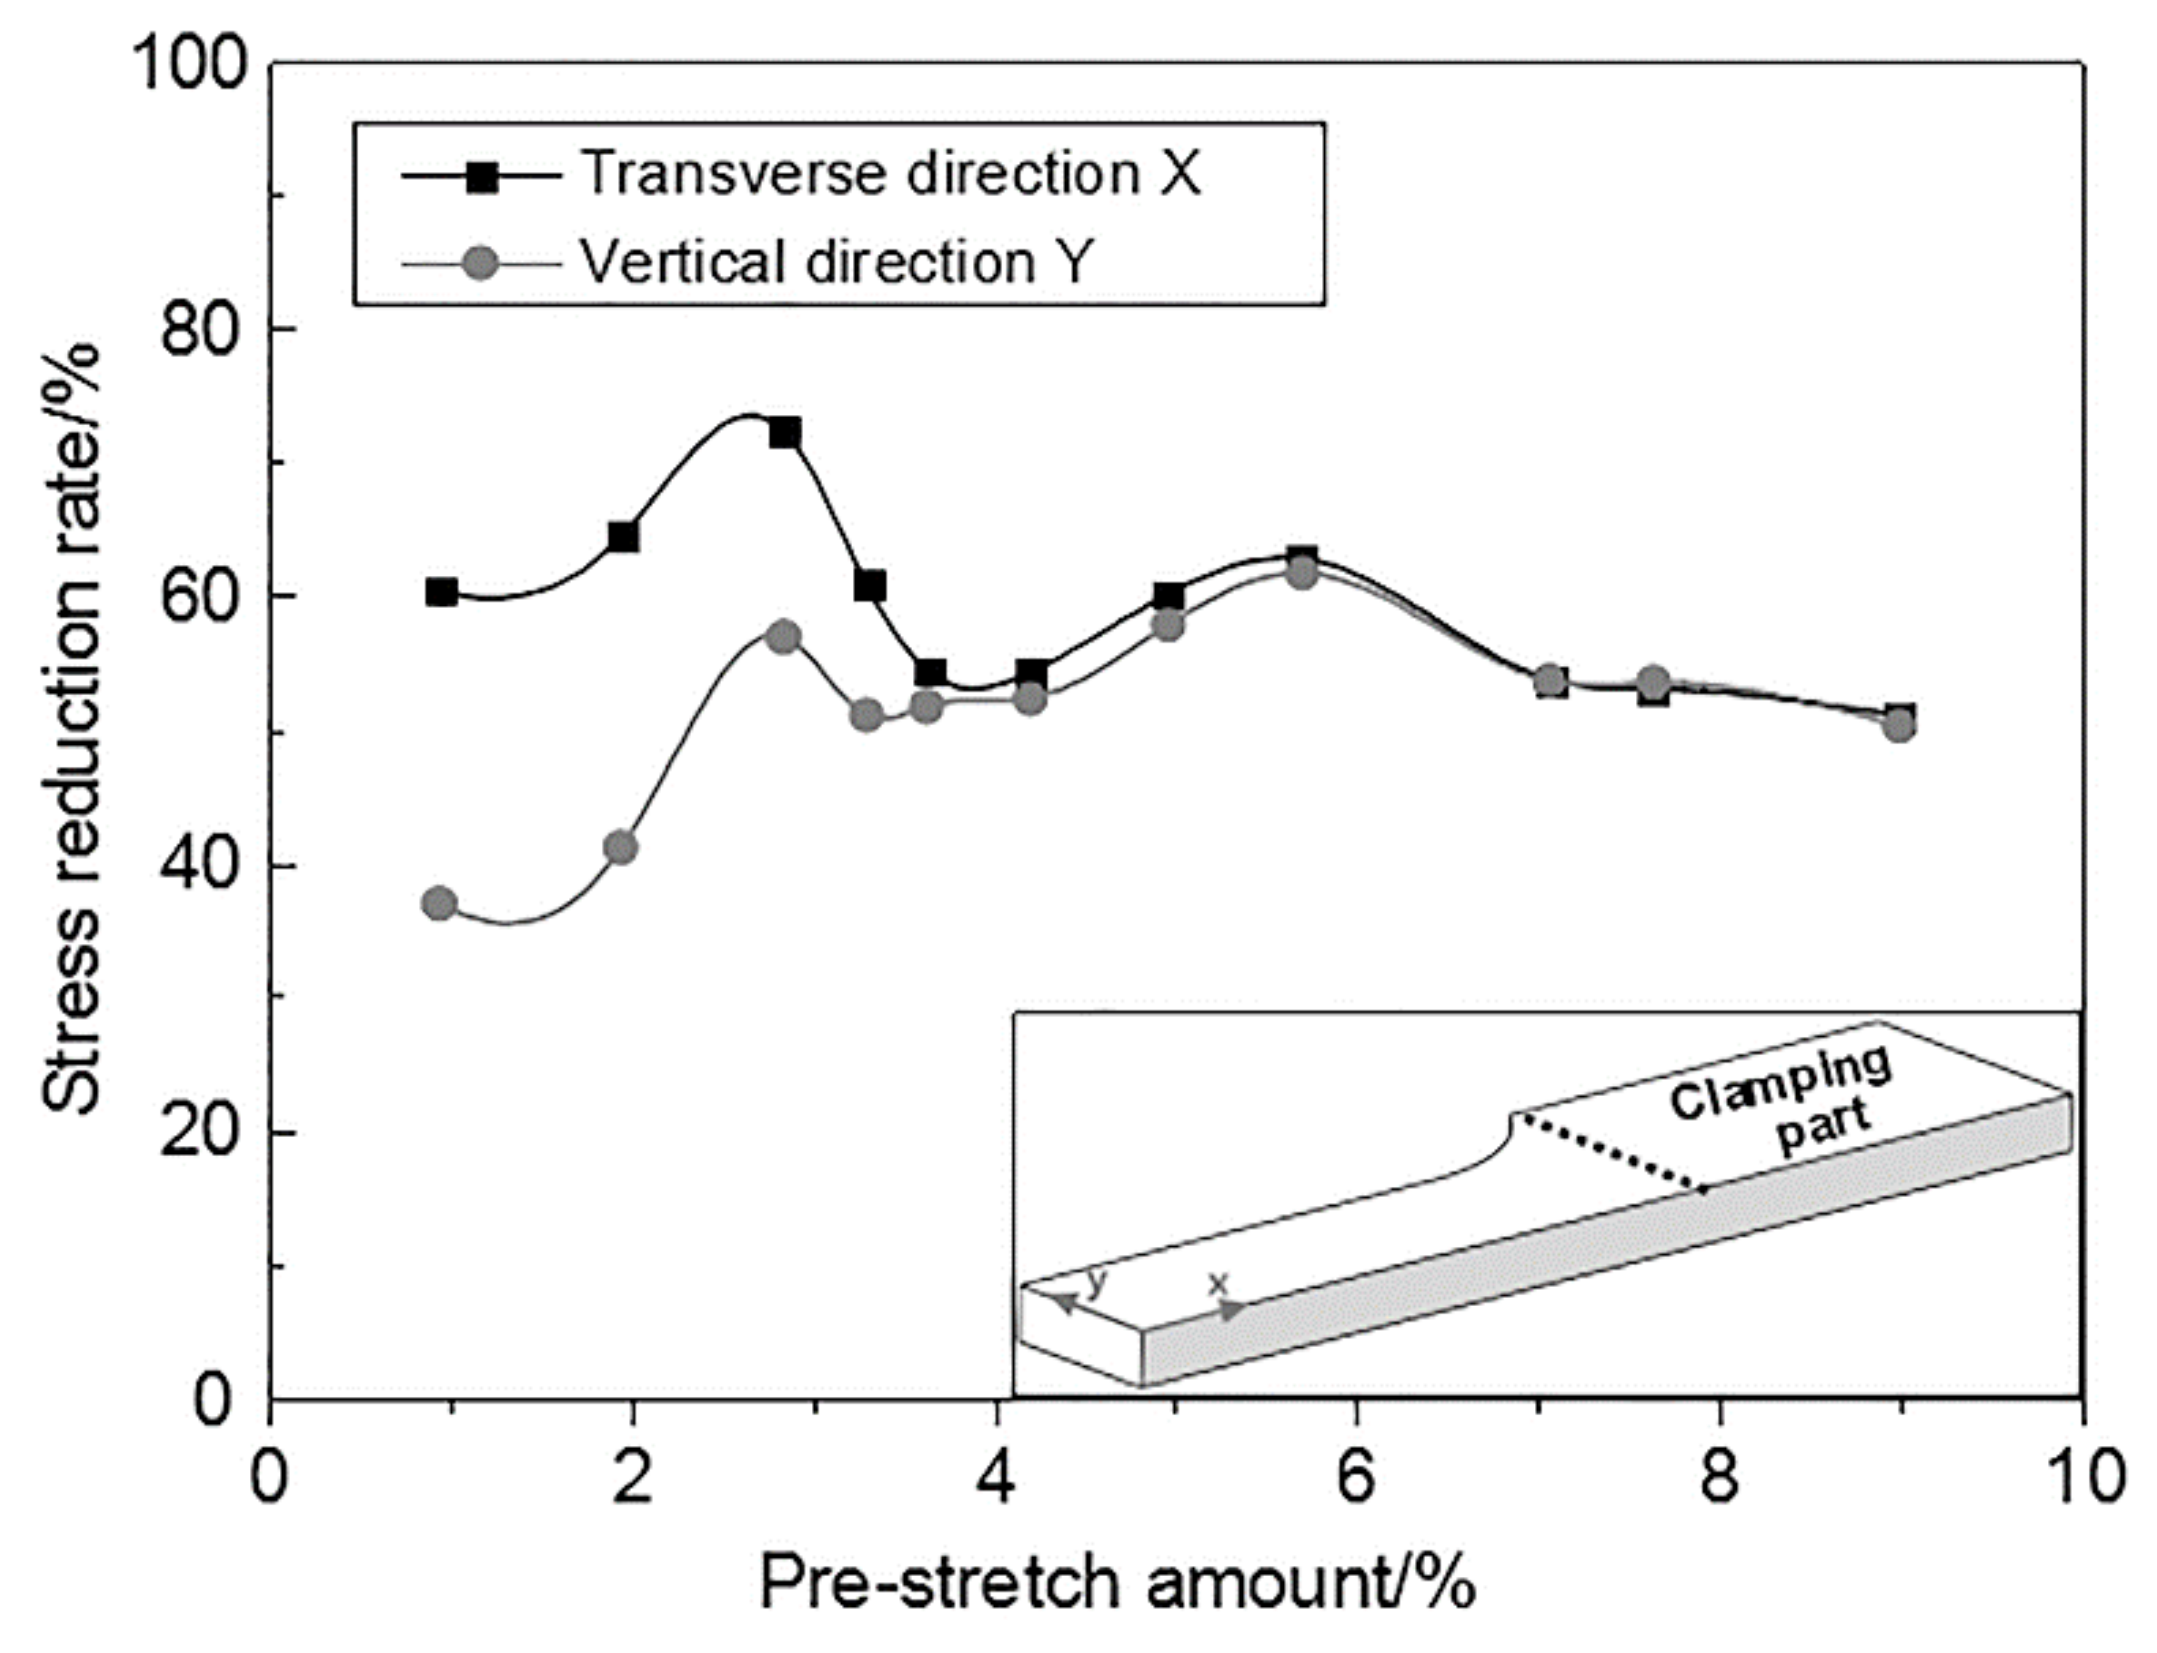
4.1. Residual Stress
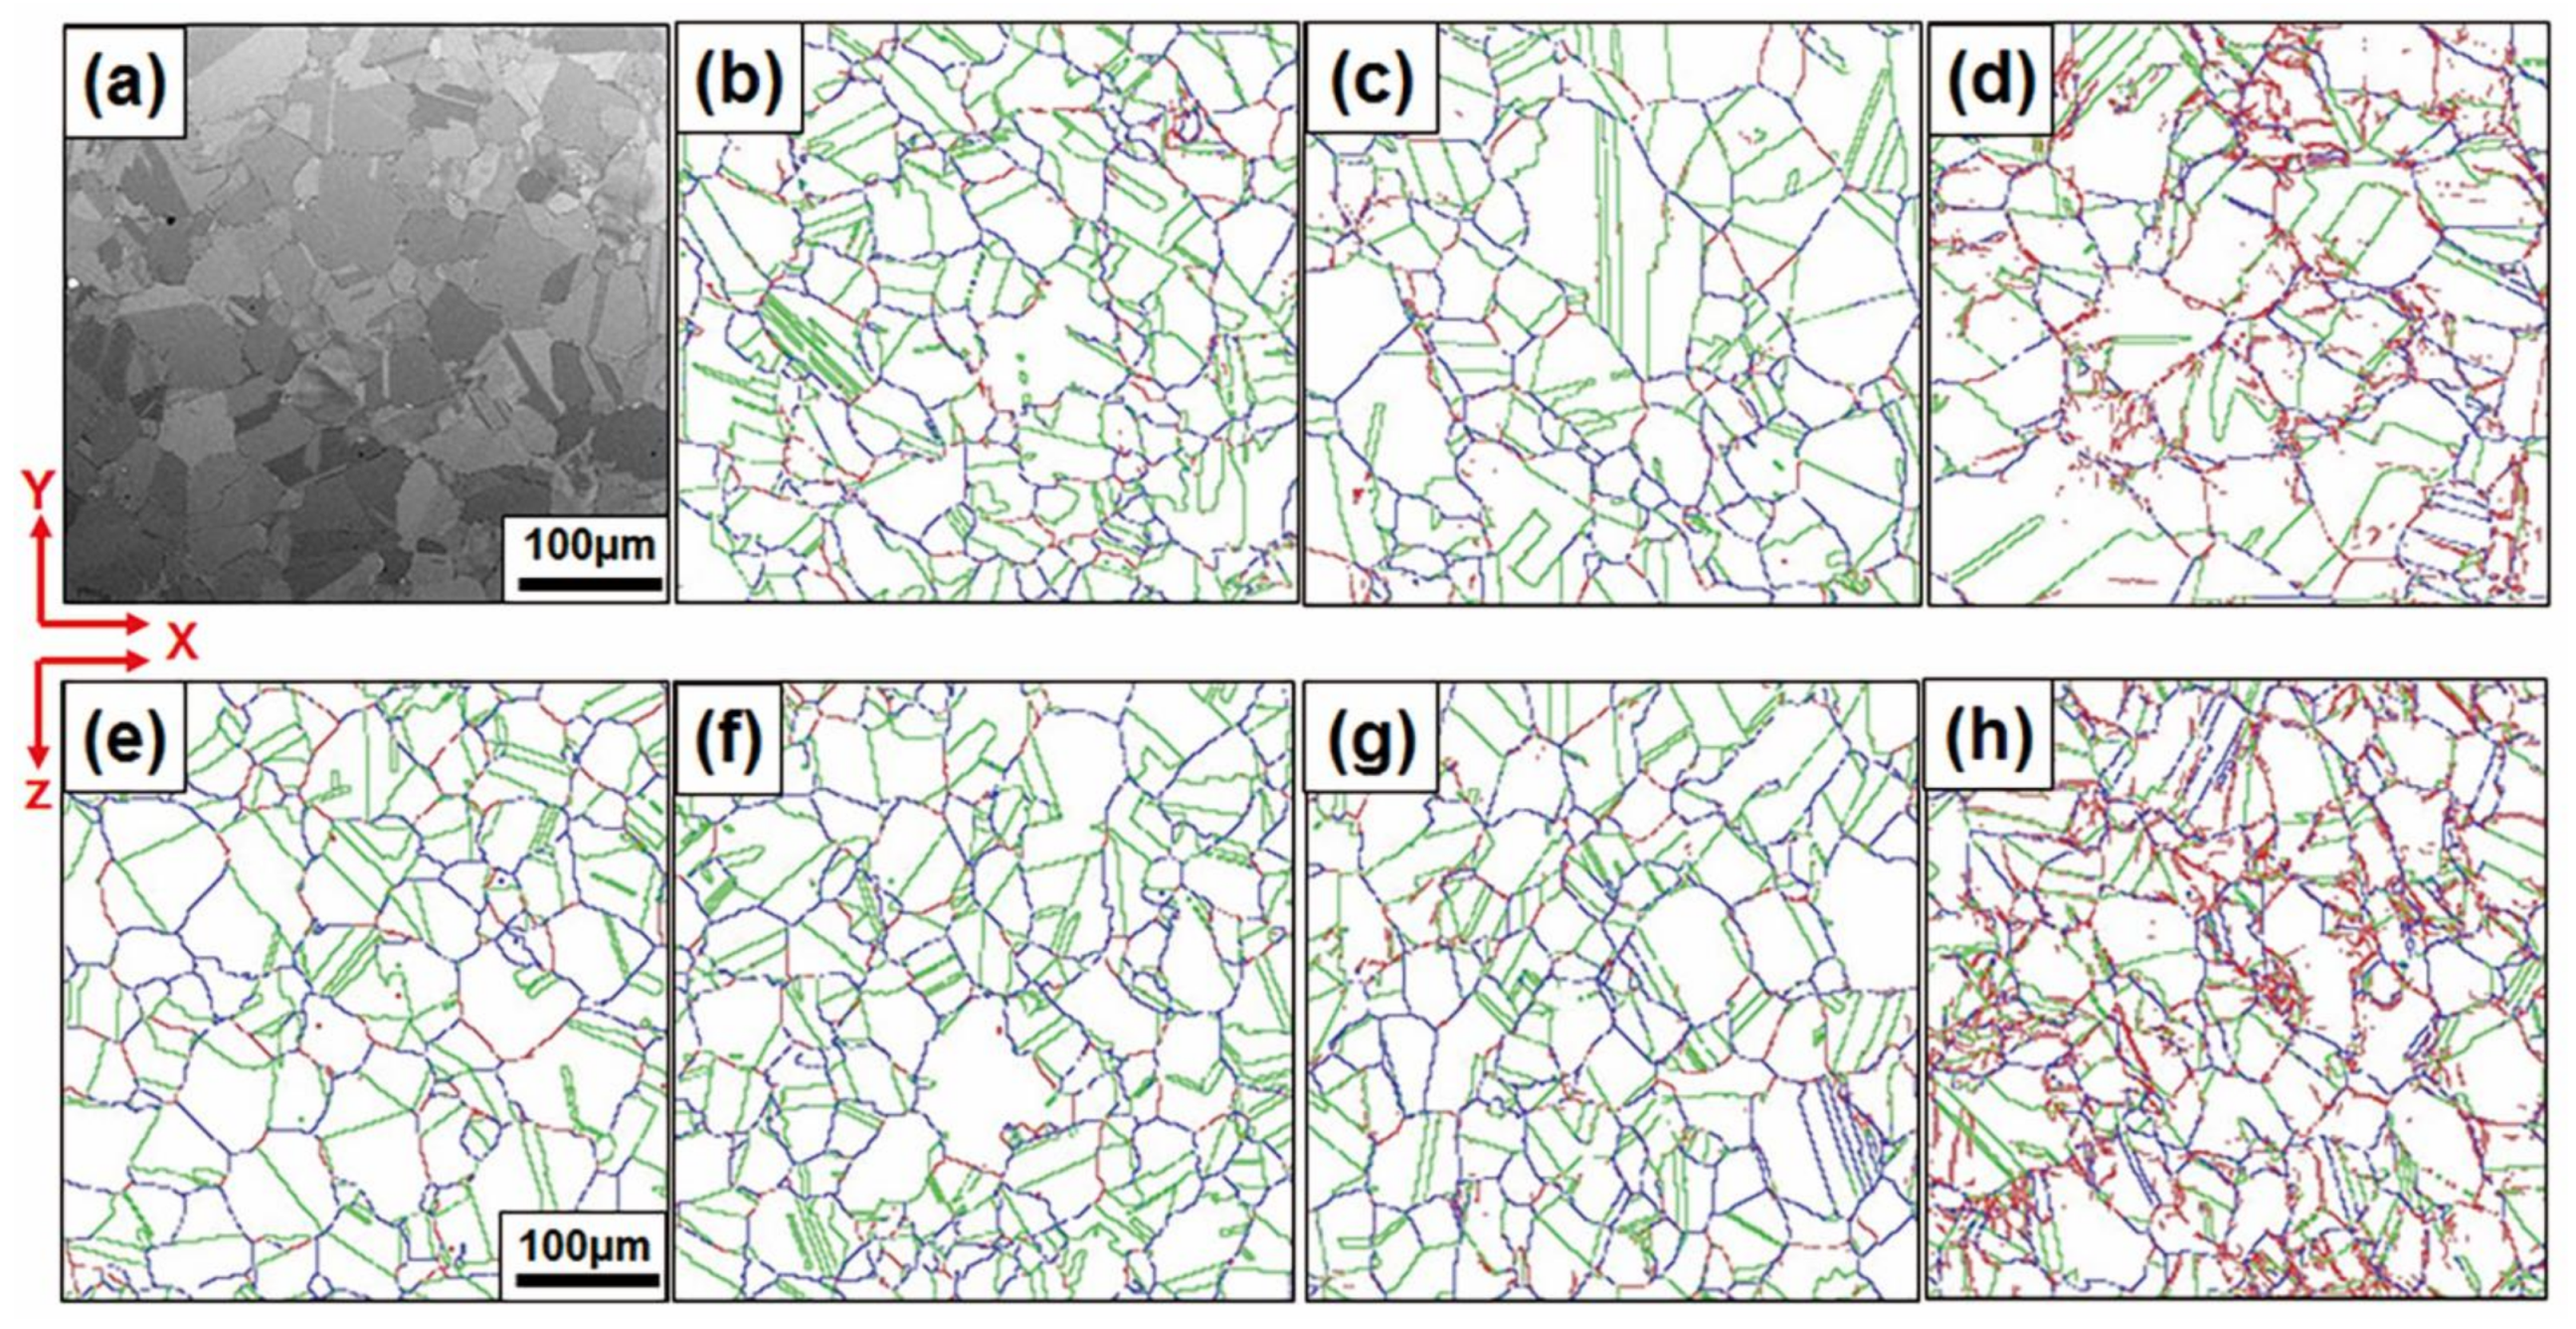
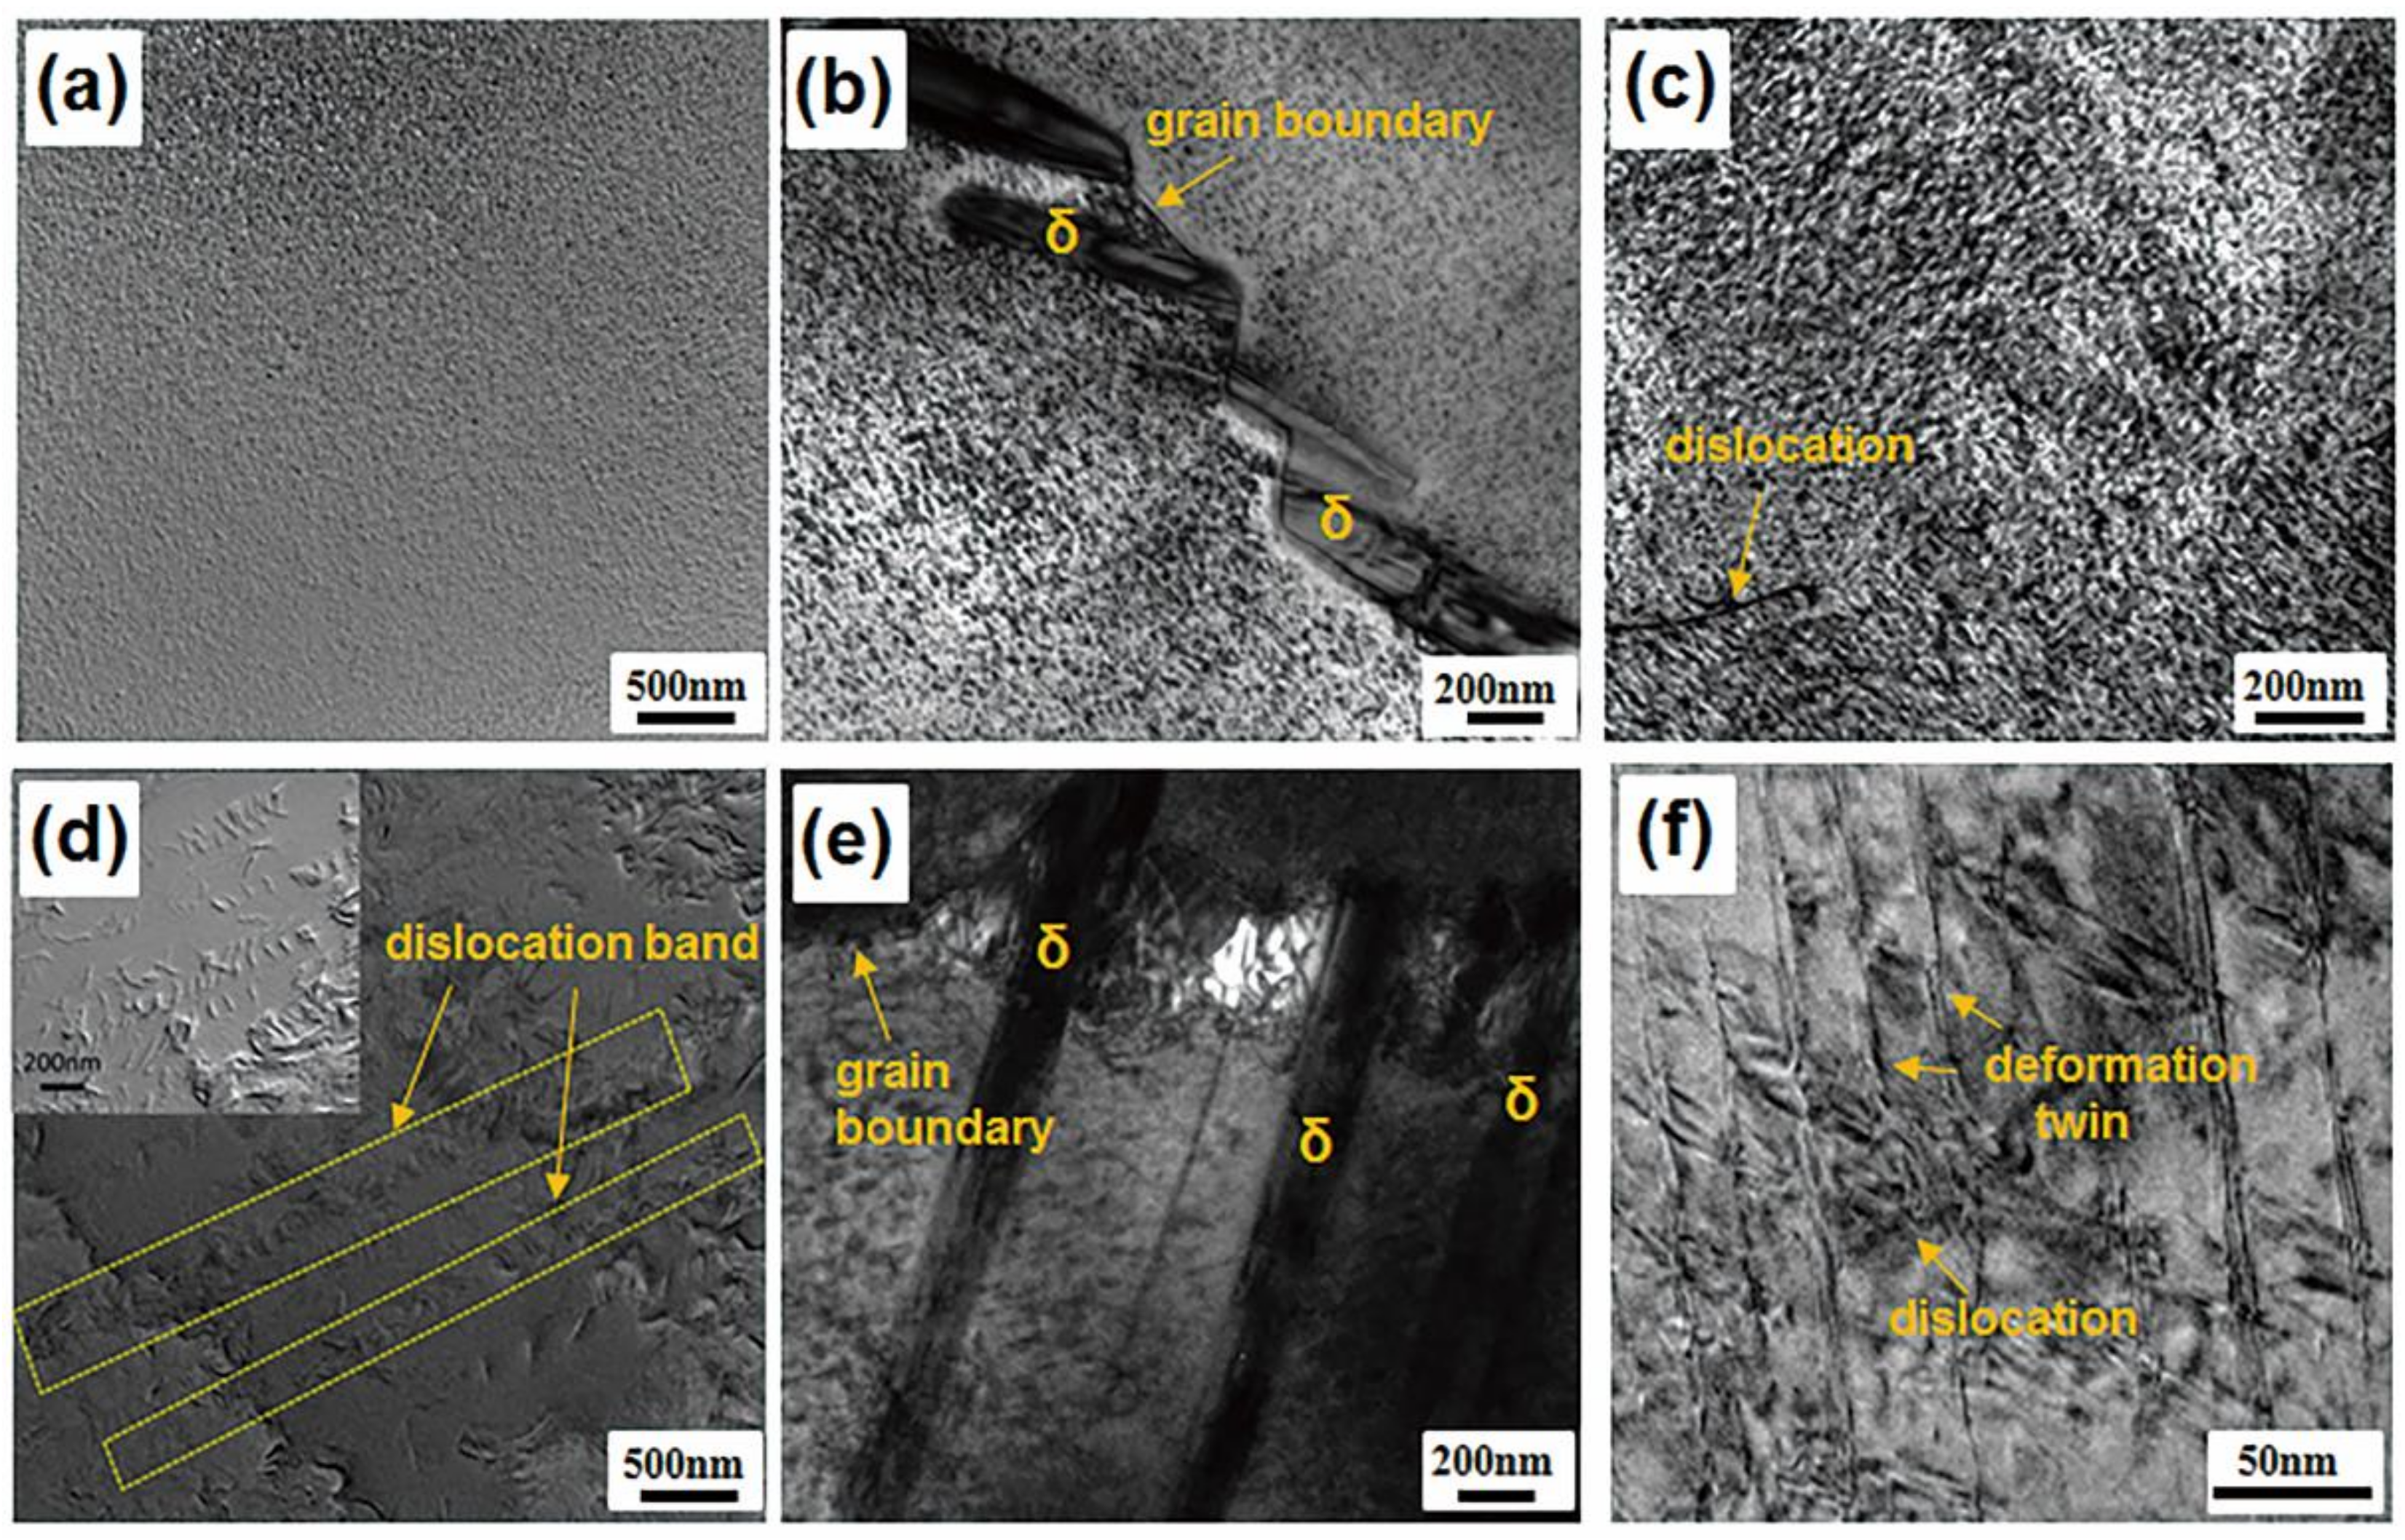
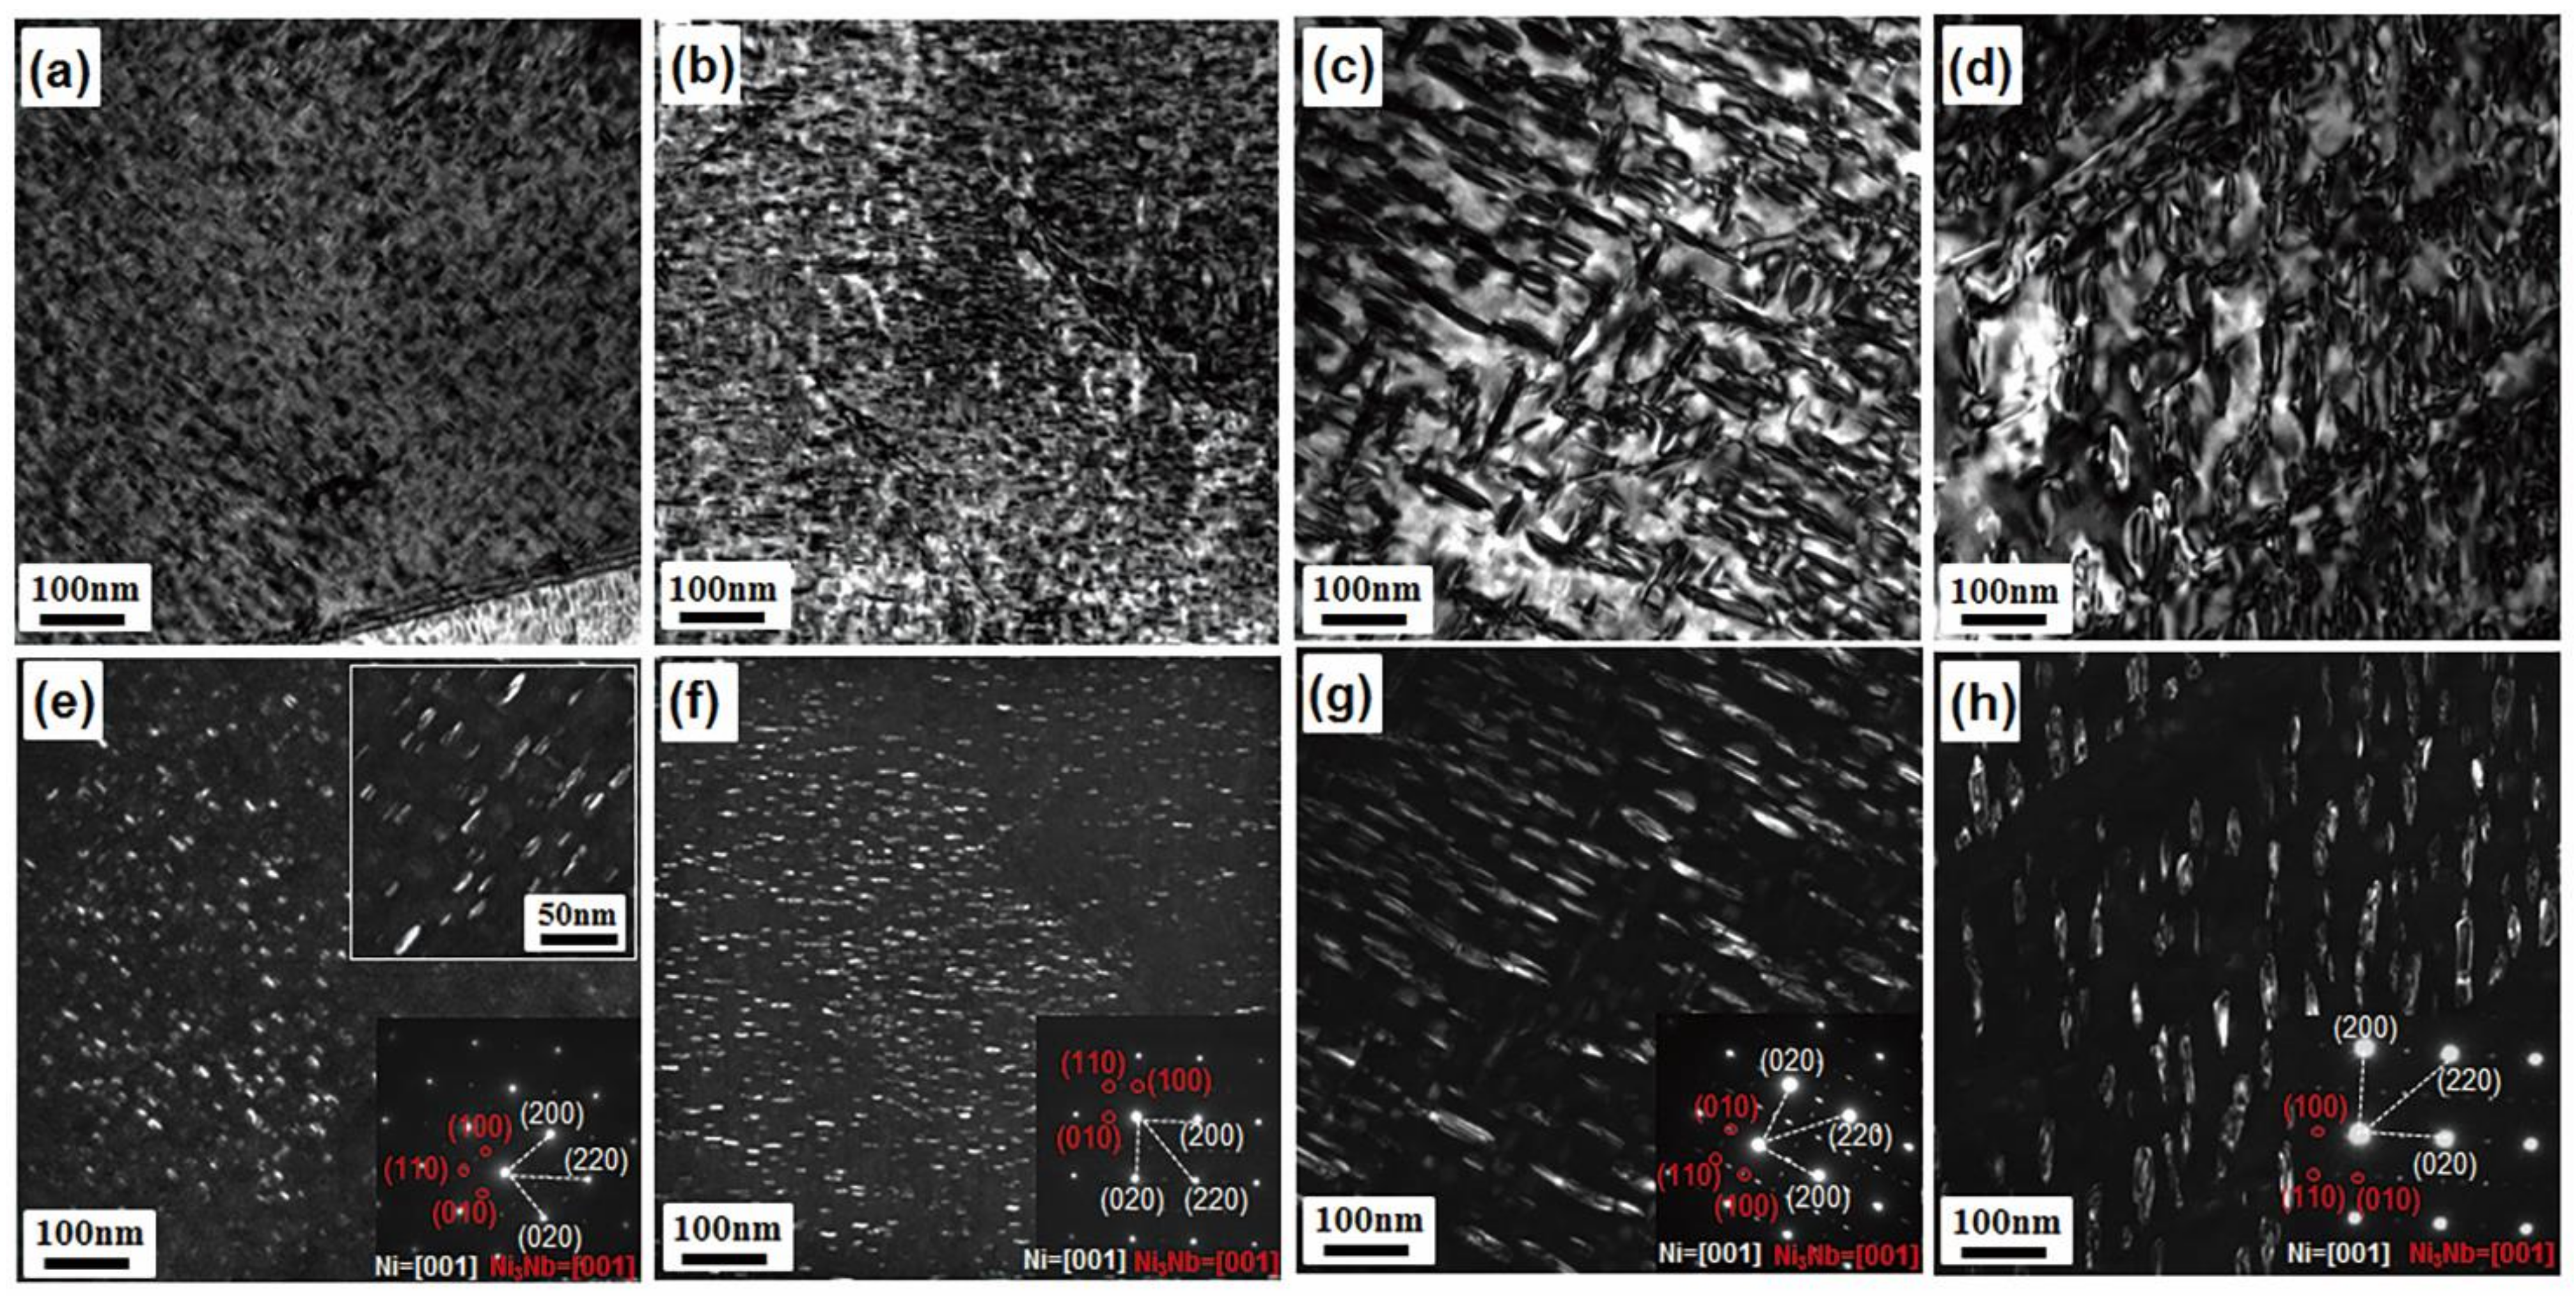
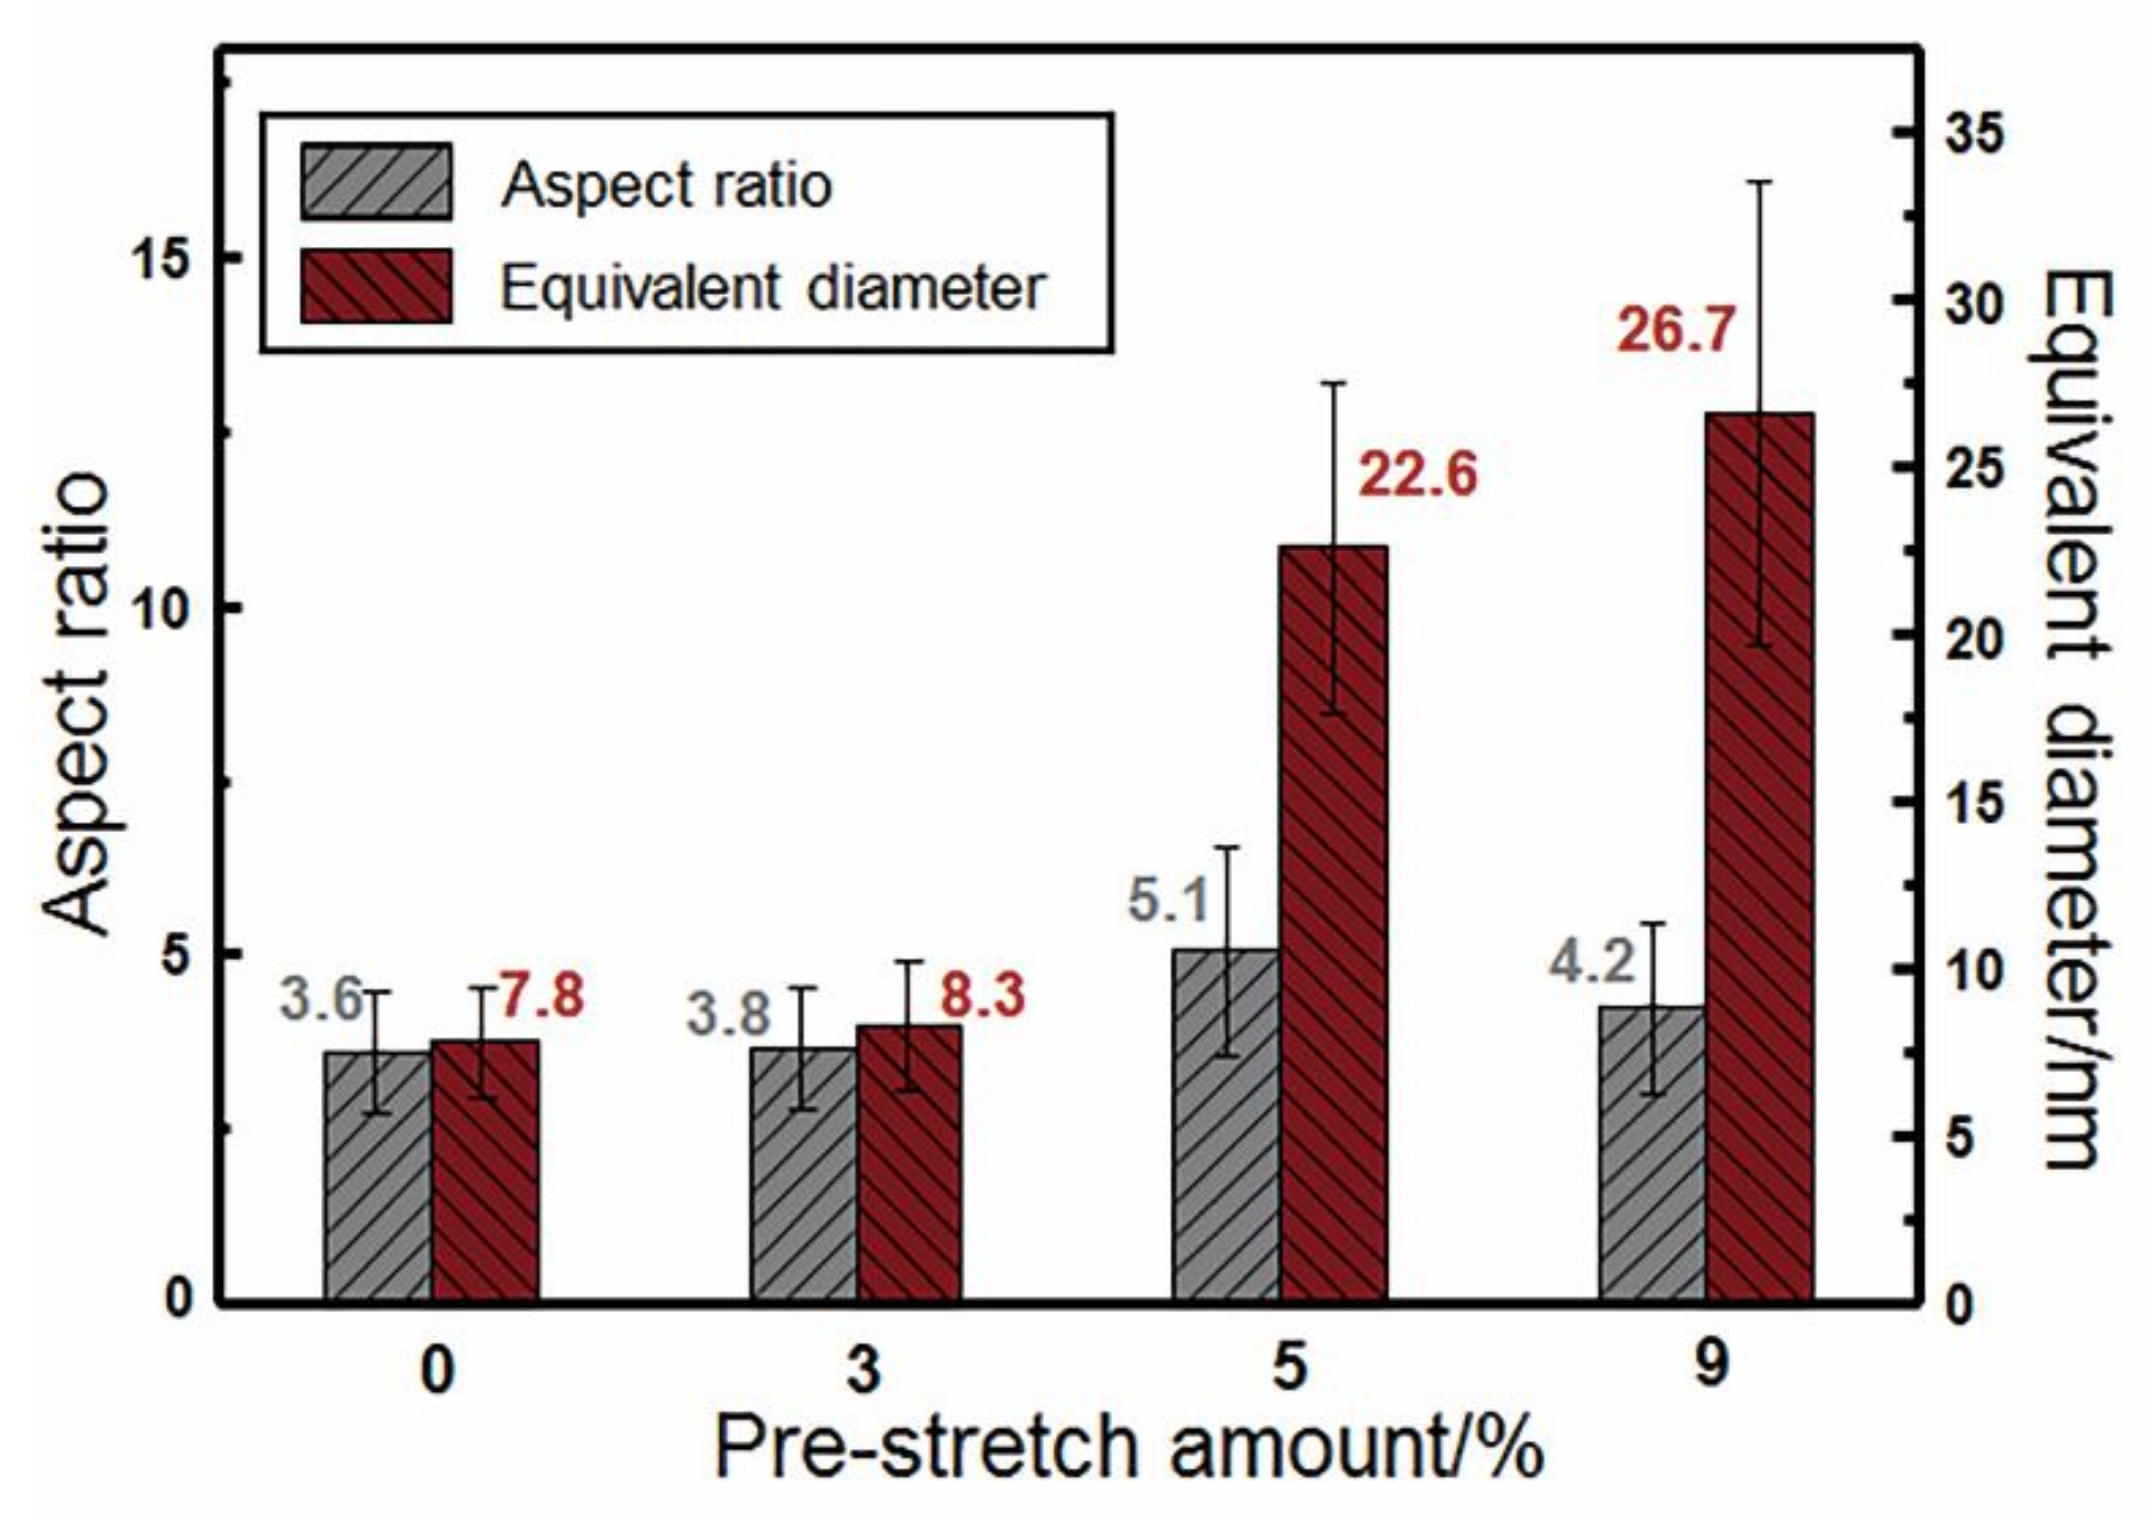
Pre-stretching has a significant effect on the residual stress of IN718 alloy. Figure 4 presents the residual stress distribution on the specimen surface after quenching and pre-stretching in each state along the stretching direction. After quenching, the residual stress on the specimen surface was about −470 MPa. When the level of pre-stretching was 1% and 3%, the residual stress on the surface of the specimen after stretching was about −170 MPa and −140 MPa, respectively. Figure 5 reveals the relationship between the pre-stretch level and residual stress reduction fraction for the IN718 superalloy after heat treatment (at 970 °C for 1 h). It can be observed that with the increase of deformation level, the residual stress reduction fraction increased first and then decreased. Similarly, the longitudinal residual stress of the quenched specimen decreased significantly under the same tensile level, with the reduction rate being larger than that of vertical residual stress. In addition, when the pre-stretch level in the small deformation range was about 3%, the residual stress reduction rate was the highest, which was 72.3% in the x direction.

4.2. Microstructure

After the solid solution treated specimens were subjected to pre-stretching at 0%, 3%, 5%, and 9%, EBSD observation was conducted to obtain the grain boundary diagrams shown in Figure 6. Figure 6a is a SEM image of the IN718 alloy after solution treatment, where the approximate straight line at the grain boundary is the twin boundary. Figure 6b–d exhibits the grain boundary distribution orientation at the residual stress test points on the specimen surface (horizontal section), and Figure 6e–h exhibits the grain boundary distribution orientation along the specimen thickness direction (longitudinal section). Based on the morphology, there were many triple point grain boundaries in the diagram, most of which were coherent twin boundaries. Regardless of the surface layer or along the thickness direction, it can be seen in Figure 6 that as the tensile deformation increases, the content and distribution of different grain boundary types changed. More specifically, the content of the twin boundaries (green lines) decreased significantly, while that of the low-angle grain boundaries (red lines) increased. The tensile deformation transformed part of the high-angle grain boundaries in the original specimen into other types of grain boundaries. The change along the thickness direction was more apparent.
TEM was used to investigate the effect of pre-stretch on the microstructure of the IN718 alloy. The test results are presented in Figure 7 and Figure 8. Figure 7a–c shows the microstructure of the solid solution treated and the aging treated samples without pre-stretching, and Figure 7d–f shows the microstructure of the solid solution treated and the aging treated samples after a pre-stretching level of 9% was reached. As shown in Figure 7, when the pre-stretch level was increased to 9%, the dislocation density increased, which was caused by plastic deformation during loading. These dislocations provide effective locations for the nucleation of the precipitates and form a rapid diffusion path for the precipitated elements in the subsequent aging process. Figure 8 shows the morphology of the precipitates of samples that received different pre-stretching amounts after aging. The statistical results of the precipitated phase size in samples at different states are shown in Figure 9. According to Figure 8 and Figure 9, it can be found that as the pre-stretching level increased to 3%, the effect of pre-stretching on the precipitated phase was negligible. The aspect ratio of the γ phase in the un-stretched and pre-stretched by 3% states was around 3.8, and the equivalent diameter of the γ phase was about 8 nm. As the pre-stretching level increased, the equivalent diameter increased monotonously, while the aspect ratio first increased and then decreased. When the pre-stretching level was 5%, the aspect ratio reached an extreme value of 5.1. When the pre-stretching level was further increased to 9%, the aspect ratio of the precipitated phase decreased to 4.2, while its equivalent diameter increased to 26.7 nm. In conclusion, after the aging process, coarse rod-shaped γ precipitates were formed on the dislocations, which could drain solution atoms from the surrounding matrix. These results demonstrate that when the pre-stretching level exceeds 3%, the impact on the microstructure of the IN718 alloy is significant.

4.3. Mechanical Properties

Figure 10 demonstrates the nano-hardness distribution of the IN718 alloy along the thickness direction of the specimen after solution treatment. Figure 10a is a schematic diagram of the specimen size and test position. Figure 10b is the nano-hardness distribution curve of the quenched specimen in the thickness direction. It can be seen that the nano-hardness at different positions along the thickness direction exhibited basically no obvious differences and was around 3.3 GPa.
Figure 11 demonstrates the mechanical properties and corresponding stress-strain curves of the IN718 superalloy at different pre-stretching levels. According to the results presented in Figure 11b, the ultimate tensile strength of the specimen in the original non-stretched state was 1362 MPa; the yield strength was 1138 MPa, and the product of strength and elongation was 26 GPa%. Compared to the non-stretched specimen, the yield strength of the specimen pre-stretched by 3% was 1219 MPa and the product of strength and elongation was increased by 0.8%, while the yield strength of the specimen pre-stretched by 9% was 1279 MPa, and the product of strength and elongation was decreased by 17.3%.

5. Discussion

5.1. Effect of Pre-Stretching on Residual Stress

Based on the mechanical analysis in Figure 1 and Section 2, it can be deduced that when the strain of the specimen core in the plastic stage is lower than the surface strain, the changes in residual stress between specimen core and surface in the loading stage (L1) will be smaller as compared to those in the quenched state. At this point, the residual stress on the specimen surface after stretching will be reduced. Figure 10 shows the curve of the specimen hardness changing with thickness. The result reveals that the hardness is basically stable, which indicates that the yield stress is constant throughout the thickness of the specimen. The main reason is that the specimens were obtained from the same position of the Φ300 mm bar with a thickness of 5 mm, which eliminated the effect of grain size during the heat treatment. Furthermore, the specimen thickness selected in this study was 2.5 mm, which can be quenched in a short amount of time, resulting in a small difference in hardness between core and surface. Moreover, due to the difference in grain size, shape, and orientation, different shear stress are developed between the grains under the action of tensile force F (Figure 12a). After the final discharge of the load, the transverse resultant stress along the loading direction tends to weaken, thus achieving the balance shown in Figure 12b. This variety of deformation mechanisms breaks the original equilibrium force system, driving the combined stresses towards two directions (i.e., applied force direction and perpendicular to the applied force direction) tend to weaken as a whole, achieving the purpose of reducing the residual stress.
According to the microscopic analysis in Figure 6, under the effect of external load, the content of the high-angle grain boundary decreases with the increase of the pre-stretch level, while the low-angle grain boundary increases. The atomic position change model is presented in Figure 13. During pre-stretching, the orientation of the grains rotates, and the lattice orientation facilitates the slip of the grains or crystal planes. This process shifts from a disordered high-energy state to an ordered low-energy state, and the residual stress decreases accordingly.
After pre-stretch has been applied to a superalloy, the release of the residual stress is not only related to the applied load but also to the material non-uniformity, deformation, diversity of grain deformation, and magnitude of the initial residual stress. In short, under the action of the additional tensile stress field, the internal defects move from the equilibrium of the high-energy state to the low-energy state, which is called the residual stress release process.

5.2. Effect of Pre-Stretching on Microstructure

5.2.1. Effect of Pre-Stretching on Grain Boundaries

Figure 14, which is consistent with Figure 6a–d, demonstrates the misorientation angle distribution of the material after solution treatment. The changes were manifested in the form of a significant increase in the fraction of the low-angle grain boundaries from ≈0.03% in the non-stretched state to 37% in the 9% pre-stretched state, and a reduction in the fraction of boundaries with 60° misorientation from ≈47% to ≈31% (Figure 14a,d). In addition, the increase in pre-stretch level led to an increase in the low-angle grain boundaries and the boundaries with misorientations deviated slightly from the 60° angle (Figure 14c,d). The peaks in the misorientation angle distribution plots in Figure 15 correspond to the 60°/<111> (Σ3) misorientation, as it has been clearly demonstrated in the misorientation axis distribution, which is a characteristic of coherent twin boundaries [30]. This also coincides with the orientation difference relationship of Σ3 [31,32,33,34].
The number of twins in the special grain boundary Σ3 is drastically reduced, mainly due to the tendency of the grain boundary in the crystal when deformation is applied: high-angle grain boundary (Σ3 twin) → ordinary high-angle grain boundary → low-angle grain boundary [35]. In addition, when the Σ3 twin content reaches a certain level, the difference in orientation of the coincidence sites lattice (CSL) grain boundary at the triple junction will follow the following rules [35]:
Σ3 + Σ3 → Σ(3 × 3); Σ3 + Σ3 → Σ(3 ⁄ 3) [33];
Σ3 twin + ordinary grain boundary → another ordinary grain boundary [36].
Moreover, this is an important reason for the decrease in the number of Σ3 twins. Balluffi [35] considered that in a low-angle range, the grain boundary energy increases linearly with the increase of the grain boundary angle. Consequently, the corresponding grain boundary energy is low when the angle is rather small, and from the energy point of view, the grain boundary is also beneficial. Since the proportion of the special low-weight grain boundary is effectively increased, the interfacial energy of the grain boundary decreases to some extent, thereby improving the high-temperature mechanical performance of the alloy [37].

5.2.2. Effect of Pre-Stretching on Precipitation Phase

The main strengthening methods for superalloys are solid solution strengthening, grain boundary strengthening, precipitation strengthening, and dispersion strengthening. For the IN718 nickel-based superalloy, the main method is precipitation strengthening, i.e., the intermetallic compound γ and γ phase are precipitated in the matrix to achieve the strengthening purpose [38]. The strengthening effect on the alloy depends mainly on the amount, size, and distribution of the precipitated phases; the lattice mismatch of the matrix; the solid solution strengthening degree; and other factors [39,40,41]. When a solid solution treated superalloy undergoes cold deformation, the work hardening effect will make the precipitated phase change during the subsequent aging heat treatment. As the amount of pre-stretching increases, the dislocation density in the alloy increases significantly. Consequently, the volume fraction of supersaturated solute atoms and vacancies entering dislocations through short-range diffusion during the aging process also increases [42], promoting the nucleation and growth of the precipitated phase. High dislocation density is considered the main reason behind the coarsening behavior of the precipitated phase in Figure 8. The curve in Figure 11 indicates that with the increase of pre-stretch level, the yield strength increased. Nevertheless, the morphology of the grains hardly changed when the pre-stretch level was about 9% (Figure 6). It should be noted that dislocation bands and deformation twins were generated in the specimen after pre-stretching (Figure 7). Compared to the specimens without pre-stretching, the interaction of work hardening and aging strengthening resulted in high strength, despite the average radius of the γ precipitates within the grains of the pre-stretched specimens was larger. What is more, the decrease in elongation after ageing can be explained by the presence of dislocation slip.

6. Conclusions

This paper combined the theoretical mechanical model and various testing methods to investigate the effect of pre-stretching on the residual stress and mechanical properties of the IN718 alloy. The main conclusions of this work are as follows:
(1)
With the increase in the level of pre-stretching, the reduction fraction of residual stress in IN718 alloy increased firstly followed by a decreasing trend. The maximum reduction of 72% was obtained under the condition of 3% pre-stretching level.
(2)
The strength of the alloy increases monotonically with the increase in the level of pre-stretching. No obvious changes in the product of strength and elongation of the IN718 alloy were observed when the pre-stretch level was lower than 3%. However, when the pre-stretch level was further increased to 9%, the product of strength and elongation of the alloy decreased significantly to 21.5 GPa%, which is a reduction of almost 17.3%.
(3)
After pre-stretching, the content of Σ3 twin boundaries in the IN718 alloy decreased significantly, while that of low-angle grain boundaries increased to a certain extent. In addition, when the pre-stretch level was further increased to 9%, the density of dislocation was increased and coarse rod-shaped γ precipitates were formed, resulting in a rise of strength.

Author Contributions

Design study, W.Y.; literature search, J.Z.; formal analysis, J.Z.; investigation, W.Y. and J.Z.; date curation, J.Z.; writing—original draft preparation, J.Z.; writing—review and editing, W.Y. and J.Z. All authors have read and agreed to the published version of the manuscript.

Funding

This research received no external funding.

Institutional Review Board Statement

Not applicable.

Informed Consent Statement

Informed consent was obtained from all subjects involved in the study.

Data Availability Statement

The raw/processed data required to reproduce these findings cannot be shared at this time as the data also forms part of an ongoing study. However, the data presented in this study are available on request from the corresponding author.

Conflicts of Interest

The authors declare no conflict of interest.

References

  1. Cozar, R.; Pineau, A. Morphology of γ′ and γ″ precipitates and thermal stability of Inconel 718 type alloys. Metall. Trans. 1973, 4, 47–59. [Google Scholar] [CrossRef]
  2. Sharma, A.D.; Sharma, A.K.; Thakur, N. Crystallographic, microstructure and mechanical characteristics of dynamically processed IN718 superalloy. J. Alloys Compd. 2014, 597, 175–180. [Google Scholar] [CrossRef]
  3. Li, H.Y.; Song, X.P.; Wang, Y.L.; Chen, G.L. Characterization of γ′ precipitates in a nickel base superalloy quenching from aging temperature at different rates. Rare Met. 2010, 29, 204–208. [Google Scholar] [CrossRef]
  4. Nalawade, S.A.; Sundararaman, M.; Singh, J.B.; Verma, A.; Kishore, R. Precipitation of γ′ phase in δ-precipitated Alloy 718 during deformation at elevated temperatures. Mater. Sci. Eng. A 2010, 527, 2906–2909. [Google Scholar] [CrossRef]
  5. Özgün, Ö.; Özkan, G.H.; Yılmaz, R.; Fındık, F. Microstructural and mechanical characterization of injection molded 718 superalloy powders. J. Alloys Compd. 2013, 576, 140–153. [Google Scholar] [CrossRef]
  6. Lu, X.D.; Du, J.H.; Deng, Q. High temperature structure stability of GH4169 superalloy. Mater. Sci. Eng. A 2013, 559, 623–628. [Google Scholar] [CrossRef]
  7. Slama, C.; Abdellaoui, M. Structural characterization of the aged Inconel 718. J. Alloys Compd. 2000, 306, 277–284. [Google Scholar] [CrossRef]
  8. He, D.G.; Lin, Y.C.; Wang, L.H.; Wu, Q.; Zu, Z.H.; Cheng, H. Influences of pre-precipitated δ phase on microstructures and hot compressive deformation features of a nickel-based superalloy. Vacuum 2019, 161, 242–250. [Google Scholar] [CrossRef]
  9. Anderson, M.; Thielin, A.L.; Bridier, F.; Bocher, P.; Savoie, J. δ Phase precipitation in Inconel 718 and associated mechanical properties. Mater. Sci. Eng. A 2017, 679, 48–55. [Google Scholar] [CrossRef]
  10. You, X.G.; Tan, Y.L.; Zhao, H.; You, Q.F.; Wang, Y.N.; Ye, F.; Li, J.Y. Effect of solution heat treatment on microstructure and electrochemical behavior of electron beam smelted Inconel 718 superalloy. J. Alloys Compd. 2018, 741, 792–803. [Google Scholar] [CrossRef]
  11. Aba-Perea, P.E.; Pirling, T.; Preuss, M. In-situ residual stress analysis during annealing treatments using neutron diffraction in combination with a novel furnace design. Mater. Des. 2016, 110, 925–931. [Google Scholar] [CrossRef]
  12. Wang, X.Q.; Chou, K. The effects of stress relieving heat treatment on the microstructure and residual stress of Inconel 718 fabricated by laser metal powder bed fusion additive manufacturing process. J. Manuf. Process. 2019, 48, 154–163. [Google Scholar] [CrossRef]
  13. Staron, P.; Cihak, U.; Clemens, H.; Stockinger, M.; Schreyerm, A. Characterization of residual stresses in IN718 turbine discs by neutron diffraction and finite element modelling. Adv. Mater. Res. 2011, 278, 102–107. [Google Scholar] [CrossRef] [Green Version]
  14. Dye, D.; Conlon, K.T.; Reed, R.C. Characterization and modeling of quenching-induced residual stresses in the nickel-based superalloy IN718. Metall. Mater. Trans. A 2004, 35, 1703–1713. [Google Scholar] [CrossRef]
  15. Hua, Y.; Liu, Z.Q. Experimental investigation of principal residual stress and fatigue performance for turned nickel-based superalloy Inconel 718. Materials 2018, 11, 879. [Google Scholar] [CrossRef] [Green Version]
  16. Li, H.Y.; Sun, H.L.; Bowen, P.; Knott, J.F. Effects of compressive residual stress on short fatigue crack growth in a nickel-based superalloy. Int. J. Fatigue 2018, 108, 53–61. [Google Scholar] [CrossRef] [Green Version]
  17. Zhou, W.B.; Zhou, H.; Zhang, R.B.; Pei, Y.M.; Fang, D.N. Measuring residual stress and its influence on properties of porous ZrO2/(ZrO2+Ni) ceramics. Mater. Sci. Eng. A 2015, 622, 82–90. [Google Scholar] [CrossRef] [Green Version]
  18. Doremus, L.; Cormier, J.; Villechaise, P.; Henaff, G.; Nadot, Y.; Pierret, S. Influence of residual stresses on the fatigue crack growth from surface anomalies in a nickel-based superalloy. Mater. Sci. Eng. A 2015, 644, 234–246. [Google Scholar] [CrossRef]
  19. Fleury, R.M.N.; Nowell, D. Evaluating the influence of residual stresses and surface damage on fatigue life of nickel superalloys. Int. J. Fatigue 2017, 105, 27–33. [Google Scholar] [CrossRef]
  20. Ghasri-Khouzani, M.; Peng, H.; Rogge, R.; Attardo, R.; Ostiguy, P.; Neidig, J.; Billo, R.; Hoelzle, D.; Shankar, M.R. Experimental measurement of residual stress and distortion in additively manufactured stainless steel components with various dimensions. Mater. Sci. Eng. A 2017, 707, 689–700. [Google Scholar] [CrossRef]
  21. Mishurova, T.; Cabeza, S.; Thiede, T.; Nadammal, N.; Arne, K.; Manuela, K.; Christoph, G.; Christoph, H.; Giovanni, B. The influence of the support structure on residual stress and distortion in SLM Inconel 718 parts. Metall. Mater. Trans. A 2018, 49, 3038–3046. [Google Scholar] [CrossRef] [Green Version]
  22. Li, J.; Zhou, J.Z.; Xu, S.Q.; Sheng, J.; Huang, S.; Sun, Y.h.; Sun, Q.; Boateng, E.A. Effects of cryogenic treatment on mechanical properties and micro-structures of IN718 super-alloy. Mater. Sci. Eng. A 2017, 707, 612–619. [Google Scholar] [CrossRef]
  23. Bi, Z.N.; Qin, H.L.; Dong, Z.G.; Wang, X.P.; Wang, M.; Liu, Y.Q.; Zhang, J. Residual stress evolution and its mechanism during the manufacture of superalloy disk forgings. Acta Metall. Sin. 2019, 55, 1160–1174. [Google Scholar]
  24. Robinson, J.S.; Tanner, D.A.; Truman, C.E. 50th Anniversary article: The origin and management of residual stress in heat-treatable aluminum alloys. Strain 2014, 50, 184–207. [Google Scholar] [CrossRef]
  25. Hoffmeister, J.; Schulze, V.; Hessert, R.; Koenig, G. Residual stresses under quasi-static and cyclic loading in shot peened Inconel 718. Inter. J. Mater. Res. 2012, 103, 66–72. [Google Scholar] [CrossRef]
  26. Madariaga, A.; Esnaola, J.A.; Arrazola, P.J.; Ruiz-Hervias, J.; Muñoz, P.; Ostolaza, K. Stability of machining induced residual stresses in Inconel 718 under quasi-static loading at room temperature. Mater. Sci. Eng. A 2015, 620, 129–139. [Google Scholar] [CrossRef]
  27. Vöhringer, O. Relaxation of residual stresses by annealing or mechanical treatment. Pergamon Press Adv. Surf. Treat. Technol. Appl. Eff. 1987, 4, 367–396. [Google Scholar]
  28. Faridmehr, I. Standard Test Methods forTension Testing of Metallic Materials, E 8M-97; ASTM: West Conshohocken, PA, USA, 1997. [Google Scholar]
  29. Zhao, Z.Y. Metal Plastic Processing Mechanics; Metallurgical Industry Press: Beijing, China, 1987; pp. 80–160. [Google Scholar]
  30. Thomson, C.B.; Randle, V. “Fine tuning” at Σ3n boundaries in nickel. Acta Mater. 1997, 45, 4909–4916. [Google Scholar] [CrossRef]
  31. Randle, V. Grain assemblage in polycrystals. Acta Metall. Mater. 1994, 42, 1769–1784. [Google Scholar] [CrossRef]
  32. Kopezky, C.V.; Andreeva, A.V.; Sukhomlin, G.D. Multiple twining and specific properties of Σ=3n boundaries in f.c.c crystals. Acta Metall. Mater. 1991, 39, 1603–1615. [Google Scholar] [CrossRef]
  33. Kuang, W.J.; Was, G.S.; Miller, C.; Kaufman, M.; Alam, T.; Gwalani, B.; Banerjee, R. The effect of cold rolling on grain boundary structure and stress corrosion cracking susceptibility of twins in alloy 690 in simulated PWR primary water environment. Corros. Sci. 2018, 130, 126–137. [Google Scholar] [CrossRef]
  34. He, W.J.; Hu, R.; Wu, Y.; Yang, J.R. Mechanical properties of an aged Ni-Cr-Mo alloy and effect of long-range order phase on deformation behavior. Mater. Sci. Eng. A 2018, 731, 29–35. [Google Scholar] [CrossRef]
  35. Balluffi, R.W. Grain boundary diffusion mechanisms in metals. J. Electron. Mater. 1982, 21, 527–553. [Google Scholar] [CrossRef]
  36. Valerie, R. Twining-related grain boundary engineering. Acta Mater. 2004, 52, 4067–4081. [Google Scholar]
  37. Gribbin, S.; Ghorbanpour, S.; Ferreri, N.C.; Bicknell, J.; Tsukrov, I.; Knezevic, M. Role of grain structure, grain boundaries, crystallographic texture, precipitates, and porosity on fatigue behavior of Inconel 718 at room and elevated temperatures. Mater. Charact. 2019, 149, 184–197. [Google Scholar] [CrossRef]
  38. Sohrabi, M.J.; Mirzadeh, H.; Rafei, M. Solidification behavior and Laves phase dissolution during homogenization heat treatment of Inconel 718 superalloy. Vacuum 2018, 154, 235–243. [Google Scholar] [CrossRef]
  39. Ran, R.; Wang, Y.; Zhang, Y.X.; Fang, F.; Wang, H.S.; Yuan, G.; Wang, G.D. Microstructure, precipitates and mechanical properties of Inconel 718 alloy produced by two-stage cold rolling method. Mater. Sci. Eng. A 2020, 793, 139860. [Google Scholar] [CrossRef]
  40. Qi, H.; Azer, M.; Ritter, A. Studies of standard heat treatment effects on microstructure and mechanical properties of laser net shape manufactured Inconel 718. Metall. Mater. Trans. A 2009, 40, 2410–2422. [Google Scholar] [CrossRef]
  41. Li, Z.; Chen, J.; Sui, S.; Zhong, C.L.; Lu, X.F.; Lin, X. The microstructure evolution and tensile properties of Inconel 718 fabricated by high-deposition-rate laser directed energy deposition. Addit. Manuf. 2020, 31, 100941. [Google Scholar] [CrossRef]
  42. Han, N.M.; Zhang, X.M.; Liu, S.D.; Ke, B.; Xin, X. Effects of pre-stretching and ageing on the strength and fracture toughness of aluminium alloy 7050. Mater. Sci. Eng. A 2011, 528, 3714–3721. [Google Scholar] [CrossRef]
Figure 1. Schematic diagram of stress-strain changes on the surface and core of the specimen during stretching. Point O is the stress in the state of quenching; the red line L1 indicated the state of load, and the blue line U2 shows the state of unloaded. ε * is the critical strain, and the residual stress will be reduced by loading and unloading within the critical strain range.
Metals 11 00614 g001
Figure 2. The microstructure in as-received Inconel 718. (a) Optical microscopy image (OM), (b) Energy Dispersive Spectrometer (EDS) maps taken from a region containing the carbides and grain boundaries.
Metals 11 00614 g002
Figure 3. Schematic diagram of the specimen used for pre-stretched test and residual stress measurement. (a) Planform perspective; (b) 3D perspective. All measures are in mm.
Metals 11 00614 g003
Figure 4. The residual stress distribution with different pre-stretching amounts. (a) 1%, (b) 2%, (c) 3%; (d) schematic diagram of residual stress measurement.
Metals 11 00614 g004
Figure 5. Schematic diagram of relationship between pre-stretching amount and reduction rate of residual stress.
Metals 11 00614 g005
Figure 6. Grain boundary maps obtained by electron back scatter diffraction (EBSD) of age-treated specimens with different pre-stretching amounts. Horizontal section (indicated as xoy plane in Figure 3b): (a) non-stretched, (b) 3%, (c) 5%, and (d) 9%. Longitudinal section (indicated as xoz plane in Figure 3b): (e) non-stretched, (f) 3%, (g) 5%, and (h) 9%. The green line, red line, and blue line represent twin boundaries, low-angle grain boundaries, and high-angle grain boundaries, respectively.
Metals 11 00614 g006
Figure 7. TEM micrographs of specimens with different pre-stretching amount. Non-stretched sample: (a) solid solution treatment; (b,c) aging treatment; sample with 9% pre-stretching: (d) solid solution treatment and (e,f) aging treatment.
Metals 11 00614 g007
Figure 8. Morphology of precipitates in age-treated samples with different pre-stretching amount. (a,e) Non-stretched; (b,f) pre-stretching amount of 3%; (c,g) pre-stretching amount of 5%; (d,h) pre-stretching amount of 9%. Where (ad) is the bright field image and (eh) is the central dark field image.
Metals 11 00614 g008
Figure 9. The size statistics of γ″ phase in samples with different pre-stretching amounts.
Metals 11 00614 g009
Figure 10. Nano-hardness measurement of specimen after solid solution treatment. (a) Schematic diagram of specimen containing measured region; (b) nano-hardness value as a function of thickness.
Metals 11 00614 g010
Figure 11. (a) Engineering stress-strain curves of age-treated samples with different pre-stretching amounts and (b) corresponding mechanical properties.
Metals 11 00614 g011
Figure 12. The force model of grain in (a) non-stretched, (b) after stretching. Note that F indicates the applied loading stress, σ x represents the normal stress along longitudinal direction, and σ y indicates the normal stress along vertical direction, τ implies the shear stress.
Metals 11 00614 g012
Figure 13. Schematic diagram of the atomic position change model. (a) Non-stretched samples, (b) pre-stretching sample.
Metals 11 00614 g013
Figure 14. The distribution of misorientation angle in solid solution treated samples with different pre-stretching amount. (a) Non-stretched, (b) 3%, (c) 5%, and (d) 9%.
Metals 11 00614 g014
Figure 15. The distribution of misorientation axis in specimen after solution treatment.
Metals 11 00614 g015
Table 1. Nominal composition of Inconel 718 alloy.
ElementsNiCrFeNbMoAlCTi
(wt%)Balanced18.9018.605.103.060.450.040.90
Publisher’s Note: MDPI stays neutral with regard to jurisdictional claims in published maps and institutional affiliations.

