Article

Model for the Prediction of Deformations in the Manufacture of Thin-Walled Parts by Wire Arc Additive Manufacturing Technology

1
TECNALIA, Basque Research and Technology Alliance (BRTA), Parque Científico y Tecnológico de Gipuzkoa, E20009 Donostia-San Sebastián, Spain
2
TALLERES AMONDARAIN I, Barrio Akezkoa, S/N, 20150 Zizurkil, Spain
3
Department of Mechanical Engineering, University of the Basque Country (UPV/EHU), E48013 Bilbao, Spain
*
Author to whom correspondence should be addressed.
Metals 2021, 11(5), 678; https://doi.org/10.3390/met11050678
Submission received: 6 April 2021 / Revised: 16 April 2021 / Accepted: 19 April 2021 / Published: 21 April 2021
(This article belongs to the Special Issue Additive Manufacturing Research and Applications)

Abstract

:
Gas Metal Arc Welding (GMAW) is a manufacturing technology included within the different Wire Arc Additive Manufacturing alternatives. These technologies have been generating great attention among scientists in recent decades. Its main qualities that make it highly productive with a large use of material with relatively inexpensive machine solutions make it a very advantageous technology. This paper covers the application of this technology for the manufacture of thin-walled parts. A finite element model is presented for estimating the deformations in this type of parts. This paper presents a simulation model that predicts temperatures with less than 5% error and deformations of the final part that, although quantitatively has errors of 20%, qualitatively allows to know the deformation modes of the part. Knowing the part areas subject to greater deformation may allow the future adaptation of deposition strategies or redesigns for their adaptation. These models are very useful both at a scientific and industrial level since when we find ourselves with a technology oriented to Near Net Shape (NNS) manufacturing where deformations are critical for obtaining the final part in a quality regime.

Graphical Abstract

1. Introduction

Additive Manufacturing (AM) is an emerging and promising field that is gaining increasing research attention and its applications in different industrial sectors are spreading day by day. Wire Arc Additive Manufacturing (WAAM) is a type of AM technique classified into Directed Energy Deposition (DED) technologies, where a metal wire acts as material feedstock and is melted by a heat source [1]. According to the nature of heat source, there are three types of WAAM technologies: Gas Metal Arc Welding (GMAW)-based WAAM, Gas Tungsten Arc Welding (GTAW)-based WAAM and Plasma Arc Welding (PAW)-based WAAM, each of them with different features and advantages [2,3].
It is inaccurate to see WAAM as opposed to traditional subtractive manufacturing technologies, but as complementary to them, since WAAM is still far from achieving final parts without dimensional inaccuracies and good surface quality. Because of this issue, subtractive manufacturing, like machining, is nowadays the usual finishing step for parts coming from WAAM. Therefore, WAAM should meet Near Net Shape (NNS) manufacturing paradigm, thus reducing machining operations aiming to save material, energy and time. In order to achieve this, distortions and residual stresses should be predicted and minimized to the extent possible, since they are two of the main problems of WAAM that mostly affect subsequent machining and that hinder its deployment [4]. They are inherent to WAAM, so they can be predicted and reduced, but not suppressed [5].
On the one hand, distortions in parts are caused by thermal cycles of melting and cooling that happened in layer-by-layer deposition, with their corresponding volumetric expansion and shrinkage. They are a concerning issue in structures such as thin walls [5].
On the other hand, residual stresses are the mechanical stresses that remain in a part once their cause (external forces or thermal gradients) disappears and the part is at equilibrium with its surroundings [6]. Unclamping or machining the part may disrupt this equilibrium and distort the part [7]. Poor mechanical properties and cracking may also appear [5]. There are different kind of residual stresses, and the ones caused in WAAM can be classified as inherent, bulk residual stresses [8].
Trial and error experiments are the most usual way to gain knowledge of WAAM processes so as to optimize process and operation parameters [9,10] and reduce distortion and residual stress, but they are costly and time consuming [3], so modeling and simulation are key tools to overcome this problem.
Due to the rapid and spatially variable cooling and heating of products manufactured by AM, they are often deformed and subject to residual stresses. Deformations due to welding appear to have a negative effect on exterior appearance, dimensional accuracy and other conditions such as various structural strengths. Finite element modeling (FEM) can be used to analyze deformation issues such as distortion and temperature field, allowing for more advanced planning early in the WAAM planning process to avoid expensive rework.
Srivastava et al. [11] describes in detail the features such models present. Most of them are based on previous welding models, precedent of current WAAM. To date, these models are mesh-based numeric models, both 2D and 3D Finite Element (FE) models. There are not analytical models yet. Likewise, Rodrigues et al. [3] only mentions FE analysis to avoid trial and error experiments.
As the mechanical properties of the part coming from WAAM have thermal origin, the modeling should include thermal modeling and mechanical modeling. The interaction between two models can be coupled or weakly coupled [11]. Coupled models simultaneously carry out both analyses, as the distortion induced heat affects thermal properties, whereas weakly coupled ones are performed sequentially, because they consider that the energy input from the heat source is much higher than the heat induced by distortion, so they neglect the latter [4]. Temperature history of the part is the main result from the thermal modelling, and it is an input for the mechanical modelling, which has distortions and residual stress fields as results [11].
Ding et al. [12] compared two thermo-mechanical weakly coupled 3D FE models for WAAM: a steady state model with Eulerian reference frame, and a transient model with Lagrangian reference frame. The “element birth technique” is used to simulate the addition of material. The software employed was ABAQUS, (Dassault Systèmes, Vélizy-Villacoublay, Ile-De-France, France) and the material was mild steel. The main outputs were the temperature, distortion and residual stress distributions. It was validated for a thin wall. In a more recent work, Ding et al. [13] developed a weakly coupled transient thermo-mechanical 3D FE model, optimizing it to save computational time, based on the finding that the maximum temperature a point reaches during the WAAM process determines the residual stress of that point.
Zhao et al. [14] simulated a thin wall manufactured by GMAW, by means of a coupled thermo-mechanical 3D FE model. It concluded that the deposition direction, especially on the deposition of the last layer, is a very influencing factor in the residual stress field of the whole component. The employed software was MSC Marc, and the deposited material was H08Mn2Si.
Cadiou et al. [15] developed a transient 2D axysimetric numerical model for PAW. In addition to thermal and mechanical laws, it also considered electromagnetic forces. It focused on droplet generation, deposition and dynamics in the melt pool, taking into account only operating parameters and basing on level-set method by Osher and Sethian [16] to distinguish between gas and metal areas and define their properties. The software employed was COMSOL Multiphysics® and the material was 304 stainless steel. The main outputs were the evolution of the melt pool, and the height and the weight of the rod, as well as its temperature. It was validated for the first deposited two rods.
Oyama et al. [17] compared residual stresses, distortion and manufacturing duration for different deposition and heating strategies in WAAM, using 3D FE simulation. Simufact welding software was employed, and the materials were Al-5Mg and Al-3Si aluminum alloys. It was validated for a complete thin wall.
As it has been shown, the great majority of numeric models have been validated for thin walls, but FEM has not been successfully applied to a complex part of reduced thickness yet. Therefore, broadly, it can be concluded that there is still a gap regarding the prediction of the complete real geometry of final complex parts by means of modelling and simulation. This gap is a concerning issue, since most of the real industrial parts are complex, and they present a combination of different geometries as curve and plane surfaces. Therefore, in order to allow the complete industrial deployment of parts manufactured by WAAM, to determine if FEM analysis is suitable for predicting their temperature and distortion profiles is a key step.
Consequently, in this research, a method development on predicting both the temperature each layer reaches and the deformed state of WAAM will be investigated by utilizing FEM analysis in a form of multi-layered process. The manufactured part is a geometrically complex mold of ER70S-6 steel.
This steel is usually used in applications such as construction works, automotive industry, pipes, shafts and tanks, so it is an industrially relevant material. Up to now, researchers are mainly focused on selecting optimal operation parameters regarding mechanical properties and microstructure, by means of experimental tests [18,19], but there is not yet an FE analysis of a complex part, aiming to predict final distortion.
Additionally, Dttmann et al. [20] studied the machining of a part of this material manufactured by GMAW, so a tool as FEM, which can predict distortion and temperatures prior to this machining operation, is highly valuable.
The good agreement between the results obtained from FEM simulation and a methodology for the prediction of temperatures during the process and deformations in the final part has been validated with the measurement of the part using a laser tacker (FARO Technologies Inc., Lake Mary, FL, USA).

2. Materials and Methods

2.1. Set-Up for the Wire Arc Additive Manufacturing of the Part

This document details the manufacturing process of an ER70 steel mold using WAAM technology based on GMAW. Figure 1 shows the CAD design of the mold to be manufactured. Both the design of the mold and the materials, equipment, methodology and parameters used are determined. In addition, the problems encountered during manufacturing and the solution that has been taken for each of them are also shown.
This demonstrator was made of ER70S-6 mild steel, Table 1 showed the composition of the material according to the provider. This ER70S-6 steel was provided in the form of commercial wire with a diameter of 1.2 mm, first 3 coils (Praxair, Danbury, CT, USA) and the last coil (Bohler, Düsseldorf, Germany), and 8 mm flat S235JR steel plates were used as a substrate.
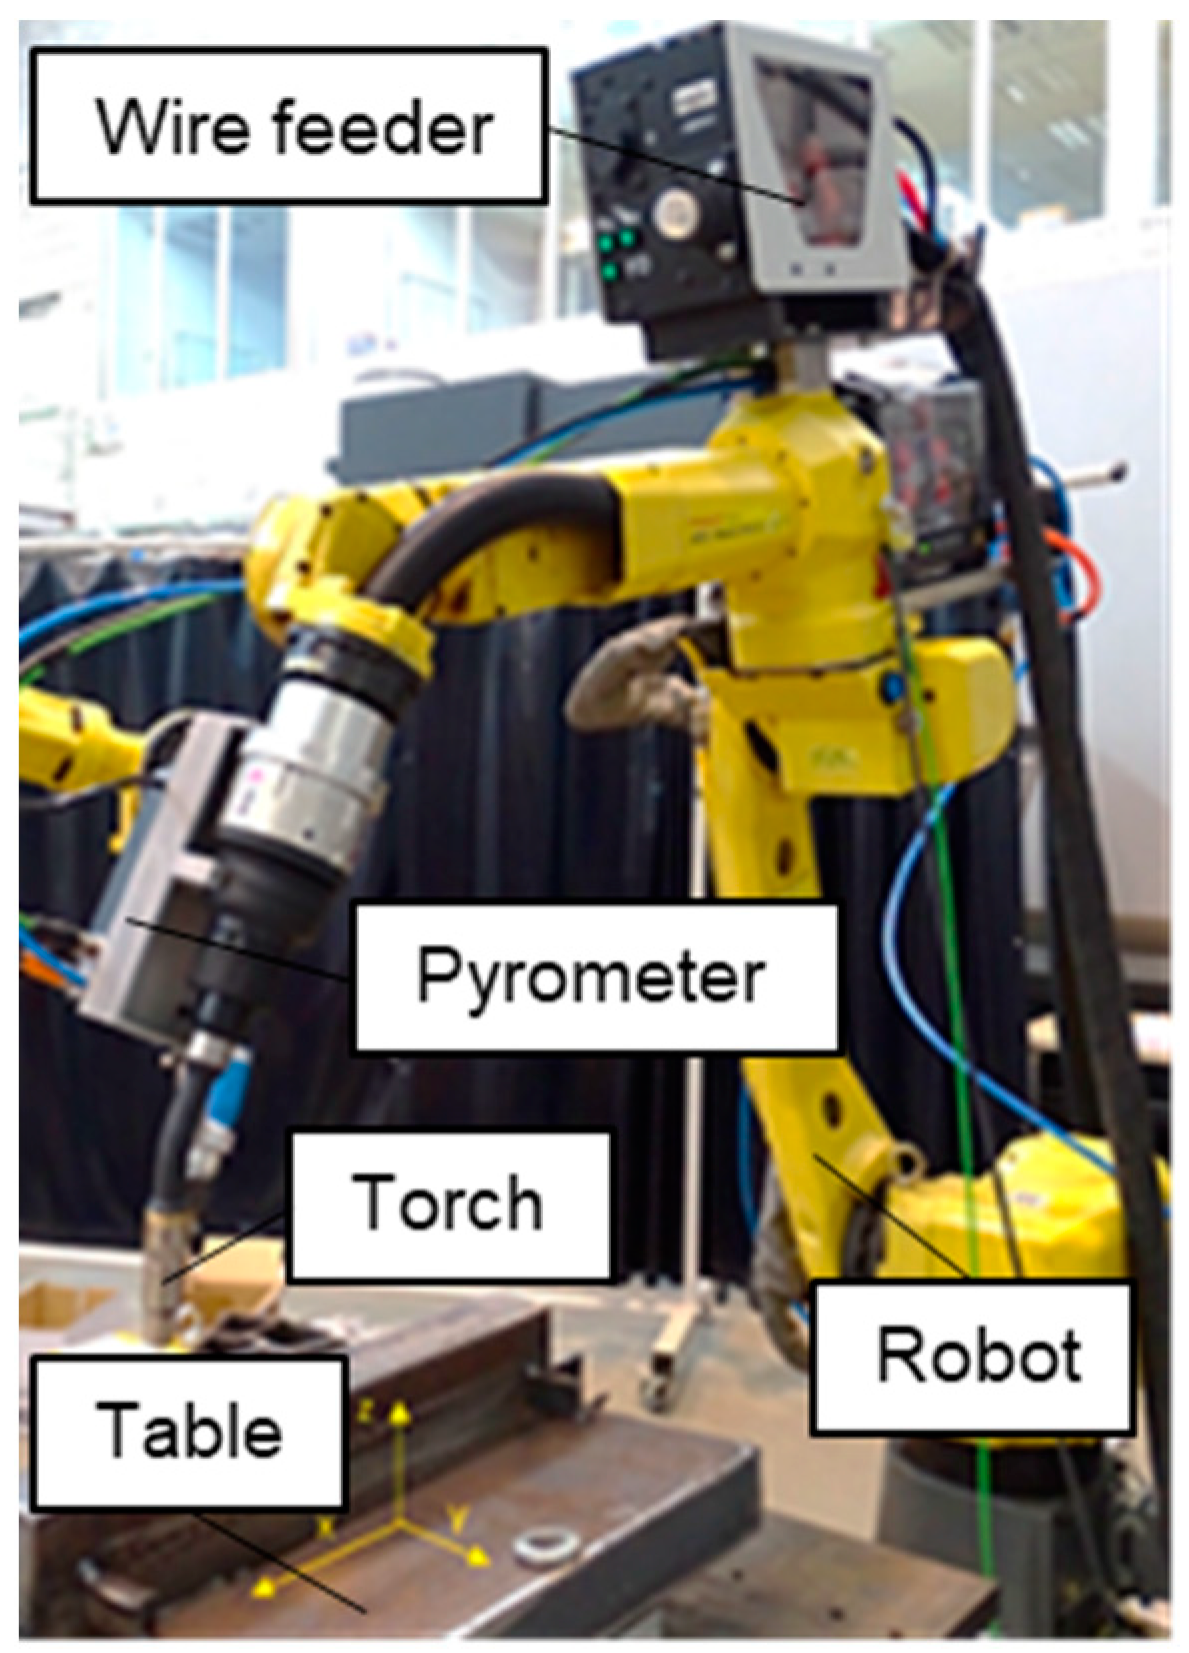
A robotic fixed table welding system was used to manufacture this mold, as can be seen in Figure 2. In this system, the Alpha Q 552 puls (EWM, Mündersbach, Germany) welding equipment feeds the GMAW welding torch. The torch was placed on a Fanuc Arc Mate 100-iC (Fanuc, Oshino, Japan) robotic arm to be able to manufacture parts layer by layer. This set was also equipped with the M drive 4 Rob5 XR RE (EWM, Mündersbach, Germany) wire feeding equipment and the shielding gas system. The welding torch had been equipped with a compact Optris pyrometer (Optris GmbH, Berlin, Germany); the measurement was made on the surface of the bead once deposited with a delay of 10 ms (estimated based on the travel speed used). The emissivity of the surface was considered 0.9 for an incandescent body made of ER70 steel.
Taking into account the design of the part, the material was provided continuously in a single cord. The trajectories were designed using PowerMill (Autodesk, San Rafael, CA, USA) In this program the layer thickness and the type of path to follow could be defined and by means of internal algorithms the program calculated the desired paths. In order to be able to make the continuous deposition on a part of the straight back wall, the height of a layer was raised in z. These trajectories, once defined, were post-processed directly from the PowerMill. Each cell (robot or CNC machine) had its own post-processor, which allowed the part to be directly placed in the desired position, taking into account the characteristics of each equipment. In this case, the part was post-processed for the Fanuc robot post-processor on a fixed to the table as can be seen in Figure 3.
In the present work, modes Cold Arc and Pulsed-GMAW (Job 194 and 9) were mainly used, which allowed possible wire feed speeds of between 4 and 16 m/min for the used material. Furthermore, the gas mixture % 20 CO2-% 80 Ar with a flow rate of 18 L/min was chosen as the shielding gas. Regarding the inclination of the torch with respect to the substrate, it had worked with angles of 90° and a Stick-out of 17 mm. The diameter of the nozzle used was 20 mm and the parameters chosen were the following:
First, the initial programs were produced with the Cold Arc working mode with 5 m/min wire feed speed and 50 cm/min travel speed. But the number of splashes had been high, and the nozzle filled quickly so it was decided to change the mode to Pulsed-GMAW and program 3 is manufactured. Finally, it was decided to increase the travel speed to 65 cm/min and reduce the layer height to 1.3 mm. Manufacturing conditions are summarized on Table 2.
The manufacture of the piece was therefore carried out with a combination of two transfer modes. A Cold-Arc transfer mode was used in the first ten passes, then another ten were made in Pulsed-GMAW at the same traverse speed and ended with the same conditions in the Pulsed-GMAW mode at higher travel speed. This strategy was considered adequate since in the first layers the Cold-Arc mode introduced less heat to the substrate, and it transitioned to a Pulsed-GMAW mode where fewer splashes were produced and finally the speed was increased to introduce less energy so that it prevented the collapse of the wall.
From the control of the machine and the welding source, the relevant data of the process were extracted that allowed the relevant information to be obtained. This information gave an overview of both the stability of the process and the energy introduced in the process for the simulation of the manufacture of the part. These signals were sampled with a sample rate of two hertz. The energy was calculated as the product of the intensity (I) by the voltage (V) and the travel speed (TS), expressed in units [kJ/cm].
E n e r g y [ kJ cm ] = I × V T S
Figure 4 shows the volumetric representation of the energy calculated following Equation (1). Analyzing the energy results, it was observed that the measured values of the machine control were not constant. This value depended both on the stick-out, the distance the wire goes out from the nozzle to the upper surface of the part and on fluctuations in travel speed, this type of energy behavior was already reported previously by Wang et al. [21].

2.2. Methodology for Material Characterization and Part Verification

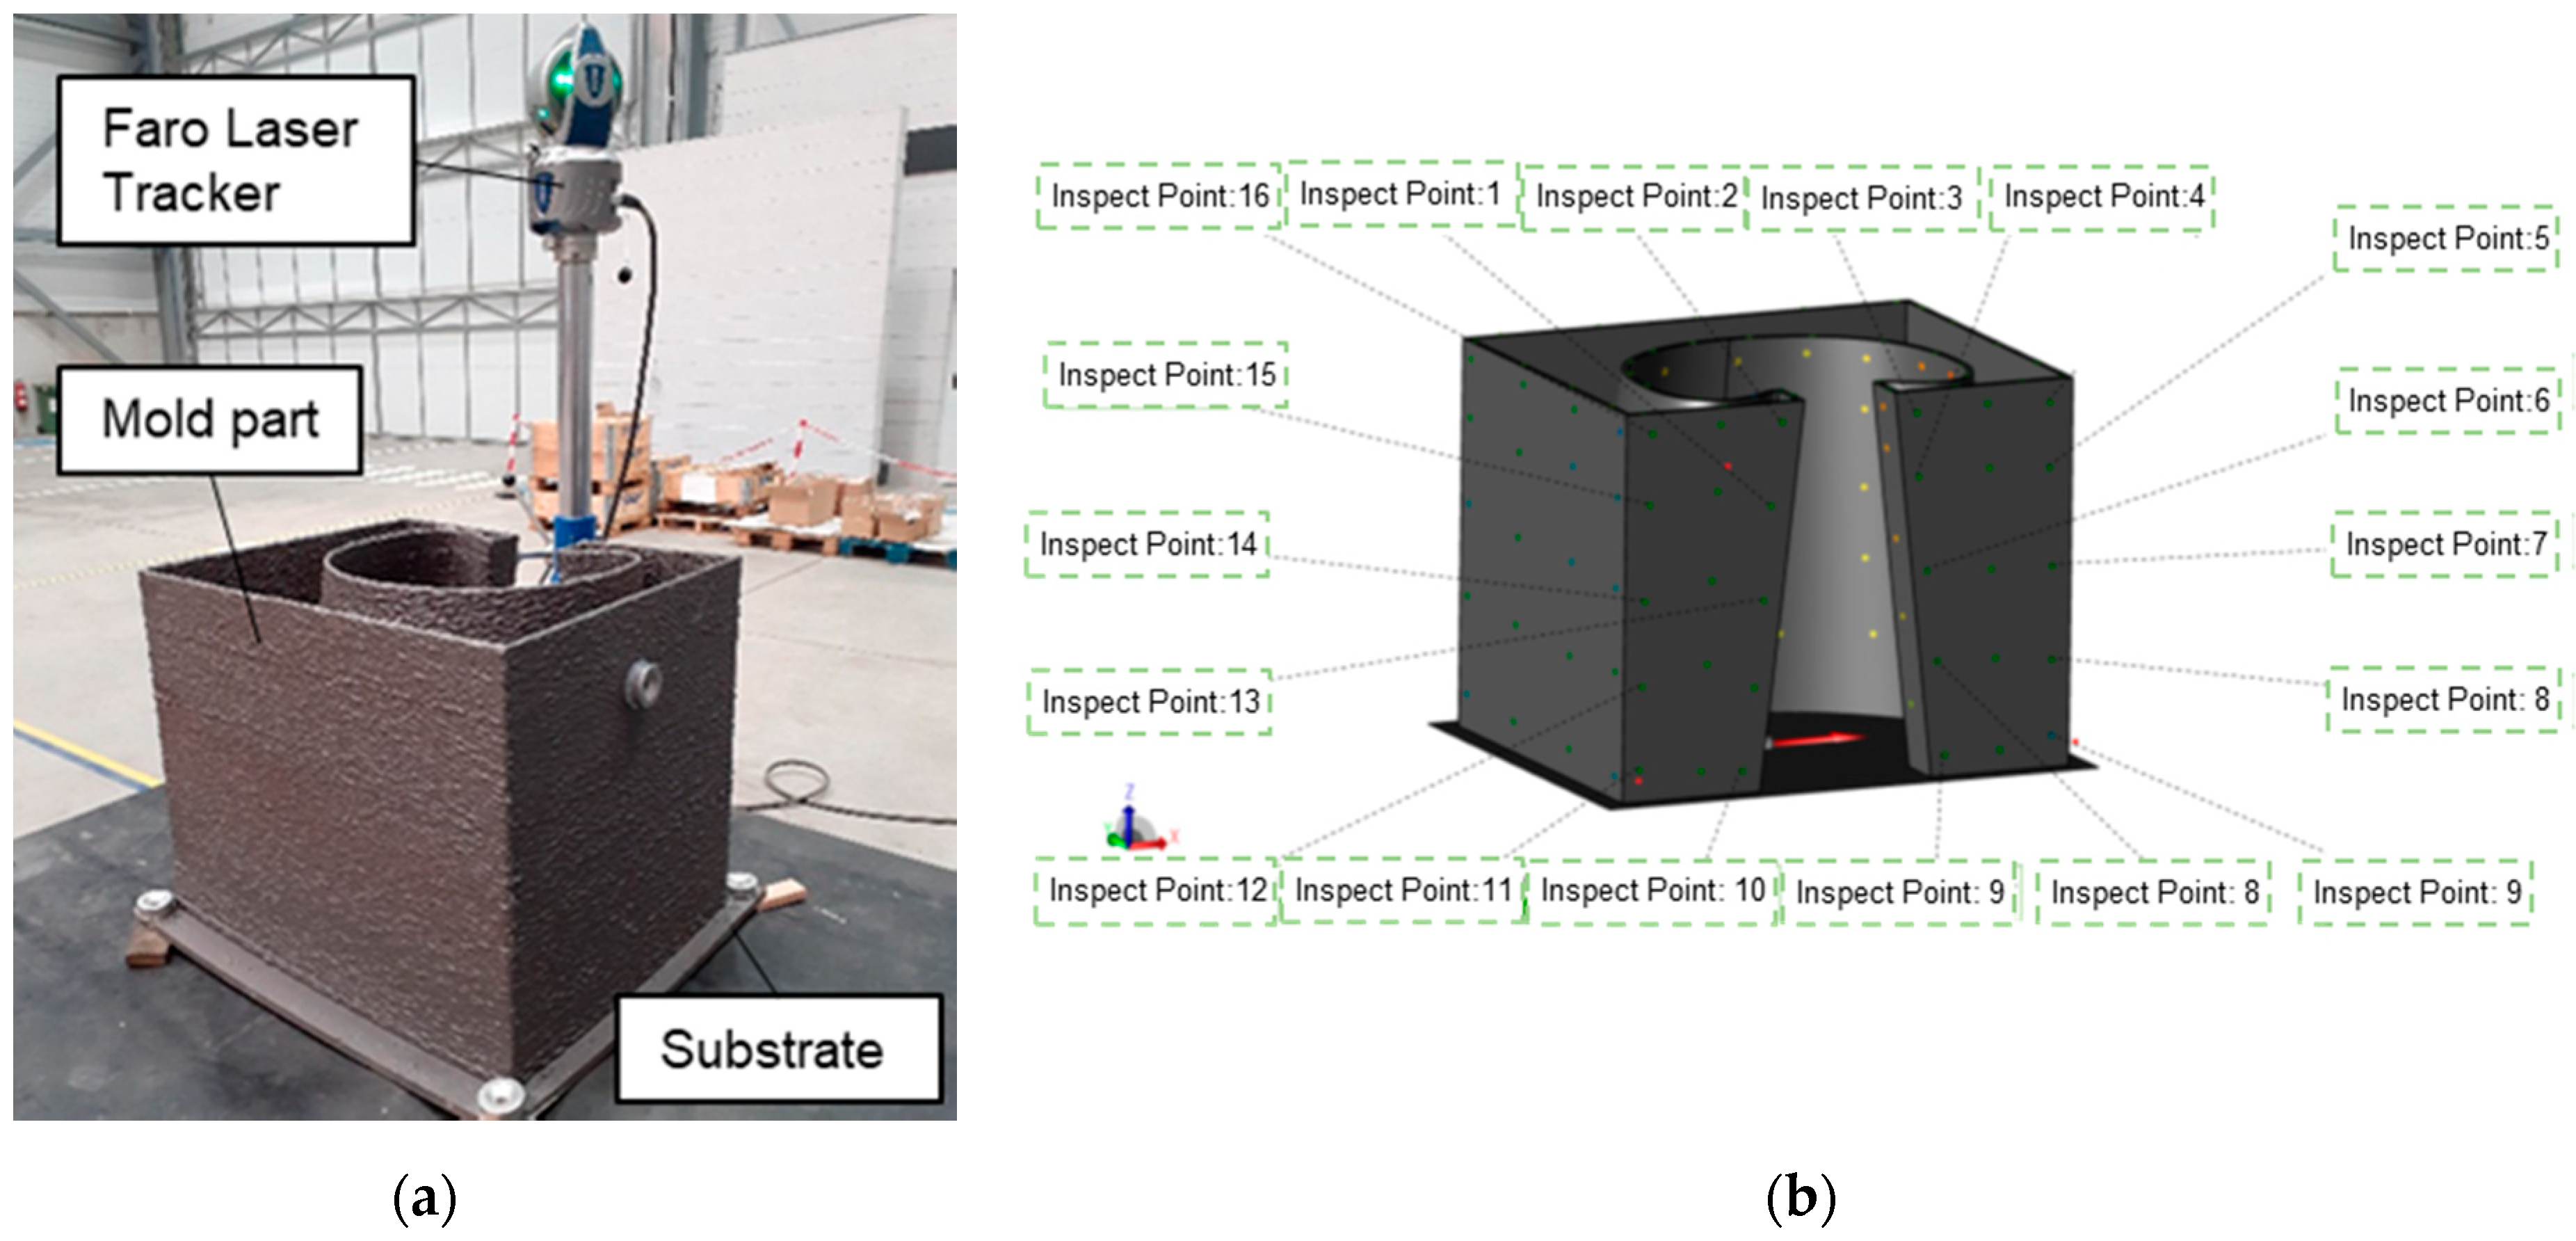
Measuring molds for large parts in industrial environments used to be a difficult and time-consuming with high precision. In this paper, a Portable FARO (FARO Technologies Inc., Lake Mary, FL, USA) Vantage Laser Trackers made on-site measurements in 3D coordinates by tracking a target that the user moved from one point to another of the wire-arc manufactured part, as it can be seen on Figure 5a. The measurements were then compared to nominal CAD data, Figure 5b.

3. Results

3.1. Mechanical Characterization of Additive Manufacturing Material

A sample wall had been manufactured using same additive conditions that were in the mold part. The wall was manufactured to take out specimens with threaded terminals to perform the tensile tests according to the ISO 6892-1 standard [22]. The tensile tests in uniaxial direction were carried out at room temperature in an Instron (Instron, Norwood, MA, USA) 5585H bench test that gave 100 kN of maximum load equipped with an Instron EX2620-602 (contact extensometer). In addition, the same samples were performed at room temperature using Vickers hardness tests at different heights on a Struers Duramin A-300 machine (Struers, Copenhagen, Denmark).
The following Table 3 summarizes the results obtained from the tensile tests carried out on the specimens. Six tensile tests were carried out in each of the horizontal and vertical directions to determine the anisotropy of the mechanical properties. ER70 steel is an easily weldable mild steel that exhibits similar mechanical properties in both directions. In this case, the tests do not show large differences, being comparable to the data of the material provided by the supplier. Additionally, a Vickers hardness test was carried out at different heights, which placed its hardness around 150 HV.
As part of the analysis of the properties of the additive material, the cross-sectional macrographs of the bead are presented in the following Figure 6. The dissimilarity inherent in the formation of the layers of the beads is observed. Nevertheless, no macrostructural flaws such as lack of filling or pores are seen. To reveal the grain and to know the crystallography of the ER70 additive material, polished and finally etched with a solution 2% Nital-Nitric and Ethanol acid- to reveal the grain structure were used. Ferrite areas and ferrite / bainite acicular areas are generally found. In the upper part, as there have been thermal cooling-heating cycles, there are acicular parts of ferrite. In the central part in every layer limit also can be found acicular ferrite/bainite small areas but the microstructure mainly is composed by polygonal ferrite zones. A more detailed analysis of the microstructure can be found in the articles by Eider et al. [23,24].

3.2. Model for the Simulation of Thin-Wall Deformations

In this section, the model simulation of the additive manufacturing process by material addition of the mold ER70 steel part is presented. The analyses performed aimed to predict the thermo-mechanical behavior of the part, by analyzing the temperature field and permanent displacements during the process. One of the most frequent problems that occurs when parts are manufactured with this technology is the appearance of permanent deformations, the stored heat begins to transfer and the different parts of the model begin to expand depending on the temperature they reach and their properties. Since there are usually important thermal gradients in the part, different dilatations are produced. From the point of view of heat transfer, conduction, convection and radiation mechanisms are considered. The phase change of the material used in the addition is also taken into account. These type of simulations are very nonlinear, due to the nonlinearity of the materials and to the fact that the addition of material implies, in numerical terms, to frequently modify the stiffness matrix, which makes the resolution of the problem costly or even unfeasible from a resolution time point of view. Regarding the software, two programs are used for the simulation of the additive manufacturing process. Thus, the mesh is built with Siemens’ NX software (Siemens, Munich, Germany), while the rest of the pre- and post-processing tasks are completed through MSC’s Mentat. The solver used to solve the thermo-mechanical problem in MSC-Marc. According to Zhang et al. [25], the temperature-dependent material parameters were in this case the thermal expansion coefficient, thermal conductivity, elastic modulus, yield stress and specific heat. These temperature-dependent materials were obtained from the MSC Marc (MSC Software, Irvine, CA, USA) software database [26]. In this research, the double ellipsoid heat source according to Goldak [27] was considered, which is a proposed heat source model that promotes heat input as a function to generate heat while being able to control the overall amount of power delivered into the substrate and filler. This is a typical approach for common arc welding simulations, which reproduces the thermal energy input well [28,29]. The power density distribution in the heat source is as following. In the front half of the heat source:
q f ( x , y , z ) = 6 3 f f Q abc f π π exp ( 3 x 2 a 2 3 y 2 b 2 3 z 2 c f 2 )
In the rear half of the heat source:
q r ( x , y , z ) = 6 3 f r Q abc r π π exp ( 3 x 2 a 2 3 y 2 b 2 3 z 2 c r 2 )
where qf is the power density distribution in the front half of the heat source and qr is that in the rear half of the heat source; a is the width of the heat source and b is the depth; cf and cr are the forward and rear lengths of the heat source along the length of the layers; Q is the power of the heat source and Q = ηVI. η is the heat source efficiency and V and I are the voltage and the current; ff and fr are the fractions of the heat deposited in the front and rear halves of the heat source and ff + fr = 2.
The heat source efficiency of GMAW is assumed to be 85% [30] and the parameters defining the dimensions of molten pool used for the volume weld flux are chosen according to actual dimensions of the molten pool. The distribution parameters of double ellipsoidal heat source are assumed to be the same in the numerical simulation of all layer depositions. Considering the high temperature gradient of deposition metal, the meshes in the deposition area and the heat-affected zone are dense. The finite element mesh consists of hexahedron elements, and the element size in the deposition area is about 1 mm. Simulation has been performed using several element sizes close to 1.3 mm by keeping the total height constant. It is overserved that there is not any difference in the temperature variation in layers and in total deformation of the mold. Hence, in this paper the average element size is considered as 1 mm. The material is modeled as elastic perfectly plastic. The overall geometry, including both filler and base metal, was discretized using 15,398, 8-nodes brick elements. Free convection boundary conditions were set up on the base plate top and bottom surfaces and on the wall vertical surfaces. Convection coefficients values, set according to literature correlations, were: 8.5 W/m2K for the base plate top surface, 4.0 W/m2K for the bottom surface and 12.0 W/m2K for the wall vertical surface. A boundary condition of general radiation to environment was included, setting material emissivity was set to 0.3. Environment and material initial temperatures were set to 20 °C. At the room temperature (25 °C), the Poisson’s ratio is 0.29 and the elastic modulus is 190 GPa. The yield stress is 448 MPa and the thermal expansion coefficient is 13 µm/(m·K). The specific heat is 470 J/(kg·K) and the thermal conductivity is 50 W/(m·K) Figure 7a shows the finite element mesh multi-layer deposition of the original model and in Figure 7b shows the temperature field during the manufacturing processes. The simulated temperatures and the measured temperatures are around 1000 °C, although the melting temperature of the material is over 1400 °C. The simulation is focus on the quasi-stationary state of the process, where an abrupt drop in temperature is observed in the first moments of the deposition. It has been chosen to show the quasi-stationary state of the process, being more comparable to the measurements made on the material moments after deposition.
Similarly, Figure 8 shows the temperatures measured by the pyrometer that continued to manufacture the part. A temperature of just over 900 °C has been reached, a little behind the simulated ones. It should be noted that the measurement of the pyrometer on the surface is collected with a slight delay, despite that the fit between the simulation and the real measurements presents correct results with a difference of less than 100 °C.
From Finite element simulation, the distribution of displacements on the thin-walled part examined and gathered information of the distortion of nodes in the FEM simulation. The estimated deformations for the manufacture of the part are shown in the Figure 9. The largest deformations are in the lower part of the curved zone and in the largest straight surface. This results then compare with the real time measuring techniques discussed in next section.

3.3. Measurement of Final Part Deformation

Once the GMAW manufacturing process of the molded part was completed, a measurement of its geometry was performed by an external company. As can be seen in the Figure 10, where the measured reference points are shown as black points against the predicted surface, the final part is within tolerances. Once the machining process (finishing) has been carried out, a fully functional final part would be obtained. The main sources of divergence between the measurement of the real part and the predictions of the simulated part are: (i) deformations and relaxations of the substrate that affect the geometry, (ii) transport and handling of the part and finally, (iii) wire-arc additive manufactured walls have a wavy surface, as it can be seen in Figure 5 and Figure 6, that infers large variations in the measurements.

4. Discussion

Comparison of the Results Predicted by the Model and the Final Part Measurements

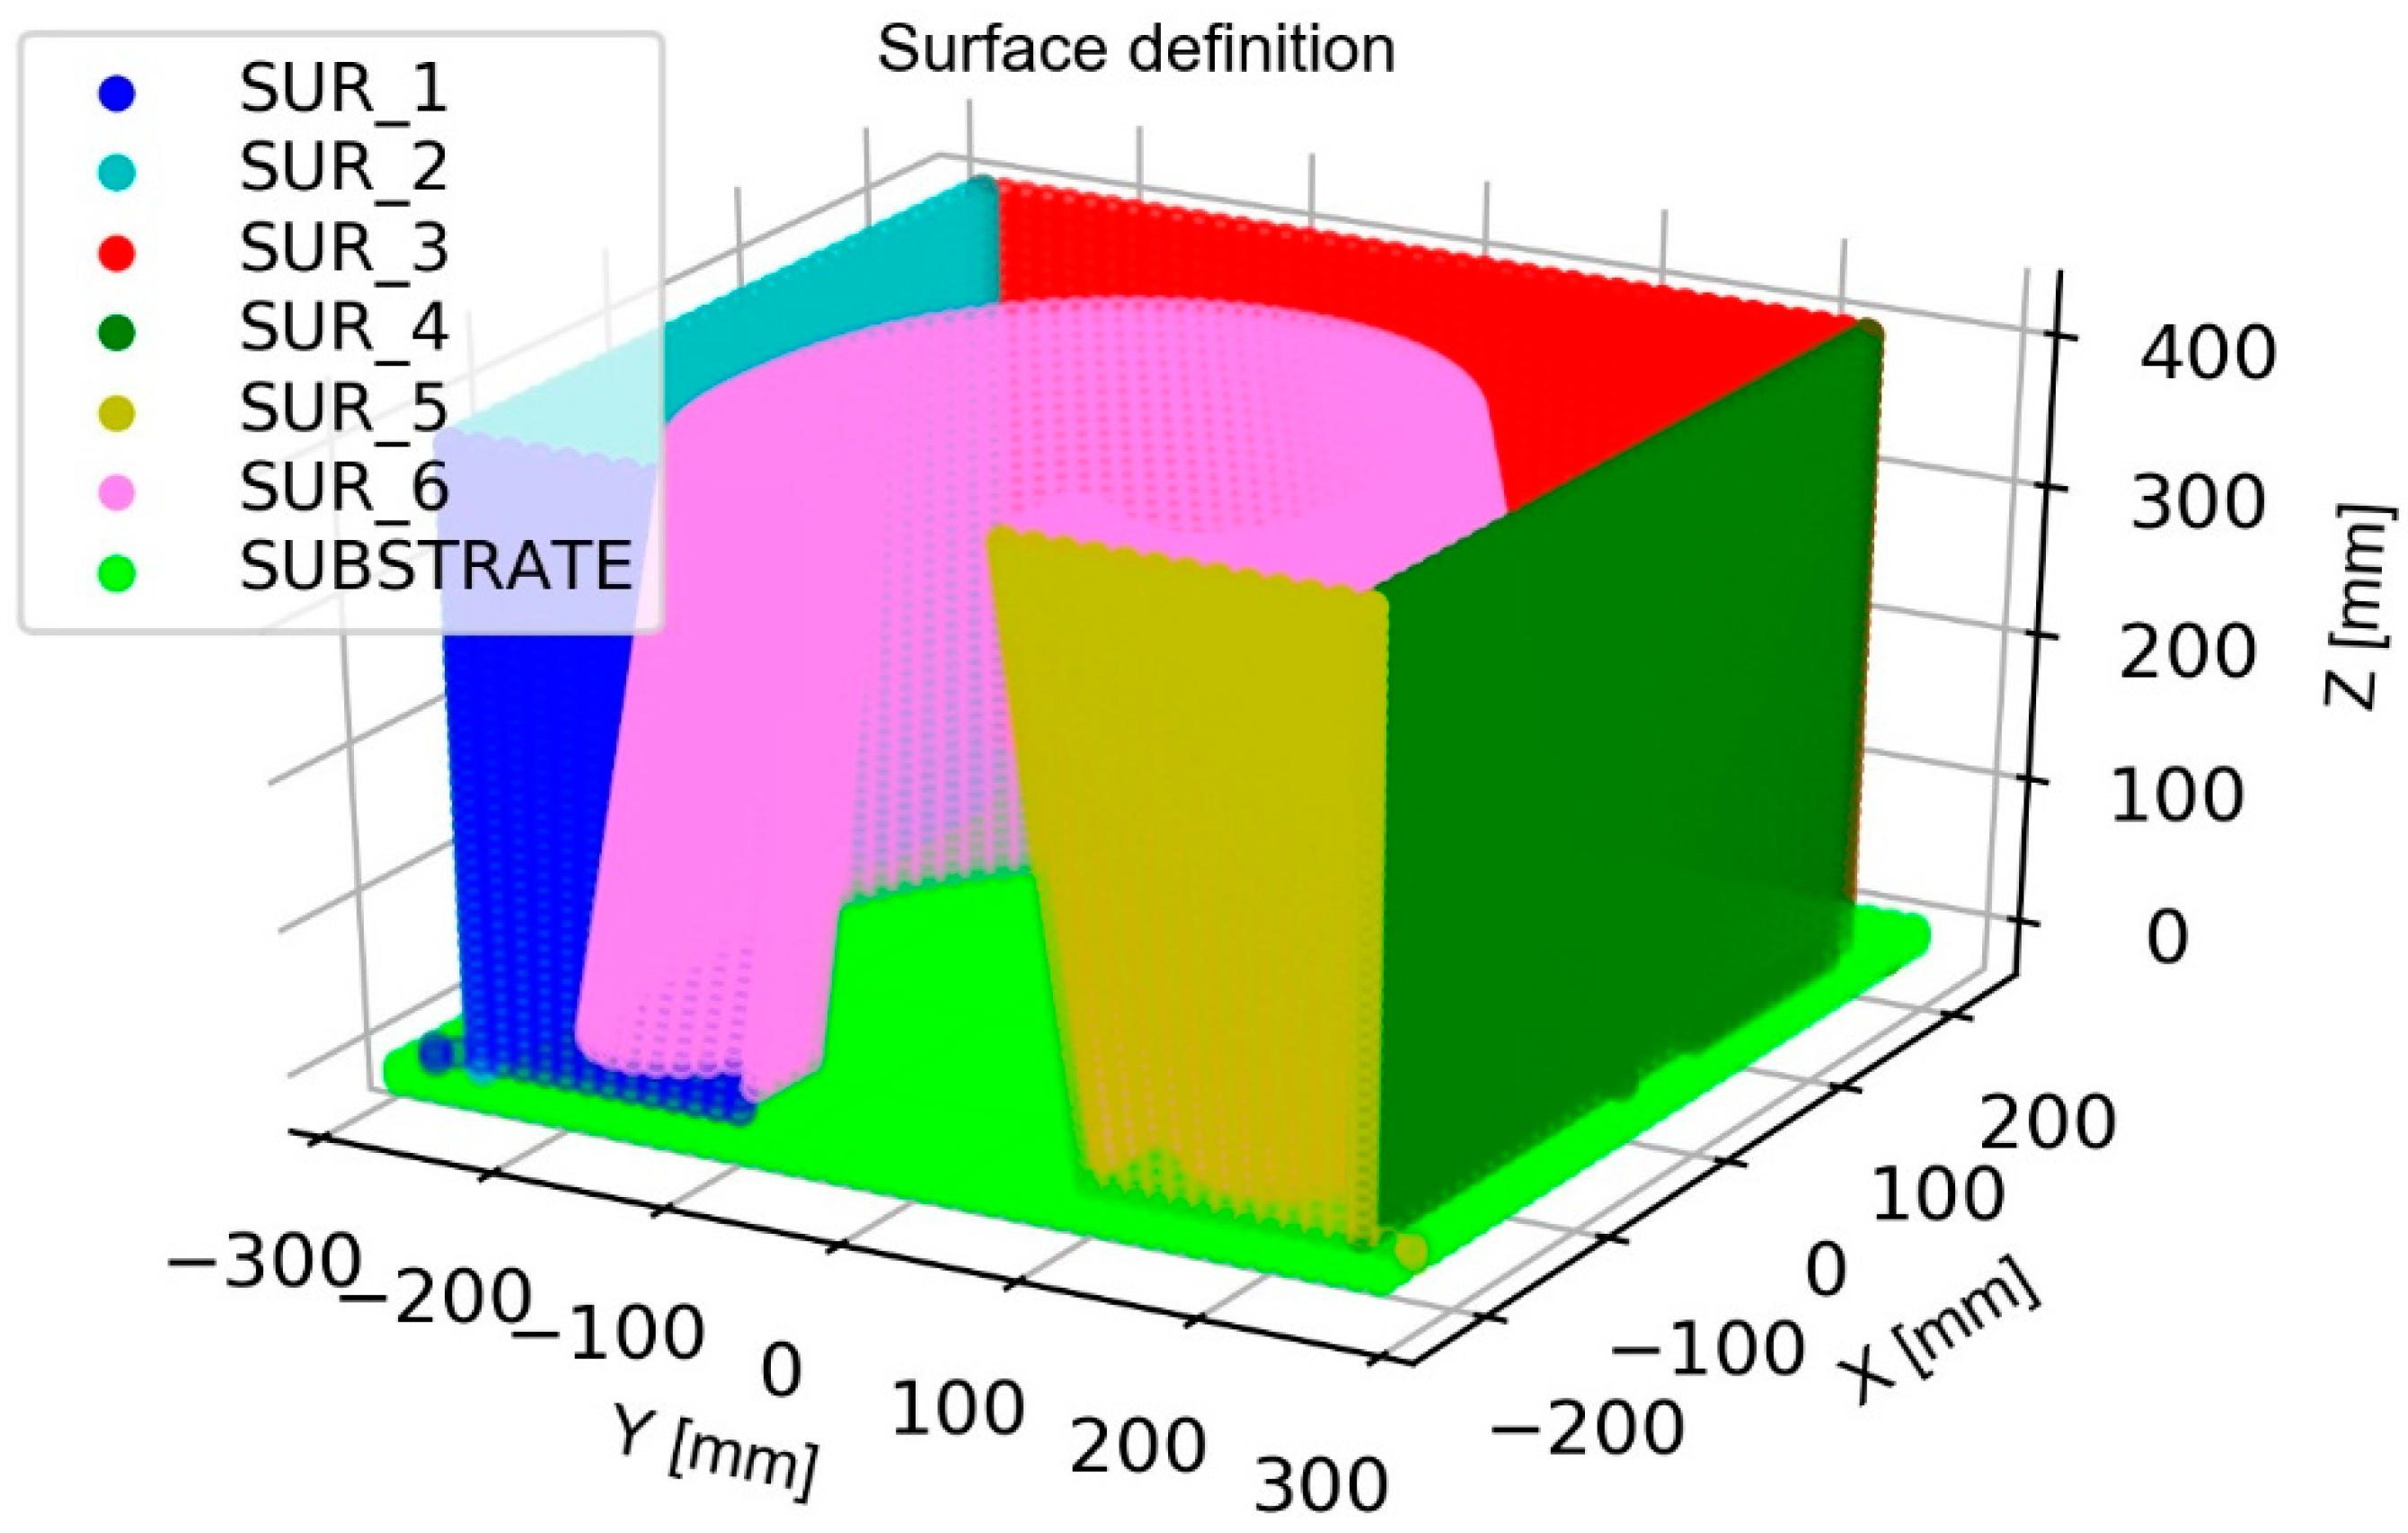
For a more detailed comparison of the measurements made with the results of the model, the part has been divided into different reference surfaces. With divided surfaces, as it can be seen on Figure 11, it is needed to focus on surface to surface. By calculating the distances between points according to Equation (4), the four points of the original surface closest to the measurement points are found.
These points will be the same as those taken on the deformed surface to compare with the measured points. Being P1 with coordinates (x1, y1, z1) and P2 with coordinates (x2, y2, z2), Equation (4) measures the modulus of the distance between the points.
d ( P 1 , P 2 ) = ( x 2 x 1 ) 2 + ( y 2 y 1 ) 2 + ( z 2 z 1 ) 2
With the selected points of both the original surface and the simulated deformed surface the equation of the plane that contain the point can be calculated. Then, the distance from the measurement point to the plane is calculated according to Equation (3). given the point P (x0, y0, z0) and the plane π: Ax + By + Cz + D = 0.
d ( P , π ) = | Ax 0 + By 0 + Cz 0 + D | A 2 + B 2 + C 2
This produces a csv file that includes the distances between the measured points and the original surface, the deformed surface and the original and the measured points and the deformed surface.
In addition, the YZ or XZ plane has been plotted according to the case of the flat surfaces of the part in the case of the measured points and the deformed surface, mapping the color as a function of the value of the remaining coordinate.
Among the analyzed surfaces, what happened on surface 1 and 3 is highlighted because it reflects what happens on all other surfaces (see Figure 11).
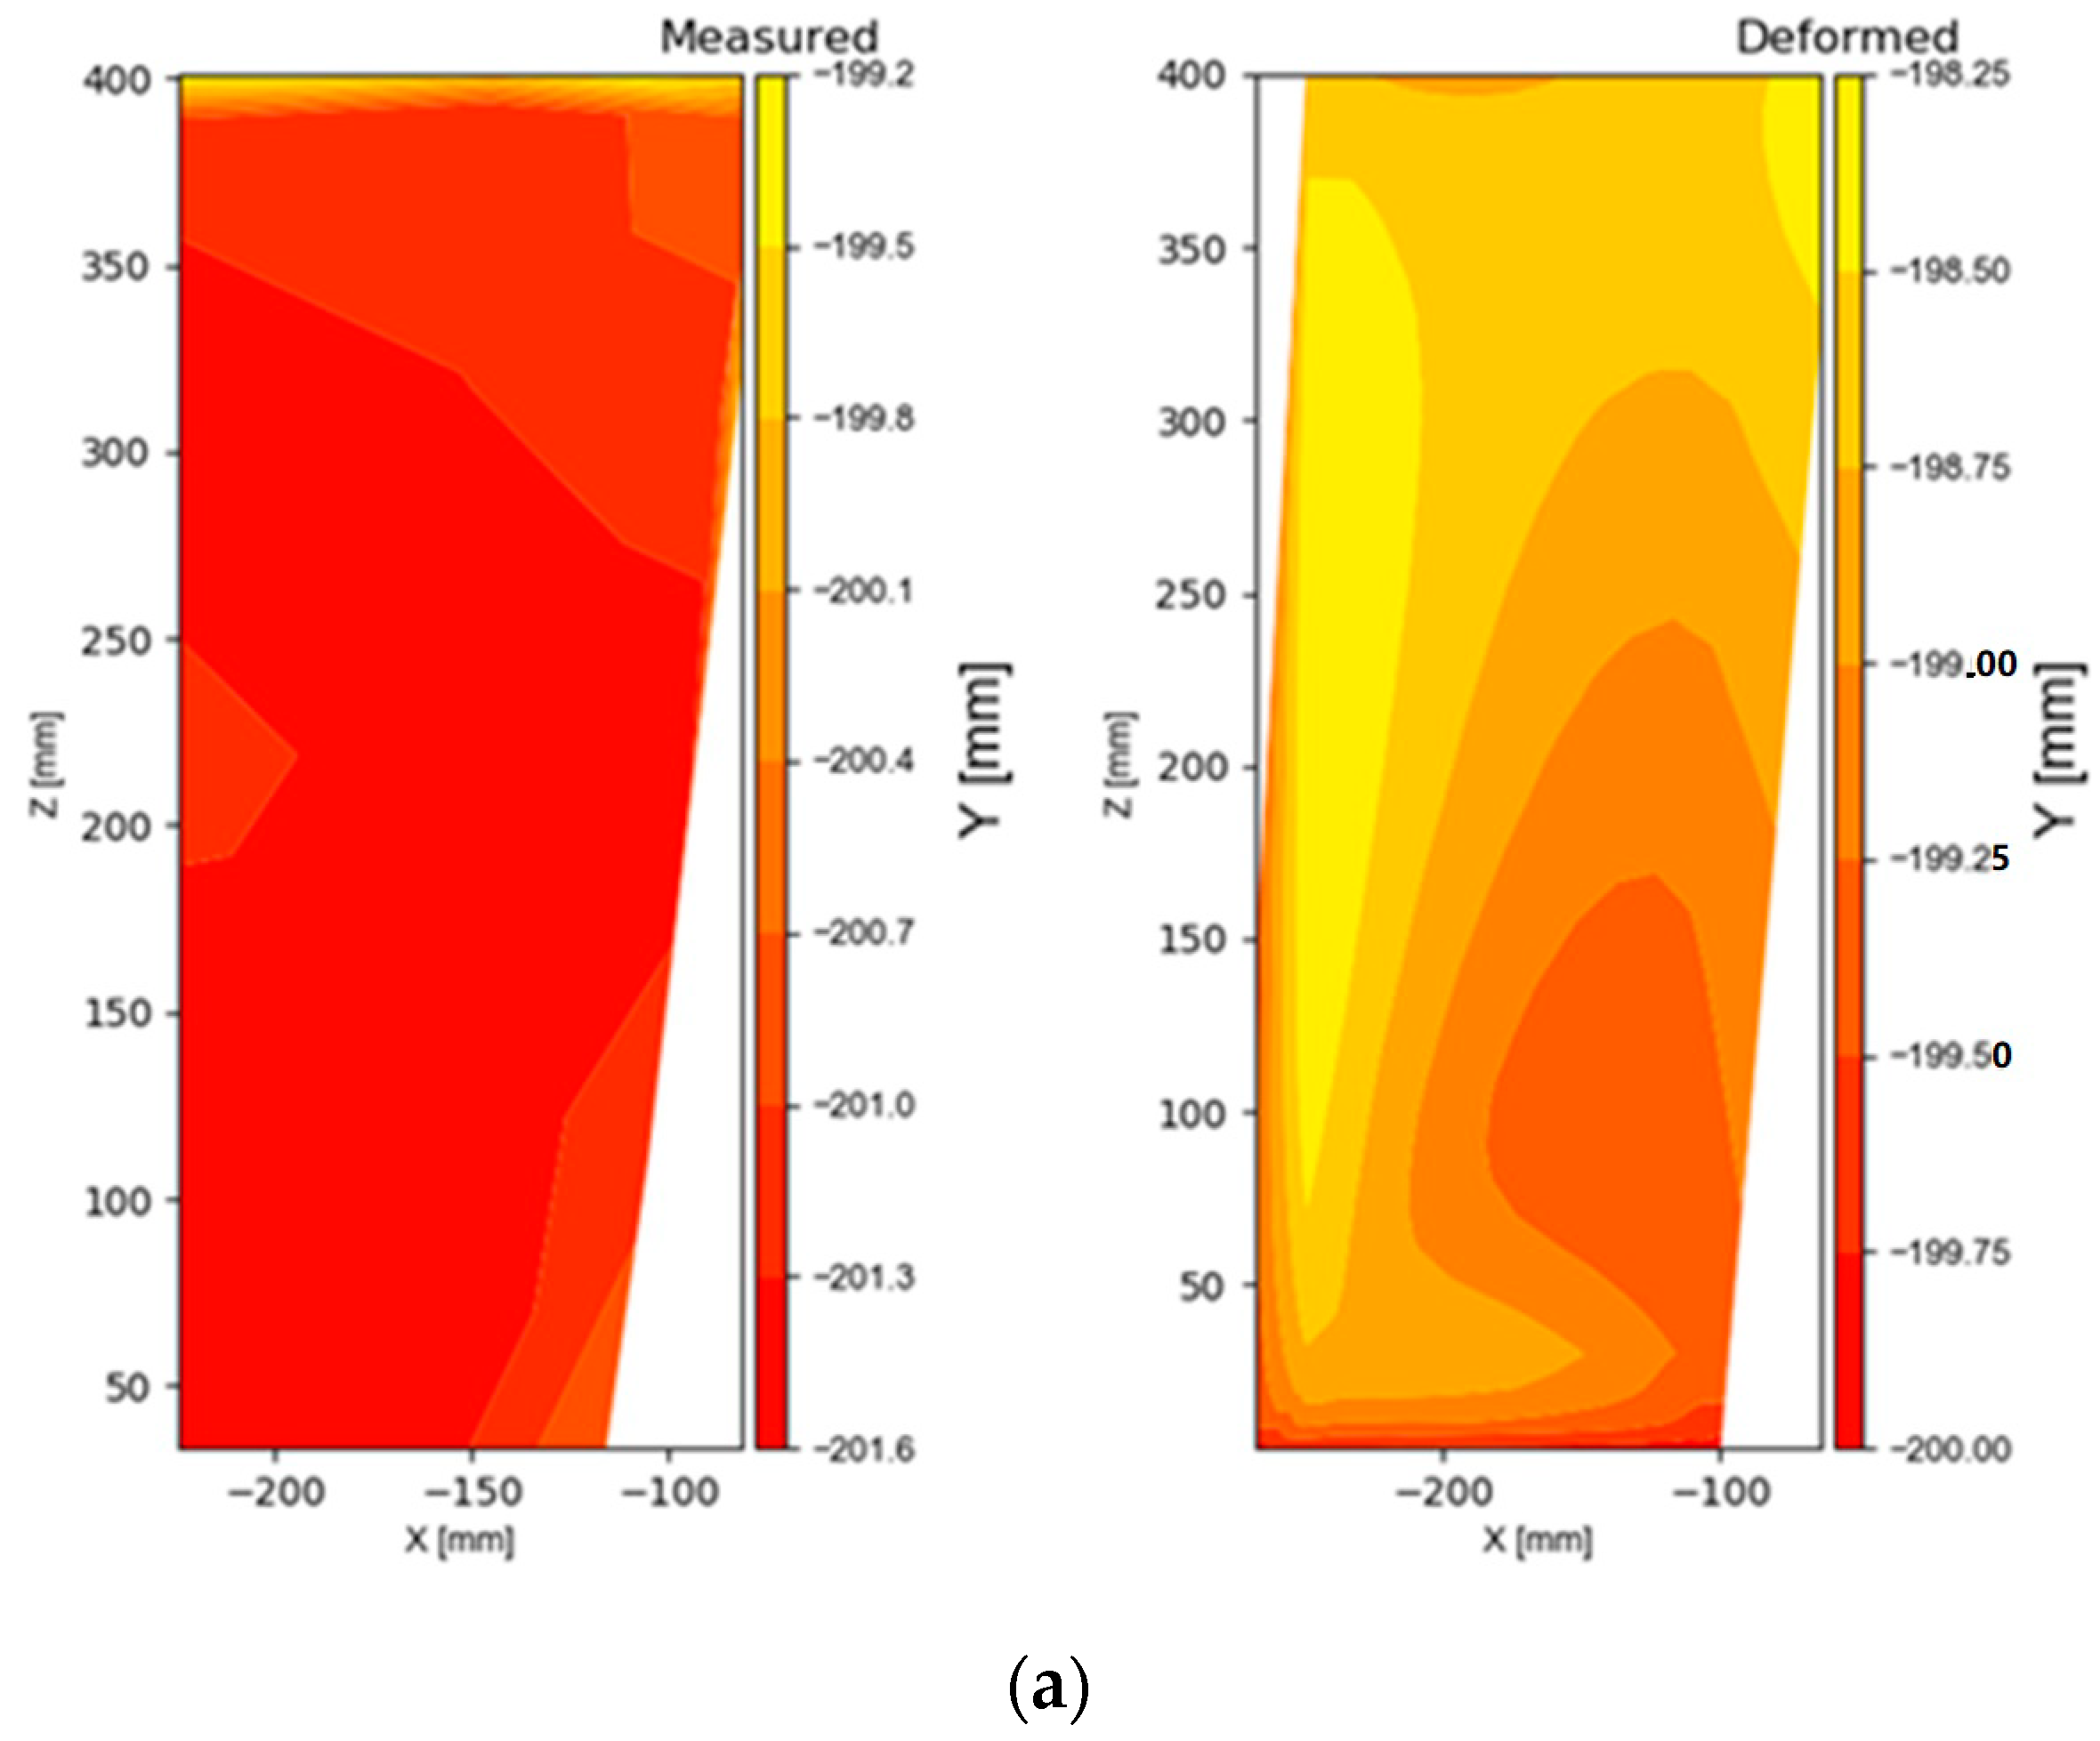
Going in further detail into surface 1 (Figure 12a), something similar is observed; quantitatively the simulation does not exactly predict the displacement, but the way in which this wall deforms. In the real case, the lower part of the wall deforms outwards, and the upper part moves slightly towards the inside of the piece. In the simulation, the displacement of the lower part is not appreciated, but the deformation of the upper part towards the interior of the part is.
While the simulated and the real surface 3 quantitatively differs. The way in which this wall has been deformed is similar in the real case and the simulated one, as seen in Figure 12b, so qualitatively could be accepted. It is observed that the lower central part enters towards inside the part and the upper part deforms outwards. The simulation shows good agreement on distortion tendency compared to the results of experiment with relative percentage error up to only 20%.

5. Conclusions

This paper has presented a model for the prediction of deformations in a thin-walled mold part manufactured by means of WAAM technology. The main novelty presented by this article is the holistic vision of additive manufacturing by WAAM, with the use of finite element models to assist in the prediction of temperatures and deformations in the final part. The conclusions that can be obtained from this work are the following:
  • The methodology for the manufacture of a mold piece by means of GMAW-WAAM technology with the combination of two transfer methods Cold-Arc and pulsed-GMAW has been presented.
  • The deposition conditions ensure good metallographic quality and mechanical properties like those given by the supplier of the wire material.
  • The finite element model predicts the process temperature. The adjustment of the predicted values with the temperature measured by means of pyrometric techniques shows accurate fitting. Results show deviation of less than a 5% in the temperature prediction.
  • The deformation prediction model allows to know qualitatively the deformation mode of the part. Qualitatively the results are correct but can be improved, due to the external sources of error described. The surface waviness of the part manufactured, which reaches 2 mm from peak to valley, is one of most important.
  • Finally, this paper has covered the purpose of prospecting the application of finite element simulation models for the prediction of deformations in thin-walled parts manufactured by WAAM technology.

Author Contributions

Conceptualization, M.C.; Data curation, F.V., T.B., T.A. and J.A.; Formal analysis, M.C., F.V. and E.A.; Funding acquisition, A.S. and J.A.; Investigation, E.A.; Methodology, F.V.; Project administration, A.S.; Resources, A.S.; Supervision, A.S.; Validation, A.L.; Visualization, T.B. and T.A.; Writing—original draft, M.C., F.V. and T.B.; Writing—review & editing, A.S., E.A., J.A. and A.L. All authors have read and agreed to the published version of the manuscript.

Funding

This research was funded by the vice-counseling of technology, innovation and competitiveness of the Basque Government grant agreement kk-2019/00004 (PROCODA project) and the QUALYFAM project, through the ELKARTEK 2020 (KK-2020/00042) and the ADIFIX project funded by HAZITEK 2019 and 2020 (ZL-2019/00738, ZL-2020/00073) programs and the Spanish Government CDTI-Red Cervera Programme (EXP 00123730/IDI-20191162).

Institutional Review Board Statement

Not applicable.

Informed Consent Statement

Not applicable.

Data Availability Statement

Data available on request.

Acknowledgments

The authors also thank the company KEYTECH S.L. for its support when performing the tests.

Conflicts of Interest

The funders had no role in the design of the study; in the collection, analyses or interpretation of data; in the writing of the manuscript or in the decision to publish the results.

Nomenclature

E Energy
IIntensity
V Voltage
TSTravel speed
UTS Ultimate tensile strength
YSYield stress
qfPower density distribution in the front half of the heat source
qrPower density distribution in the rear half of the heat source
ffFraction of the heat deposited in the front half of the heat source
frFraction of the heat deposited in the rear half of the heat source
cfForward length of the heat source along the length of the layers
crRear length of the heat source along the length of the layers
aWidth of the heat source
bDepth of the heat source
QPower of the heat source
ηHeat source efficiency
d(P1, P2)Distance between two points
d(P, π)Distance between a point and a plane

References

  1. Teresa, A.; Suárez, A.; Veiga, F.; Braceras, I.; Tabernero, I.; Larrañaga, O.; Lamikiz, A. Wire arc additive manufacturing Ti6Al4V aeronautical parts using plasma arc welding: Analysis of heat-treatment processes in different atmospheres. J. Mater. Res. Technol. 2020, 9, 15454–15466. [Google Scholar]
  2. Cunningham, C.; Flynn, J.; Shokrani, A.; Dhokia, V.; Newman, S. Invited review article: Strategies and processes for high quality wire arc additive manufacturing. Addit. Manuf. 2018, 22, 672–686. [Google Scholar] [CrossRef]
  3. Rodrigues, T.A.; Duarte, V.; Miranda, R.M.; Santos, T.G.; Oliveira, J.P. Current status and perspectives on wire and arc additive manufacturing (WAAM). Materials 2019, 12, 1121. [Google Scholar] [CrossRef] [PubMed] [Green Version]
  4. Lu, X.; Lin, X.; Chiumenti, M.; Cervera, M.; Hu, Y.; Ji, X.; Ma, L.; Yang, H.; Huang, W. Residual stress and distortion of rectangular and S-shaped Ti-6Al-4V parts by directed energy deposition: Modelling and experimental calibration. Addit. Manuf. 2019, 26, 166–179. [Google Scholar] [CrossRef]
  5. Wu, B.; Pan, Z.; Ding, D.; Cuiuri, D.; Li, H.; Xu, J.; Norrish, J. A review of the wire arc additive manufacturing of metals: Properties, defects and quality improvement. J. Manuf. Process. 2018, 35, 127–139. [Google Scholar] [CrossRef]
  6. D’Alvise, L.; Chantzis, D.; Schoinochoritis, B.; Salonitis, K. Modelling of part distortion due to residual stresses relaxation: An aerOnautical case study. Procedia CIRP 2015, 31, 447–452. [Google Scholar] [CrossRef] [Green Version]
  7. Li, J.; Wang, S. Distortion caused by residual stresses in machining aeronautical aluminum alloy parts: Recent advances. Int. J. Adv. Manuf. Technol. 2017, 89, 997–1012. [Google Scholar] [CrossRef]
  8. Casuso, M.; Polvorosa, R.; Veiga, F.; Suárez, A.; Lamikiz, A. Residual stress and distortion modeling on aeronautical aluminum alloy parts for machining sequence optimization. Int. J. Adv. Manuf. Technol. 2020, 110, 1219–1232. [Google Scholar] [CrossRef]
  9. Tomaz, L.; Colaço, F.H.G.; Sarfraz, S.; Pimenov, D.Y. Investigations on quality characteristics in gas tungsten arc welding process using artificial neural network integrated with genetic algorithm. Int. J. Adv. Manuf. Technol. 2021, 113, 3569–3583. [Google Scholar] [CrossRef]
  10. Arora, H.; Kumar, V.; Prakash, C.; Pimenov, D.; Singh, M.; Vasudev, H.; Singh, V. Analysis of Sensitization in Austenitic Stainless Steel-Welded Joint. In Advances in Metrology and Measurement of Engineering Surfaces, Lecture Notes in Mechanical Engineering; Prakash, C., Krolczyk, G., Singh, S., Pramanik, A., Eds.; Springer: Singapore, 2021; pp. 13–24. [Google Scholar]
  11. Srivastava, S.; Garg, R.K.; Sharma, V.S.; Sachdeva, A. Measurement and mitigation of residual stress in wire-arc additive manufacturing: A review of macro-scale continuum modelling approach. Arch. Comput. Methods Eng. 2020, 1–25. [Google Scholar] [CrossRef]
  12. Ding, J.; Colegrove, P.; Mehnen, J.; Ganguly, S.; Almeida, P.S.; Wang, F.; Williams, S. Thermo-mechanical analysis of wire and arc additive layer manufacturing process on large multi-layer parts. Comput. Mater. Sci. 2011, 50, 3315–3322. [Google Scholar] [CrossRef] [Green Version]
  13. Ding, J.; Colegrove, P.; Mehnen, J.; Williams, S.; Wang, F.; Almeida, P.S. A computationally efficient finite element model of wire and arc additive manufacture. Int. J. Adv. Manuf. Technol. 2014, 70, 227–236. [Google Scholar] [CrossRef]
  14. Zhao, H.; Zhang, G.; Yin, Z.; Wu, L. Three-dimensional finite element analysis of thermal stress in single-pass multi-layer weld-based rapid prototyping. J. Mater. Process. Technol. 2012, 212, 276–285. [Google Scholar] [CrossRef]
  15. Cadiou, S.; Courtois, M.; Carin, M.; Berckmans, W.; Masson, P.L. Heat transfer, fluid flow and electromagnetic model of droplets generation and melt pool behaviour for wire arc additive manufacturing. Int. J. Heat Mass Transf. 2020, 148, 119102. [Google Scholar] [CrossRef]
  16. Osher, S.; Sethian, J.A. Fronts propagating with curvature-dependent speed: Algorithms based on Hamilton-Jacobi formulations. J. Comput. Phys. 1988, 79, 12–49. [Google Scholar] [CrossRef] [Green Version]
  17. Oyama, K.; Diplas, S.; M’Hamdi, M.; Gunnæs, A.E.; Azar, A.S. Heat source management in wire-arc additive manufacturing process for Al-Mg and Al-Si alloys. Addit. Manuf. 2019, 26, 180–192. [Google Scholar] [CrossRef]
  18. Rafieazad, M.; Ghaffari, M.; Nemani, A.V.; Nasiri, A. Microstructural evolution and mechanical properties of a low-carbon low-alloy steel produced by wire arc additive manufacturing. Int. J. Adv. Manuf. Technol. 2019, 105, 2121–2134. [Google Scholar] [CrossRef]
  19. Prado-Cerqueira, J.L.; Camacho, A.M.; Diéguez, J.L.; Rodríguez-Prieto, Á.; Aragón, A.M.; Lorenzo-Martín, C.; Yanguas-Gil, Á. Analysis of favorable process conditions for the manufacturing of thin-wall pieces of mild steel obtained by wire and arc additive manufacturing (WAAM). Materials 2018, 11, 1449. [Google Scholar] [CrossRef] [Green Version]
  20. Dttmann, A.; Gomes, J.D.O. Evaluation of additive manufacturing parts machinability using automated GMAW ER70S-6 with nodular cast iron. U. Porto J. Eng. 2021, 7, 88–97. [Google Scholar] [CrossRef]
  21. Wang, Q.; Qi, B.; Cong, B.; Yang, M. Output characteristic and arc length control of pulsed gas metal arc welding process. J. Manuf. Process. 2017, 29, 427–437. [Google Scholar] [CrossRef]
  22. Metallic materials—Tensile testing—Part 1: Method of test at room temperature. Met. Mater. 2020, 1–78, ISO 6892-1:2019. Available online: https://www.iso.org/standard/78322.html (accessed on 6 April 2021).
  23. Aldalur, E.; Veiga, F.; Suárez, A.; Bilbao, J.; Lamikiz, A. Analysis of the wall geometry with different strategies for high deposition wire arc additive manufacturing of mild steel. Metals 2020, 10, 892. [Google Scholar] [CrossRef]
  24. Aldalur, E.; Veiga, F.; Suárez, A.; Bilbao, J.; Lamikiz, A. High deposition wire arc additive manufacturing of mild steel: Strategies and heat input effect on microstructure and mechanical properties. J. Manuf. Process. 2020, 58, 615–626. [Google Scholar] [CrossRef]
  25. Zhang, H.; Zhang, G.; Cai, C.; Gao, H.; Wu, L. Fundamental studies on in process controlling angular distortion in asym-metrical double-sided double arc welding. J. Mater. Process. Technol. 2008, 205, 214–223. [Google Scholar] [CrossRef]
  26. MSC Mentat Marc. MARC User Guide; Version 2010; MSC Software Corporation: Santa Ana, CA, USA, 2010. [Google Scholar]
  27. Goldak, J.; Chakravarti, A.; Bibby, M. A new finite element model for welding heat sources. Met. Mater. Trans. A 1984, 15, 299–305. [Google Scholar] [CrossRef]
  28. Ferro, P.; Berto, F.; James, N. Asymptotic residual stress distribution induced by multipass welding processes. Int. J. Fatigue 2017, 101, 421–429. [Google Scholar] [CrossRef] [Green Version]
  29. Graf, M.; Pradjadhiana, K.P.; Hälsig, A.; Manurung, Y.H.P.; Awiszus, B. Numerical simulation of metallic wire arc additive manufacturing (WAAM). AIP Conf. Proc. 2018, 1960, 140010. [Google Scholar] [CrossRef]
  30. Abid, M.; Siddique, M. Numerical simulation to study the effect of tack welds and root gap on welding deformations and residual stresses of a pipe-flange joint. Int. J. Press. Vessel. Pip. 2005, 82, 860–871. [Google Scholar] [CrossRef]
Figure 1. Mold design: main dimensions of the part.
Metals 11 00678 g001
Figure 2. Set-up of the robotic system for the manufacture of parts with GMAW-based WAAM technology.
Metals 11 00678 g002
Figure 3. Path planning in PowerMill software.
Metals 11 00678 g003
Figure 4. Evolution of energy during the manufacture of the mold.
Metals 11 00678 g004
Figure 5. Set-up for the geometric verification of the part: (a) laser tacker and (b) reference points on the CAD part.
Metals 11 00678 g005
Figure 6. Macrograph and micros of a wall made of ER70 steel, at different heights.
Metals 11 00678 g006
Figure 7. Simulation of temperatures in the manufacturing process: (a) meshing of the original CAD model and (b) result of the prediction of temperatures in the i layer.
Metals 11 00678 g007
Figure 8. Temperature measured by the pyrometer installed in the torch during the additive process.
Metals 11 00678 g008
Figure 9. Deformations predicted by the finite element model for additive manufacturing of thin-walled part.
Metals 11 00678 g009
Figure 10. Measured outer surface points (black points) vs. predicted deformed surface from the model.
Metals 11 00678 g010
Figure 11. Volume division on reference surfaces.
Metals 11 00678 g011
Figure 12. Comparison of the surfaces between the measurements and the predictions of the model in (a) surface 1 and in (b) surface 3.
Metals 11 00678 g012aMetals 11 00678 g012b
Table 1. Chemical composition of ER70S-6 steel wire (% of the weight).
MnSiCCrCuNiSPMoTiZr
1.640.940.060.020.020.020.0160.0130.0050.0040.002
Table 2. Parameters used to Wire-Arc Additive Manufacture the mold.
Program NumberMaterialDensity (kg/m3)Material SustrateWire Diameter (mm)ModeJob NumberWire Feed (m/min)Deposition Rate (kg/h)Stick Out (mm)Travel Speed (cm/min)Bead Width (mm)Stimated Height (mm)
N# 1ER70S-67850S235JR1.2Cold Arc19452.6617507.21.6
N# 2ER70S-67850S235JR1.2Pulsed-GMAW952.6617507.21.6
N# 3ER70S-67850S235JR1.2Pulsed-GMAW952.6617657.21.3
Table 3. Summary of mechanical characterization on the sample walls.
MaterialDirectionTensile TestVickers Test
UTS (MPa)YS 0.2% (MPa)Elong. (%)Hardness [HV]
WAAM sample wallHorizontal498 ± 9368 ± 1236 ± 4151 ± 9
Vertical501 ± 3368 ± 432 ± 1
ER70 as welded-500–640>42028
Publisher’s Note: MDPI stays neutral with regard to jurisdictional claims in published maps and institutional affiliations.