Article

Effect of Corrosion Time on the Synergistic Corrosion of Q235 Steel in Sodium Aluminate Solutions

1
College of Materials and Metallurgy, Guizhou University, Guiyang 550025, China
2
Guizhou Province Key Laboratory of Metallurgical Engineering and Process Energy Saving, Guiyang 550025, China
*
Author to whom correspondence should be addressed.
Metals 2021, 11(5), 753; https://doi.org/10.3390/met11050753
Submission received: 25 March 2021 / Revised: 27 April 2021 / Accepted: 27 April 2021 / Published: 2 May 2021

Abstract

:
During Bayer alumina production with high-sulfur bauxite, the sulfide ions in the sodium aluminate solution caused serious corrosion to Q235 steel, which is the material of the tank equipment. This study investigates the effect of corrosion time on Q235 steel synergistic corrosion in sodium aluminate solution using the weight-loss method and electrochemical measurements. The results indicate that the corrosion rate decreases sharply, the rate equation satisfies the mathematical model of power function at the initial stage of corrosion, and the transformation of unstable iron sulfide to stable iron oxide at the later stage results in the decrease in sulfur content in the corrosion products and surface pseudo-passivation. There are two main types of corrosion products, as follows: one is the octahedral crystal particle, which is composed of Fe2O3, Fe3O4, Al2O3 and NaFeO2, and the other is the interlayer corrosion between the surface layer and the matrix, which is composed of FeS, FeS2 and MnS2. At day 3, the dynamics of the Q235 steel electrode is controlled by charge transfer and ion diffusion. However, at other times the dynamics are mainly controlled by charge transfer.

1. Introduction

High-sulfur bauxite is a general term for bauxite with a sulfur content greater than 0.7% [1]. The reserves of diaspore high-sulfur bauxite in China are about 140 million tons, of which 57.2% are high-grade bauxite and 42.8% are middle–low grade [2]. More than 60% of high-sulfur bauxite deposits in Guizhou, China, are high-quality bauxite resources [3]. The average alumina content is 68%, the average Al/Si reaches 10, and the average sulfur content is 1.0%. In general, the ratio of Al–Si reaches about 7.0, which is more suitable for Bayer alumina production and has a great economic value [4]. The study found that the sulfur of high-sulfur bauxite is mainly in the form of FeS2 [5,6]. S22−, S2− and S2O32− are mainly formed by FeS2 reacting with alkali liquor during the high-pressure leaching process [7]. These ionic forms of sulfur are prone to valence reactions and are called “active sulfur”, which can cause the corrosion of equipment material and other hazards to alumina production [8,9]. At present, the reaction tank and other equipment materials are made of traditional low-alloy steel or carbon steel in the Bayer alumina production in China. With the progress of production, the serious selective corrosion, pitting corrosion, corrosion cracking and uniform corrosion of steel were found [10]. Therefore, the large-scale use of high-sulfur bauxite to produce alumina is urgent to study the corrosion of sulfur on the tank material (carbon steel and low-alloy steel).
There is much less research referring to the corrosion of steel in sodium aluminate solutions as yet. Tromans (1985) believed that the presence of AlO2 inhibited the anodic dissolution of steel, and the surface of carbon steel formed amorphous Fe3−xAlxO4 due to the adsorption of aluminate ions [11]. Wu Zhigen et al. (1991) compared the corrosion rates of several steels by electrochemical methods [12], but there was no further report. Chen Wenmi et al. (2013) found that carbon steel exhibits a poor corrosion resistance in Bayer liquid since the active dissolved iron formed unstable iron sulfide on the surface. The corrosion is inhibited after the sulfides have been oxidized to an oxide form which is more stable and prevents sluggishness during the corrosion process [13]. The influence of several kinds of sulfur, co-existing in the sodium aluminate solution, on the corrosion behavior of steel was studied by an author in 2018 [14], and the results showed that there is a certain synergistic effect among several sulfur forms.
As we all know, alumina production has the characteristics of a long production cycle and a high temperature. Therefore, the equipment material will be seriously corroded by the corrosive medium (the sodium aluminate solution containing sulfur), resulting in serious damage to the mechanical properties of the material. Niskanen et al. (1982) [15] reported that the susceptibility to both local pitting and inter-granular corrosion increased with aging time. Jiang et al. (2005) [16] investigated the corrosion behavior of an Al–Cu–Li alloy by measuring both the average and maximum depths of inter-granular corrosion, and they found that the depth increased with aging time. Onyeachu et al. (2020) [17] found that the exposure time has positive effects in enhancing the corrosion resistance and efficiency of 2-(2-pyridyl) benzimidazole. Chen et al. (2020) [18] studied the corrosion processes and corrosion mechanisms of the samples during the immersion test in 3.5 mass% NaCl solution at different time intervals. Rodrigues et al. (2020) [19] parameterized the sintering times, which aided in evaluating the effect of the intermetallic compound formed on the microstructural array. However, up to now, there are very few systematic reports on the influence of corrosion time on the corrosion behavior of carbon steel in literature, and the corrosion mechanism is still unclear.
This paper employed the weight-loss method using a scanning electron microscope (SEM), an energy dispersive spectrometer (EDS), X-ray powder diffraction (XRD), atomic force microscopy (AFM) and electrochemical measurements to reveal the corrosion kinetics and corrosion mechanism of Q235 steel. The main purpose is to systematically investigate the influence of corrosion time on the corrosion behavior of Q235 steel, and this will provide a theoretical basis for the material protection of alumina production equipment.

2. Experimental Procedures

2.1. Specimens and Experimental Solutions

The Q235 steel used in this study is composed of 0.197% C, 0.055% Si, 0.233% Mn, 0.069% P, 0.019% S, 0.105% Cr and Fe (bal.) (wt. %) (Shandong Zhensheng Metal Material Co., Ltd., Liaocheng Shandong, China). The Q235 steel was machined into a cuboid with a length of 15 mm, a width of 15 mm and a height of 1.0 mm. Before each experiment, the exposed specimen’s surface was gradually ground with SiC sandpaper from 600 grit to 1800 grit and then cleaned in acetone and distilled water.
The corrosion solution is the sulfur-containing sodium aluminate solution (pH > 14) in the experiments, which simulates the evaporation process conditions of alumina production. The sodium aluminate solution contained dissolved alumina (as Al2O3) and NaOH, and was prepared from high-purity chemicals and deionized water in a three-necked, round-bottomed flask at 80–90 °C by magnetic stirring (Henan Yuhua Instrument Co., Ltd.). The chemical composition of the sulfur-containing sodium aluminate solutions used to simulate the sulfide ion concentration (S2− and S2O32−) and the alkali concentration in the evaporation processes is shown in Table 1. Alumina (Al2O3·3H2O) reacts with NaOH to form sodium aluminate (NaAlO2) as shown in Equation (1) [13]. Among them, S2− and S2O32 of the sodium aluminate solution can be obtained by dissolving Na2S·9H2O and Na2S2O3·5H2O. The chemicals used in the experiment came from Aladdin. The freshly prepared solution is necessary before each experiment.
Al 2 O 3 + 2 NaOH = 2 NaAlO 2 + H 2 O

2.2. Immersion Experiments

All of the corrosion experiments with different corrosion times (1 day, 2 days, 3 days, 4 days, 5 days, 7 days, 9 days, 11 days or 13 days) (d) were carried out in the autoclave (Weihai Zhengwei Machinery Equipment Co., Ltd.) at 383 K (Figure 1). Five Q235 coupons were used in each experiment. Three coupons were used to measure the weight change in order to ensure the reproducibility of the data, while the others were used for morphology observation and phase composition, respectively. The corrosion experiments started when the required experiment conditions were met. Finally, the corroded steel coupons were immersed into a solution composed of 500 mL distilled water, 500 mL HCl and 10 g hexamethylenetetramine (GB/T 6074-1992) at room temperature for the constant weight of the sample to remove the corrosion products. The corrosion rate (R) (mm·a−1) was evaluated using the weight-loss method [20,21], “a” in mm·a-1 refers to the year.

2.3. Surface Analysis

The morphology and element compositions of the corrosion products were examined by scanning electron microscopy (SEM, ZEISS SUPRA 40, Jena, Germany), with 10 KV acceleration voltage and the electron type was a secondary electron, and energy dispersive spectroscopy (EDS, AZ tec., Oxford, UK). The crystalline structure of the corrosion products was investigated by X-ray diffraction (XRD, X’pert Pro MPD Panalytical, The Netherlands) with monochromated Cu Ka radiation at the 2θ range of 10°–80°. The software HighScore Plus (Panalytical, Almelo, The Netherlands) was selected to analyze the data. An atomic force microscope (AFM, Dimensio, Bruker) was used to observe the roughness and morphology of the corrosion products after different times (1 d, 3 d or 5 d) in 110 g/L sodium aluminate solution containing 5 g∙L−1 S2− and 3 g∙L−1 S2O32−. The AFM images were analyzed using Digital Nanoscope software (V5.30), and the root mean square roughness (Rq) was used (GB/T 31227-2014).

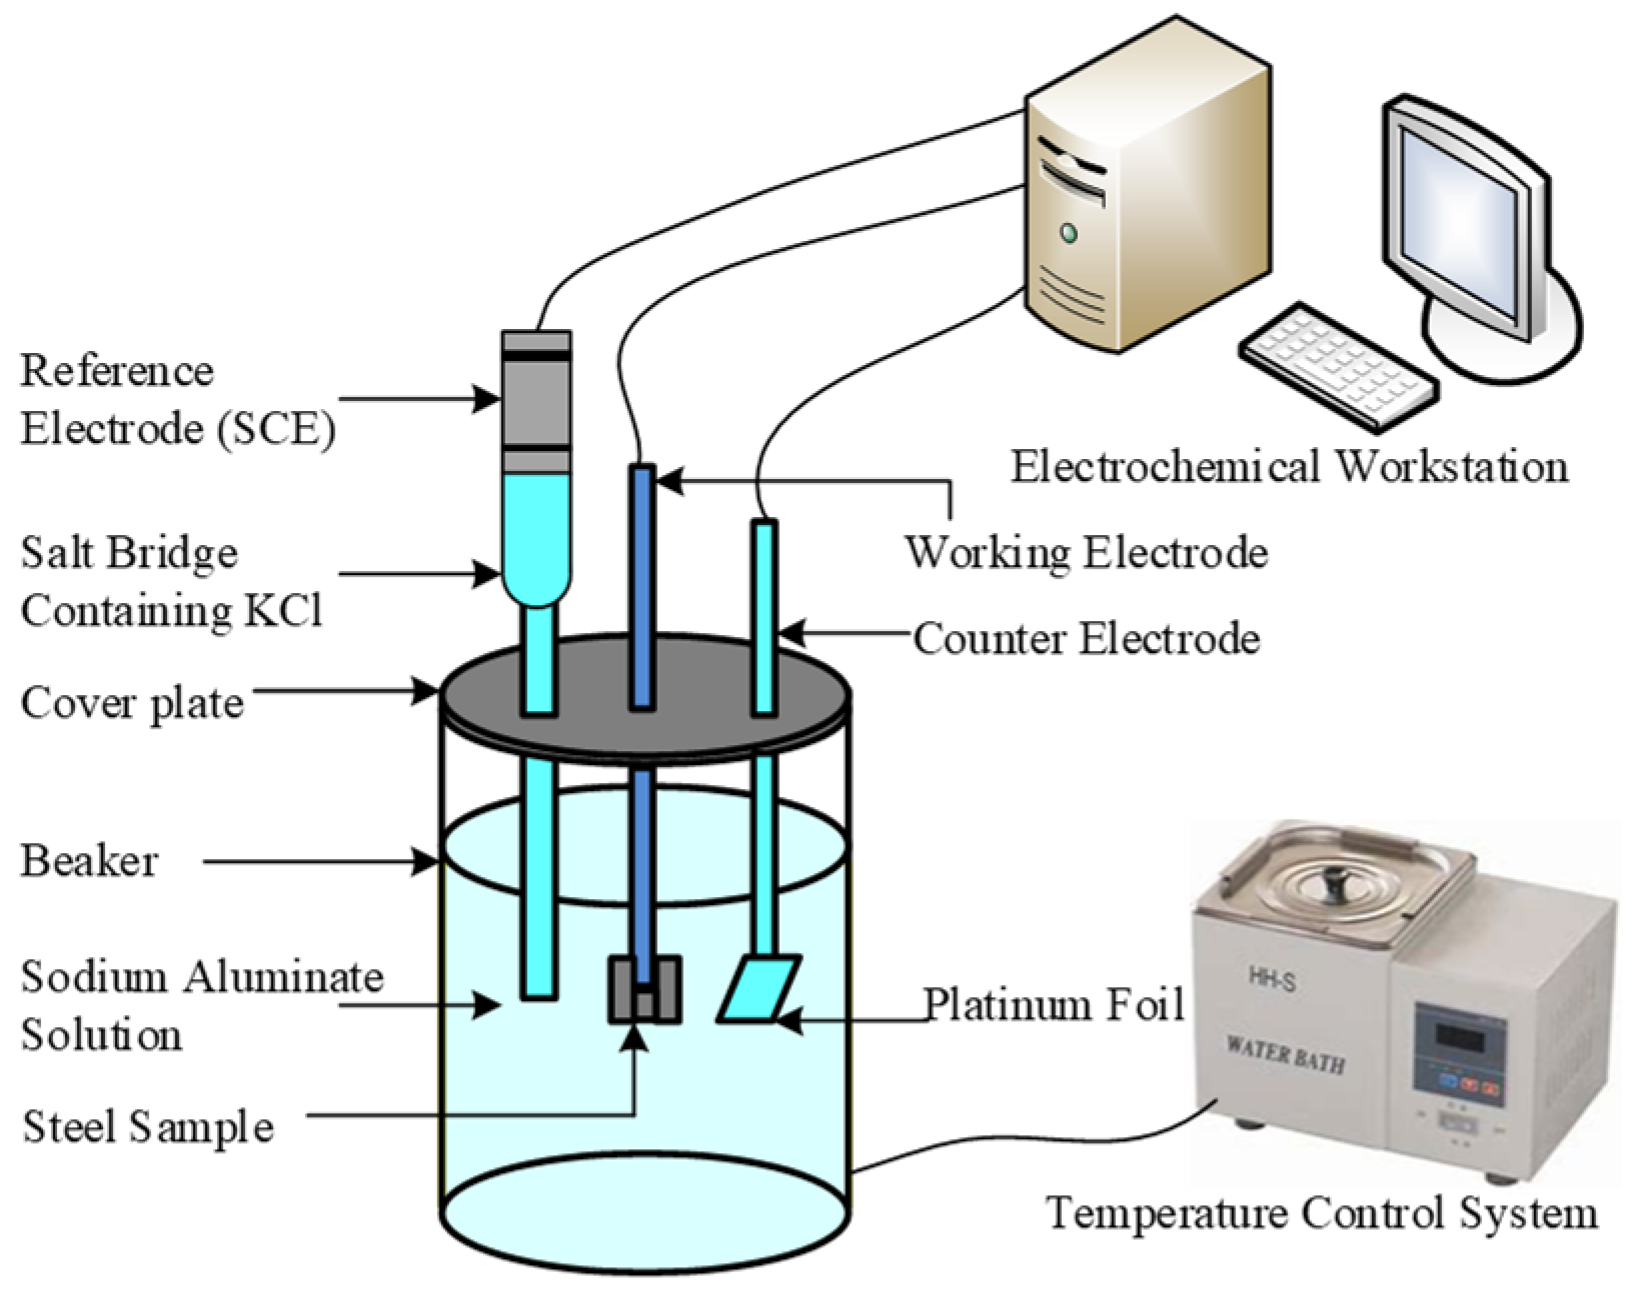
2.4. Electrochemical Measurements

The electrochemical measurements were carried out on an electrochemical workstation (Boi-Logic SAS, France) with a conventional three-electrode polytetrafluoroethylene (PTFE) cell. The counter electrode was a platinum electrode (10 × 10 × 0.1 mm, Beijing, Jingke), the reference electrode was a saturated calomel electrode (SCE, Lei Magnetic, Shanghai, China), and the working electrode was Q235 steel with exposed areas of about 2.25 cm2 (Figure 2). The SCE needed to work at temperatures less than 333 K. So, the cell was placed in a water bath to maintain the experiment temperature (338 K). Before the electrochemical experiment, the working electrodes were soaked in the corrosion solution at 368 K for different times (1 d, 2 d, 3 d, 4 d or 5 d). The electrochemical impedance spectrum (EIS) was carried out at open circuit potential (OCP) at a frequency between 105 Hz and 10–2 Hz, and the amplitude of the AC signal was 5 mV. All the potentials reported in this paper were measured with respect to the SCE, which was connected to the cell through a Luggin capillary tip arrangement and a salt bridge to avoid amplification of the electrolyte from constituents of the reference electrode. The impedance spectra were fitted by ZView (3.0a) software (2015) and the equivalent circuits (EC) were also considered. The potentiodynamic polarization measurements with a potential scan rate of 1 mV·s−1 were performed vs. OCP, and the potential ranged from −1.50 V vs. SCE to 1.50 V vs. SCE. The current density limit was 0.1 A·cm−2. Tafel extrapolation was also determined at the open circuit potential. The electrochemical parameters such as the corrosion potentials (Ecorr) and corrosion current densities (Icorr) were obtained.

3. Results and Discussion

3.1. Characteristics of Corrosion Products

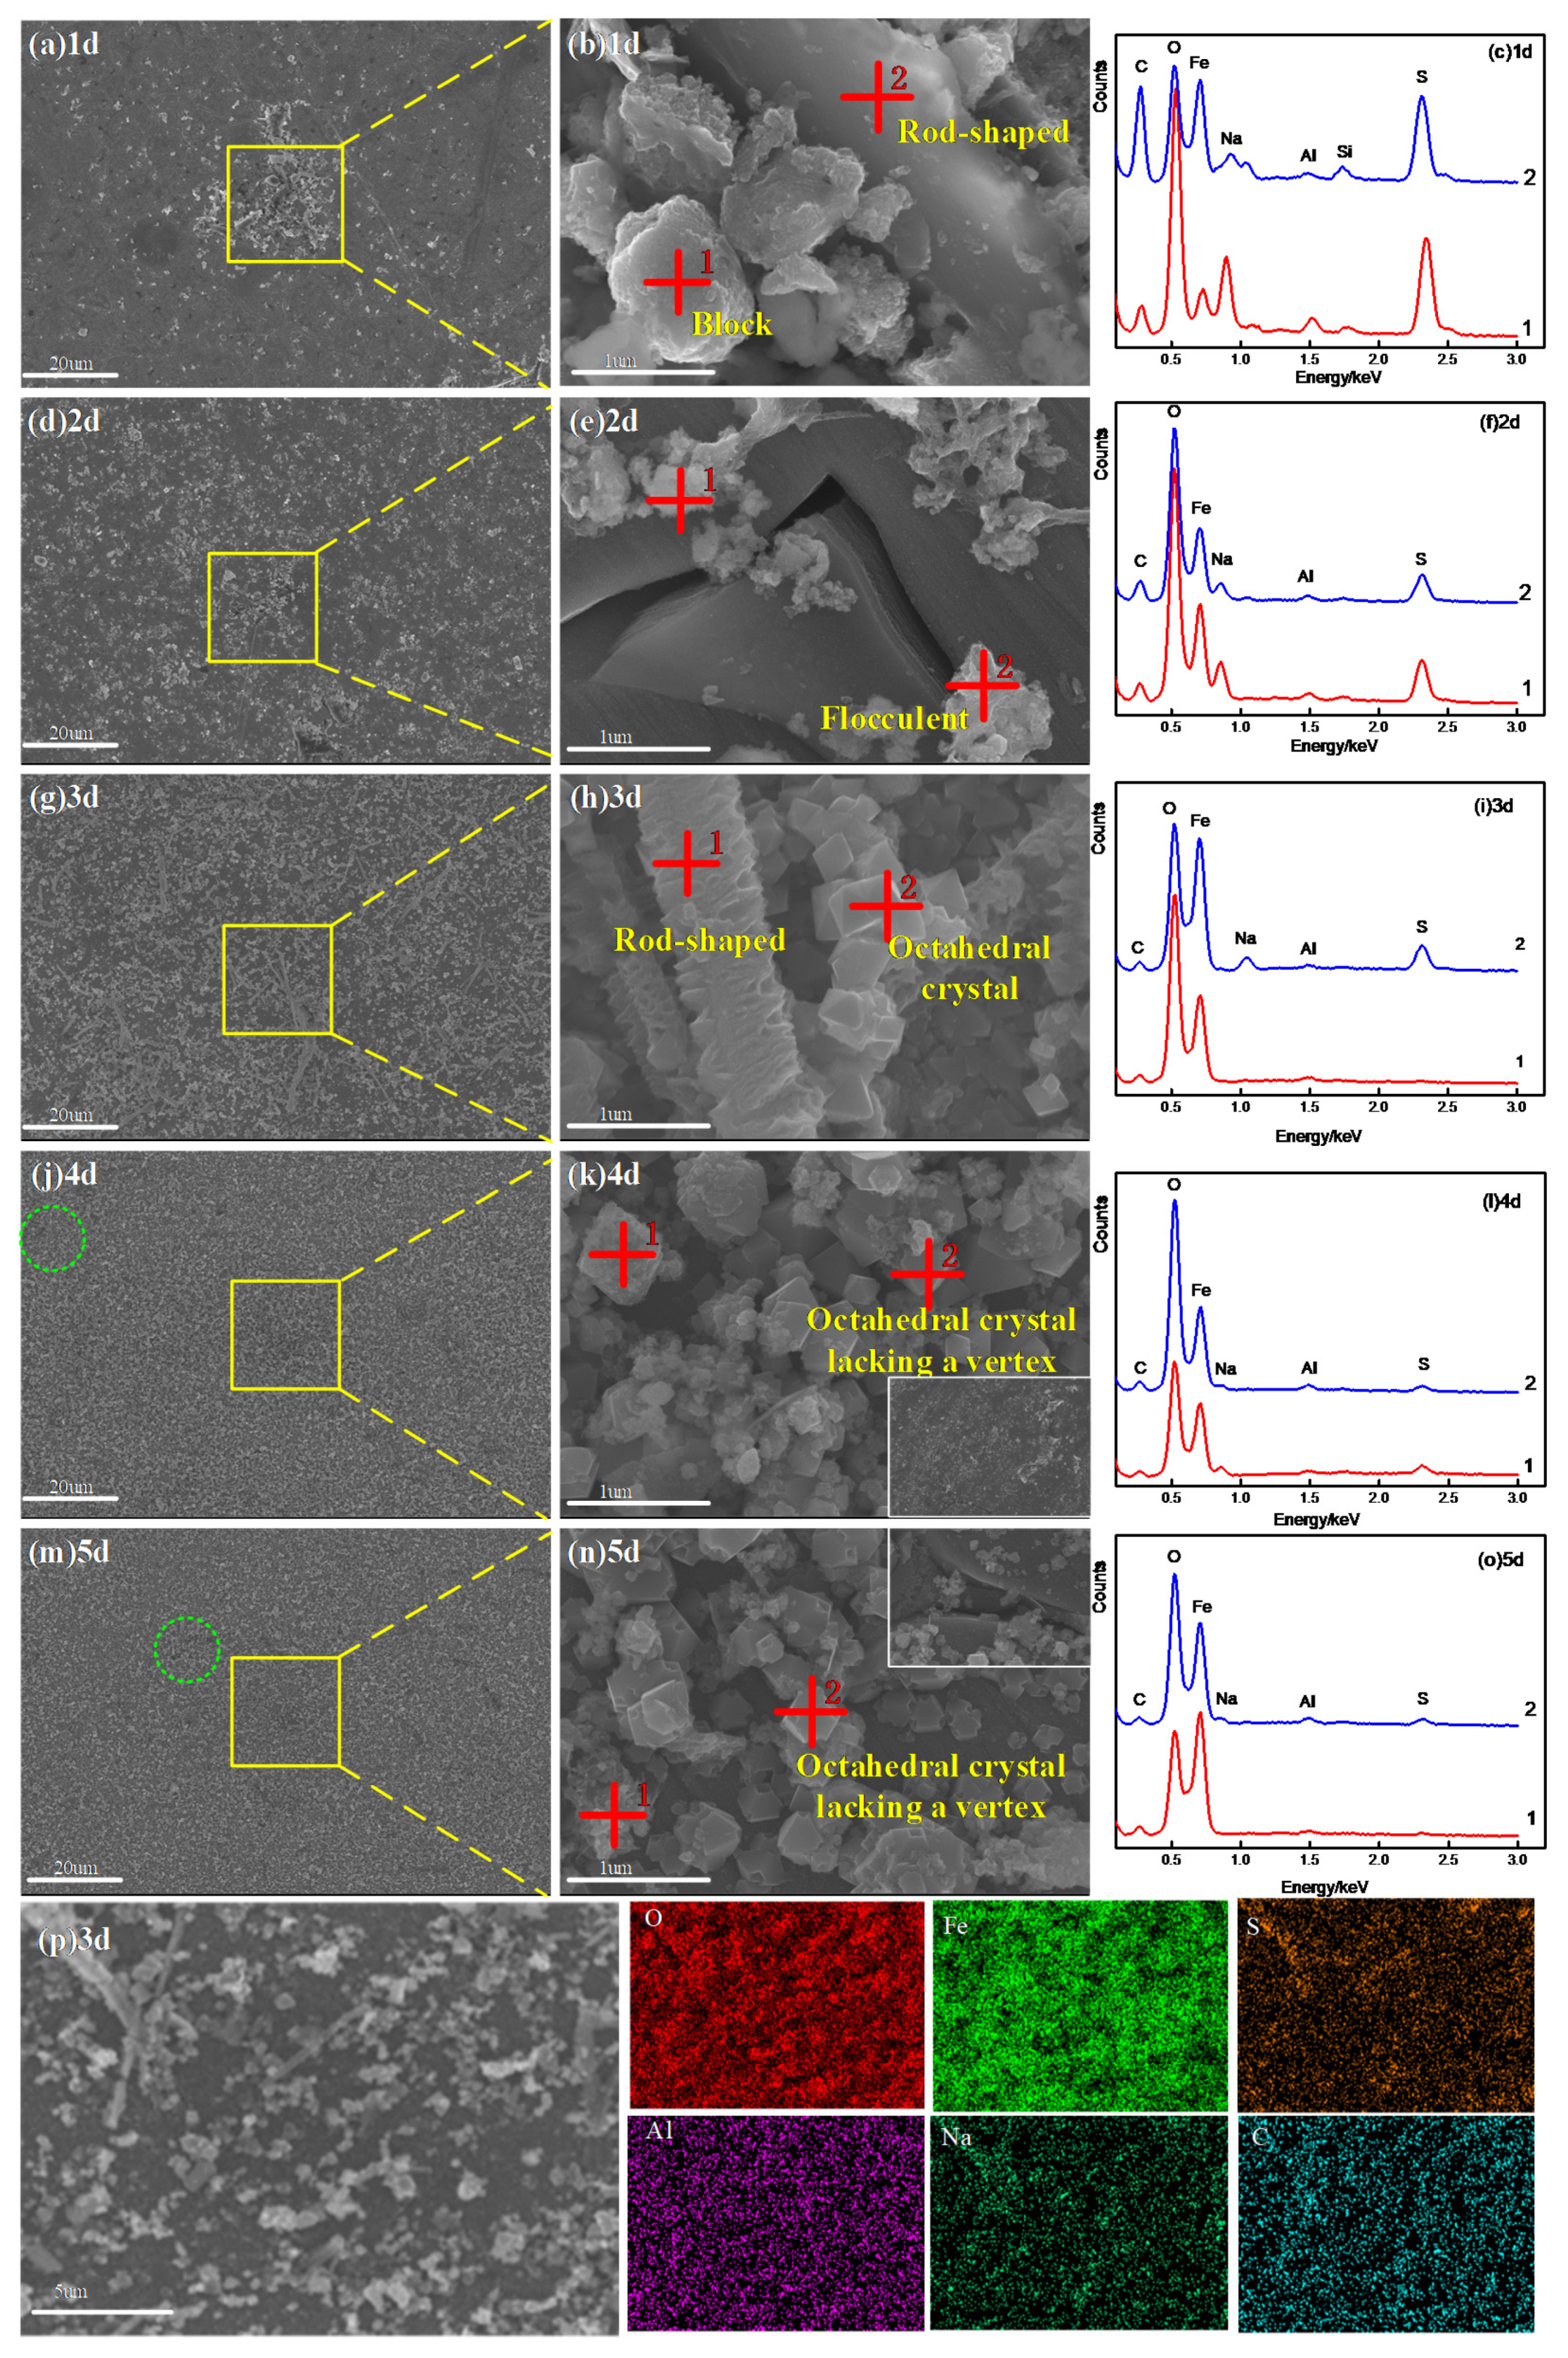
3.1.1. Morphology and Composition Analysis
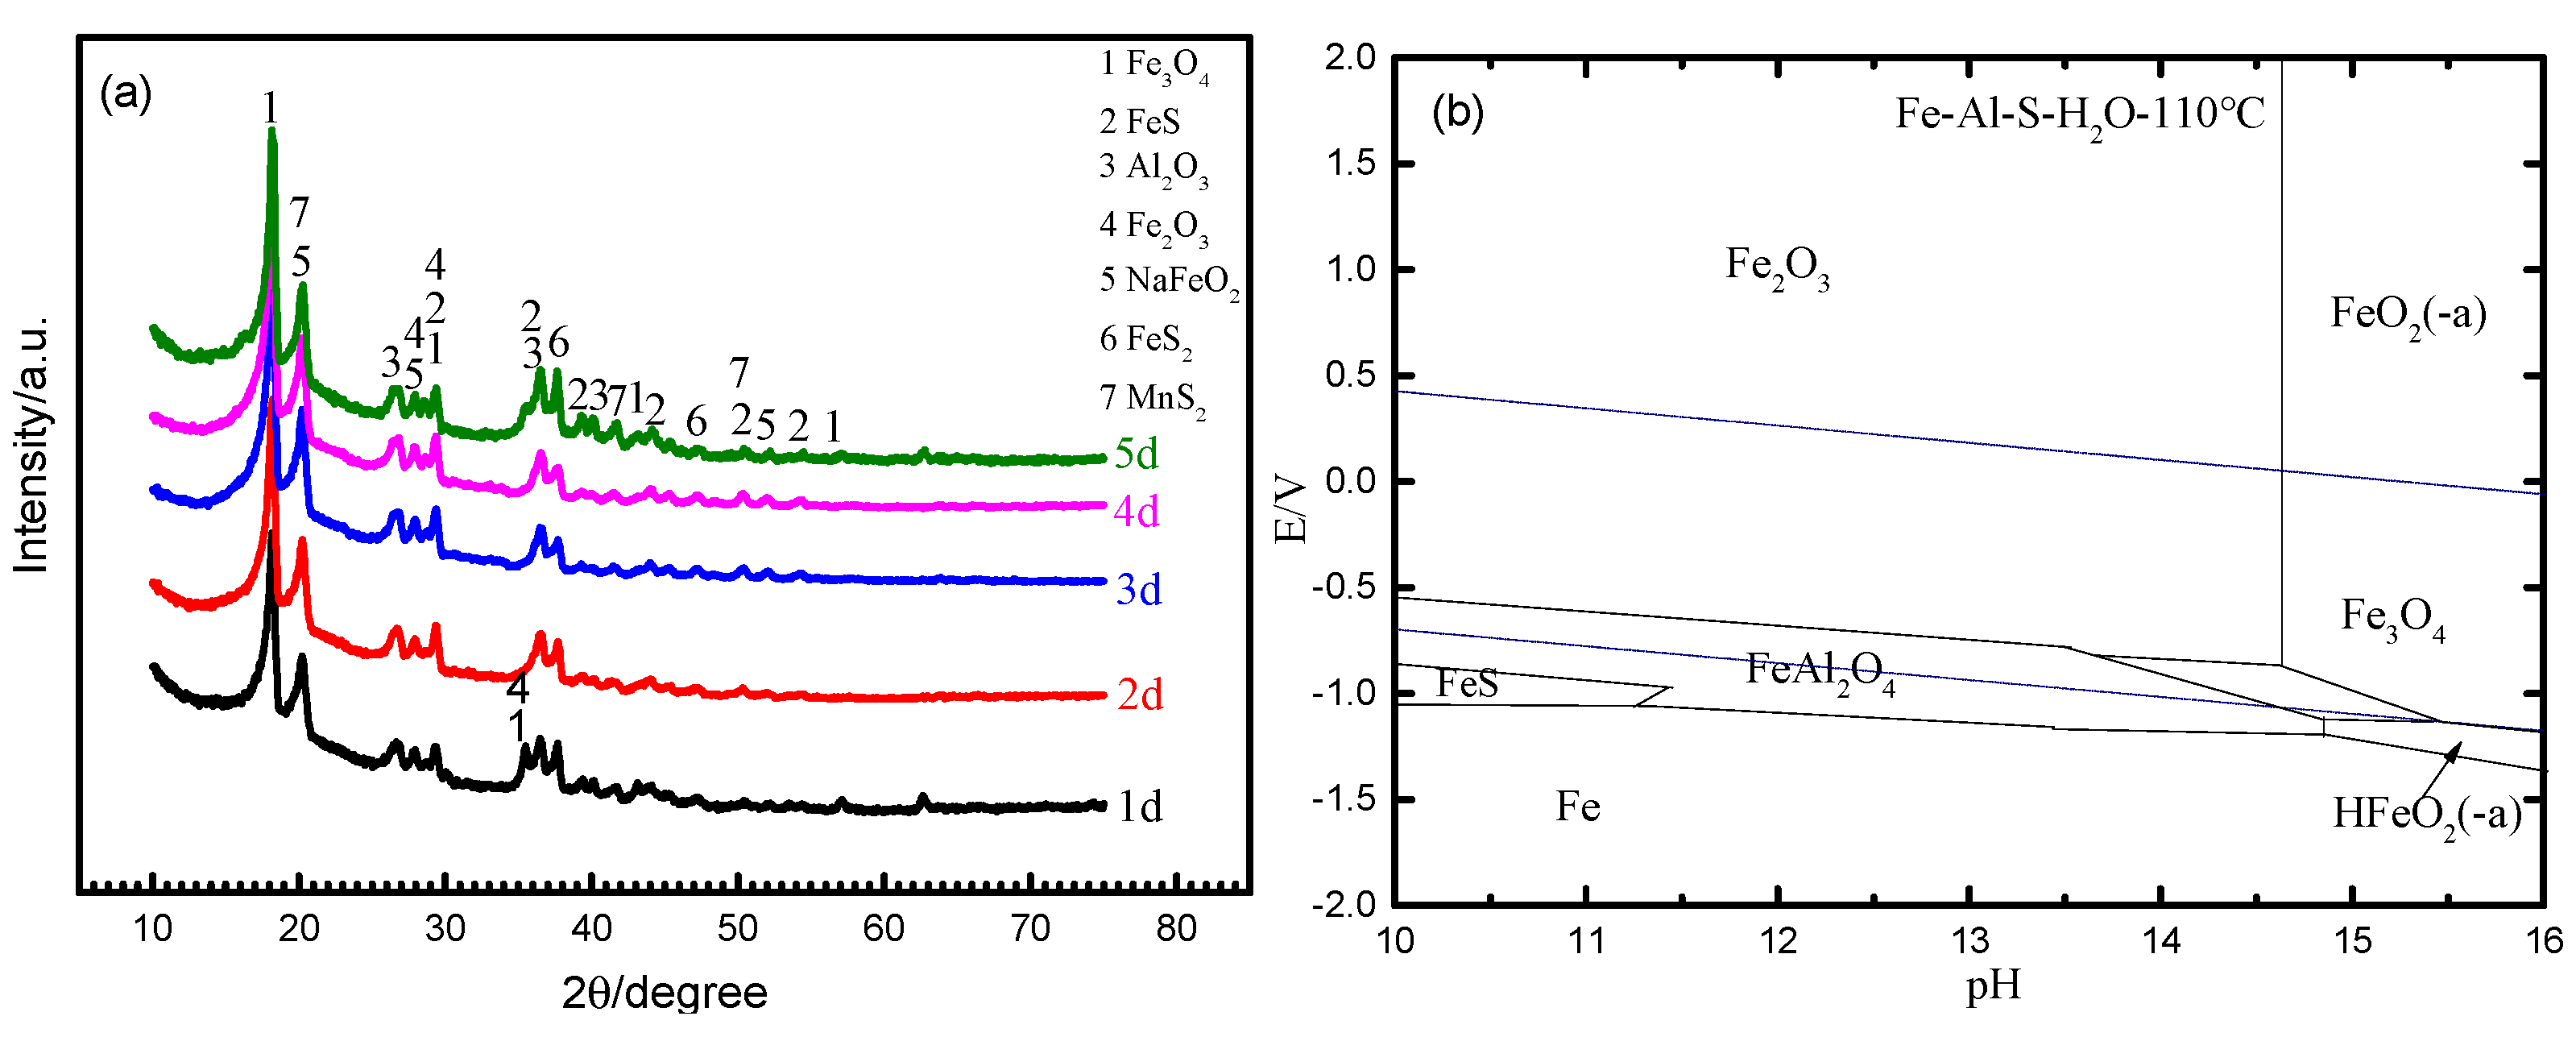
The morphology and element composition of the corrosion products for different corrosion times are shown in Figure 3, in the 110 g/L sodium aluminate solution containing 5 g∙L−1 S2− and 3 g∙L−1 S2O32–. Figure 3a,d,g,j,m are annotated identifying the regions of the surface with boxes that are magnified in Figure 3b,e,h,k,n to provide a more detailed observation of the varying morphology of the corrosion products. The corrosion products are mainly composed of O, Fe, Na, Al and S (Figure 3c,f,i,l,o,p). However, the content of the elements changed significantly with the corrosion time.
With the extension of the corrosion time, the surface coverage becomes larger and larger, and the morphology of the corrosion products changes significantly. After corrosion for 1 d, a large number of corrosion products accumulated locally on the steel surface (Figure 3a), and the corrosion phenomenon was obvious. After 2 d, the corrosion products had accumulated locally with amorphous and had then slowly crystallized [22] and as a result, the big block or flocculent corrosion products were locally formed on the surface (Figure 3d). It can be noticed that the steel surface has serious cracking and shedding with the increase in coverage after 2 d (Figure 3b,d). When the corrosion lasted for 3 d, the surface coverage increased significantly (Figure 3g). Due to the longer corrosion time, the growth rate of the crystalline particles is greater than that of the nucleation rate [23]. Therefore, a layer of larger octahedral crystal particles formed on the surface. The corrosion products were evenly distributed after 3 d, and two morphological patterns could be found, as follows: one was octahedral crystal particles, and the other was rod-shaped particles (Figure 3h). When the corrosion lasted for 4 d, the distribution of the corrosion products was relatively uniform, the rod-shaped particles disappeared completely (Figure 3j), and the surface was covered by octahedral crystal particles lacking a vertex (Figure 3k). At the same time, the surface became slightly cracked, the area marked by the light green circle in Figure 3j. The reason for this may have been the dehydration of the aluminum hydroxide. When the corrosion lasted for 5 d, the accumulation degree of the corrosion products was basically the same as that of 4 d, and the morphology and element composition were also basically the same (Figure 3m,n), only the degree of cracking was slightly larger than that of 4 d (Figure 3n).
The elemental composition of the corrosion products also changed with corrosion time, from Figure 3c,f,i,l,o. It was found that the sulfur content in the block and flocculent corrosion products was dominant (Figure 3c,f), the sulfur content of the octahedral crystal particles decreased sharply and almost did not exist with the decreasing corrosion time (Figure 3i,o). The corrosion products’ morphologies transformed from block and flocculent at the initial stage to octahedral crystal particles at the later stage. Therefore, it can be inferred that the S2− ion is preferentially adsorbed to the steel surface and reacts, forming structurally unstable sulfides that continue to react with anions in the solution and convert to corresponding oxides, which are structurally stable [13]. Finally, the steel surface is mainly covered with a layer of structurally stable crystalline oxide particles to make it pseudo-passivated.

3.1.2. XRD Analysis

The XRD analysis of the corrosion products obtained at different corrosion times is shown in Figure 4a, in 110 g/L sodium aluminate solution containing 5 g∙L−1 S2− and 3 g∙L−1 S2O32–. Judging from the spectrum results, the positions of the diffraction peaks of the corrosion products are basically the same with different corrosion times, which implies that the corrosion products with different corrosion times are also the same.
Figure 4b is E-pH graph of Fe–Al–S–H2O at 110 °C derived from the HSC Chemistry software [24]. The possible physical phase of the Fe–Al–S–H2O system is analyzed thermodynamically at specific conditions. At the pH range and potential tested, solid-phase iron oxide (Fe2O3 and Fe3O4) and ion compounds (FeO2(-a) and HFeO2(-a)) are expected. Figure 4b indicates that at the pH range of the system, the stable phase on the Q235 steel surface may be Fe2O3 and Fe3O4. At the same time, solid-phase iron sulfide may also be present.
The X’pert HighScore software was used to analyze the phase composition of the corrosion products, which may be composed of FeS, FeS2, Fe2O3, Fe3O4, Al2O3, MnS2 and NaFeO2 combined with thermodynamic analysis, which is suggested from the previous research [14,24,25] and is basically consistent with the EDS analysis in Figure 3. Although the phase composition of the corrosion products is the same, the peak intensity is different, which indicates that the crystallinity is different. It can be seen from Figure 4 that the crystallinity for 1 d is relatively poor. Combined with the element and morphology analysis in Figure 3, it can be seen that the corrosion products at the initial stage are mainly composed of sulfide, while they are mainly composed of oxide at the later stage.

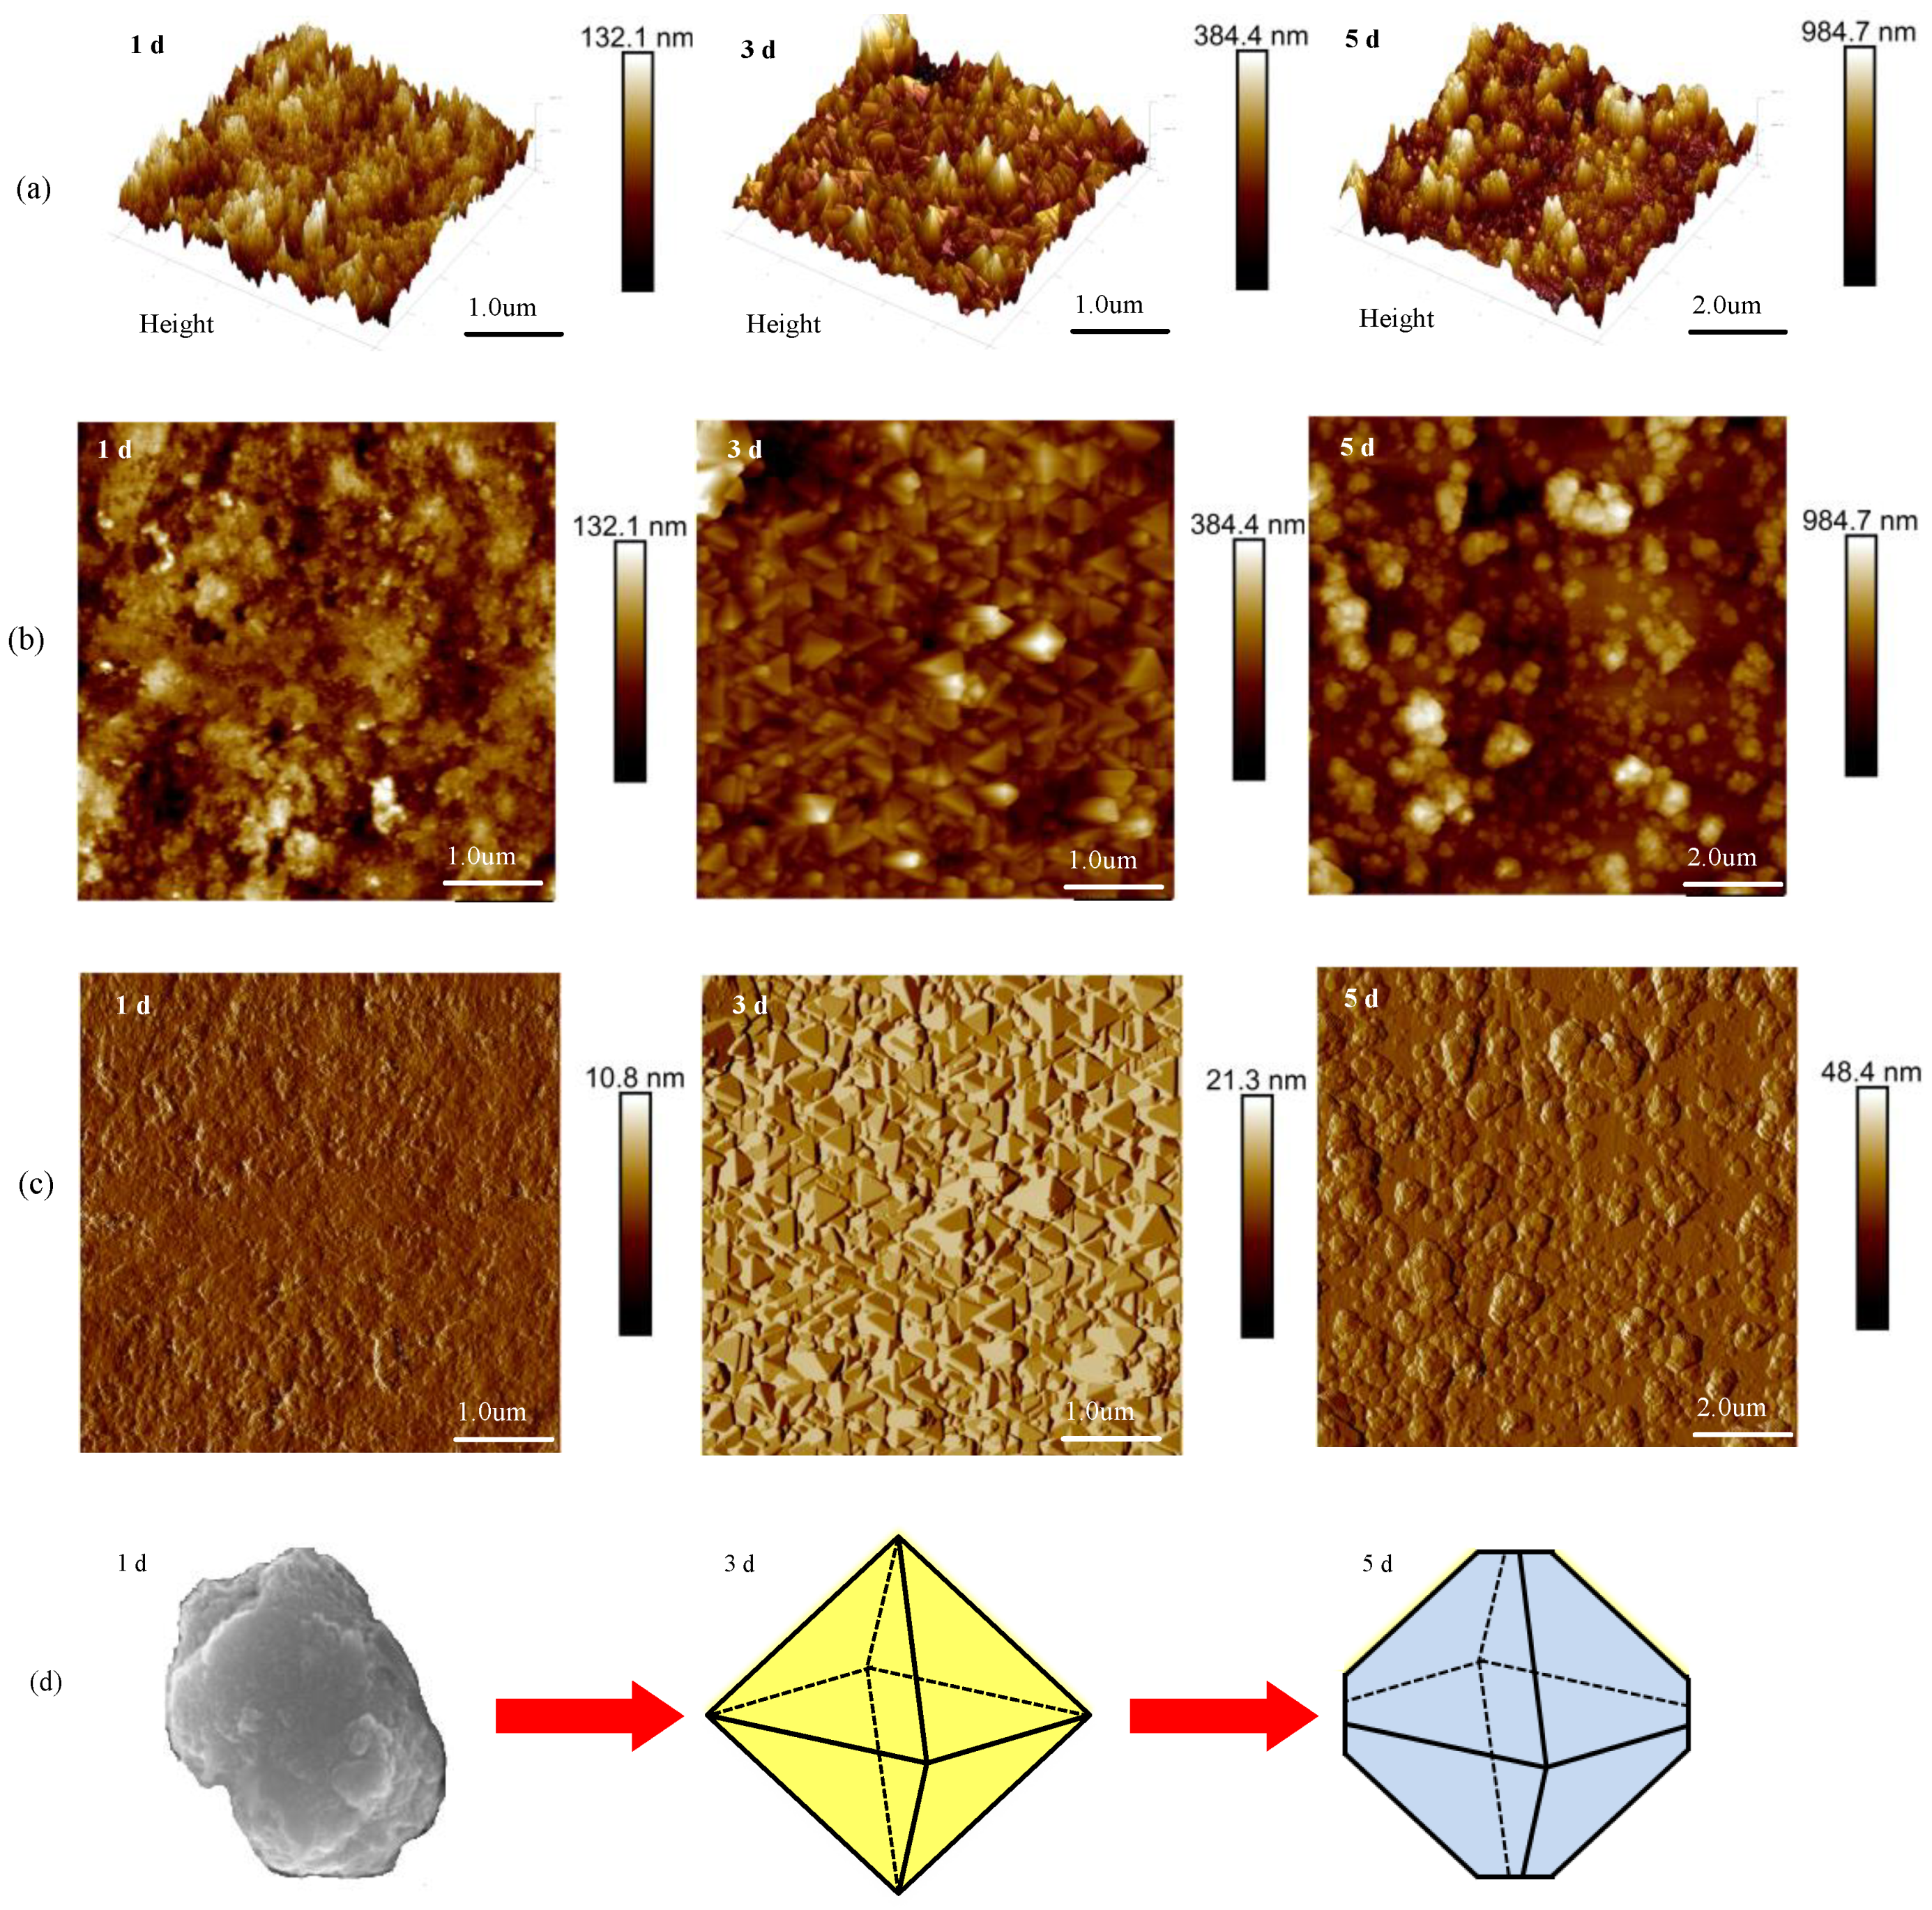
3.1.3. Surface Roughness Analysis
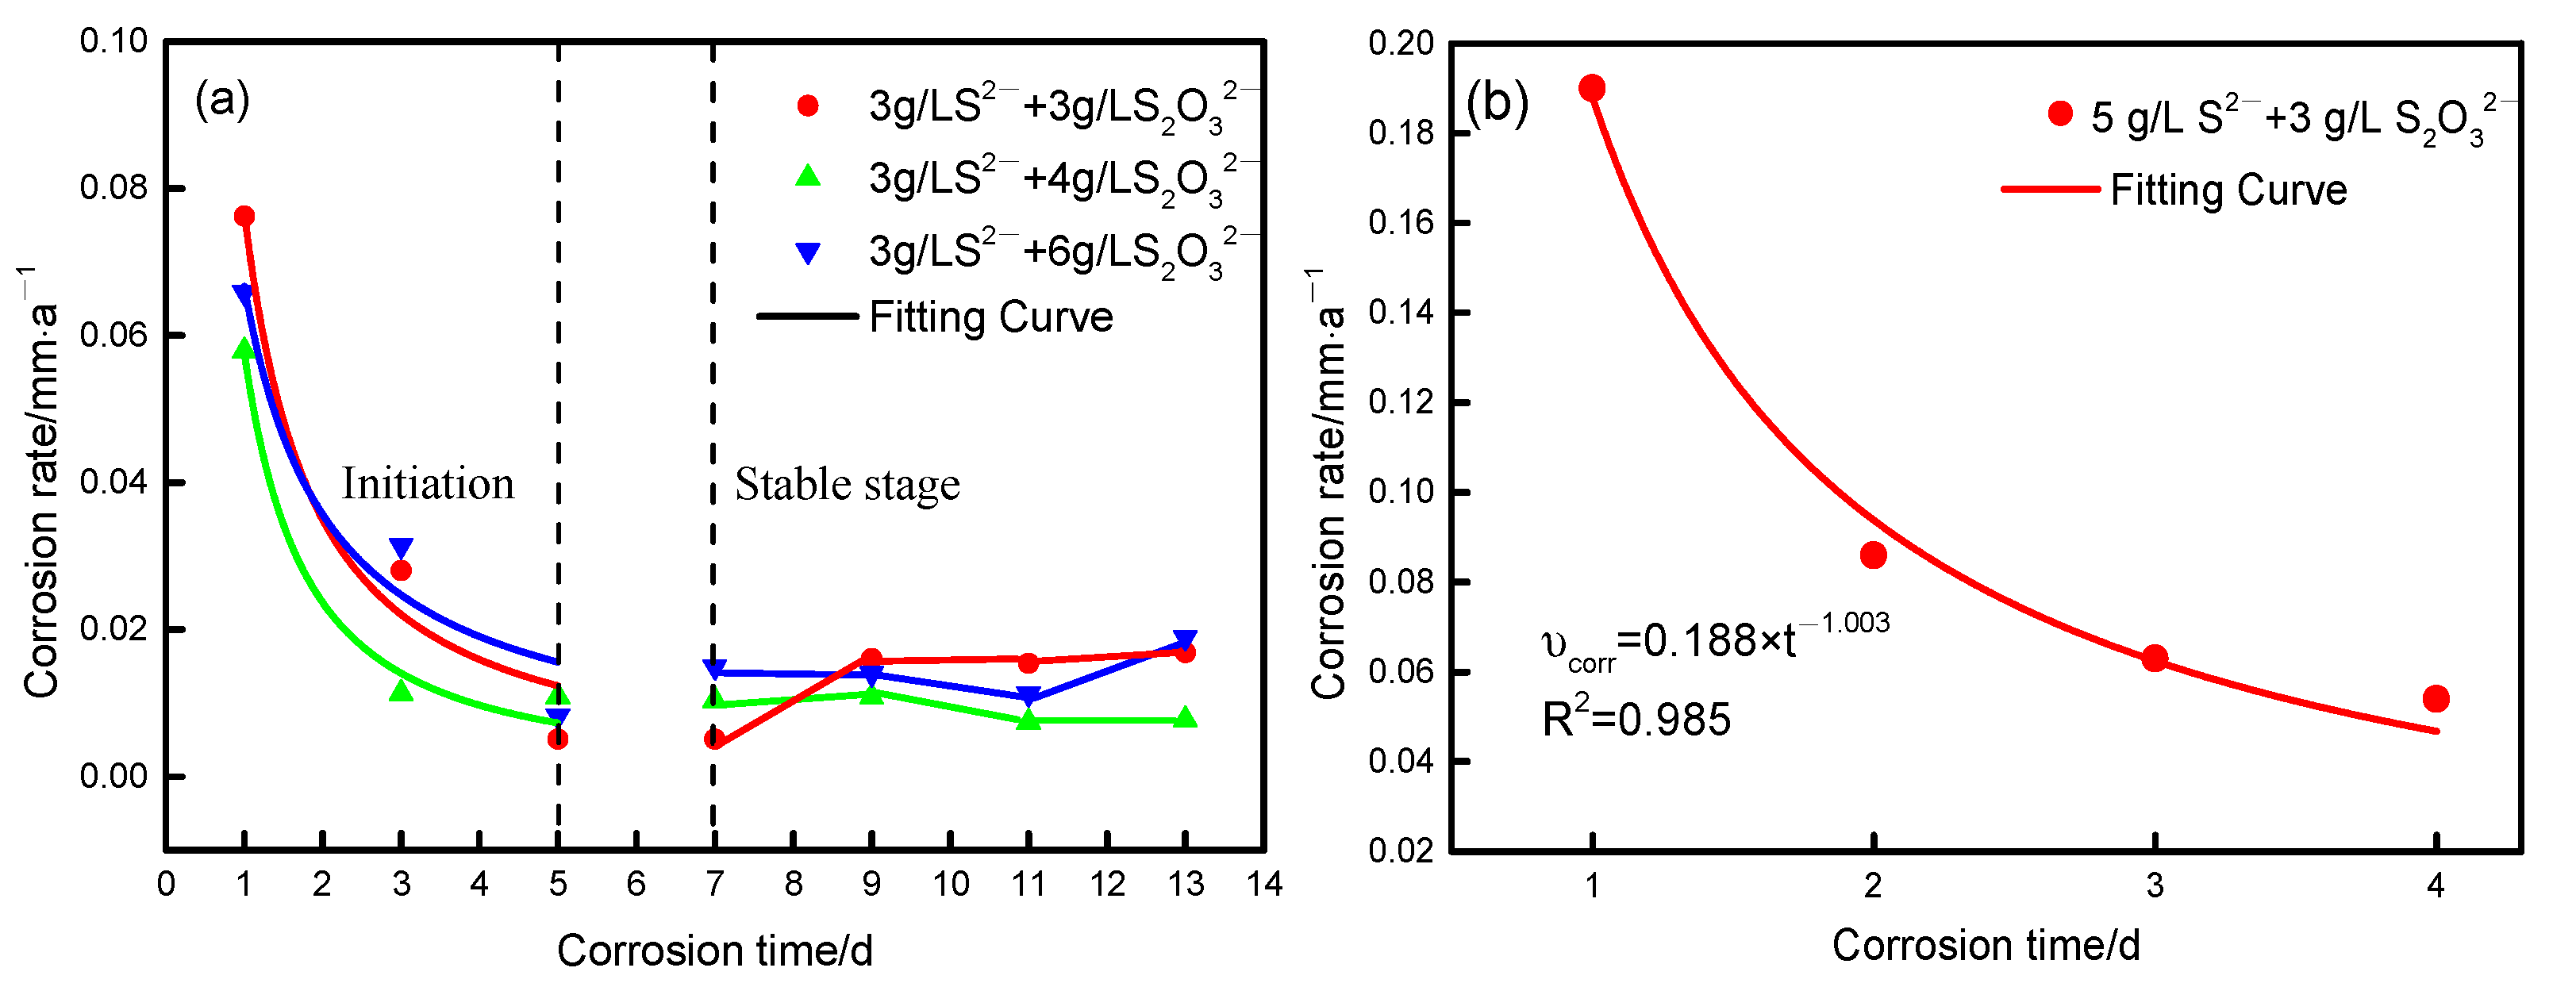
AFM was used to observe the roughness and morphology of the corrosion products after 1 d, 3 d and 5 d. With the extension of corrosion time, the thickness of the corrosion products gradually increased from 132.1 nm for 1 d to 384.4 nm for 3 d and 984.7 nm for 5 d (Figure 5a). Furthermore, the morphology also changed significantly (Figure 5c). The matrix of the Q235 steel was seriously corroded when it was corroded for 1 d, and the irregular corrosion products were mainly formed on the surface (Figure 5b). A layer of uniform and dense octahedral crystal particles were formed after 3 d (Figure 5b). The corrosion products grew up from the octahedral particles that accumulated for 3 d to cube-like crystal particles for 5 d, which have a certain resistance to corrosion (Figure 5b). The structural evolution of the corrosion products is shown in Figure 5d. It can be seen that the corrosion product morphologies, from amorphous to octahedron, finally formed cube-like crystal particles. Therefore, the corrosion rate decreased sharply for 3 d because a tight protective film had formed, which is consistent with the results of the SEM morphologies. The morphology and composition of the corrosion products was different, and the Rq of the steel surface also changed significantly from 18.5 nm for 1 d to 68 nm for 3 d, and 138 nm for 5 d. As can be seen from the roughness, S2– and S2O32– caused serious corrosion on the Q235 steel. Therefore, they are called active corrosives in the literature [26,27].

3.2. Corrosion Rate

The corrosion experiments of the Q235 steel were completed in the 90 g/L sodium aluminate solution with different concentrations of S2– and S2O32– in the autoclave at 110 °C. The relationship between the corrosion time and corrosion rate of the Q235 steel was discussed, as shown in Figure 6a. The synergistic corrosion rate of the Q235 steel in the sodium aluminate solution containing sulfur was less than 1 mm/a, so it belongs to the corrosion-resistant series.
The corrosion of the Q235 steel showed the following two stages with corrosion time: one was the initial stage when the corrosion rate decreased sharply with corrosion time (1–5 d), the other was the middle and late stage when the corrosion rate changed slowly with corrosion time and flattened out (7–13 d). The main reason for this was that the fresh steel matrix was exposed to corrosive ions in the solution and corrosion occurred at the same time, so the corrosion rate was the highest at the initial stage (1 d). The corrosion rate decreased with the extension of corrosion time (3–5 d), which illustrated that the corrosion products were formed on the steel surface as the steel matrix and ions (S2−, S2O32−, OH and AlO2) in the solution adsorbed and reacted, which hindered the diffusion of the corrosive ions to the matrix surface and slowed down the corrosion. At the middle and late stage (7–13 d), the corrosion products accumulated, which effectively prevented the transfer of corrosive ions to the interior of the matrix, so that the corrosion became slow and tended to become gentle [28].
A mathematical fitting was performed to determine the mathematical relationship between the corrosion rate and the corrosion time, and it was found that the corrosion rate satisfied the mathematical model of the power function at the initial stage of corrosion [28,29,30], which is shown in Table 2, and the fitting curve is shown in Figure 6a. The fitting correlation coefficients in Table 2 are basically above 0.9, indicating that the fitting equation of corrosion dynamics of the Q235 steel has a good correlation with the experimental results. However, the relationship of the power function is no longer followed at the middle and later stages of corrosion. The main reason for this is that the corrosion rate changes a little and the corrosion basically tends to be stable.
In order to verify the mathematical relationship of the power function of the corrosion rate equation in the corrosion process, the corrosion experiments of the Q235 steel were carried out in the 110 g/L sodium aluminate solution containing 5 g∙L−1 S2− and 3 g∙L−1 S2O32−. The results are shown in Figure 6b. The corrosion trend is consistent with that in Figure 6a. That is, the corrosion rate of steel at the initial stage of corrosion decreases sharply with the corrosion time. Its kinetic fitting equation is shown in Figure 6b and Table 2. Therefore, the corrosion rate and corrosion time only follow the mathematical model of the power function at the initial stage of corrosion.
In order to confirm the regularity of the corrosion rate obtained by the weight-loss method, the potentiodynamic polarization curve of the Q235 steel was analyzed, and the results are shown in Figure 7, with different corrosion times in the 110 g∙L−1 sodium aluminate solution containing 5 g∙L−1 S2− and 3 g∙L−1 S2O32−. As can be seen from Figure 7a–e, Q235 steel presented similar electrochemical behavior, in which the cathode reaction is oxygen reduction, taking into account that the electrochemical tests were carried out in an aerated and strongly alkaline solution, significant activation and passivation occurs at the anode, and the transpassive potential is basically the same [31].
Table 3 shows the corrosion potential (Ecorr), corrosion current density (Icorr), Tafel slope (βa and βc represent anodic and cathodic, respectively), and polarization resistances (Rp), and the corrosion rate is obtained by Tafel fitting of the polarization curves. According to the Faraday law, the corrosion rate is directly proportional to the corrosion current [32], and the mathematical expression is shown in Equation (2). As can be seen from Table 3 and Figure 7a–e, the corrosion potential of the Q235 steel is −1.1 V–−1.2 V (vs. SCE). The corrosion process presented different trends with different corrosion times. At the initial stage of corrosion (1 d), the Rp of the Q235 steel was the smallest (26.53 Ω·cm2), and the corrosion rate was the largest, mainly because the fresh steel surface was exposed and vulnerable to corrosion by corrosive ions [33]. The Rp of the Q235 steel was 90.06 Ω·cm2 and 75.96 Ω·cm2 for 2 d and 3 d, respectively, reaching the maximum value, and the corrosion rate reached the minimum value. This is mainly because the corrosion products with a certain thickness are generated on the surface [34], which greatly hinders the diffusion of ions and results in a sharp decrease in the corrosion rate (seen in Figure 3g). At the middle and late stages of corrosion (4–5 d), the Rp of the Q235 steel decreased to 53.10 Ω·cm2 for 4 d and 58.84 Ω·cm2 for 5 d. It may be that the morphology and structure of the corrosion products changed with the progress of the corrosion [18,35]. At the same time, part of the surface cracked leading to the intrusion of corrosive ions into the matrix, causing the corrosion to continue (Seen Figure 3j–m) [18]. The relationship between the corrosion rate and the corrosion current density in Table 3 is shown in Equation (2) [36].
R = K 1 × M i c o r r n ρ
where R is the corrosion rate (mm·a−1), icorr is the corrosion current density (uA·cm−2), M is the atomic weight of the element, n is the valence of the element, M/n is the equivalent weight and its value is not dependent on the unit system chosen so it may be considered dimensionless, and ρ is the steel density (g·cm−3), K1 = 3.27 × 10⁻³, mm·g·µA−1·cm−1·a−1.
Figure 7f shows the comparison of the corrosion rate of Q235 steel measured by the weight-loss method and the polarization curve method, respectively. The variation trend of the corrosion rate obtained by the two methods remained the same. It found that the corrosion trend can be obtained by the polarization curve method. After soaking for a long time, the Q235 steel electrode was affected by the accumulation of a layer of corrosion products. The corrosion rate obtained by the polarization curve method is larger than that of the weight-loss method, and the polarization curve method cannot accurately reflect the actual state of the steel in the corrosive medium, but the polarization curve results are basically consistent with those obtained by the weight-loss method when the trend of corrosion rate is discussed.

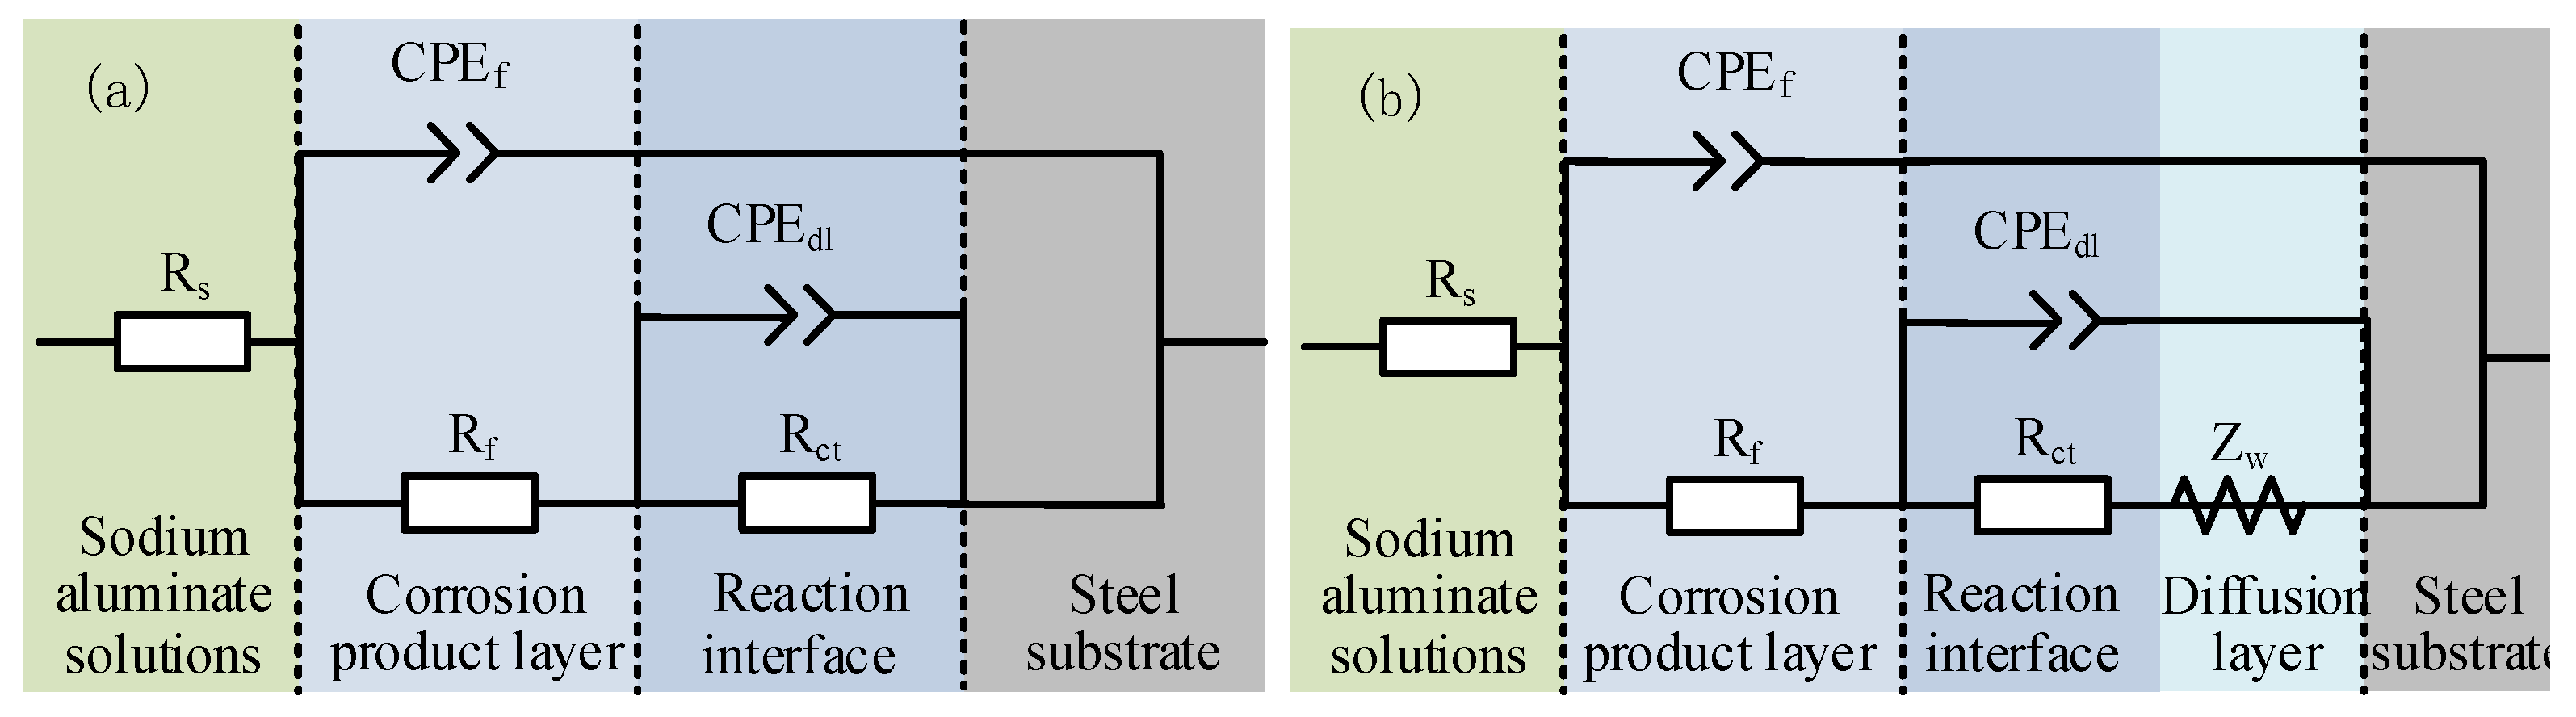
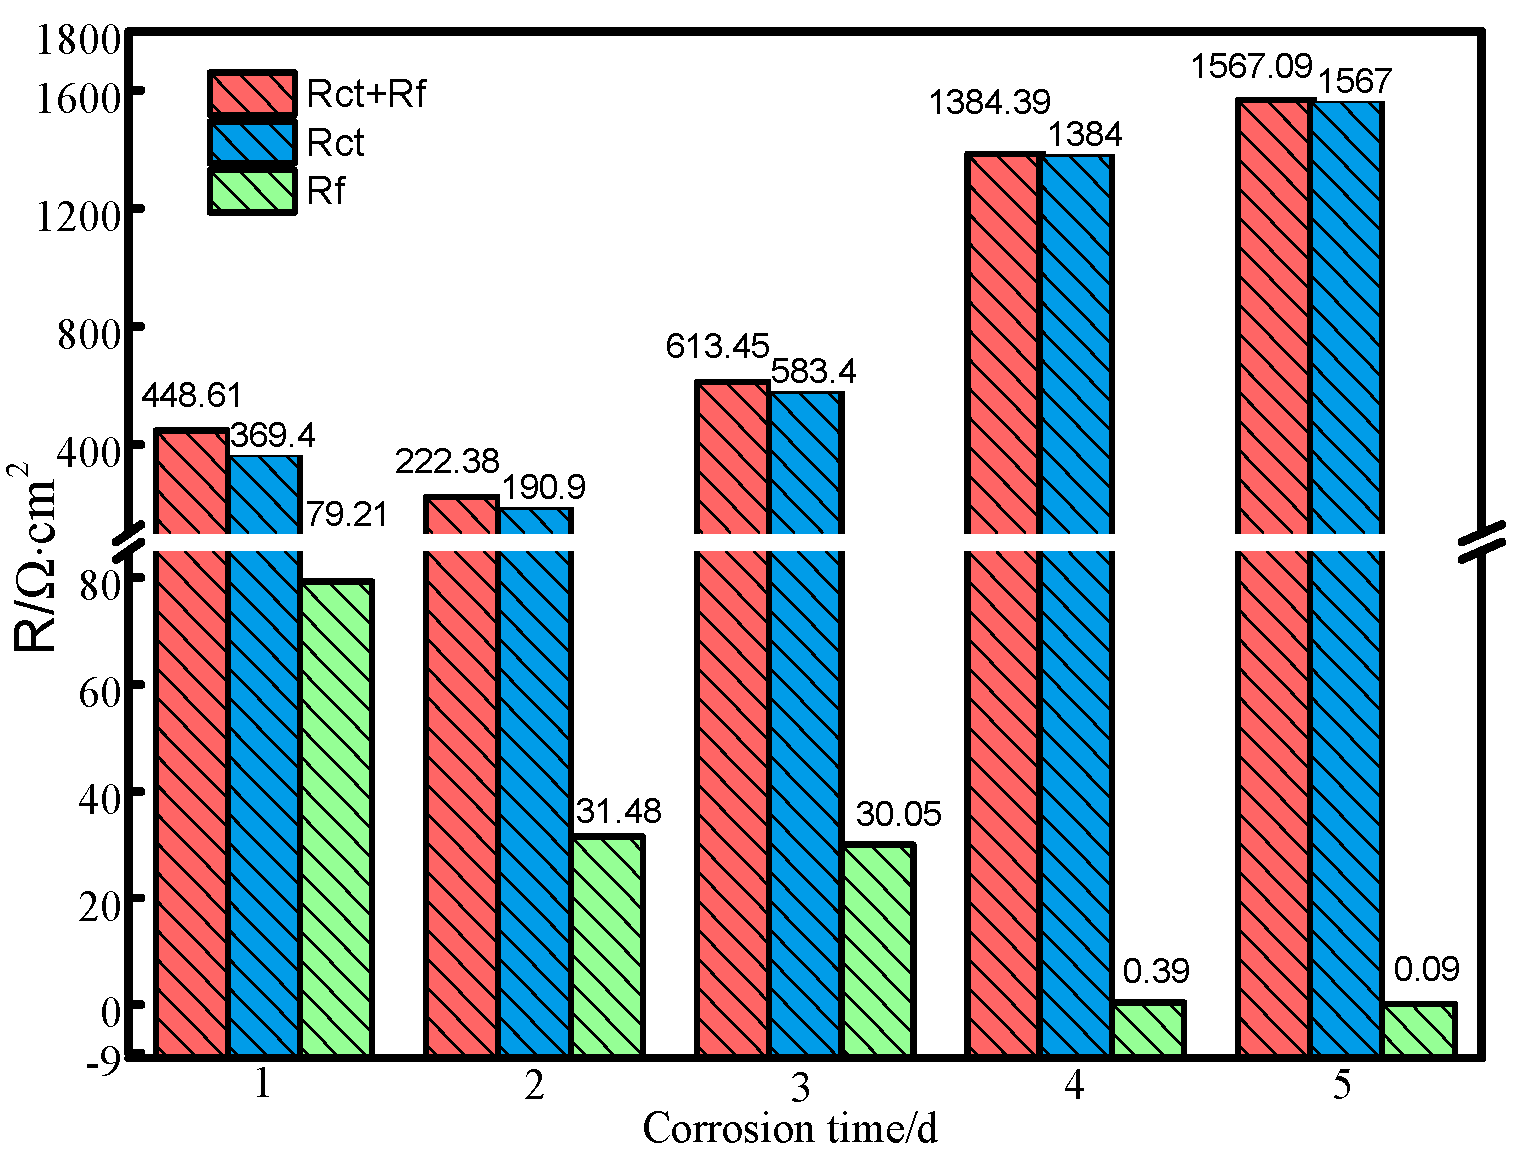
3.3. Electrochemical Impedance Spectrum

To study the electrochemical behavior of Q235 steel, EIS measurements were carried out and recorded over corrosion times in the 110 g/L sodium aluminate solution containing 5 g∙L−1 S2− and 3 g∙L−1 S2O32−. Figure 8 is the EIS analysis of the Q235 steel with different corrosion times. It can be seen from the Nyquist plots that there are two capacitance and resistance responses (high frequency and medium frequency) (HF and MF), and a non-inductive arc, indicating that when the corrosion time is different, the Q235 steel electrode contains two time constants, namely, two state variables, one represents the charge transfer on the electrode surface and the other reflects the properties of the surface film. The Nyquist plots of the Q235 steel show squashed semicircles for 1, 2, 4, and 5 d, indicating that the charge transfer is the control step of the electrode process [37]. The Nyquist plot of the Q235 steel for 3 d is different from the others, in addition to the two capacitive reactance responses a 45° straight line appears. However, a linear tail in the low frequency (LF) range is only observed for 3 d, which indicates that the Q235 steel has two time constants and a Warburg impedance. In the literature [38], authors have indicated that when such a linear tail at low frequency presents itself, it signifies the onset of diffusion impedance suggesting that the diffusion of corrosive species to the scale/substrate interface becomes constrained. So, it shows that the surface corrosion layer has reached the degree of densification to prevention diffusion.
The electrochemical equivalent circuit (EEC) was used to interpret the EIS data obtained and understand the characteristic changes in impedance behavior observed in Figure 8. Figure 9 shows the two different equivalent circuit models that are used to fit the impedance curves observed at different corrosion times.
The physical models of Figure 9a,b are R s + Q f / ( R f + Q dl / R ct ) and R s + Q f / ( R f + Q dl / ( R ct + Z w ) ) , respectively. Some scholars have also proposed some similar models to analyze the corrosion products on the surface [14,38,39]. Based on the above analysis, the EIS fitting in Figure 8 was carried out by using the EEC in Figure 9 by means of the Zview software. The electrochemical parameters are shown in Table 4. In the EEC, Rs is the solution resistance, Rf and Qf (CPEf) are the corrosion layer resistance and capacitance, respectively, Rct and Qdl (CPEdl) are the charge transfer resistance and dual-layer capacitance, respectively, and ZW represents the Warburg diffusion of ions [39]. The reason for Q for capacitors in the analysis of the impedance spectra is that the corrosion layer is not considered a homogeneous layer but rather a defective layer. So, n is used to represent the roughness of the electrode surface and the uneven distribution of corrosion current density. Generally speaking, with the accumulation of the surface corrosion products or the generation of corrosion pits, the more serious the surface corrosion, the greater the surface roughness and the smaller the value of n [40].
As can be seen from Table 4, the Rct of the steel electrode is greater than the Rf, the Rct increases with the corrosion time, the charge transfer resistance is attributed to the kinetics of the anodic dissolution reaction. The Rct and Qdl characterize the corrosion reactions (at HF), and Rf and Qf represent the characteristics of the corrosion product layer (at MF). The observed changes in Rf and Qf can be attributed to the formation of the corrosion products, which covers the surface leading to a reduction in the active surface area [41]. While Rf decreases with the corrosion time, indicating that the charge transfer is the main control step of corrosion and Rf is small due to surface cracking at 4–5 d. At the same time, it found that when corroded for 3 d, the diffusion resistance (WR) and diffusion exponent (Wp) of the Warburg component (at LF) is 428.5 Ω·cm−2 and 0.39, respectively. These results indicate that the corrosion products are dense and have a great influence on the ions diffusion, and the surface of the electrode has a certain degree of roughness and there is an ion dispersion effect [24,42], which is consistent with the results of SEM and AFM. In fact, faster scale nucleation leads to the appearance of smaller crystals that produce a compact layer. The value of n is the smallest for 2 d, which shows the surface was badly corroded and badly uneven.
Since Rct and Rf in the system are difficult to distinguish, the sum of Rct and Rf is used to represent the polarization resistance (Rp) of the system. The change in Rct, Rf and Rp (Rct + Rf) with the corrosion time is shown in Figure 10. It can be seen that Rp mainly depends on Rct, so the whole system is mainly controlled by the charge transfer. Comparing with the polarization curve, it is found that the Rp obtained by the EIS and potentiodynamic techniques has a certain difference, and there is a similar difference found within the literature [43]. Combining the weight-loss method and the polarization method, the corrosion process is divided into three stages, as follows: the initial stage of corrosion, the middle stage of corrosion, and the latter stage of corrosion. The Rp is small and the corrosion proceeds relatively quickly at the initial stage (1–2 d). At the middle stage (3 d), the Rp begins to increase, which indicates that the corrosion products covering the surface have a certain degree of influence on the diffusion of ions. At the later stage (4–5 d), the Rp reaches the maximum value, which indicates that the corrosion products layer is relatively dense, but there is no significant Warburg diffusion. At the same time, it can be seen from Figure 10 that the corrosion layer has a smaller impedance for 4–5 d. The reason for this may be that a certain degree of cracking occurred in the surface corrosion product layer, resulting in the corrosive ions quickly spreading to the matrix [44]. It is basically consistent with the local cracking on the SEM images of the fourth and fifth day (Figure 3j,m).

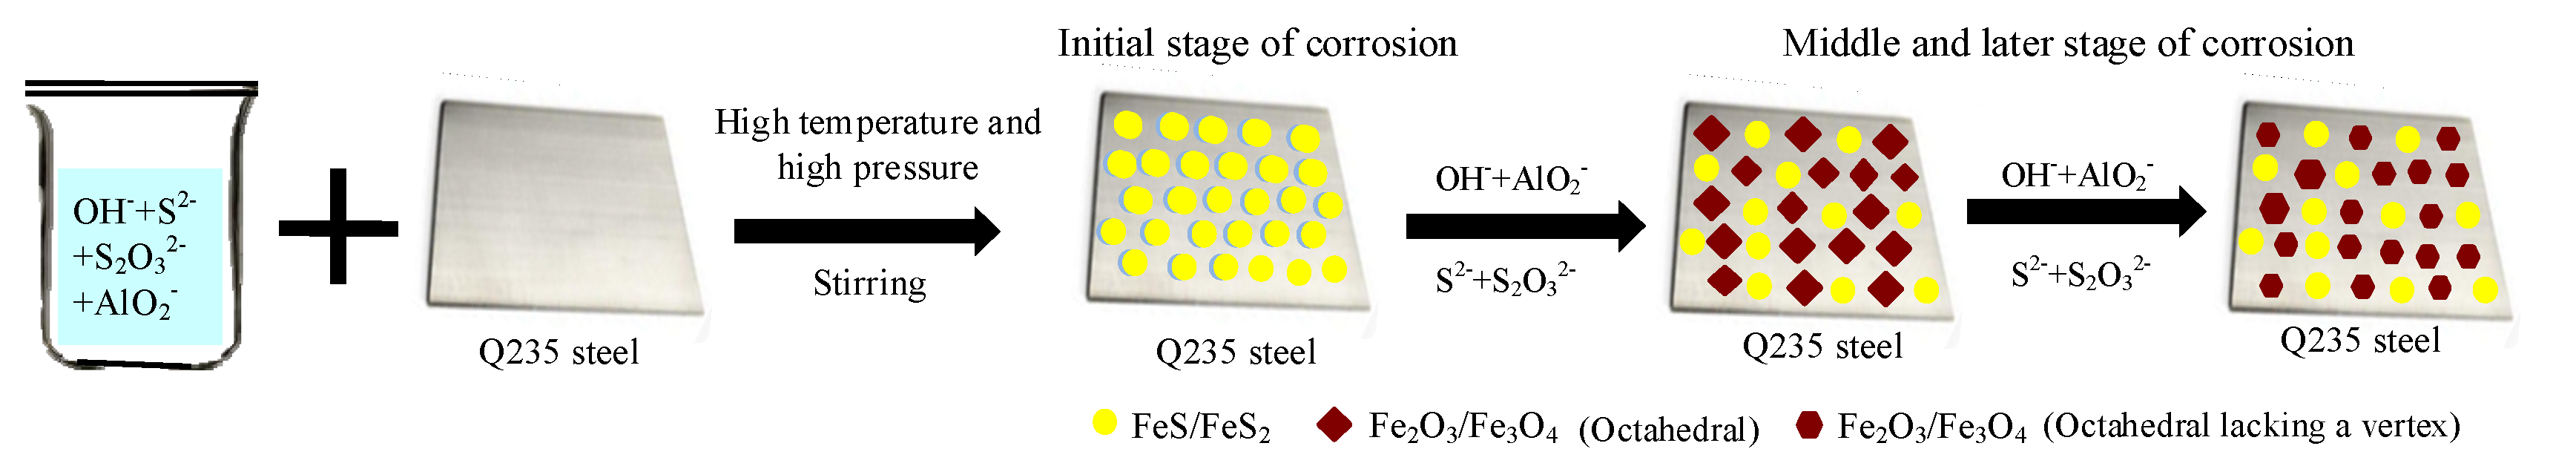
3.4. Formation Mechanism of Surface Corrosion Products

Previous to this work, the influence of S2− and S2O32− and the structure of surface corrosion products in sodium aluminate solution on the corrosion behavior of Q235 steel was studied [14,24,45]. In this work, SEM, EDS, XRD, AFM, potentiodynamic polarization curve and EIS were combined with the aim to reveal the effect of corrosion time on the synergistic corrosion of Q235 steel in sodium aluminate solution containing sulfur.
It is believed that the Q235 steel matrix is mainly attacked by the corrosive ions OH, S2−, S2O32− and AlO2 in the sodium aluminate solution containing sulfur. At the early stage of corrosion, the substrate preferentially adsorbs S2− ions, and the corrosion products are mainly composed by the iron sulfide. The corrosion products continue to react with OH- and AlO2 in the solution with the extension of corrosion time, and their structures start to evolve [26,46]. XRD, EDS and SEM analyses show that the octahedral crystal particles may be oxide (Fe2O3, Fe3O4, Al2O3 and NaFeO2), while the initial corrosion products of the interlayer between the surface layer and the matrix may be a small amount of sulfide (FeS, FeS2 and MnS2). The evolution process of the corrosion products is analyzed below.
At the initial stage of corrosion, the matrix iron is ionized first, as shown in Equation (3) [11,28]. In addition, the matrix iron will directly adsorb HS to generate FeS, as shown in Equation (4) [47]. These two electrode reactions correspond to the anode-activated dissolution zone of the polarization curves (Figure 7).
Fe ( OH ) 3 + 3 H + + 2 e = Fe + 3 H 2 O
FeS + 2 H + + 2 e = Fe + 3 HS .
Second, the concentration of Fe(OH)3 increases with the dissolution of the anode, and it reacts with HS to generate FeS and FeS2, as shown in Equations (5) and (6) [26,48]. These electrode reactions correspond to the anode transition zone of the polarization curves (Figure 7).
Fe ( OH ) 3 + HS + 2 H + = FeS + 3 H 2 O
FeS 2 + H + + 2 e = FeS + HS
In the middle and later stages of corrosion, the corrosion products continue to react with the ions. On the one hand, the formation of structurally stable iron oxide causes surface pseudo-passivation, as shown in Equations (7)–(13) [14,26,28], and on the other hand, the ionization of FeS occurs, as shown in Equation (14) [14,48]. These electrode reactions correspond to the anode pseudo-passivation zone of the polarization curves (Figure 7).
Fe 2 O 3 + 3 H 2 O + 2 e = 2 Fe ( OH ) 3
Fe 3 O 4 + 5 H 2 O + 2 e = 3 Fe ( OH ) 3 + H +
Fe 2 O 3 + 2 HS + 4 H + + 2 e = 2 FeS + 3 H 2 O
Fe 3 O 4 + 3 HS + 5 H + + 2 e = 3 FeS + 4 H 2 O
Fe 3 O 4 + 3 S 2 O 3 2 + 26 H + + 20 e = 3 FeS 2 + 13 H 2 O
Fe 2 O 3 + 2 S 2 O 3 2 + 18 H + + 14 e = 2 FeS 2 + 9 H 2 O
3 Fe 2 O 3 + 2 H + + 2 e = 2 Fe 3 O 4 + H 2 O
FeS + OH + HS = FeS 2 + H 2 O + e .
Based on the above analysis, the schematic diagram of the formation mechanism of the corrosion products on the surface of Q235 steel in the sodium aluminate solution containing sulfur is shown in Figure 11.

4. Conclusions

(1)
At the initial stage of corrosion, the corrosion rate decreases sharply and satisfies the mathematical model of the power function, and iron sulfide with an unstable structure is preferentially generated on the surface. The corrosion rate decreases slowly after 5 d;
(2)
The corrosion products have two morphological patterns, as follows: one is the octahedral crystal particle, which is composed of Fe2O3, Fe3O4, Al2O3 and NaFeO2, and the other is the interlayer corrosion between the surface layer and the matrix, which is composed of FeS, FeS2 and MnS2. The unstable iron sulfide is partially converted into stable iron oxide with corrosion time, which causes the anode pseudo-passivation of Q235 steel;
(3)
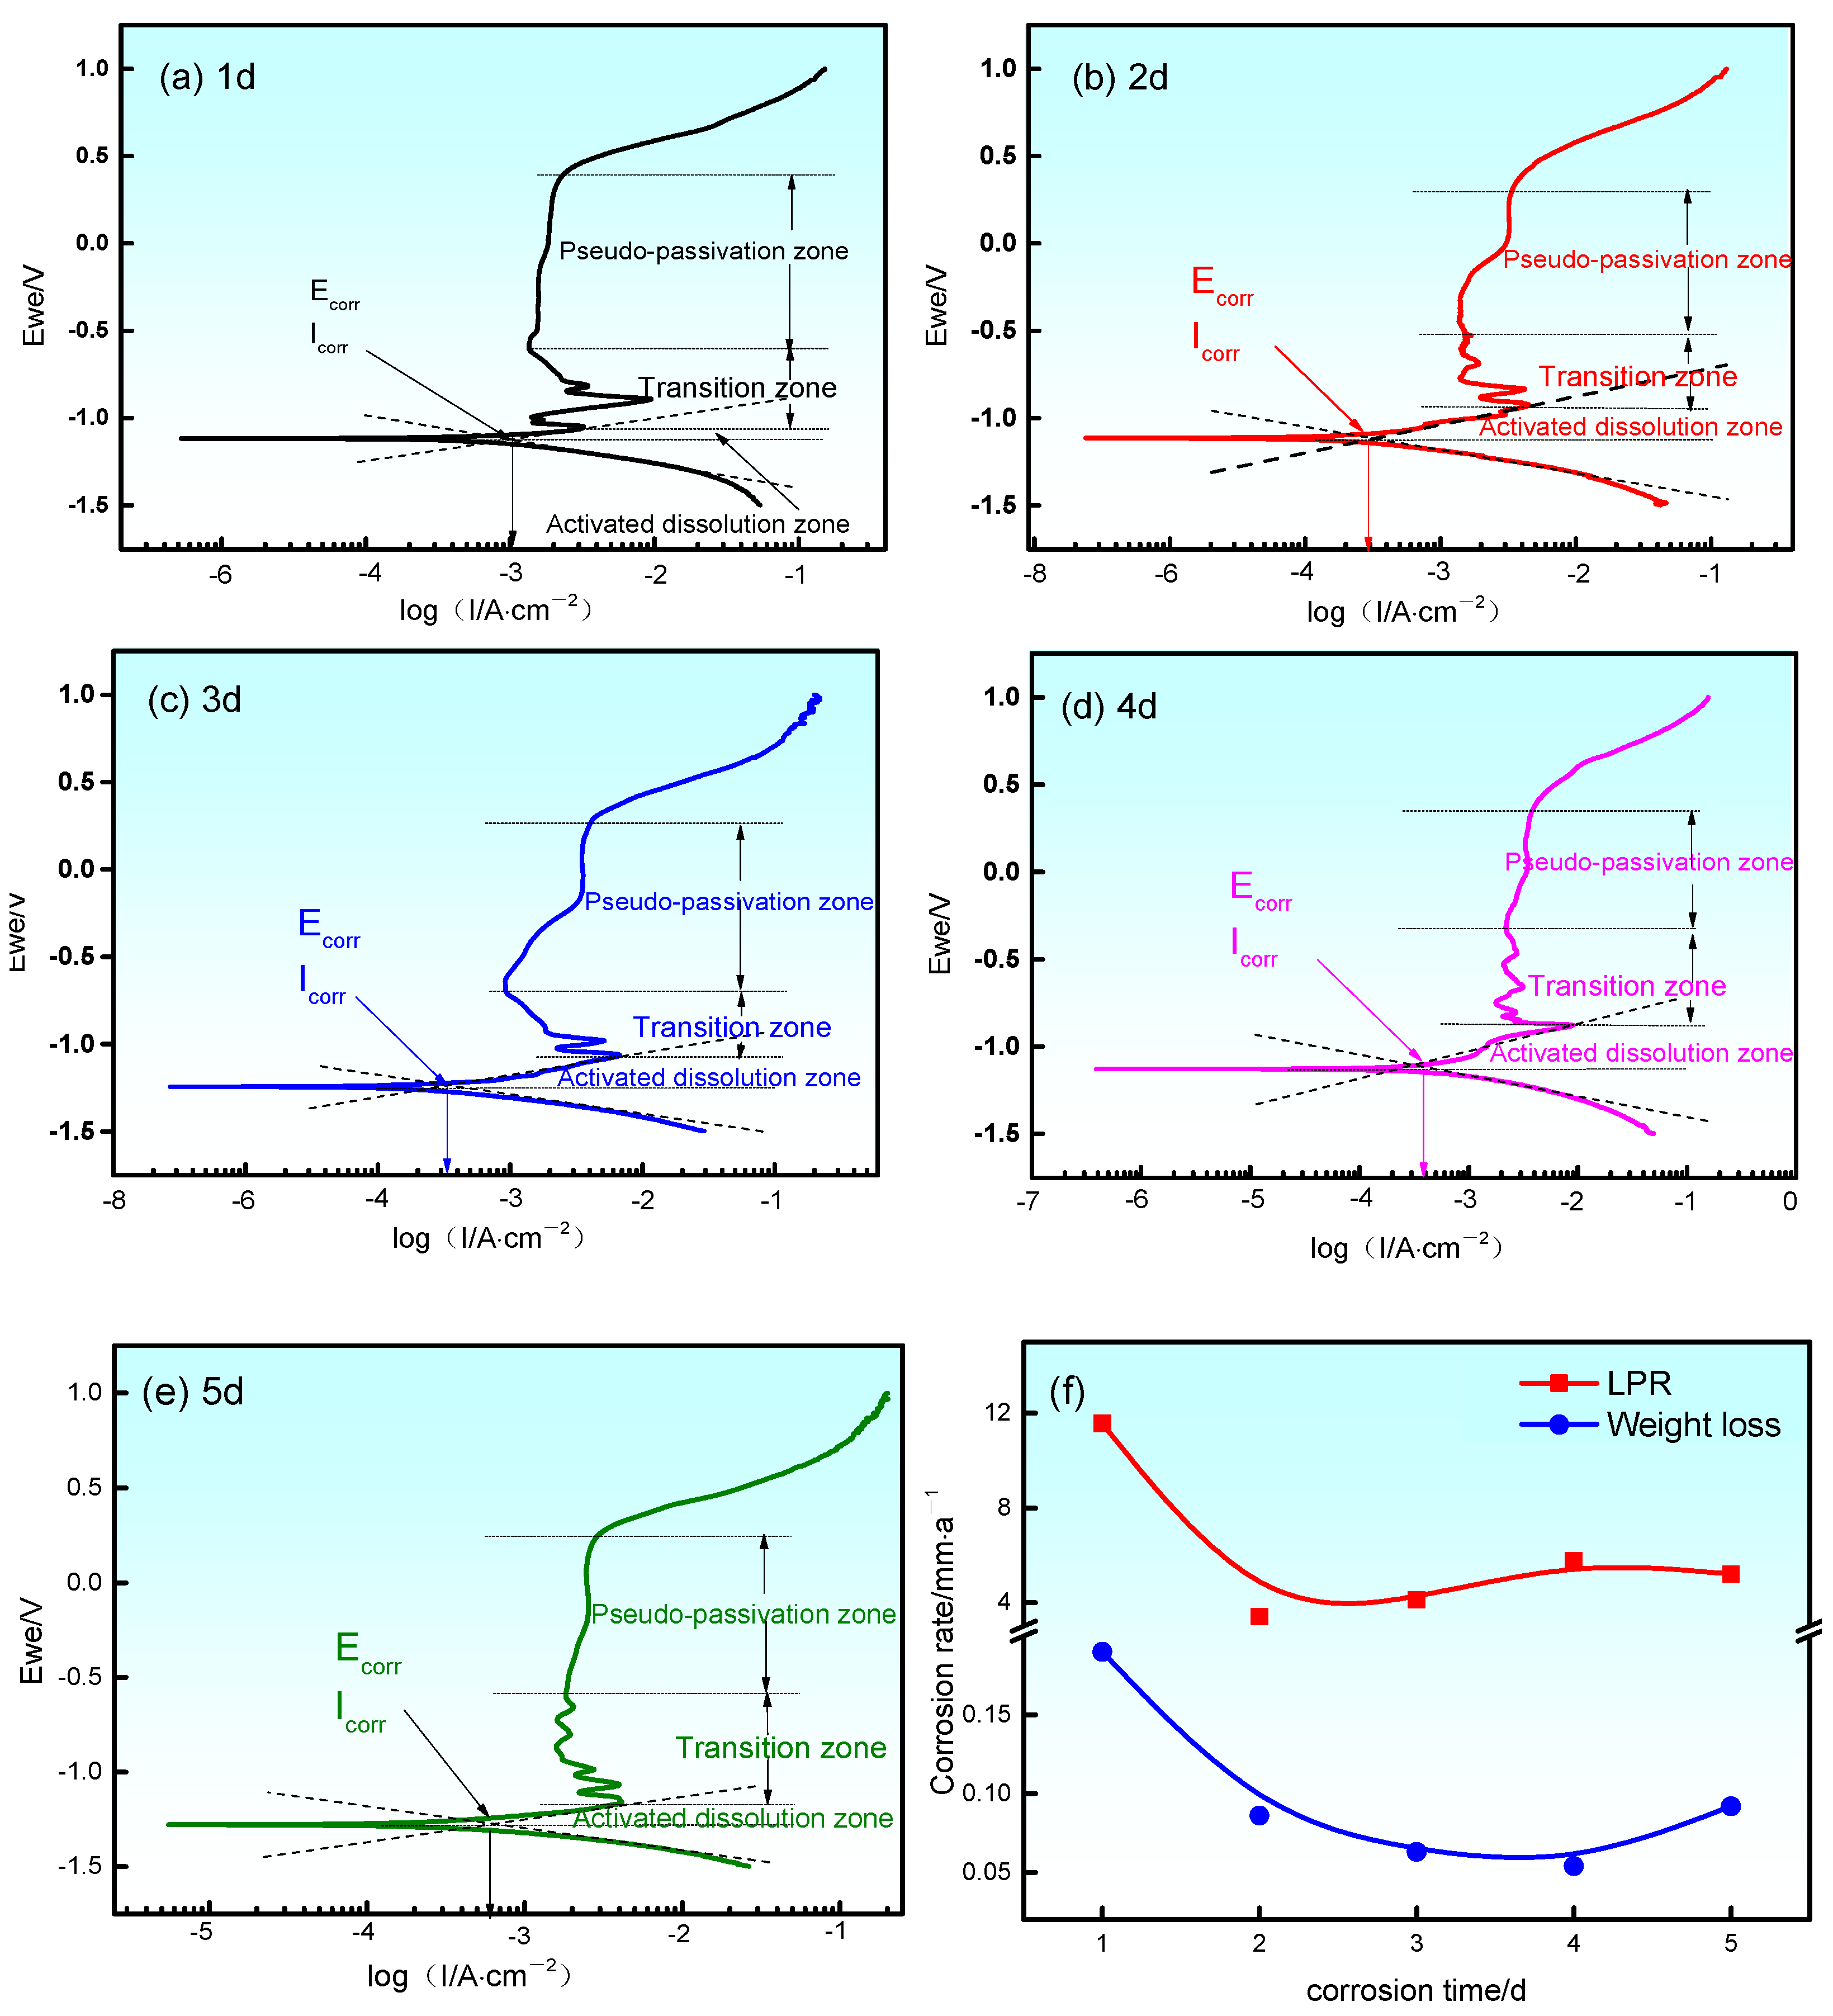
Different stages of the polarization curves correspond to different anode reactions. The dynamics of the Q235 steel electrode are controlled by charge transfer and ion diffusion for 3 d. However, at other times, the dynamics are mainly controlled by charge transfer.

Author Contributions

For research articles with three authors. Conceptualization, B.Q., C.C. and J.L.; methodology, B.Q. and C.C.; validation, B.Q. and C.C.; formal analysis, B.Q., C.C. and J.L.; resources, B.Q.; data curation, B.Q., C.C. and J.L.; writing—original draft preparation, B.Q.; writing—review and editing, B.Q., C.C. and J.L.; supervision, J.L. All authors have read and agreed to the published version of the manuscript.

Funding

This work was supported by the National Natured Science Foundation of China (grant no. 51774102 and U1812402), the Introduction Talent Fund Project of Guizhou University ([2019]43), and the Outstanding Youth Fund Project of Guizhou Province ([2017]5626).

Institutional Review Board Statement

“Not applicable” for studies not involving humans or animals.

Informed Consent Statement

“Not applicable” for studies not involving humans.

Data Availability Statement

Not applicable.

Conflicts of Interest

The authors declare no conflict of interest.

References

  1. Chai, W.; Huang, Y.; Peng, W.; Han, G.; Cao, Y.; Liu, J. Enhanced separation of pyrite from high-sulfur bauxite using 2-mercaptobenzimidazole as chelate collector: Flotation optimization and interaction mechanisms. Miner. Eng. 2018, 129, 93–101. [Google Scholar] [CrossRef]
  2. Wu, X. Study on Fluidized Roasting and Desulfurization of High-Sulfur Bauxite; Northeastern University: Shenyang, China, 2010. [Google Scholar]
  3. He, R.; Li, Z.; Zhang, N.; Tan, X. Study on the dissolution property of high-sulfur bauxite in Guizhou. J. Guizhou Univ. Technol. 2005, 34, 4–7. [Google Scholar]
  4. Liu, Z.W.; Li, D.Y.; Ma, W.H.; Yan, H.W.; Xie, K.Q.; Zheng, L.C.; Li, P.F. Sulfur removal by adding aluminum in the bayer process of high-sulfur bauxite. Miner. Eng. 2018, 119, 76–81. [Google Scholar] [CrossRef]
  5. Hu, X.-L.; Chen, W.-M.; Xie, Q.-L. Sulfur phase and sulfur removal in high sulfur-containing bauxite. Trans. Nonferrous Met. Soc. China 2011, 21, 1641–1647. [Google Scholar] [CrossRef]
  6. Lou, Z.N.; Xiong, Y.; Feng, X.D.; Shan, W.J.; Zhai, Y.C. Study on the roasting and leaching behavior of high-sulfur bauxite using ammonium bisulfate. Hydrometallurgy 2016, 165, 306–311. [Google Scholar] [CrossRef]
  7. Liu, Z.W.; Yan, H.W.; Ma, W.H.; Xie, K.Q.; Xu, B.Q.; Zheng, L. Digestion behavior and removal of sulfur in high-sulfur bauxite during bayer process. Miner. Eng. 2020, 149, 106237. [Google Scholar] [CrossRef]
  8. Zhou, X.; Yin, J.; Chen, Y.; Xia, W.; Xiang, X.; Yuan, X. Simultaneous removal of sulfur and iron by the seed precipitation of digestion solution for high-sulfur bauxite. Hydrometallurgy 2018, 181, 7–15. [Google Scholar] [CrossRef]
  9. Liu, Z.W.; Li, D.Y.; Ma, W.H.; Yan, H.W.; Xie, K.Q.; Zheng, L.C.; Li, P.F. Sulfur Removal by Adding Iron During the Digestion Process of High-sulfur Bauxite. Metall. Mater. Trans. B-Process. Metall. Mater. Process. Sci. 2018, 49, 509–513. [Google Scholar]
  10. Xie, Q.L.; Chen, W.M. Corrosion behavior of 16Mn low alloy steel in sulfide-containing Bayer solutions. Corros. Sci. 2014, 86, 252–260. [Google Scholar] [CrossRef]
  11. Sriram, R.; Tromans, D. The Anodic Polarization Behaviour of Carbon Steel in Hot Caustic Aluminate Solutions. Corros. Sci. 1985, 25, 79–91. [Google Scholar] [CrossRef]
  12. Wu, Z.; Wen, L. Stress corrosion cracking of steel in sodium aluminate solution. Chin. J. Corros. Prot. 1991, 11, 335–343. [Google Scholar]
  13. Xie, Q.; Chen, W. Effect of S2- on corrosion behavior of low alloy steel in sodium aluminate solution. Chin. J. Nonferrous Met. 2013, 23, 3462–3469. [Google Scholar]
  14. Quan, B.; Li, J.; Chen, C. Synergy Corrosion Effect of Thiosulfate and Sulfide on Q235 steel in Sodium Aluminate Solution. Mater. Res. Express 2019, 6, 025607. [Google Scholar]
  15. Niskanen, P.; Sanders, T.H., Jr.; Rinker, J.G.; Marek, M. Corrosion of aluminum alloys containing lithium. Corros. Sci. 1982, 283, 293–295, 304. [Google Scholar]
  16. Jiang, N.; Li, J.-F.; Zheng, Z.-Q.; Wei, X.-Y.; Li, Y.-F. Effect of aging on mechanical properties and localized corrosion behaviors of Al-Cu-Li alloy. Trans. Nonferrous. Met. Soc. China 2005, 15, 23–29. [Google Scholar]
  17. Onyeachu, I.B.; Obot, I.B.; Adesina, A.Y. Green corrosion inhibitor for oilfeld application II: The time–evolution effect on the sweet corrosion of API X60 steel in synthetic brine and the inhibition performance of 2-(2-pyridyl) benzimidazole under turbulent hydrodynamics. Corros. Sci. 2020, 168, 108589. [Google Scholar] [CrossRef]
  18. Chen, J.; Yang, H.Y.; Xu, G.Q.; Zhang, P.J.; Lv, J.; Sun, W.; Li, B.S.; Huang, J.; Wang, D.M.; Wu, Y.C. Phosphating passivation of vacuum evaporated Al/NdFeB magnets boosting high anti-corrosion performances. Surf. Coat. Technol. 2020, 399, 126115. [Google Scholar] [CrossRef]
  19. Rodrigues, J.F.Q.; Padilha, G.S.; Bortolozo, A.D.; Osório, W.R. Effect of sintering time on corrosion behavior of an Ag/Al/Nb/Ti/Zn alloy system. J. Alloys Compd. 2020, 834, 155039. [Google Scholar] [CrossRef]
  20. Bahmani, A.; Shin, K.S. Controlling the Microstructure and Texture Using Multidirectional Forging (MDF) to Develop a Low Corrosion Rate Mg Alloy. Corrosion 2020, 76, 750–765. [Google Scholar] [CrossRef]
  21. Young, J.; Reddy, R.G. Synthesis, mechanical properties, and in vitro corrosion behavior of biodegradable Zn-Li-Cu alloys. J. Alloys Compd. 2020, 844, 156257. [Google Scholar] [CrossRef]
  22. Wang, X.; Li, Y.; Meng, Y.S. Cryogenic Electron Microscopy for Characterizing and Diagnosing Batteries. Joule 2018, 2, 1–10. [Google Scholar] [CrossRef] [Green Version]
  23. Chen, F.; Tang, W.; Wu, S.; Wang, J. Ultrasound-assisted intensified crystallization of L-glutamic acid: Crystal nucleation and polymorph transformation. Ultrason. Sonochem. 2020, 68, 105227. [Google Scholar]
  24. Quan, B.-L.; Li, J.-Q.; Chen, C.-Y. Effect of sulfur on corrosion behavior of Q235 and 16Mn steel in sodium aluminate solutions. Mater. Res. Express 2020, 7, 035602. [Google Scholar] [CrossRef]
  25. Takeda, Y.; Akagi, J.; Edagawa, A.; Inagaki, M.; Naka, S. A preparation and polymorphic relations of sodium iron oxide (nafeo2). Mater. Res. Bull. 1980, 15, 1167–1172. [Google Scholar] [CrossRef]
  26. Bhattacharya, A.; Singh, P.M. Electrochemical behaviour of duplex stainless steels in caustic environment. Corros. Sci. 2011, 53, 71–81. [Google Scholar] [CrossRef]
  27. Lu, D.; Lv, G.; Zhang, T.-A.; Zhang, W. Roasting Pre-Treatment of High-Sulfur Bauxite for Sulfide Removal and Digestion Performance of Roasted Ore. Russ. J. Non-Ferr. Met. 2018, 59, 493–501. [Google Scholar]
  28. Yuan, J.; Chen, C.; Li, J.; Quan, B.; Lan, Y.; Wang, L.; Fu, H.; Gai, J. Initial Corrosion Behavior of 12Cr1MoV Steel in Thiosulfate-Containing Sodium Aluminate Solution. Metals 2020, 10, 1283. [Google Scholar] [CrossRef]
  29. Wei, B.; Qin, Q.; Fu, Q.; Bai, Y.; Xu, J.; Yu, C.; Sun, C.; Ke, W. X80 Steel Corrosion Induced by Alternating Current in Water-Saturated Acidic Soil. Corrosion 2020, 76, 248–267. [Google Scholar] [CrossRef]
  30. Wang, K.; Li, C.; Li, Y.; Lu, J.; Wang, Y.; Luo, X. A fully coupled model of hydrodynamic-chemical-electrochemical processes for CO2 uniform corrosion in multi-physics environment. J. Pet. Sci. Eng. 2020, 193, 107436. [Google Scholar] [CrossRef]
  31. Zakeri, M.; Naghizadeh, M.; Nakhaie, D.; Moayed, M.H. Pit Transition Potential and Repassivation Potential of Stainless Steel in Thiosulfate Solution. J. Electrochem. Soc. 2016, 163, C275–C281. [Google Scholar] [CrossRef] [Green Version]
  32. Xu, J.; Xiao, Q.; Mei, D.; Tong, Y.; Zheng, Y.; Li, L.; Zhong, Z. Microstructure, corrosion resistance and formation mechanism of alumina microarc oxidation coatings on sintered NdFeB permanent magnets. Surf. Coat. Technol. 2017, 309, 621–627. [Google Scholar] [CrossRef]
  33. Montgomery, E. The Corrosion Behavior of Oily Film Corrosion Preventative Compounds Applied to 1018 Steel. Ph.D. Thesis, The Pennsylvania State University, State College, PA, USA, 2008. [Google Scholar]
  34. Zhu, Z.; Li, S.; Zhang, R. Investigation of corrosion characteristics of Cu-10Ni-1.2Fe-xMn (x=0.53, 0.87, 1.19) alloy in 3.5% NaCl solution. Rsc Adv. 2021, 11, 11318–11328. [Google Scholar] [CrossRef]
  35. Diaz, B.; Guitian, B.; Novoa, X.R.; Perez, M.C. The effect of long-term atmospheric aging and temperature on the electrochemical behaviour of steel rebars in mortar. Corros. Sci. 2018, 140, 143–150. [Google Scholar] [CrossRef]
  36. Ahmed, I.; Islam, A.; Ali, N. Determination Of Corrosion Rate Of Mild Steel In Different Medium Measuring Current Density. In Proceedings of the International Conference on Mechanical Engineering and Renewable Energy 2017 (ICMERE2017), Chittagong, Bangladesh, 18–20 December 2017. [Google Scholar]
  37. Khamseh, S.; Alibakhshi, E.; Ramezanzadeh, B.; Lecomte, J.-S.; Laheurte, P.; Noirefalize, X.; Laoutid, F.; Vahabi, H. Tailoring hardness and electrochemical performance of TC4 coated Cu/a-C thin coating with introducing second metal Zr. Corros. Sci. 2020, 172, 108713. [Google Scholar] [CrossRef]
  38. Zhang, G.A.; Lu, M.X.; Qiu, Y.B.; Guo, X.P.; Chen, Z.Y. The Relationship between the Formation Process of Corrosion Scales and the Electrochemical Mechanism of Carbon Steel in High Pressure CO2-Containing Formation Water. J. Electrochem. Soc. 2012, 159, C393–C402. [Google Scholar] [CrossRef]
  39. Tang, S.K.; Dai, Z.X.; Tan, G.L.; Gong, S.; Liu, B.; Xie, G.L.; Peng, L.J.; Guo, J.L.; Li, Z. High-strength, ductility and corrosion-resistant in a novel Cu20Ni20Mn0.3Cr0.3Al alloy. Mater. Chem. Phys. 2020, 252, 123177. [Google Scholar] [CrossRef]
  40. He, B.; Lu, C.-H.; Han, P.-J.; Bai, X.-H. Short-term electrochemical corrosion behavior of pipeline steel in saline sandy environments. Eng. Fail. Anal. 2016, 59, 410–418. [Google Scholar] [CrossRef]
  41. De Motte, R.; Basilico, E.; Mingant, R.; Kittel, J.; Ropital, F.; Combrade, P.; Necib, S.; Deydier, V.; Crusset, D.; Marcelin, S. A study by electrochemical impedance spectroscopy and surface analysis of corrosion product layers formed during CO2 corrosion of low alloy steel. Corros. Sci. 2020, 172, 108666. [Google Scholar] [CrossRef]
  42. Mythreyi, O.V.; Raja, A.; Nagesha, B.K.; Jayaganthan, R. Corrosion Study of Selective Laser Melted IN718 Alloy upon Post Heat Treatment and Shot Peening. Metals 2020, 10, 19. [Google Scholar] [CrossRef]
  43. Shi, J.; Ming, J.; Sun, W.; Zhang, Y. Corrosion performance of reinforcing steel in concrete under simultaneous flexural load and chlorides attack. Constr. Build. Mater. 2017, 149, 315–326. [Google Scholar] [CrossRef]
  44. Guo, F.; Duan, S.; Wu, D.; Matsuda, K.; Wang, T.; Zou, Y. Facile etching fabrication of superhydrophobic 7055 aluminum alloy surface towards chloride environment anticorrosion. Corros. Sci. 2021, 182, 109262. [Google Scholar] [CrossRef]
  45. Fu, H.; Chen, C.-Y.; Li, J.-Q.; Lan, Y.-P.; Zhang, X.-Q.; Yuan, J.-J. Effect of Time on the Corrosion of Q345 Steel in Thiosulfate Sodium Aluminate Solution. Surf. Technol. 2018, 47, 166–172. [Google Scholar]
  46. Zou, J.Y.; Chin, D.T. Anodic Behavior Of Carbon-Steel In Concentrated Naoh Solutions. Electrochim. Acta 1988, 33, 477–485. [Google Scholar] [CrossRef]
  47. Vladimirov, M.G.; Ryzhkov, Y.F.; Alekseev, V.A.; Bogdanovskaya, V.A.; Otroshchenko, V.A. Electrochemical reduction of carbon dioxide on pyrite as a pathway for abiogenic formation of organic molecules. Orig. Life Evol. Biosph. 2004, 34, 347–360. [Google Scholar] [CrossRef] [PubMed]
  48. Crowe, D.C. The High Temperature Electrochemical Behavior Of Carbon Steel In Alkaline Sulfide Solutions. Ph.D. Thesis, The University Of British Columbia, Vancouver, BC, Canada, 1985. [Google Scholar] [CrossRef]
Figure 1. Schematic diagram of the autoclave for the immersion corrosion experiment.
Metals 11 00753 g001
Figure 2. Schematic diagram of electrochemical workstation.
Metals 11 00753 g002
Figure 3. SEM morphologies (a,b,d,e,g,h,j,k,m,n), EDS analysis (c,f,i,l,o) and element distribution (p) of the corrosion products on the Q235 steel surface, with the following different corrosion times: (ac) 1 d; (df) 2 d; (g,h,i,p) 3 d; (jl) 4 d; and (mo) 5 d.
Metals 11 00753 g003
Figure 4. XRD analysis of the Q235 steel surface corrosion products with different corrosion times (a) and E-pH diagram of Fe–Al–S–H2O at 110 °C (b).
Metals 11 00753 g004
Figure 5. AFM images (ac) and schematic (d) of the corrosion products on the Q235 steel surface with different corrosion times.
Metals 11 00753 g005
Figure 6. Corrosion rate of Q235 steels with different corrosion times. (a) 1–13 d; (b) 1–4 d.
Metals 11 00753 g006
Figure 7. Polarization curves (ae) for different corrosion times and a comparison with the weight-loss method (f) of Q235 steel.
Metals 11 00753 g007
Figure 8. EIS of Q235 steels with different corrosion times. (a) Nyquist plots; and (b) Bode plots.
Metals 11 00753 g008
Figure 9. Equivalent circuit for EIS of Q235 steels with different corrosion times. (a) 1 d, 2 d, 4 d, 5 d; and (b) 3 d.
Metals 11 00753 g009
Figure 10. Evolution of Rct + Rf, Rct and Rf for Q235 steels with different corrosion times.
Metals 11 00753 g010
Figure 11. Illustration of the structural evolution of corrosion products.
Metals 11 00753 g011
Table 1. Chemical composition of the sulfur-containing sodium aluminate solutions.
NoNaOH/g·L−1Al2O3/g·L−1S2−/g·L−1S2O32−/g·L−1
125511053
21109033
31109034
41109036
Table 2. Fitting results of corrosion kinetics.
Concentration of Sulfide/(g∙L−1)Rate Equation/(mm·a−1)R2
3 g·L−1 S2− and 3 g·L−1 S2O32− R = 0.077 × t 1.136 0.933
3 g·L−1 S2− and 4 g·L−1 S2O32− R = 0.058 × t 1.286 0.972
5 g·L−1 S2− and 3 g·L−1 S2O32− R = 0.188 × t 1.003 0.985
3 g·L−1 S2− and 6 g·L−1 S2O32− R = 0.667 × t 0.904 0.882
Table 3. Fitting results of the Q235 steel polarization curves with different corrosion times.
Corrosion Time
/d
Ecorr
/V
Icorr
/uA·cm−2
βa
/mV
βc
/mV
Rp
/Ω·cm2
Corrosion Rate
/mm·a−1
1−1.12983.40309.00209.8826.5311.57
2−1.11315.71153.26128.1790.063.41
3−1.24350.28127.16118.5075.964.12
4−1.13491.31217.61170.7653.105.78
5−1.28443.31143.23107.2258.845.21
Table 4. Impedance parameters obtained on Q235 steels with different corrosion times.
Impedance ParametersCorrosion Time/d
12345
Rs/ Ω·cm21.422.381.270.981.22
Rct/ Ω·cm2369.4190.9583.41384.01567.0
CPEdl(Y0)/Ω−1·cm−2·sn0.070.010.080.250.48
n10.790.550.960.950.89
Rf/Ω·cm279.2131.4830.050.390.09
CPEf(Y0)/Ω−1·cm−2·sn0.060.0040.0020.000030.02
n20.850.810.850.980.92
WR/Ω·cm2428.50
WT132.50
WP0.39
X2 (10−4)4.279.158.313.382.72
Publisher’s Note: MDPI stays neutral with regard to jurisdictional claims in published maps and institutional affiliations.

