Article

Microstructure and Anisotropy of the Mechanical Properties of 316L Stainless Steel Fabricated by Selective Laser Melting

1
College of Materials and Metallurgy, Guizhou University, Guiyang 550025, China
2
Guizhou Key Laboratory for Mechanical Behavior and Microstructure of Materials, Guizhou University, Guiyang 550025, China
3
National & Local Joint Engineering Laboratory for High-performance Metal Structure Material and Advanced Manufacturing Technology, Guiyang 550025, China
*
Author to whom correspondence should be addressed.
Metals 2021, 11(5), 775; https://doi.org/10.3390/met11050775
Submission received: 23 April 2021 / Revised: 3 May 2021 / Accepted: 7 May 2021 / Published: 10 May 2021

Abstract

:
Significant anisotropy in mechanical properties was observed in 316L stainless steel (SS) that was subjected to selective laser melting (SLM) to produce a hierarchical structure, composed of molten pool, columnar grains, and a cellular substructure. Such anisotropy was induced by the geometric relationship between the boundary of the molten pool and the tensile force. The in situ tensile test showed initial deformation rapidly occurred at the boundary of the molten pool, followed by strain localization, and a lower ductility was obtained when loaded in the longitudinal direction (perpendicular to the molten pool). By contrast, the deformation was significantly constrained because of the geometry of the boundary of the molten pool, and substantial deformation occurred in the cellular substructure during loading in transverse direction (parallel to the molten pool). Finally, the quantitative analysis revealed that the high-level strength was attributed to the high-density dislocations and the fine cellular substructure.

1. Introduction

Additive manufacturing (AM) has attracted much attention due to its integrated molding capabilities and time and cost savings [1,2,3]. Selective laser melting (SLM) is an important branch of AM [4]. SLM is a rapid prototyping technology, that solves the problems associated with traditional methods such as long cycles, high cost, and difficult machining, and has substantial advantages in the preparation of complex parts [5].
The SLM process involves the melting and solidification of powder layer by layer. The heating and cooling rate is relatively fast, and the cooling rate is approximately 103–108 K s−1 [6,7], resulting in a high temperature gradient during SLM (approximately 106 km−1) [8,9]. High-temperature gradients, coupled with a complex reheating history, allow dendrite/columnar grains to grow epitaxially and form cellular substructures, with large thermal stress [10,11,12], for example, 316L stainless steel (SS) used in biomedicine and mechanical engineering [13,14,15,16,17,18,19]. Compared with 316L SS built by the conventional method, the different microstructures of 316L SS built by SLM will lead to excellent mechanical properties and often used for some important structural parts [20,21]. The presence of fine cellular substructures and the stacking of dislocations at the boundary of the substructure increase the strength and hardness [22,23]. The complex heating process of SLM can produce some defects (porosity and lack of fusion, etc.) [24,25] that will certainly have adverse effects on the tensile properties and cause anisotropy of the mechanical properties [19,26].
Most of the current research on AM 316L SS focuses on the relationship between the microstructure, strength, and ductility. Zhong et al. believe that the cellular segregation network structure was the reason for the increase in yield strength (YS) of SLM-manufactured 316L SS [27]. Suryawanshi et al. believed that the significant increase in the (YS) caused by SLM-manufactured 316L SS can be attributed to the significant refinement of the microstructure [28]. Barkia et al. believed that the pre-existing dislocation structure made an important contribution to the high strength of AM 316L SS. [29]. Wang et al. reported that the high YS of AM 316L SS is attributed to the cellular substructures, high dislocation density, and low angle grain boundary (LAGB), while the cellular substructure and deformation twinning are factors that improve ductility [30]. Pham et al. believed that the twin-induced plasticity (TWIP) behavior can still provide excellent ductility for steel [31]. Many studies believe that the anisotropy of mechanical properties is caused by defects. Jeon et al. studied the effect of defects on the anisotropy of the tensile process, and the shape of the hole was considered to be the main cause of the anisotropy [32]. Casati et al. believed that imperfections in the layer boundary are the main cause of anisotropy [19]. Some studies have reported the influence of microstructure on mechanical anisotropy. Suryawanshi et al. discovered that the anisotropy of a SLM-manufactured alloy is attributed to the anisotropic microstructure, which is attributed to the high ratio of the pool width to the layer thickness [28]. Bahl et al. believed the lower average Schmid factor and smaller effective grain size in the horizontal build by virtues of crystallographic and morphological textures, respectively, imparted higher yield strength than the vertical build [33]. Regrettably, the research on the microstructure is still not perfect. These are the results of static analysis, and the influence of the changes in the microstructure during the deformation process on the anisotropy is not clear enough.
To solve this problem, the 316L SS samples in this experiment were built by SLM to study their microstructural characteristics and correlate the microstructure to the tensile property anisotropy. Then, the influence of the deformation mechanism of the molten pool and cellular substructure on the anisotropy of tensile properties was studied through in situ tensile test.

2. Materials and Methods

Gas atomized spherical 316L SS powder (from AVIC Maite Powder Metallurgy Technology Co., Ltd., Beijing, China) with particle size of 15–53 μm was used as the starting material. The as-received powder with the following composition (in wt%): <0.03 C, 2.48 Mo, 0.02 P, 0.57 Si, 0.23 Mn, 0.02 S, 12.03 Ni, and 17.91 Cr, the rest being Fe. The SLM-manufactured 316L SS samples examined in this study were fabricated by using the laser machine (as shown in Figure 1a, YLM-300, Yongnian Laser Forming Technology Co., Ltd., Jiangsu, China), equipped with a Yb-YAG fiber laser with a maximum power of 500 W, and with built plate dimensions of 120 mm × 70 mm × 10 mm. The process parameters used to prepare the samples were as follows: laser power −200 W, scanning speed −400 mm/s, hatch distance −70 µm, layer thickness −30 µm, and scan rotation between successive layers −67°. The SLM process was carried out under high-purity nitrogen to avoid oxygen pollution (O2 < 200 ppm). A chess scanning strategy (Figure 1b) is applied, with a size of 3 mm × 3 mm for each checkerboard and the scanning of adjacent layers rotated 67°, as shown in Figure 1a. After building the sample, stress relief annealing treatment was performed at 371 °C for 2 h according to the SAE AMS 2759/11 standard [34].
For microstructural analyses, the lateral surface and the top surface refer to the surfaces parallel and perpendicular to the building direction, respectively, as shown in Figure 1c. For Optical microscopy (OM, Sunny Optical Technology (Group) Co., Ltd., Zhejiang, China) and scanning electron microscopy (SEM, Carl Zeiss AG, Jena, Germany) analyses, the samples were first coarsely ground and finely ground, followed by polishing and chemical etching for 10 s with HCl:HNO3:H2O (1:1:1). The microstructure was analyzed by an SDPTOP ICX4IM optical microscope and ZEISS SUPRA40 scanning electron microscope equipped with an electron backscatter diffraction (EBSD) detector. After the EBSD specimen was mechanically processed and then electrolytically polished in a 10% oxalic acid aqueous solution at 15 V for 20 s, the EBSD samples were analyzed with a step size of 0.45 μm. A 20 kV voltage was used for EBSD on the sectioned surface now aligned at 70° tilt with the electron beam at a working distance of 10mm. The analysis of the EBSD results were carried out by using Channel 5 (Oxford Instruments, Oxford, United Kingdom) and ATEX 2.21 software (Laboratory of Microscopy and Mechanics, University of Lorraine, Lorraine, France). The foil sample (the size is 8 mm × 8 mm) for transmission electron microscopy (TEM, Philips Electronics Ltd., Eindhoven, Netherlands) characterization was mechanically ground to a thickness of approximately 100 μm and then electro polished by a Gatan twin-jet electro polisher in the solution of 5 vol.% perchloric acid and 95 vol.% ethanol at −30 °C and 30 V. Detailed microstructural analysis was performed with a Philips CM12 transmission electron microscope (TEM) at 200 kV.
To investigate the tensile properties of the as-built 316L SS, longitudinal (parallel to the direction of additive manufacturing) and transverse (perpendicular to the direction of additive manufacturing) dog-bone shaped tensile specimens (Figure 1d) were machined from the AM parts, as shown in Figure 1c. The gauge length was 24 mm, the width was 8 mm, and the thickness was 3 mm. The tensile properties were tested on an Instron8501 universal testing machine. The samples were tested at room temperature according to the ASTM E8 standard [35], and the tensile rate was 0.5 mm/min.
In situ tensile test was performed with a ZEISS SUPRA40 SEM. The in situ tensile test specimens with 1 mm in thickness, a gauge length of 6 mm, and a gauge width of 2.5 mm, respectively. The microstructure of the specimens can be clearly seen after etching, and strained with a crosshead speed of 1 μm/s.

3. Results

3.1. Microstructure

The as-built samples have obvious solidification track in the macroscopic scale and cellular substructure in the microscopic scale. The “fish scale” molten pool can be macroscopically observed in Figure 2a and many columnar grains grow through the boundary of the molten pool, indicating that the columnar grain grows epitaxially in the direction of the maximum temperature gradient. As shown in Figure 2b, a long strip of scanning trace can be clearly seen on the top surface of the specimen. The intersection angle between the adjacent layers is 67°, and the hatch distance between the two arrows is about 70 μm, corresponding to the experimental parameters. Figure 2c shows the morphology of the molten pool on the lateral surface, and some columnar substructures pass through the boundary of the molten pool. Cellular substructures with the nano-size scale could also be identified in the morphology of the top surface, as shown in Figure 2d. Figure 2e shows the high-magnification morphology of the lateral surface. Obvious columnar and cellular substructure is observed. Columnar substructure is about 0.8µm in diameter and a few tens of microns in length. In Figure 2f, a fine cellular substructure of the top surface with size of 0.2–0.8 μm is revealed, and the average size is approximately 0.6 μm.
EBSD was used to characterize the grain on the lateral surface and the top surface of the sample. Columnar grains are observed on the lateral surface in Figure 3a and no molten pool is noticeable because grain crosses the boundary of molten pool. This is consistent with Casati’s study [19]. During melting from the same layer or adjacent layers, the material will partially remelt, which can lead to the formation of new solids by maintaining the same lattice orientation of nearby grains and growing toward the center of the molten pool in the direction of the highest temperature gradient. Therefore, the columnar grain is parallel to the building direction and has obvious directionality. The high aspect ratio of grains obtained in AM usually result in anisotropic plastic behavior of the metal when tested in different grain directions [36]. Figure 3b is the grain size diagram on the lateral surface, and the average grain size is 42 μm. Some mixed grains whose shape and size are not uniform, and small grains embedded in the boundary of larger grains can be identified in Figure 3c. Figure 3d reveals the grain size distribution of the top surface and the average grain size is 18.7 μm. The average grain size of the lateral surface is twice that of the top surface.
The presence of fine cellular substructures in the matrix can be identified by TEM analysis. As shown in Figure 4a, within this region of the TEM image of the top surface, grain boundaries are visible, and cellular substructures (smaller than 0.2–0.8 μm) can be observed within the grain, which is consistent with another study of SLM-manufactured 316L SS [37]. In addition, the boundary of the cellular substructures appears dark, resulting from high concentrations of accumulated or entangled dislocations. Figure 4b shows the presence of dislocations on and within the boundary of the cellular substructures, focusing mainly on the boundary of the cellular substructures. Figure 4c shows that there are columnar substructures and some dislocations entanglements on the boundary. This corresponds to the substructure shown in the SEM images. At local magnification of Figure 4c, the columnar interior is seen as an irregular, compartmentalized cellular substructure, as shown in Figure 4d. Figure 4e is a high-resolution image of a dark region at the boundary of a cellular substructure. After Fourier transformation, a large number of dislocations can be observed in Figure 4f, stacking up at the boundary of the cellular substructures; therefore, the black region is a tangle of dislocations.

3.2. Mechanical Properties

The tensile properties of the transverse and longitudinal Specimens are tested. The transverse and longitudinal Stress–Strain curves are shown in Figure 5. The strength (YS and ultimate tensile strength (UTS)) and elongation (El) of the SLM-manufactured samples built in the transverse (UTS of approximately 720 MPa, YS of approximately 570 MPa, and El of approximately 48%) and longitudinal (UTS of approximately 610 MPa, YS of 510 MPa, and El of approximately 18%) directions were significantly different. The YS of the transverse specimen was 1.1 times that of the longitudinal Specimen, and the El of the transverse was 2.7 times that of the longitudinal specimen, which shows that the loading direction had a great influence on the result.
Figure 6 shows that the samples built in this paper (the red circle is transverse and the green circle is longitudinal) had better combination of YS and El compared to the result of previous studies [28,29,32,38,39], and that the process parameters and scanning strategies are more reasonable. Compared with the as-cast samples, the strength of the transverse sample is improved by nearly 300 MPa, and the El was maintained approximately about 48%, forming a strength–elongation match.
The fracture surfaces were observed by SEM and representative images are reported in Figure 7. The transverse specimens show typical characteristics of ductile fracture. Shear lips are clearly visible, and the necking is more obvious, as shown in Figure 7a. In addition, the fracture surfaces are tortuous. Figure 7b shows the presence of significant secondary cracks and ridges. At high magnification of the small red frame area, some dense, uniform fracture units with sizes of approximately 0.2–0.8 μm can be observed, which are similar in size to the cellular substructures in the microstructure (Figure 2d). These small fracture units (with an average size of 0.6 μm) tend to increase the fracture surface area, thus absorbing more deformation energy and increasing the crack propagation work while, improving the ductility by delaying the fracture process. From the macroscopic scale, the fracture surface of the longitudinal specimen is apparently smooth and has many small holes, as shown in Figure 7c. At high magnification, Figure 7d clearly shows that there are some unmelted powder units inside the pores. The fracture positions of the longitudinal specimens are mostly concentrated at the existing pores. In the process of tensile deformation, the original pores are prone to stress concentration. At this time, cracks easily initiate, and the adjacent defect produce small cracks that quickly connect to form large cracks, reducing the crack propagation work. Therefore, the pores become one of the influencing factors of fracture.

3.3. In Situ Tensile Test

Many reports have studied the anisotropy of mechanical properties. The poor along mechanical properties the building direction is attributed to the presence of build defects (porosity and lack of fusion) [19,32]. There are relatively few studies on the influence of the deformation of its microstructure on its ductility. We have learned that SLM-manufactured 316L SS have molten pools and cellular substructures, but the deformation mechanism of these microstructures during the stretching process and their influence on mechanical properties is still unclear. Therefore, by loading the tensile force in different directions, and performing in situ stretching, observe the deformation trend of its microstructure. Figure 8a is a schematic diagram of tensile force loading. Figure 8b shows the stress–strain curve.
Figure 9 shows the microstructure of the original specimens before tensile test. Obvious cellular and columnar substructures can be observed in the original samples. In Figure 9a, the angle between the molten pool boundary and the horizontal direction of the transverse specimen is 14.04°, while in Figure 9b, the angle between the longitudinal specimen is 76.44°. The red areas in the transverse specimens and the yellow areas in the longitudinal specimens were observed. The red and yellow boxes are the cellular substructure in high magnifications.
Figure 10a–d reveals the structural deformation of the transverse specimen during the in situ tensile test. As shown in Figure 10a, when the strain is 4.08% and near the yield point, the boundary of the molten pool and cellular substructure have no obvious deformation trend, which is consistent with Wang’s research: at low deformation, the cellular substructure exhibits strong dislocation trapping and a strong retention mechanism, which hinders the movement of the dislocation [30]. As the amount of strain increases, the angle between the boundary of the molten pool and the horizontal direction gradually decreases, and the cellular and columnar substructures are gradually elongated along the tensile direction. As shown in Figure 10c, when the strain is 14.17%, the boundary of molten pool is close to parallel to the loading tension, and its deformation is more difficult. Obvious slip bands are observed in the columnar substructure, which cuts through the columnar substructure at an angle of 45° to the stretching direction. At the same time, as shown in the magnified image in the red box, there is obvious inside the cellular substructure. Obvious tearing also appeared in the boundary of cellular substructure and the internal substructure coordinated the deformation of a larger part of the molten pool boundary. The angle between the transverse sample and the horizontal direction in Figure 10d is −2.65°. At this time, the angle becomes a negative number. The reason may be that the deformation at this time is relatively large and tearing occurs in other areas. Secondly, the boundary of the cellular substructure is completely broken, and the deformed convex feature is more obvious, passing through the boundary of the cellular substructure.
Figure 11a’–d’ reveals the structural deformation of the longitudinal specimen during the stretching process. As shown in Figure 11a′, when the strain is 4.08%, like the transverse sample, the molten pool boundary and the cellular substructure of the longitudinal sample hardly change. Figure 11b’ shows that under 10% strain, the boundary of the molten pool gradually widens, and the partial enlarged view of the yellow box shows that the cellular substructure is gradually elongated. With the increase of the amount of strain, the amount of change in the angle between the boundary of the molten pool and the horizontal direction suddenly increases to 7.92° under 14.17% strain. Figure 11c’ reveals the boundary of the molten pool becomes wider and there are signs of tearing, which shows that the stress concentration at the boundary of the molten pool is greater at this time, and the cellular substructure becomes flat and the change is more obvious. As shown in Figure 11d’, the change in the included angle is reduced to 6.65° when the strain is 17.08, and the boundary of the molten pool is further widened, causing tearing. At higher magnification, the skew of the cellular substructure relative to Figure 11c’ can be observed, but there is no significant change in size. This may be because the boundary of the molten pool is destroyed and the stress is relieved, so the honeycomb structure is no longer deformed and the angle of the molten pool boundary with the horizontal direction is naturally small.
As indicated by the black arrow in a low-magnification image of the transverse specimen (Figure 12a), a local tear occurs in the substructure, and the torn part passes through the molten pool boundary. Most of the molten pool produces a large deformation, but no sign of tearing at the molten pool boundary parallel to the tensile force, and the tensile force with an obtuse or acute angle to the molten pool boundary produces tearing. Figure 12b is the low magnification of the longitudinal specimen. Some deformation of the substructure can be observed, but the tearing of the boundary of the molten pool is more obvious, as shown by the black arrow.

4. Discussion

4.1. Strengthening Mechanism of SLMed 316L SS

As shown in Figure 6, the yield strength of 316L produced by SLM was significantly higher compared to the wrought alloy. Due to the higher yield strength of the transverse sample, we chose the transverse sample to facilitate the study. Many reports have explored the origin of the high strength [33,40]. However, it is not perfect, and most of them ignore the role of cellular substructure. Cellular substructures are believed to be the main reason for the improvement in the YS of SLM-manufactured 316L SS [27,28,29,30]. Cellular substructure boundaries with high dislocation density hinder the movement of dislocations, thereby enhancing the storage of dislocations and resulting in a high YS [30]. In addition, slippage also makes it difficult to transfer the force between cellular substructures [41]. Considering the present scenario, the strengthening effect in the SLM-manufactured 316L SS, is due to a combination of cellular substructure refinement strengthening, dislocation strengthening, low-angle grain boundary strengthening, and solution strengthening. The general equation is:
σ y = σ c s + σ d + σ L A G B + σ s
where σy is the YS of the 316L SS, σcs is cellular substructure refinement strengthening, σd is dislocation strengthening, σLAGB is low-angle grain boundary strengthening, and σS is solid solution strengthening. The four values represent their respective contributions.
The flow stress of the deformed metal is inversely proportional to the size of the dislocation element. According to the Hall–Petch relation, the strength of polycrystalline metals can be effectively improved by refining the grain size. Therefore, the theoretical YS of the SLM-manufactured 316L SS is calculated based on the average cellular substructure size (L), approximately 0.6 μm, assuming that it conforms to the Hall–Petch-type strengthening mechanism:
σ y = σ 0 + k d 1 2
where σ0 and k are 183.31 and 253.66, respectively, in AM 316L SS [30].
Figure 13 shows the comparison between the calculated value and the experimental value of the average size of the cellular substructure and columnar grains. For the SLM-manufactured 316L SS, the YS calculated based on the cellular substructures is 511 MPa, which is the closest to the experimental value, accounting for 89% of the experimental value, and the calculated value of the YS based on the grains is 222 MPa, which is much smaller than the experimental YS of 573 MPa. This further indicates that the cellular substructure may have a greater contribution to the YS.
Due to the large number of dislocation entanglements on the boundary of the cellular substructure, the contribution of the dislocation density should be considered when calculating the YS based on the size of the substructure, Hong’s research has indicated this point [23]. This article uses ATEX, an EBSD analysis software, to calculate geometrically necessary dislocations (GNDs), approximately 6.78 × 10¹⁴ m−2, as shown in Figure 14.
The relationship between the geometric dislocation density and flow stress (σ) can be calculated using Taylor’s formula [42]:
Δ σ = α M G b ρ
where M is the Taylor factor (3.06 for FCC materials), α is a constant (0.2 for FCC materials) [43], G (79GPa) is the shear modulus, and b (0.25nm) is the Burgers vector [33]. In summary, the contribution of the dislocation density to the YS is 315 MPa, and the YS calculated based on the cellular substructure is approximately 511 MPa, so it can be seen that the contribution of substructure refinement to the strength is approximately 196 MPa.
The solution strengthening value can be obtained by the following method. The stress–strain curve was obtained by solution treatment at 1200 °C.
According to the experimental data of Figure 15a, the YS is 275 ± 6 MPa. After solution, the grain has recrystallized and the average grain size is 26.7 ± 5 μm. Considering the effect of grain boundary strengthening, according to Formula 2, the contribution of the grain size to the strength at 1200 °C for 6 h is 232MPa. So σs is 43 MPa.
Finally, the contribution of the low-angle grain boundary to the strength is calculated by the following formula:
σ L A G B = σ y σ c s σ d σ s
The strengthening effect of σLAGB is 19 MPa. The relationship between the low-angle grain boundaries and strength can also be calculated using σ = α MG [ 1.5 bS v θ ]   1 2 [44], where Sv is the area of boundaries per unit volume. As shown in Figure 16, the four strengthening mechanisms (cellular substructure refinement strengthening, dislocation strengthening, low-angle grain boundary strengthening, and solution strengthening) account for 34%, 55%, 3%, and 8% of the total strength. Obviously, the strengthening effect of cellular substructure refinement and dislocation is significant.

4.2. The Influence of Microstructure Deformation on Anisotropy of Tensile Properties

Figure 17a,b describe the change trend of the transverse specimen and the longitudinal specimen under the 14.17% strain. As shown in Figure 17a, the boundary of the molten pool (marked by the black arrow) with an acute or obtuse angle to the tensile force becomes wider and there is a tendency to tear, while the boundary of the molten pool parallel to the tensile force deforms not so obvious. In Figure 17b, it is obvious that there are obvious signs of tearing at the boundary of the molten pool, as shown by the black arrow. It can be seen that under the same strain, the boundary of the molten pool is more likely to deform.
Based on the analysis of the above all experimental results, the tensile deformation process involves the deformation of the molten pool and substructures. The molten pool boundary can be regarded as weak areas of the material. The metal ductile deformation at room temperature for traditional castings and forgings is mainly attributed to the grain slipping. Besides grain slipping, the SLM part has an additional influencing factor, the boundary of the molten pool. In the deformation of SLM parts, slipping along the boundary of the molten pool preferentially occurs due to the weaker bonding force between the boundary of the molten pool compared with grain boundaries [45]. In the in situ tensile test, the deformation mechanism is different when the stress is loaded along different directions. When the stress is loaded in the transverse direction, the boundary of the molten pool is parallel to the tensile force, or at an acute or obtuse angle. At this time, the molten pool will provide a certain restraint ability to the plastic flow [28]. Slipping of the molten pool boundary becomes difficult, so the slipping will proceed in the substructure, which is consistent with the phenomenon observed in Figure 10c. The cellular substructures will also undergo deformation and coordinate the concentration of stress until the molten pool boundary is completely parallel to the direction of the tensile force, where it is difficult for the molten pool boundary to continue to deform. At this time, the cellular substructure bears greater deformation and tears. Therefore, the high stress level and ductility can be maintained. When the stress is loaded in the longitudinal direction, the boundary of the molten pool is the starting point of failure. At this time, the boundary of the molten pool slips first. Although the cellular substructure will still bear part of the deformation, the deformation of the boundary of the molten pool is relatively fast. When a greater stress is applied, the stress is concentrated at the boundary. The boundary of the molten pool will quickly widen and tear, leaving a large gap on the surface (As shown in Figure 17. Then, the stress relaxes, and the cellular substructure no longer deforms. The longitudinal sample has lower strength and elongation due to the existence of the gap caused by tearing.

5. Conclusions

(1)
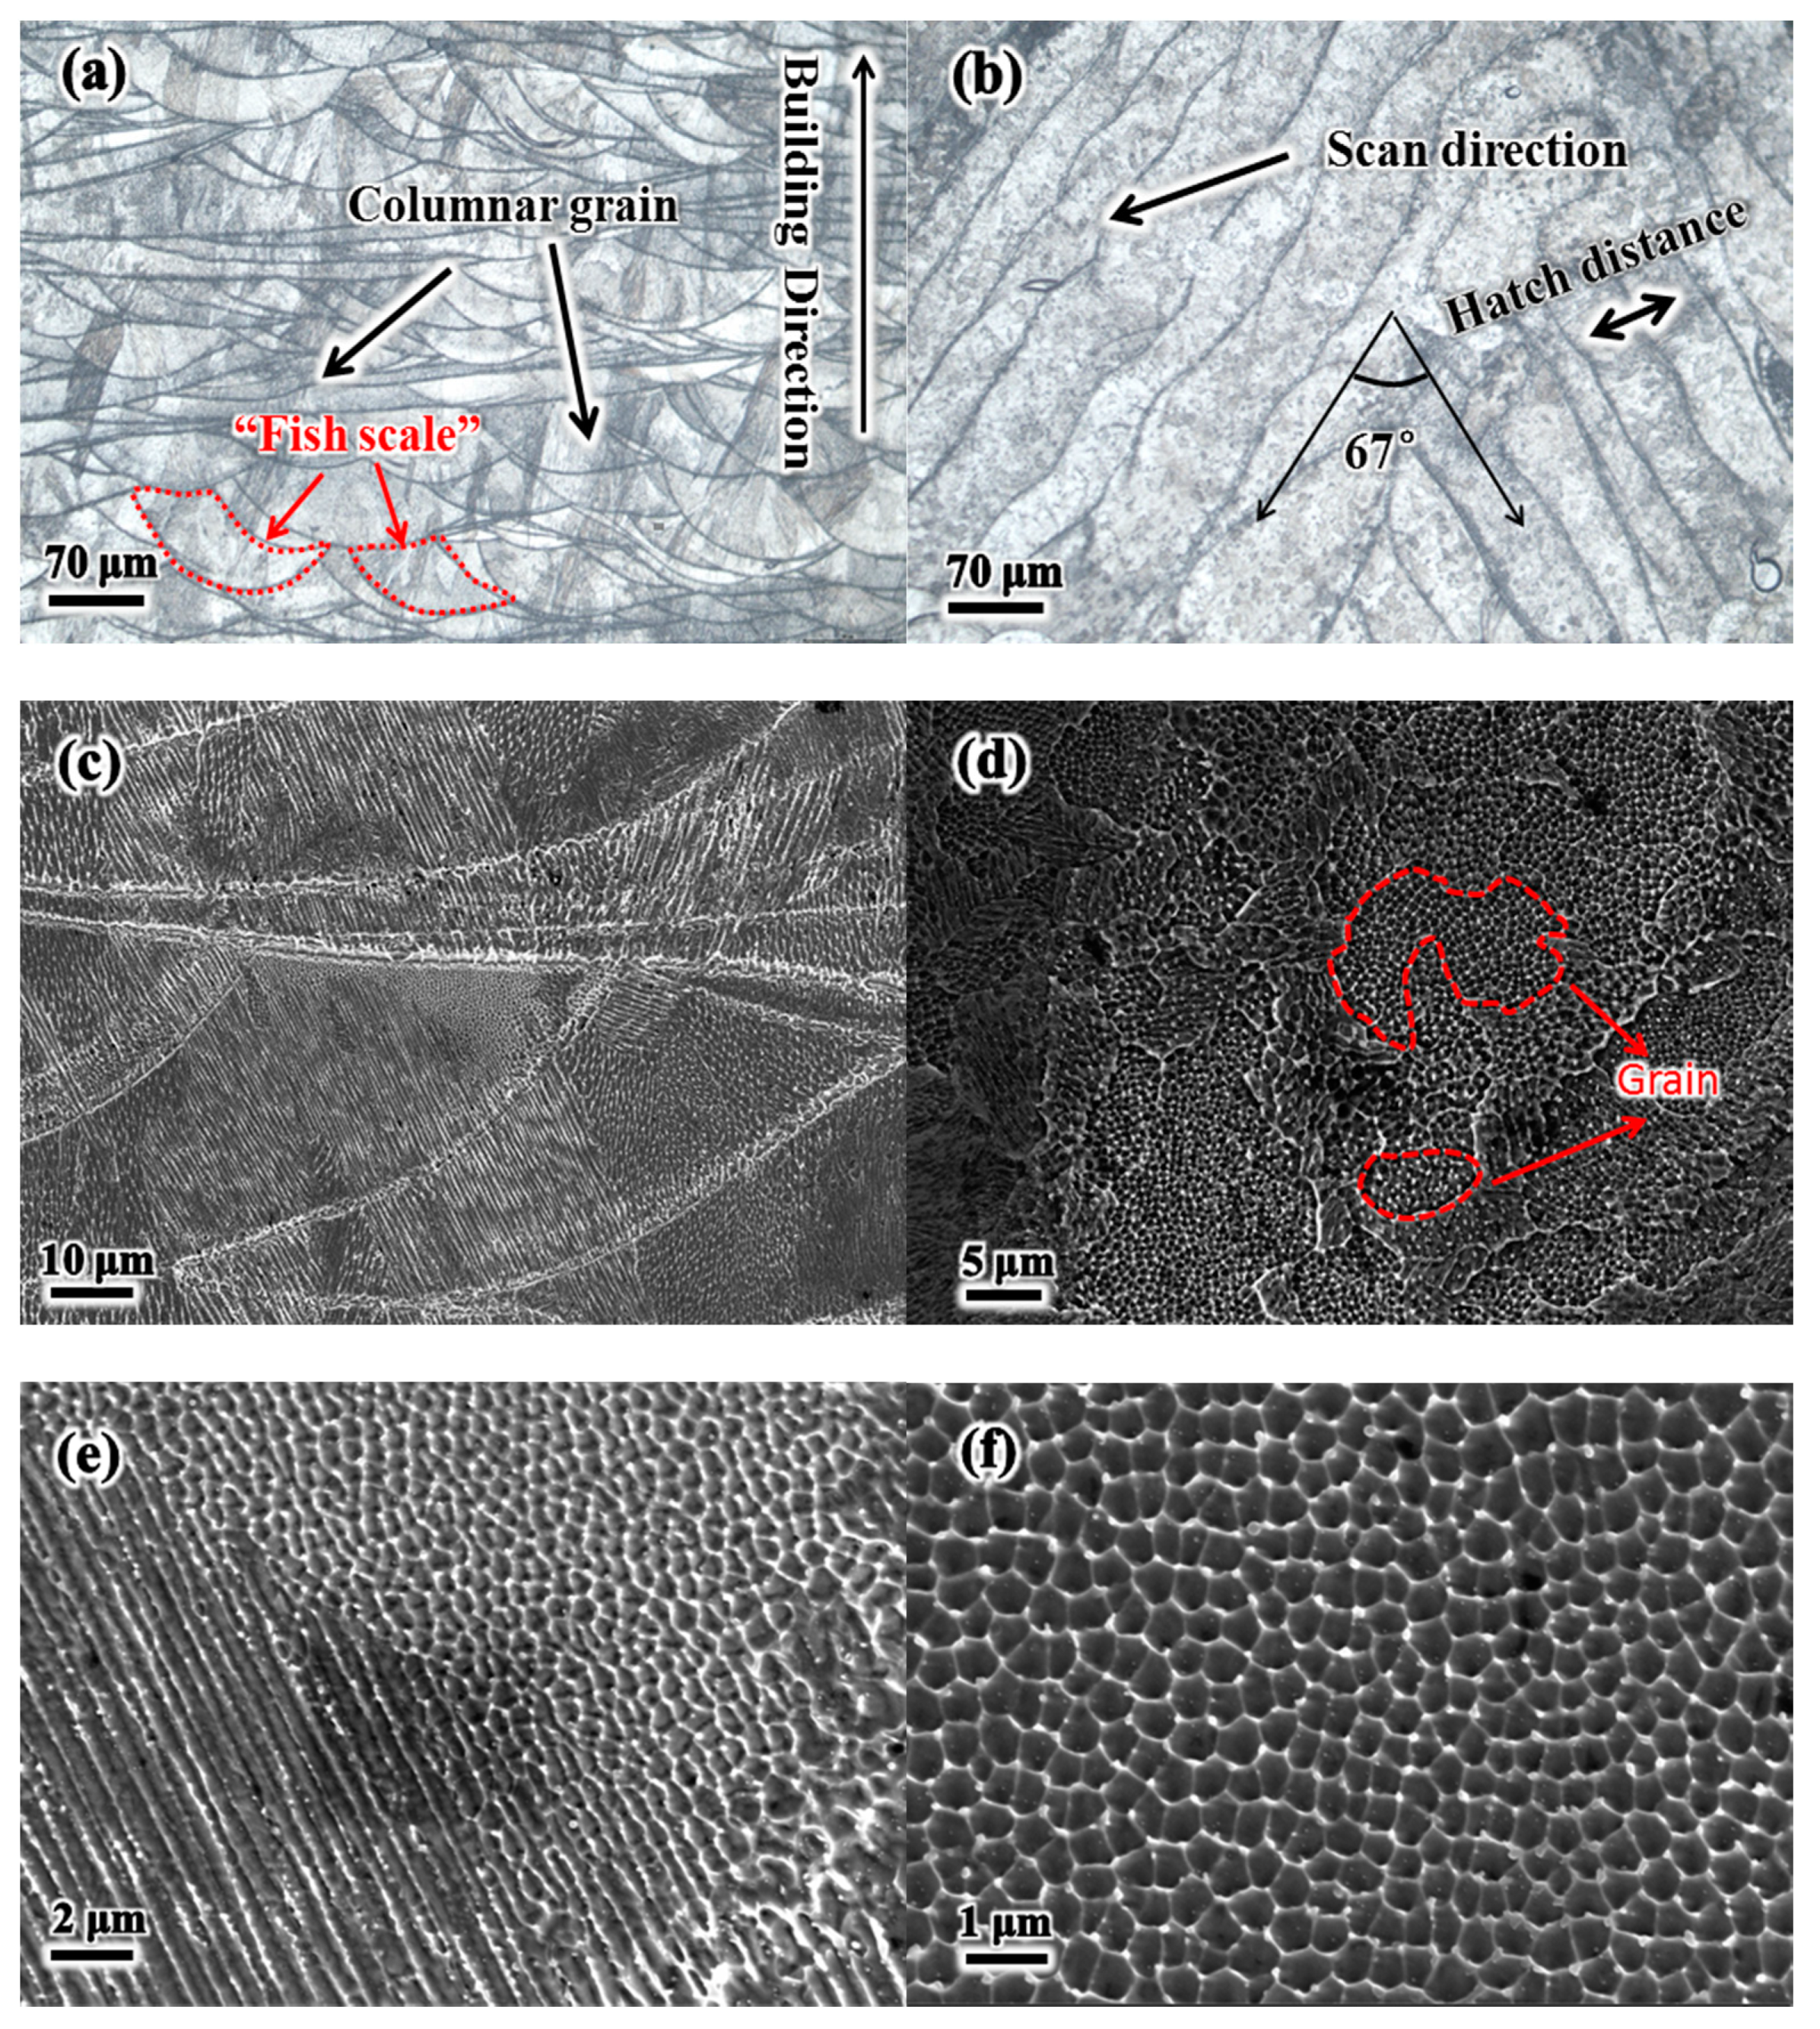
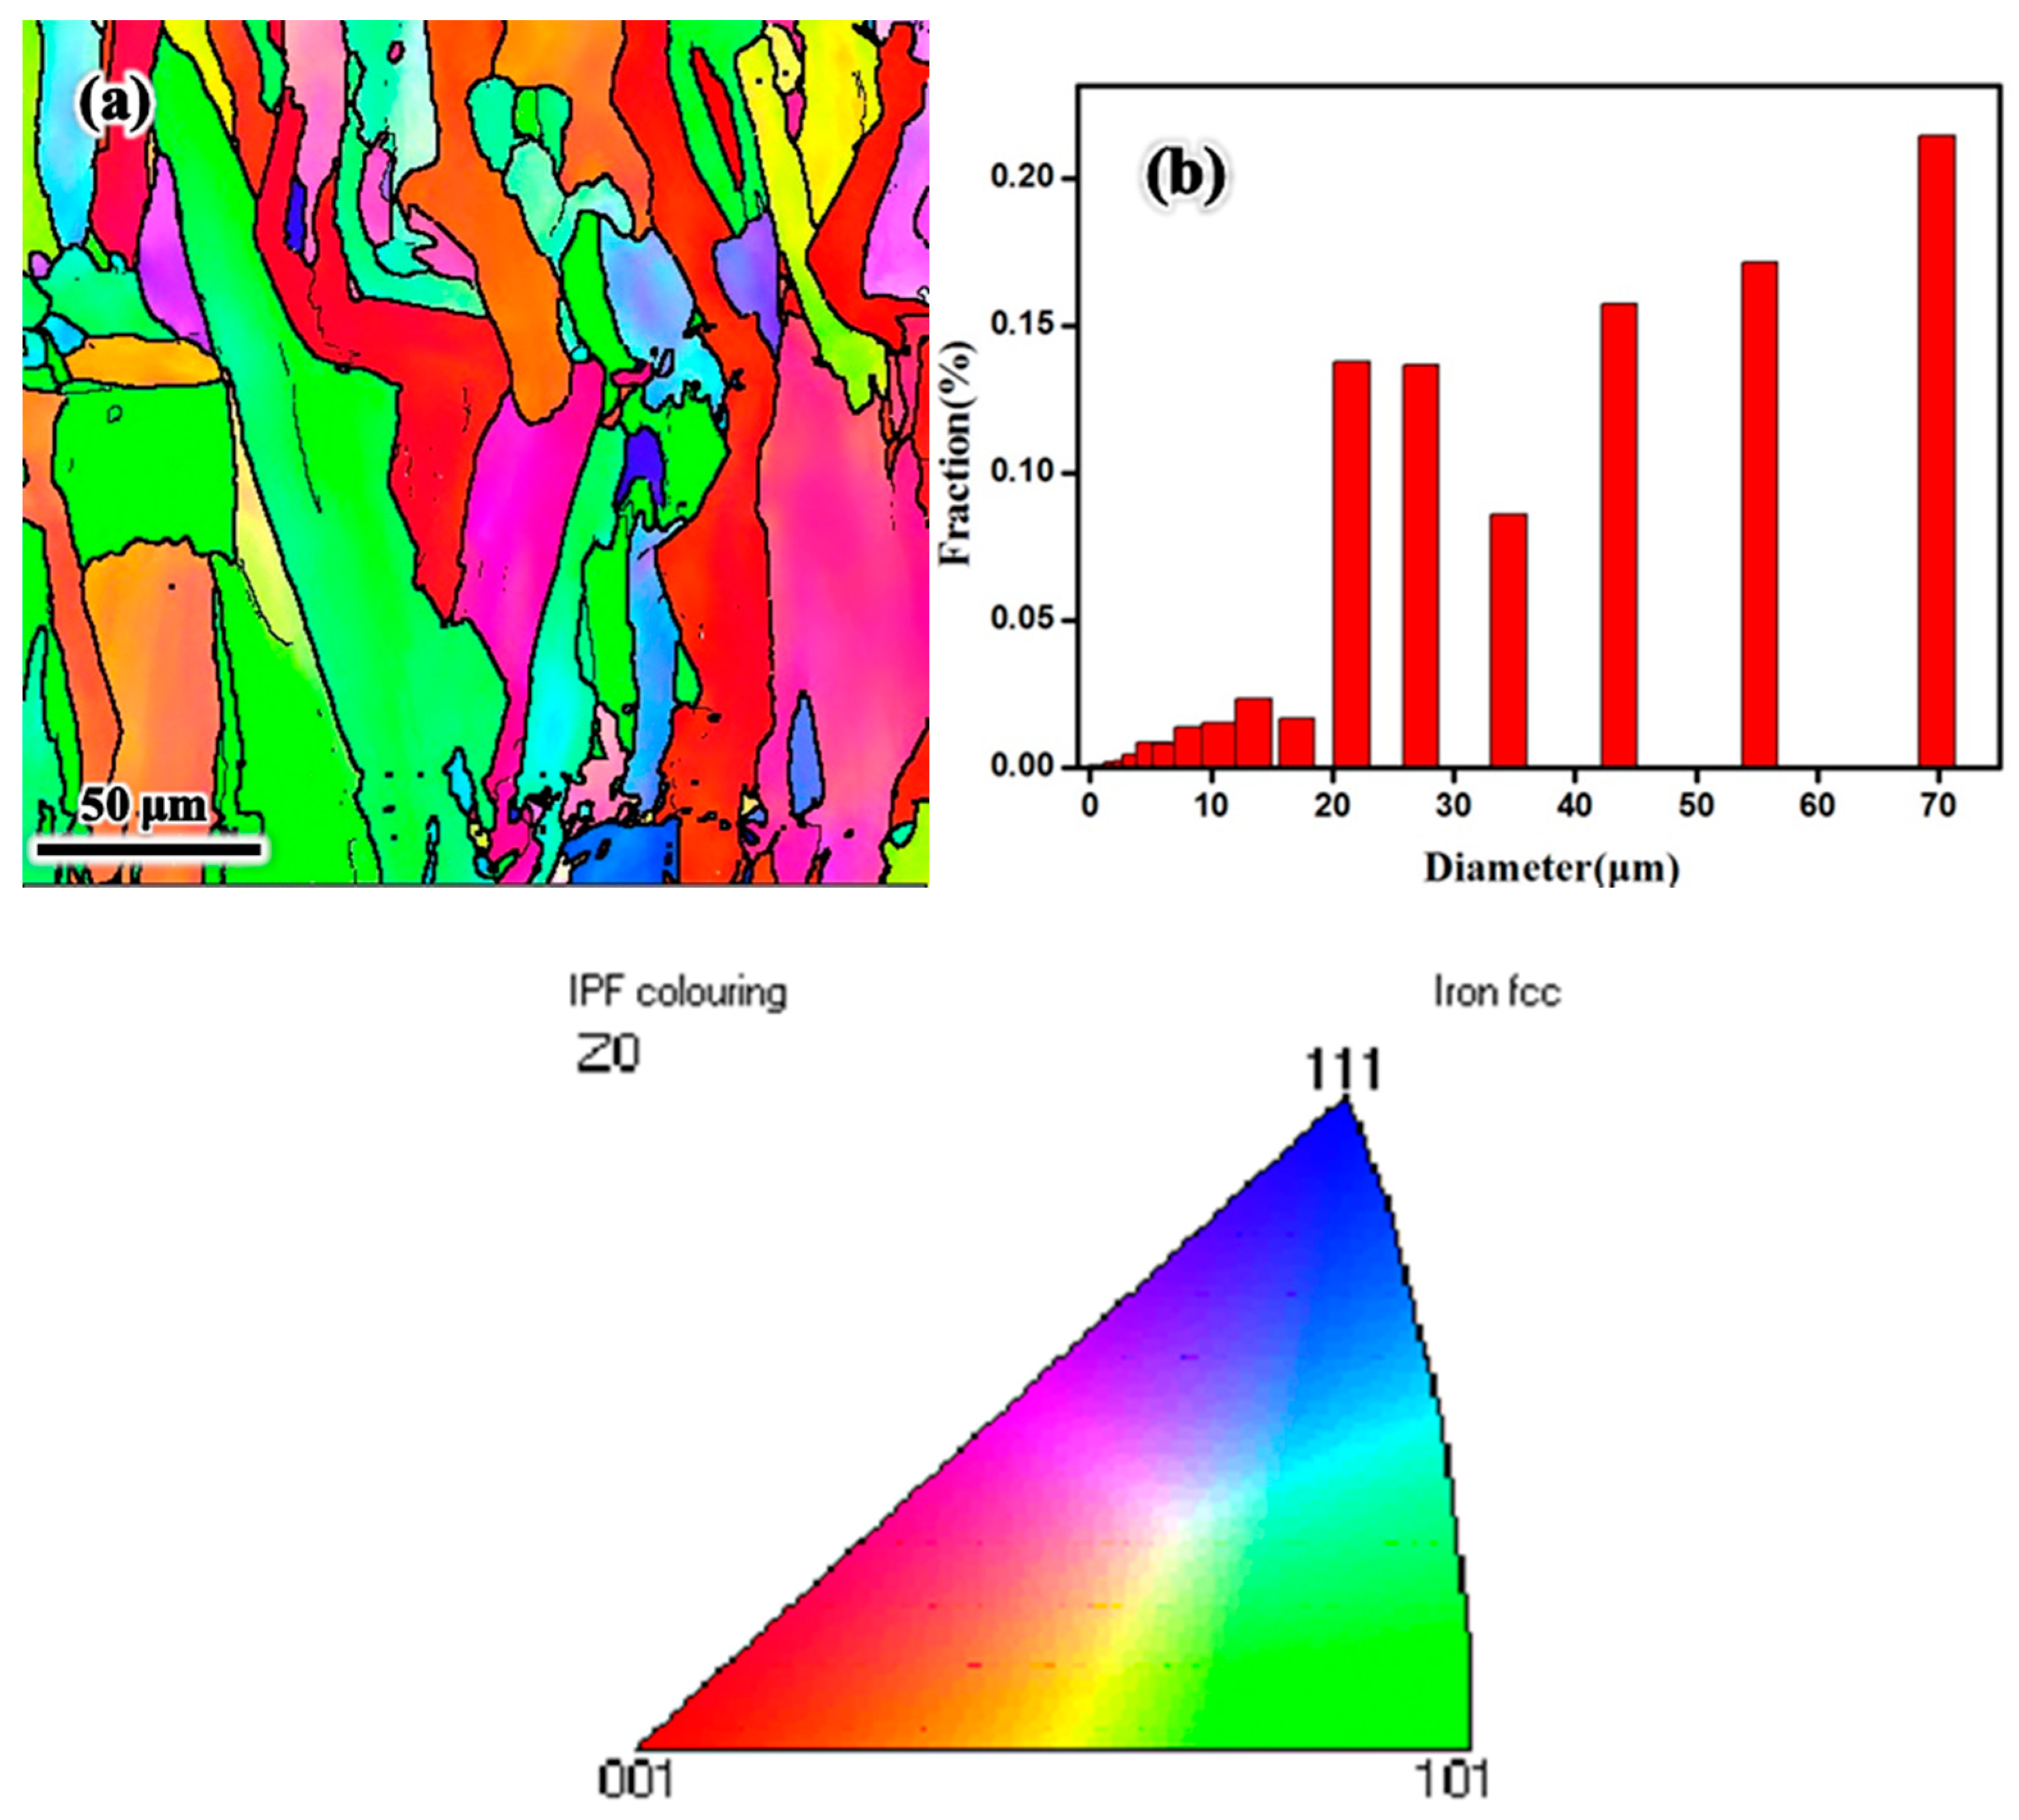
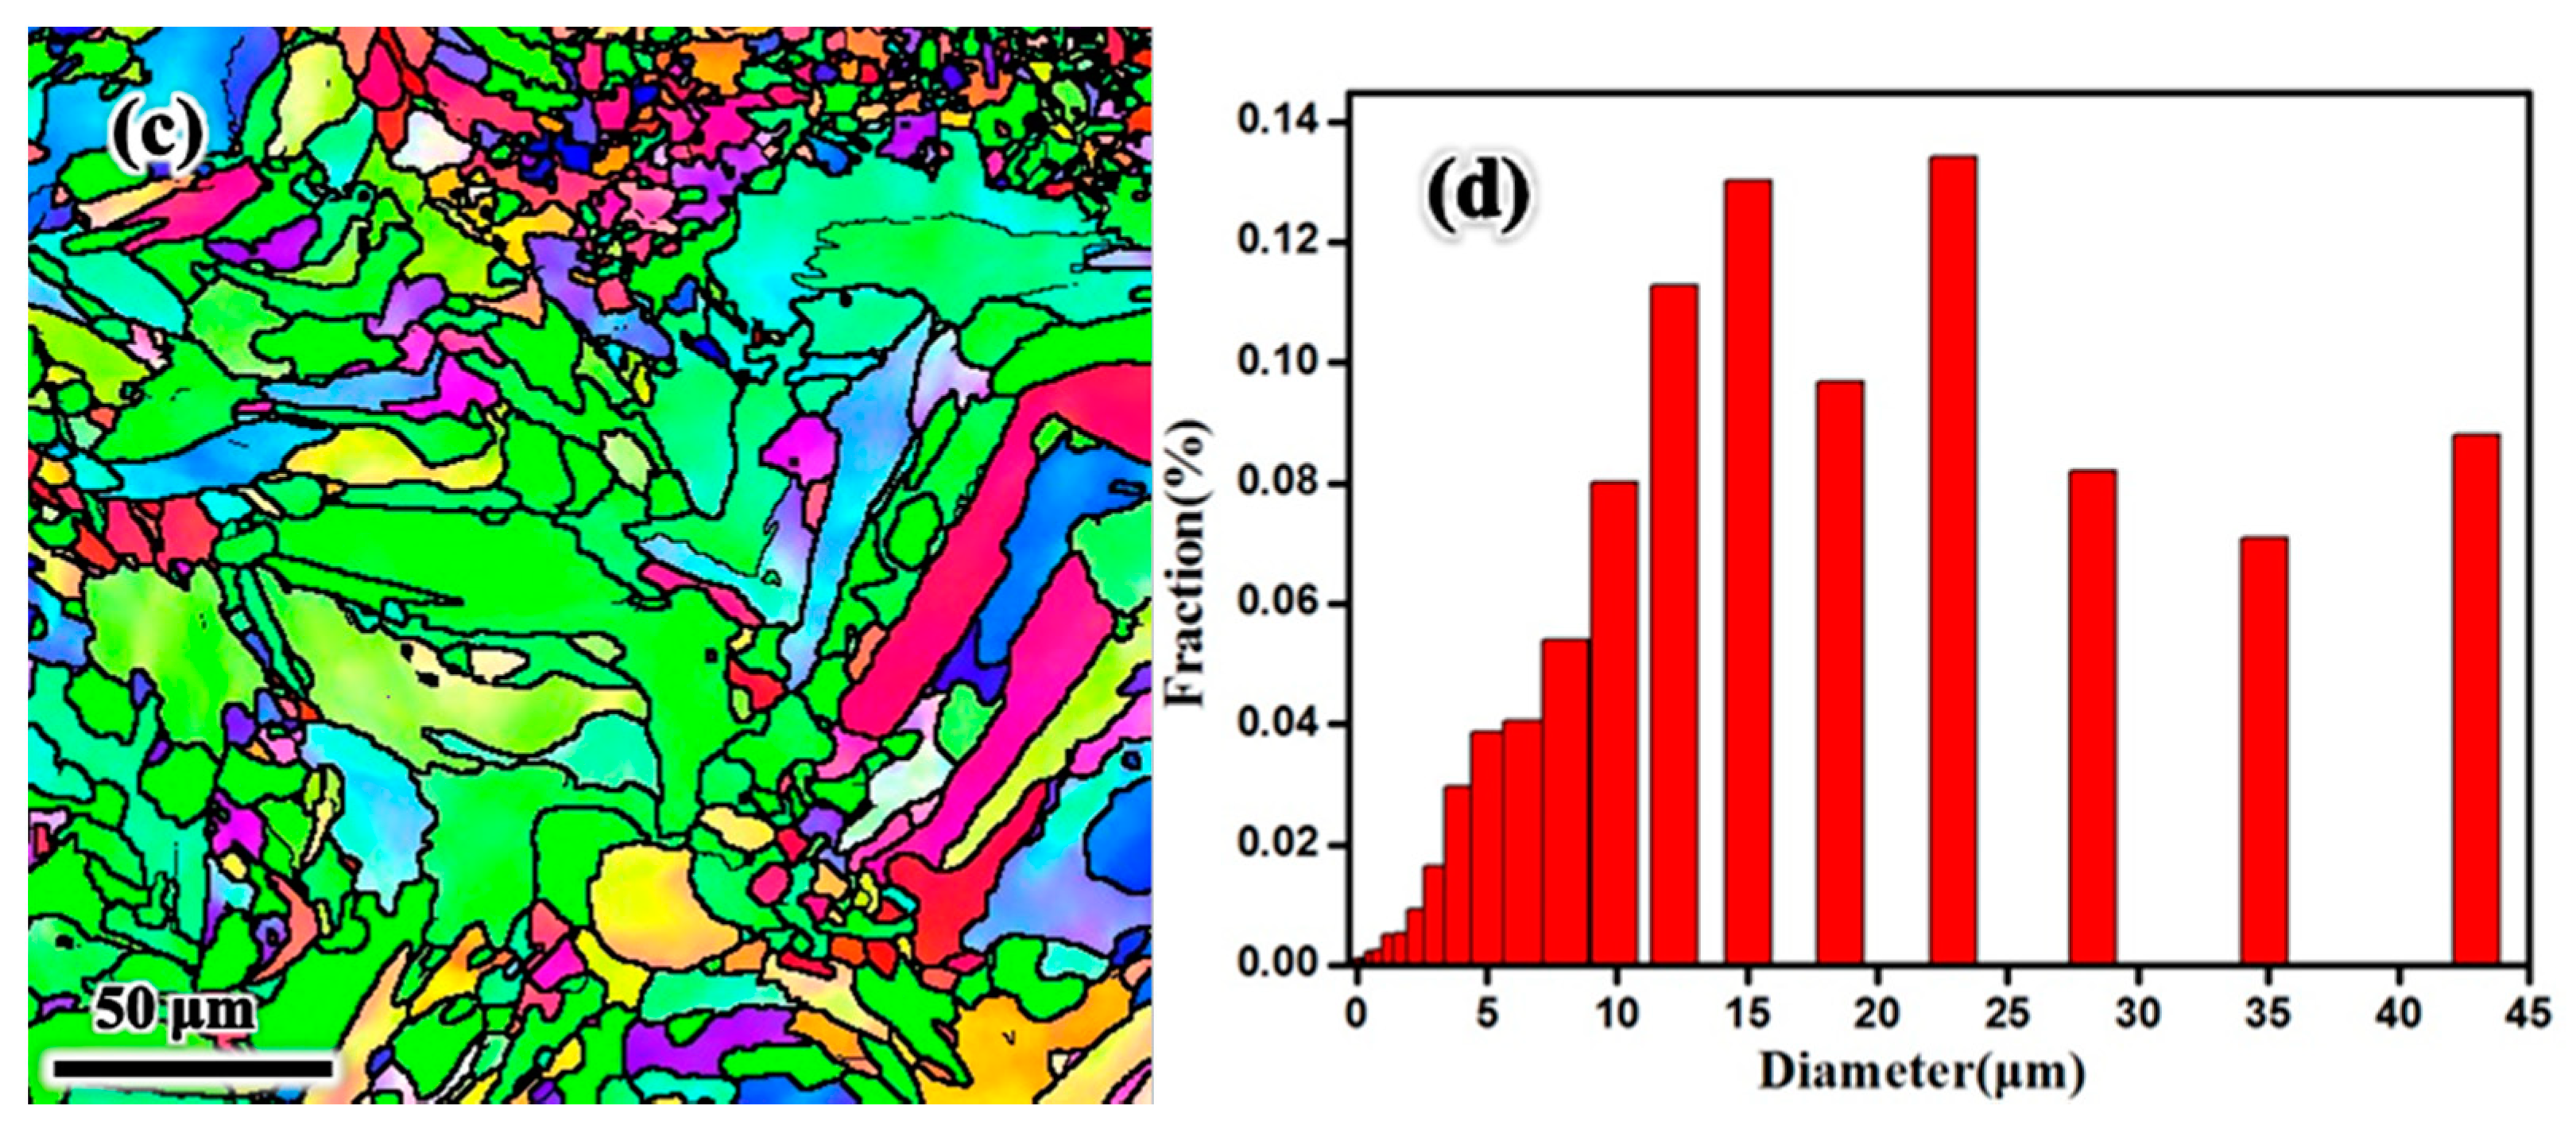
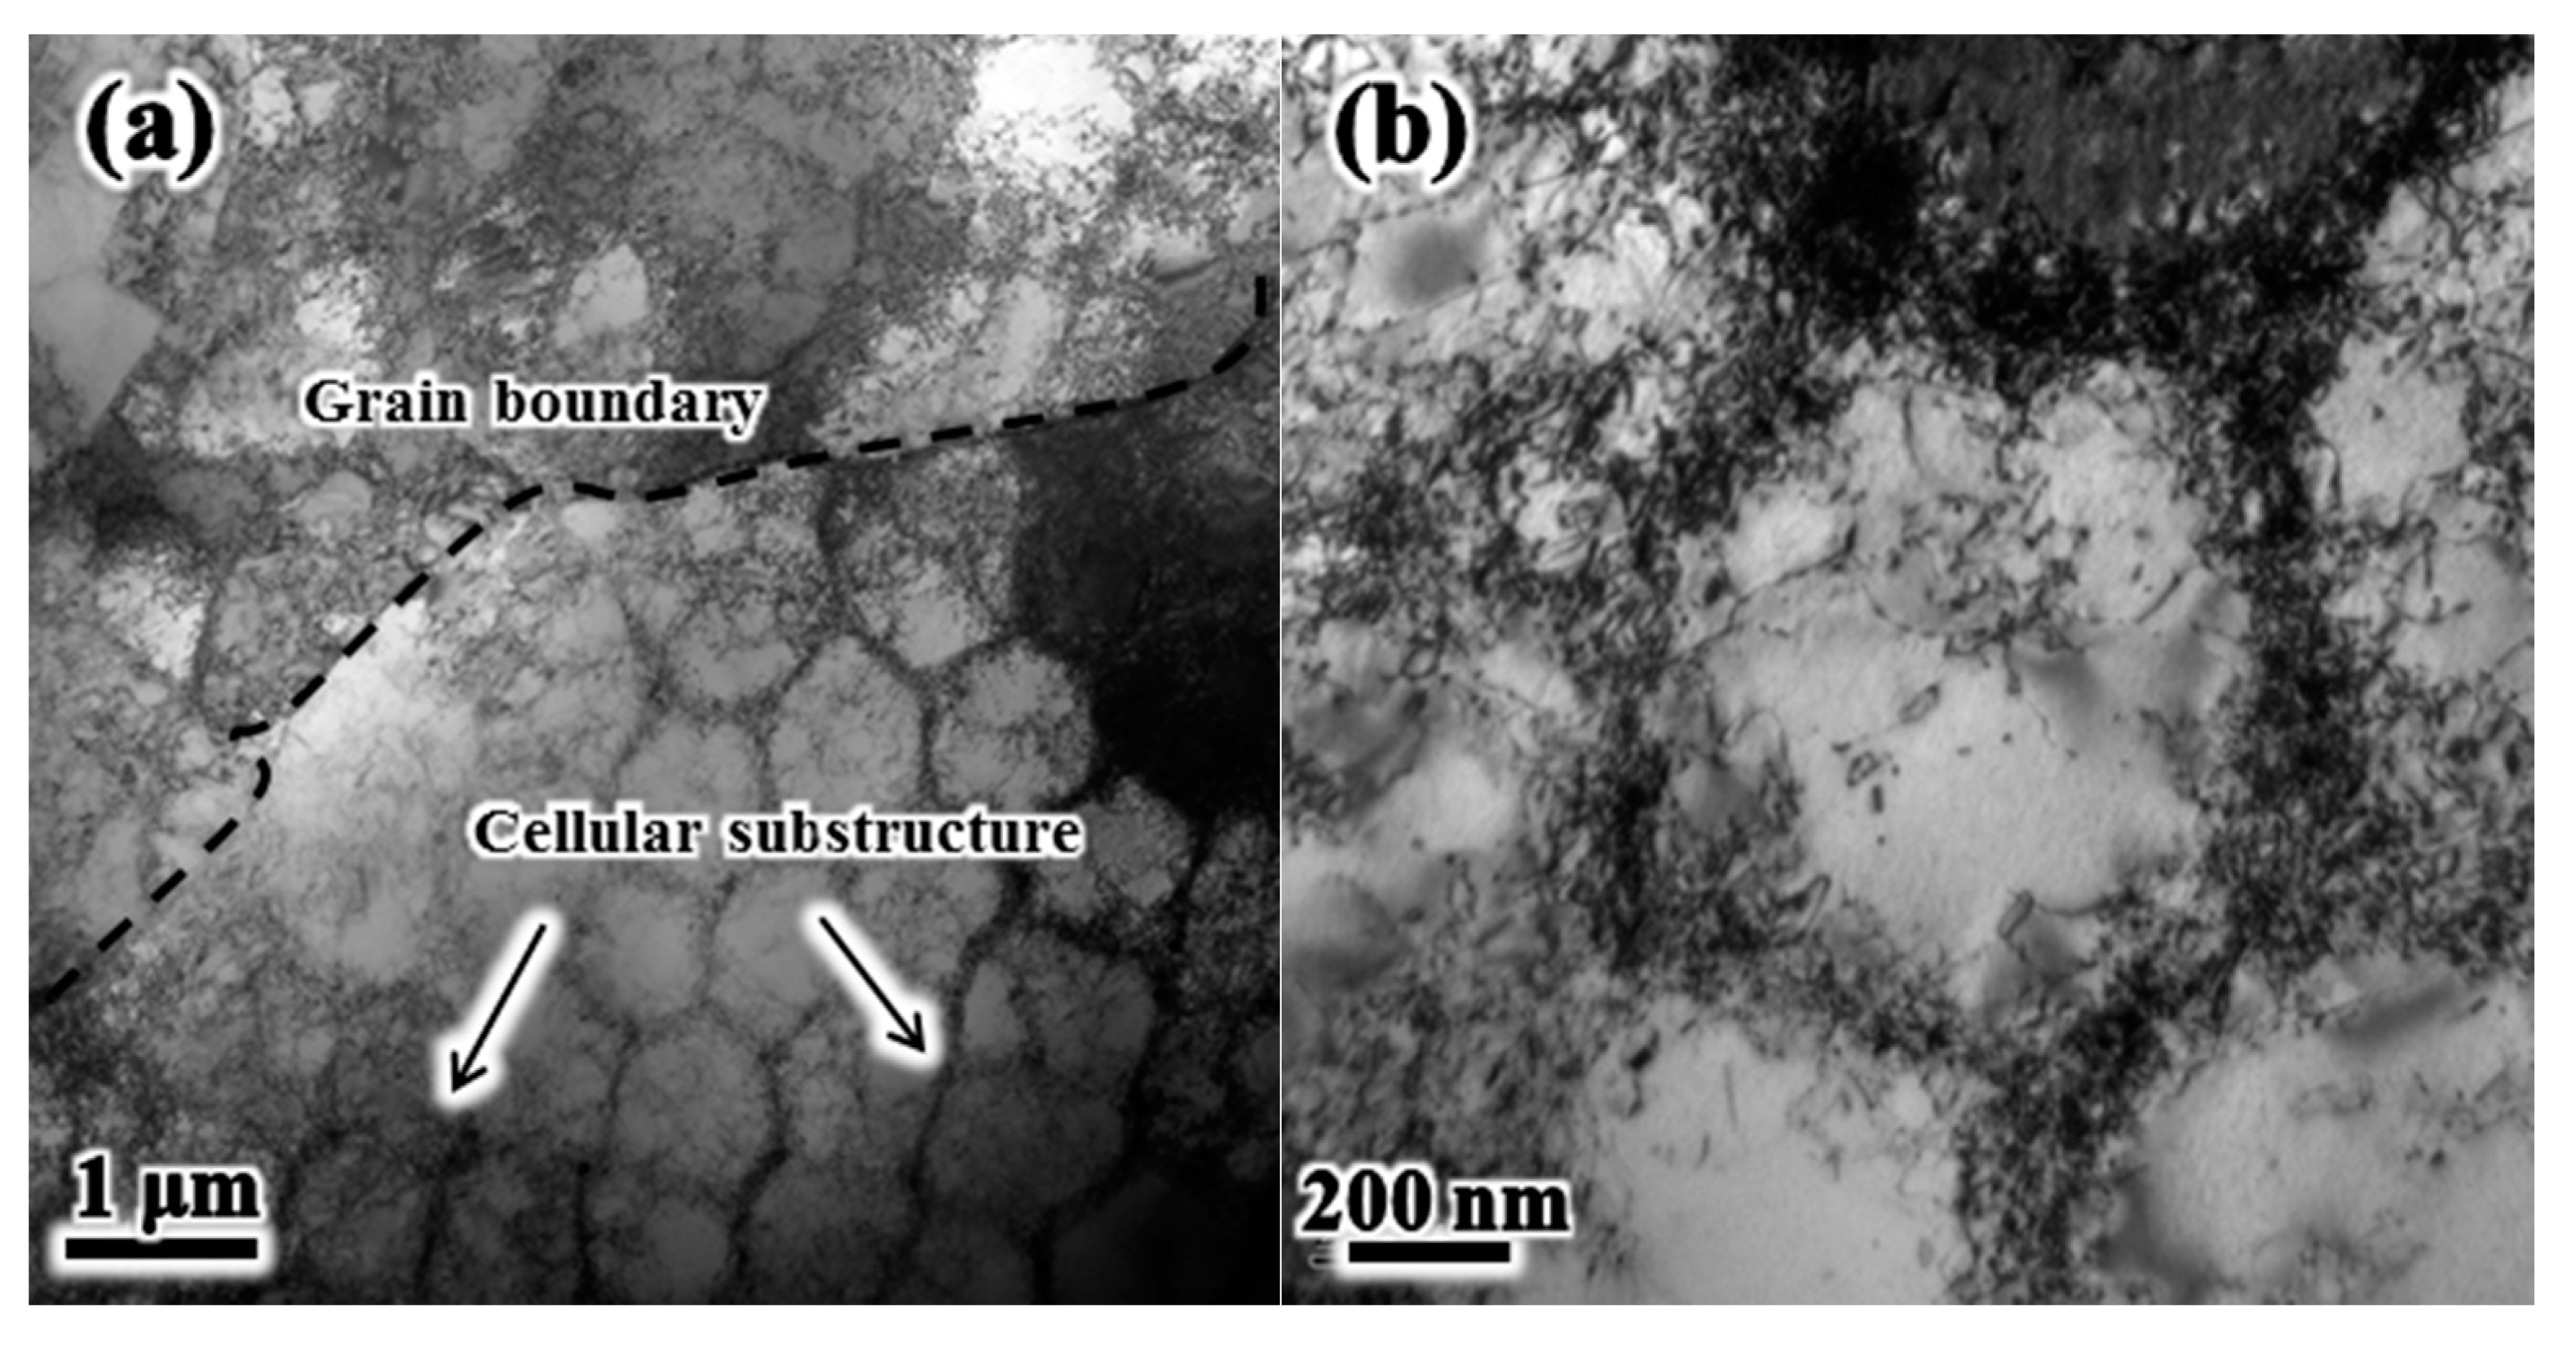
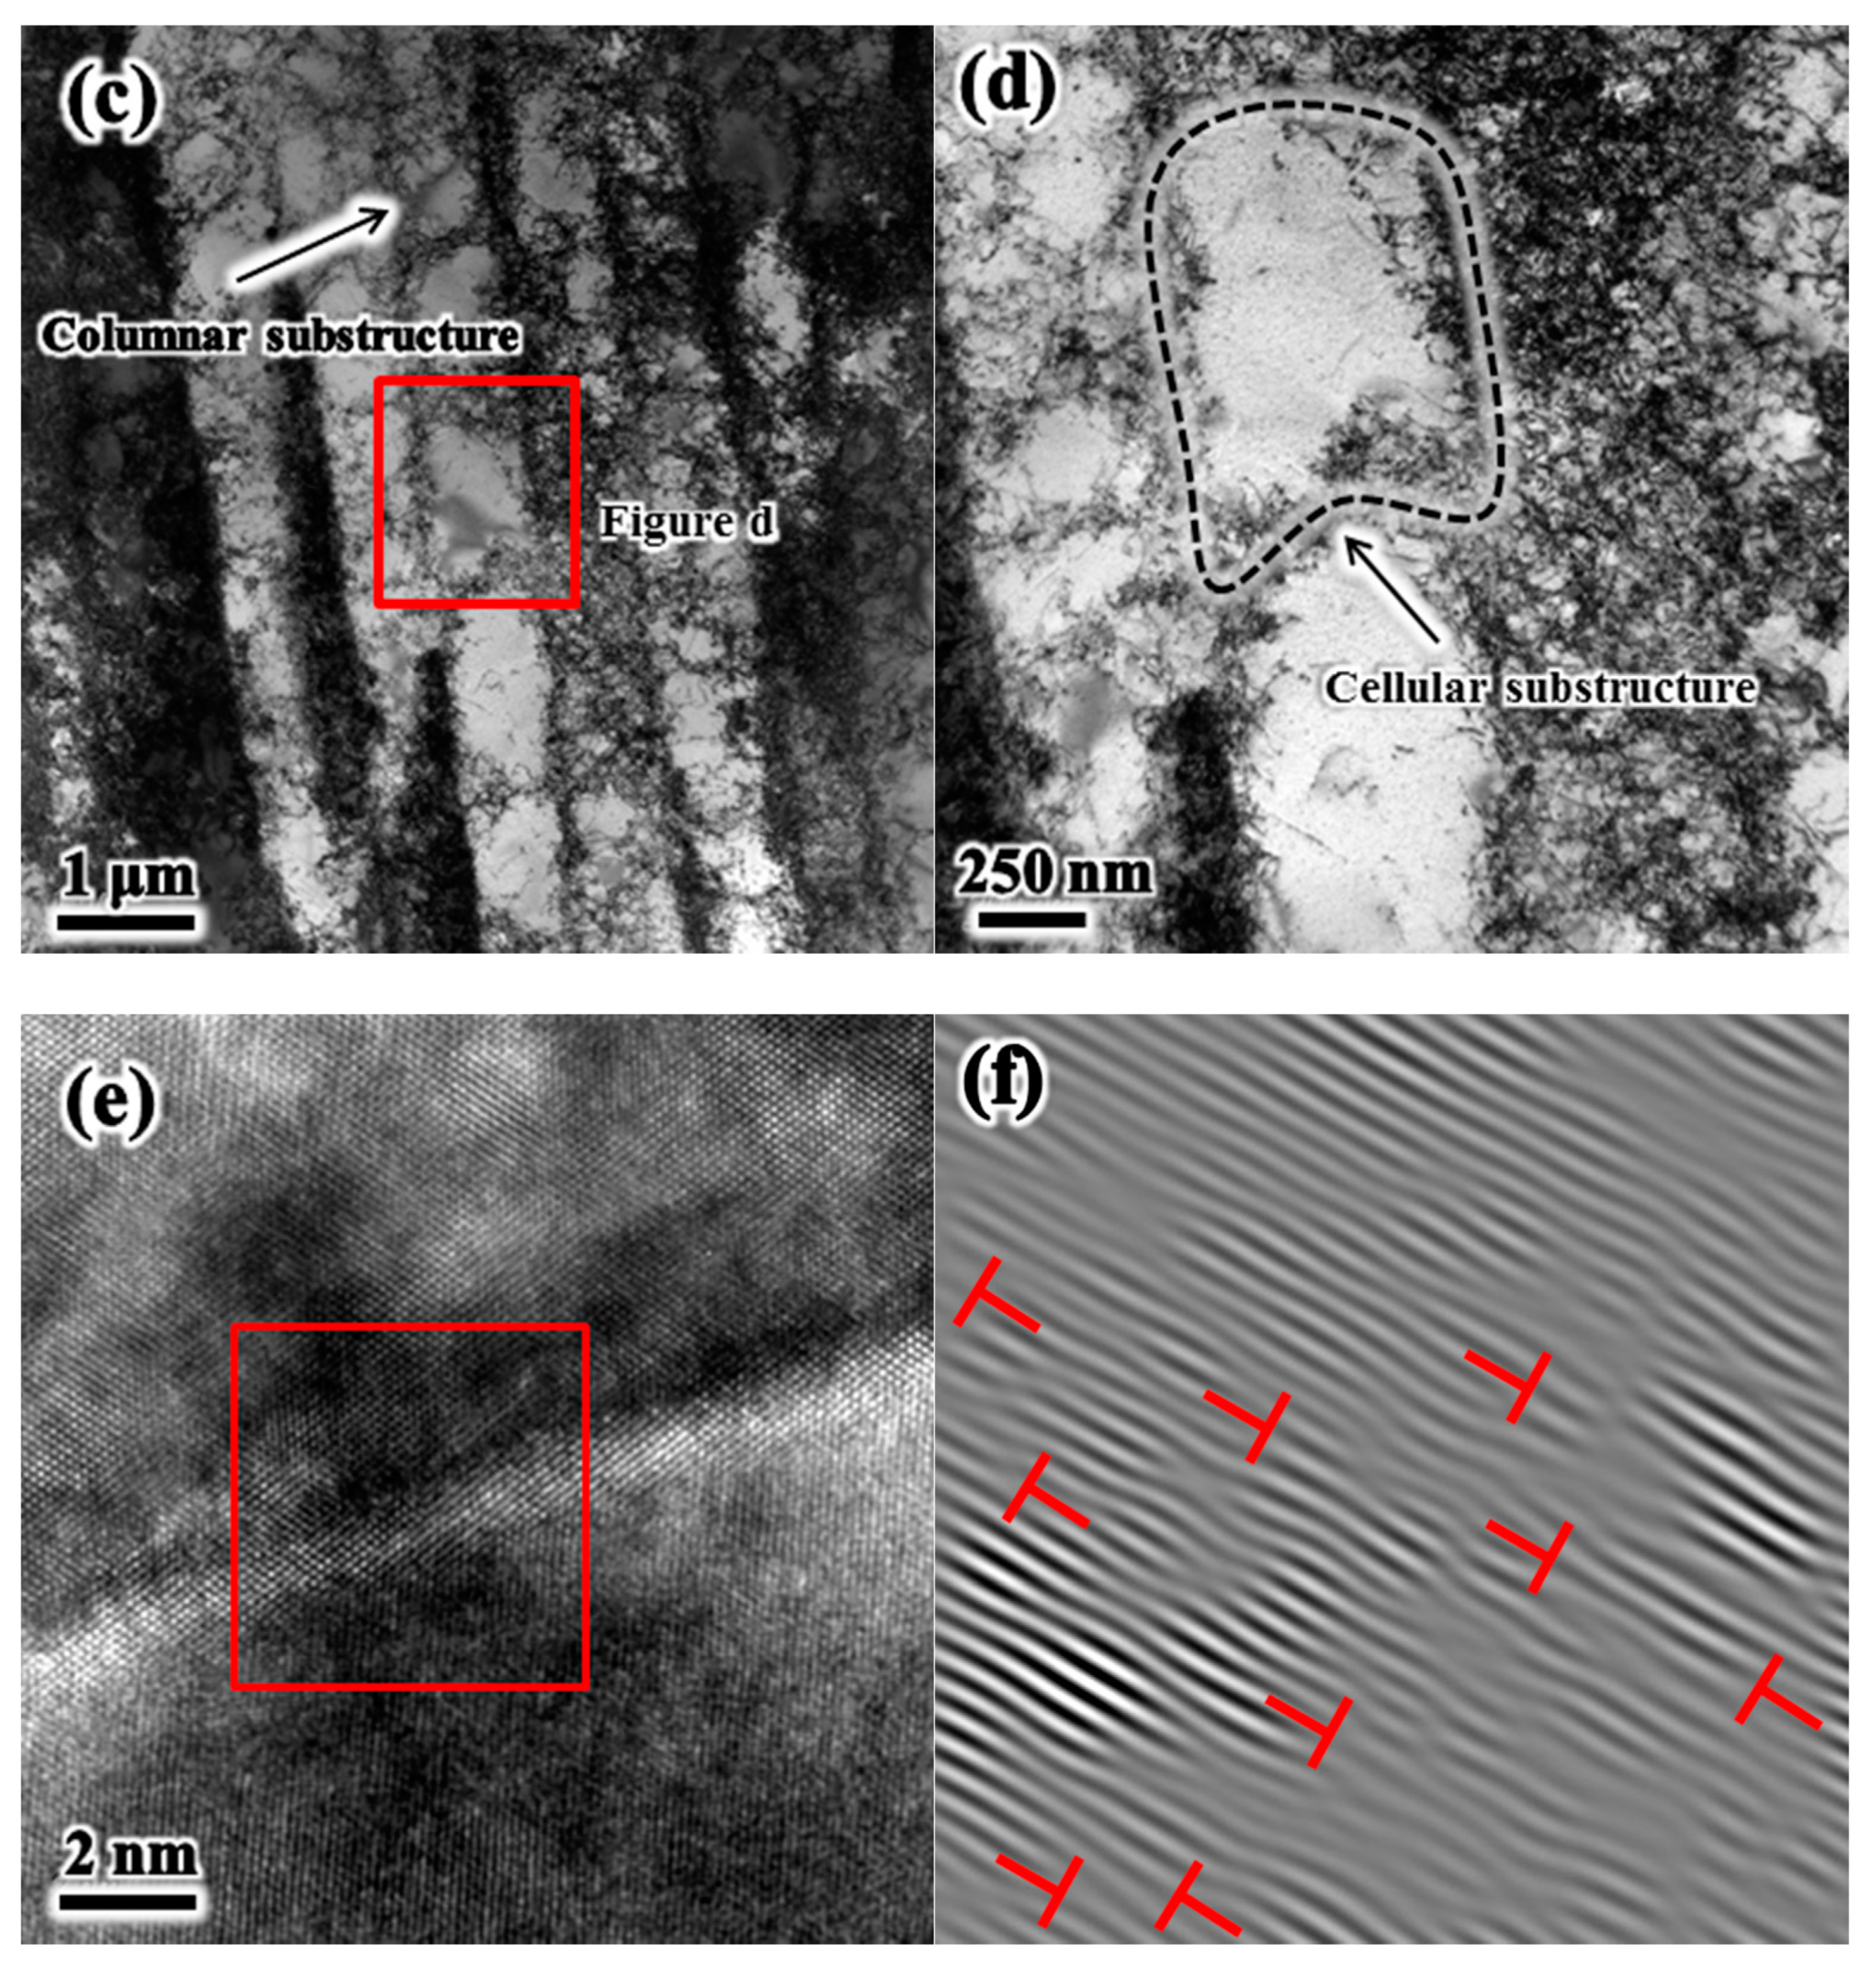
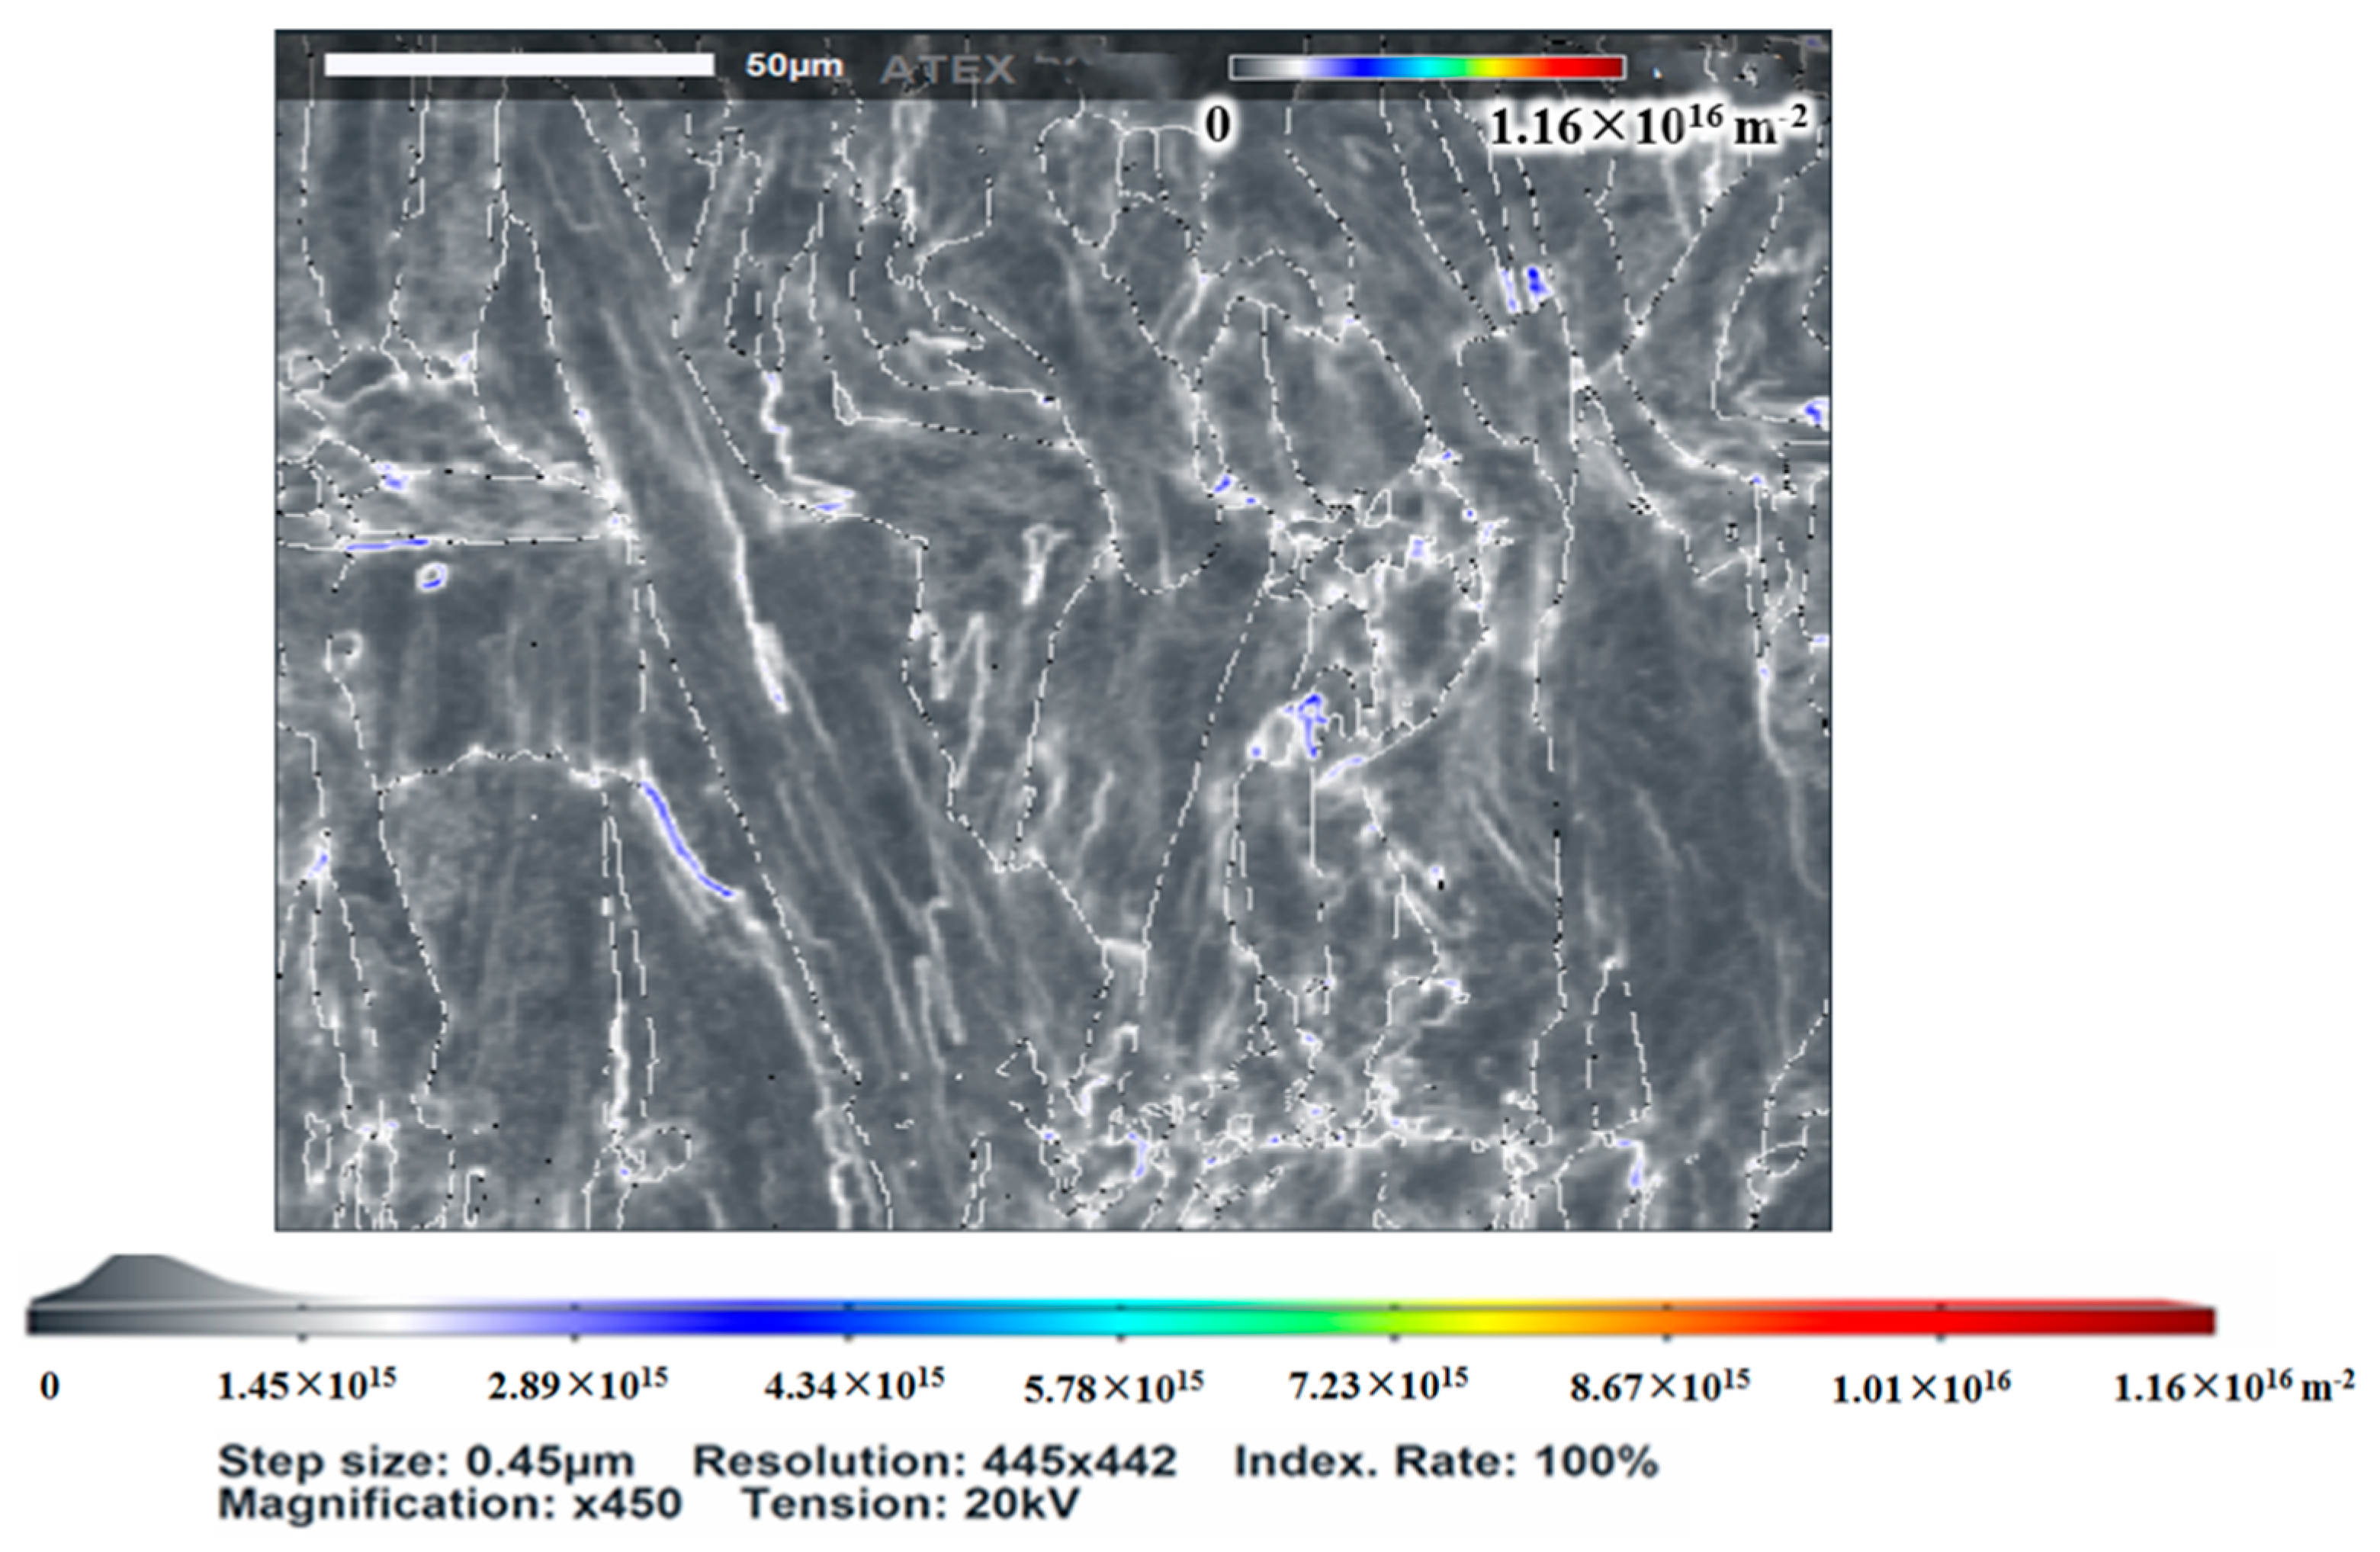
The SLM-manufactured 316L SS has an obvious multiscale microstructure (composed of a molten pool, grain, cellular substructure with high density dislocation). The molten pool has obvious directionality at the building directions.
(2)
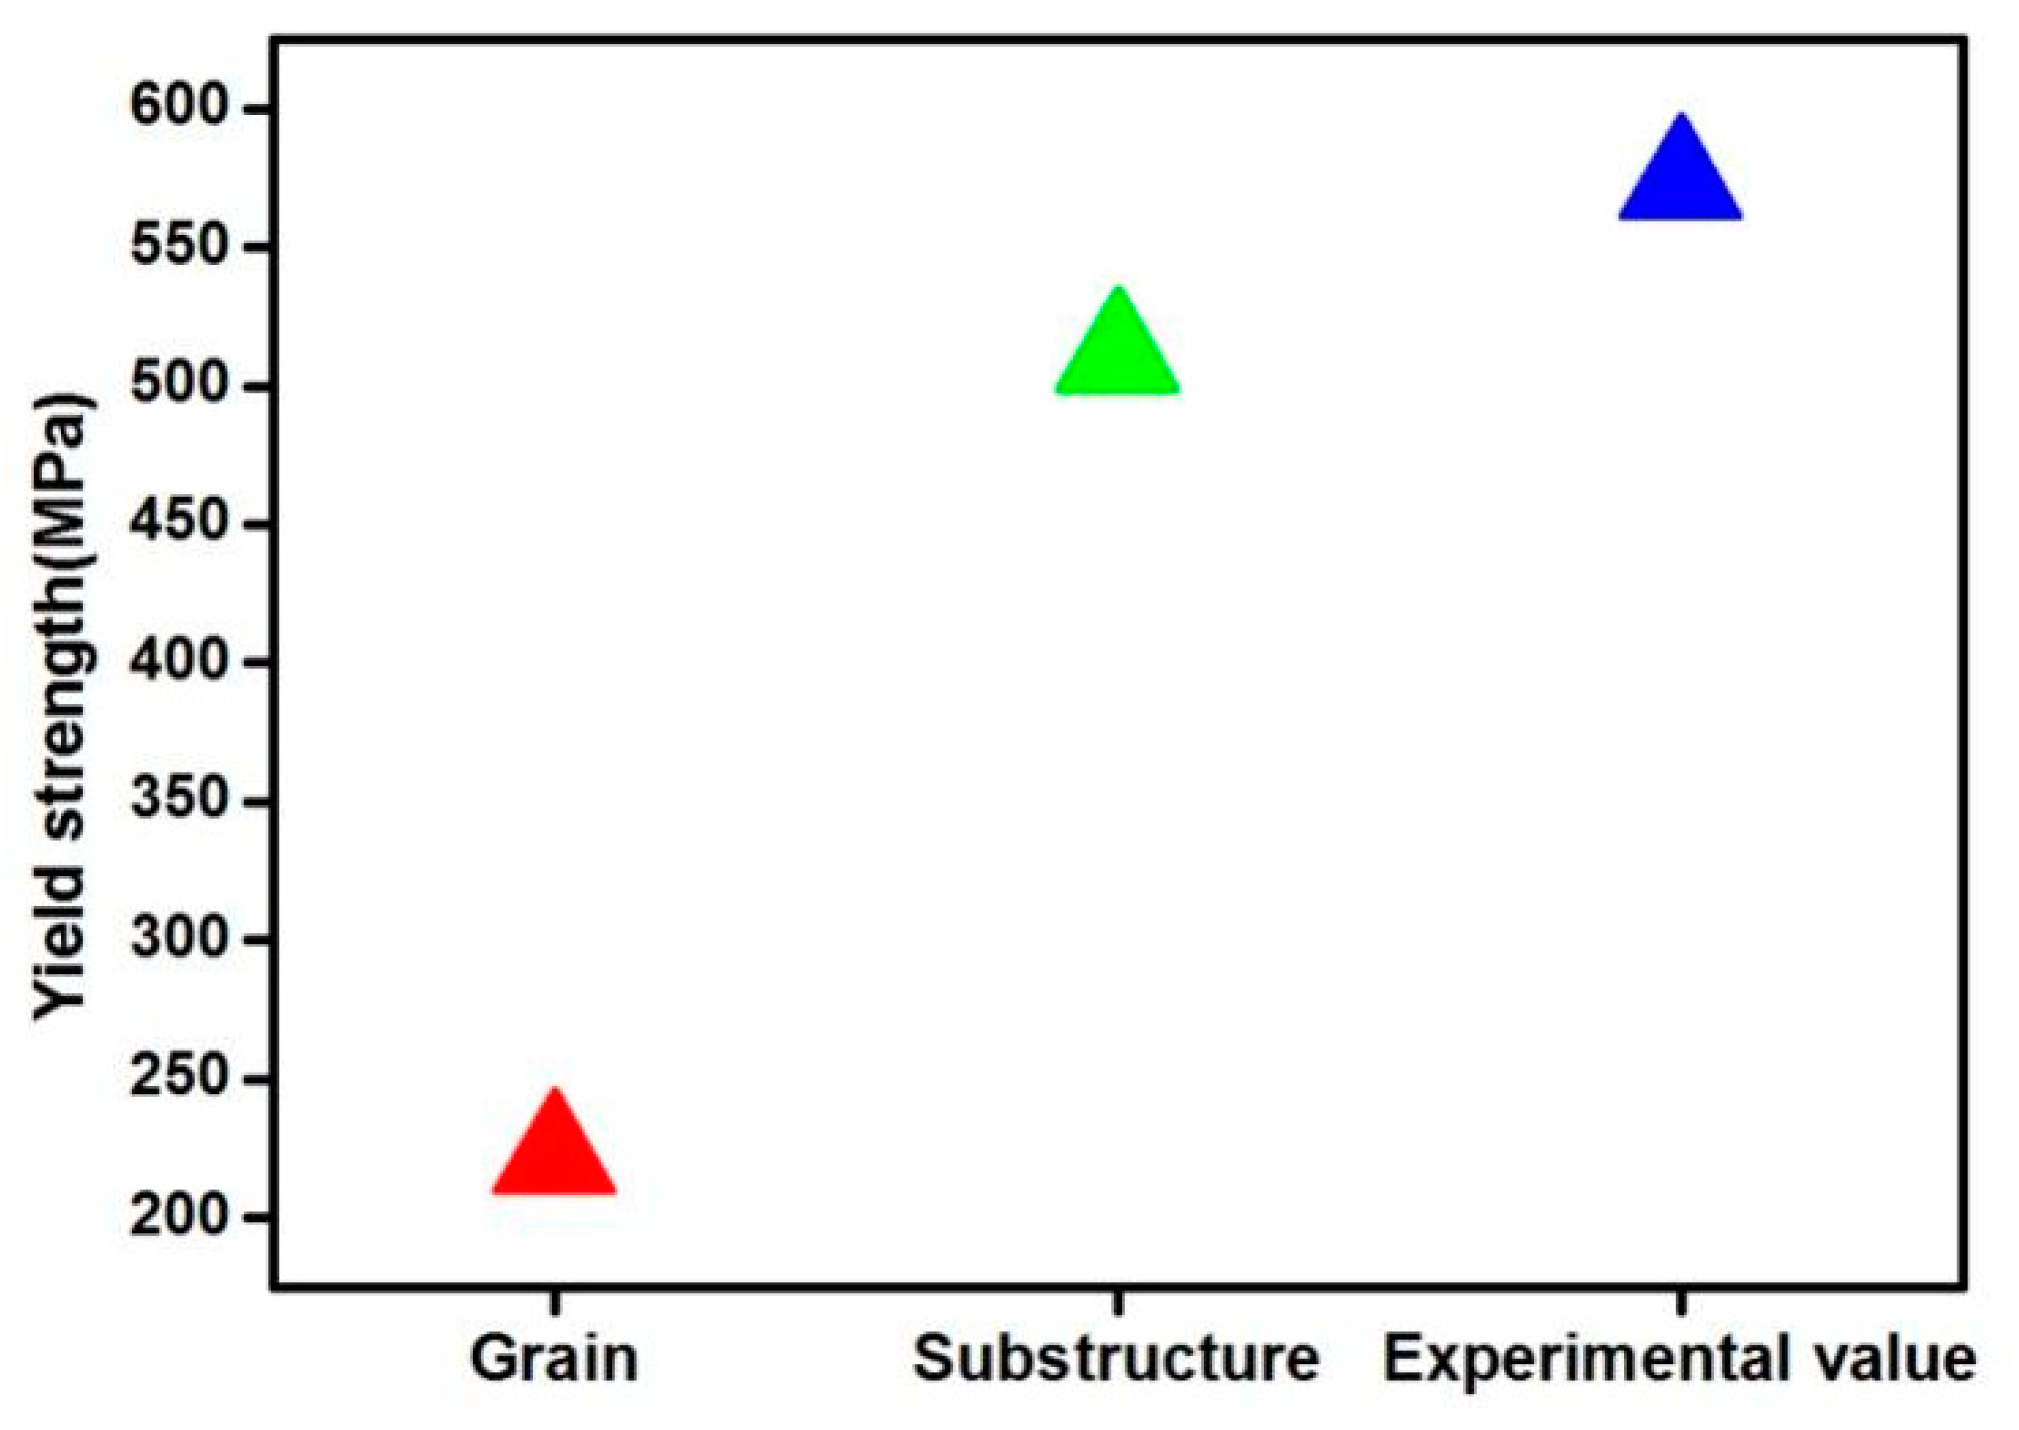
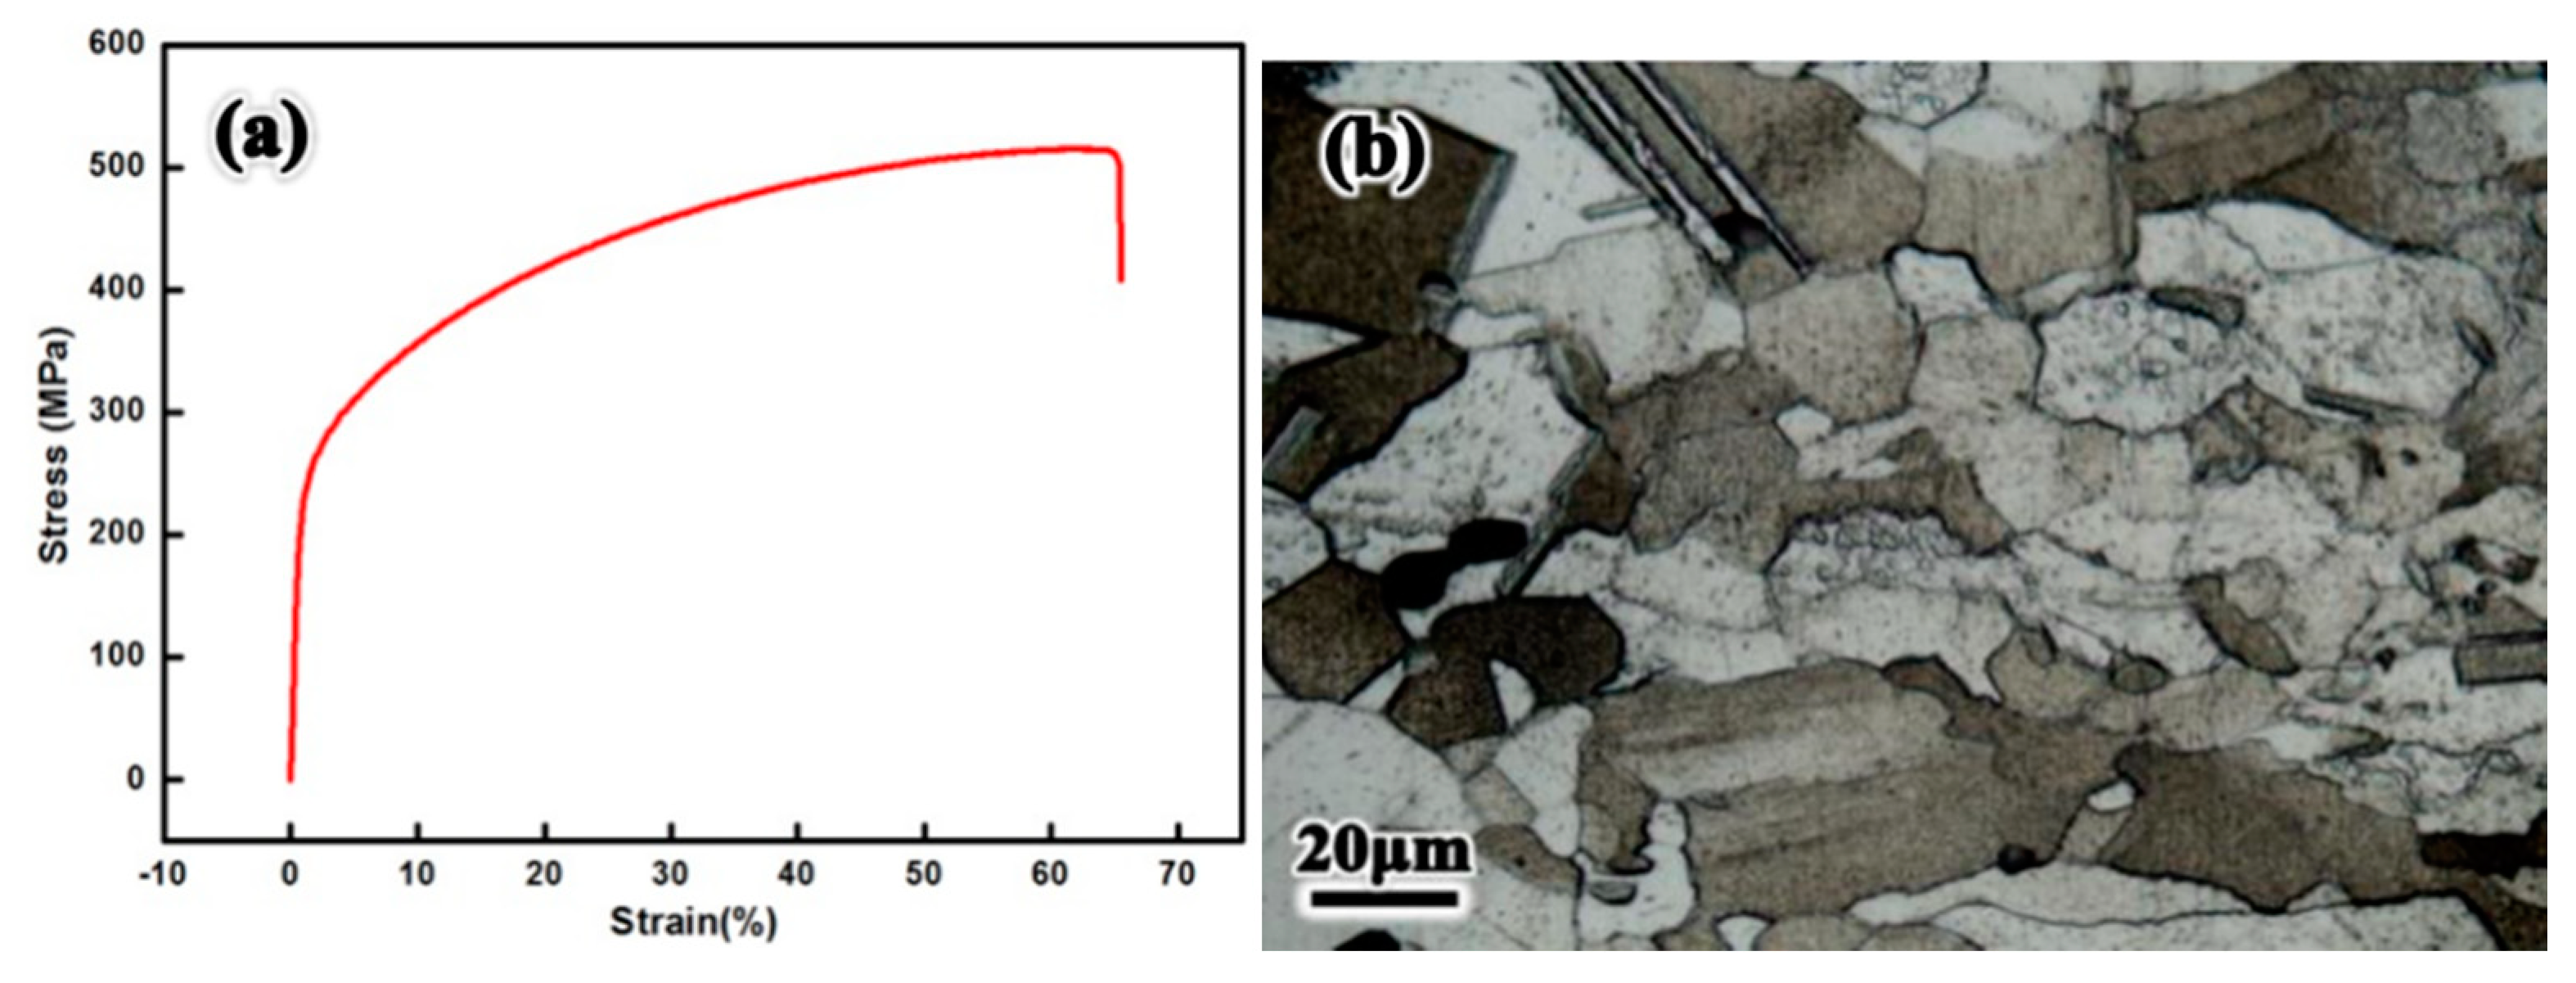
The 316L SS produced by SLM has significantly higher yield strength than wrought 316L SS mainly due to the high density of dislocation and the fine cellular substructure.
(3)
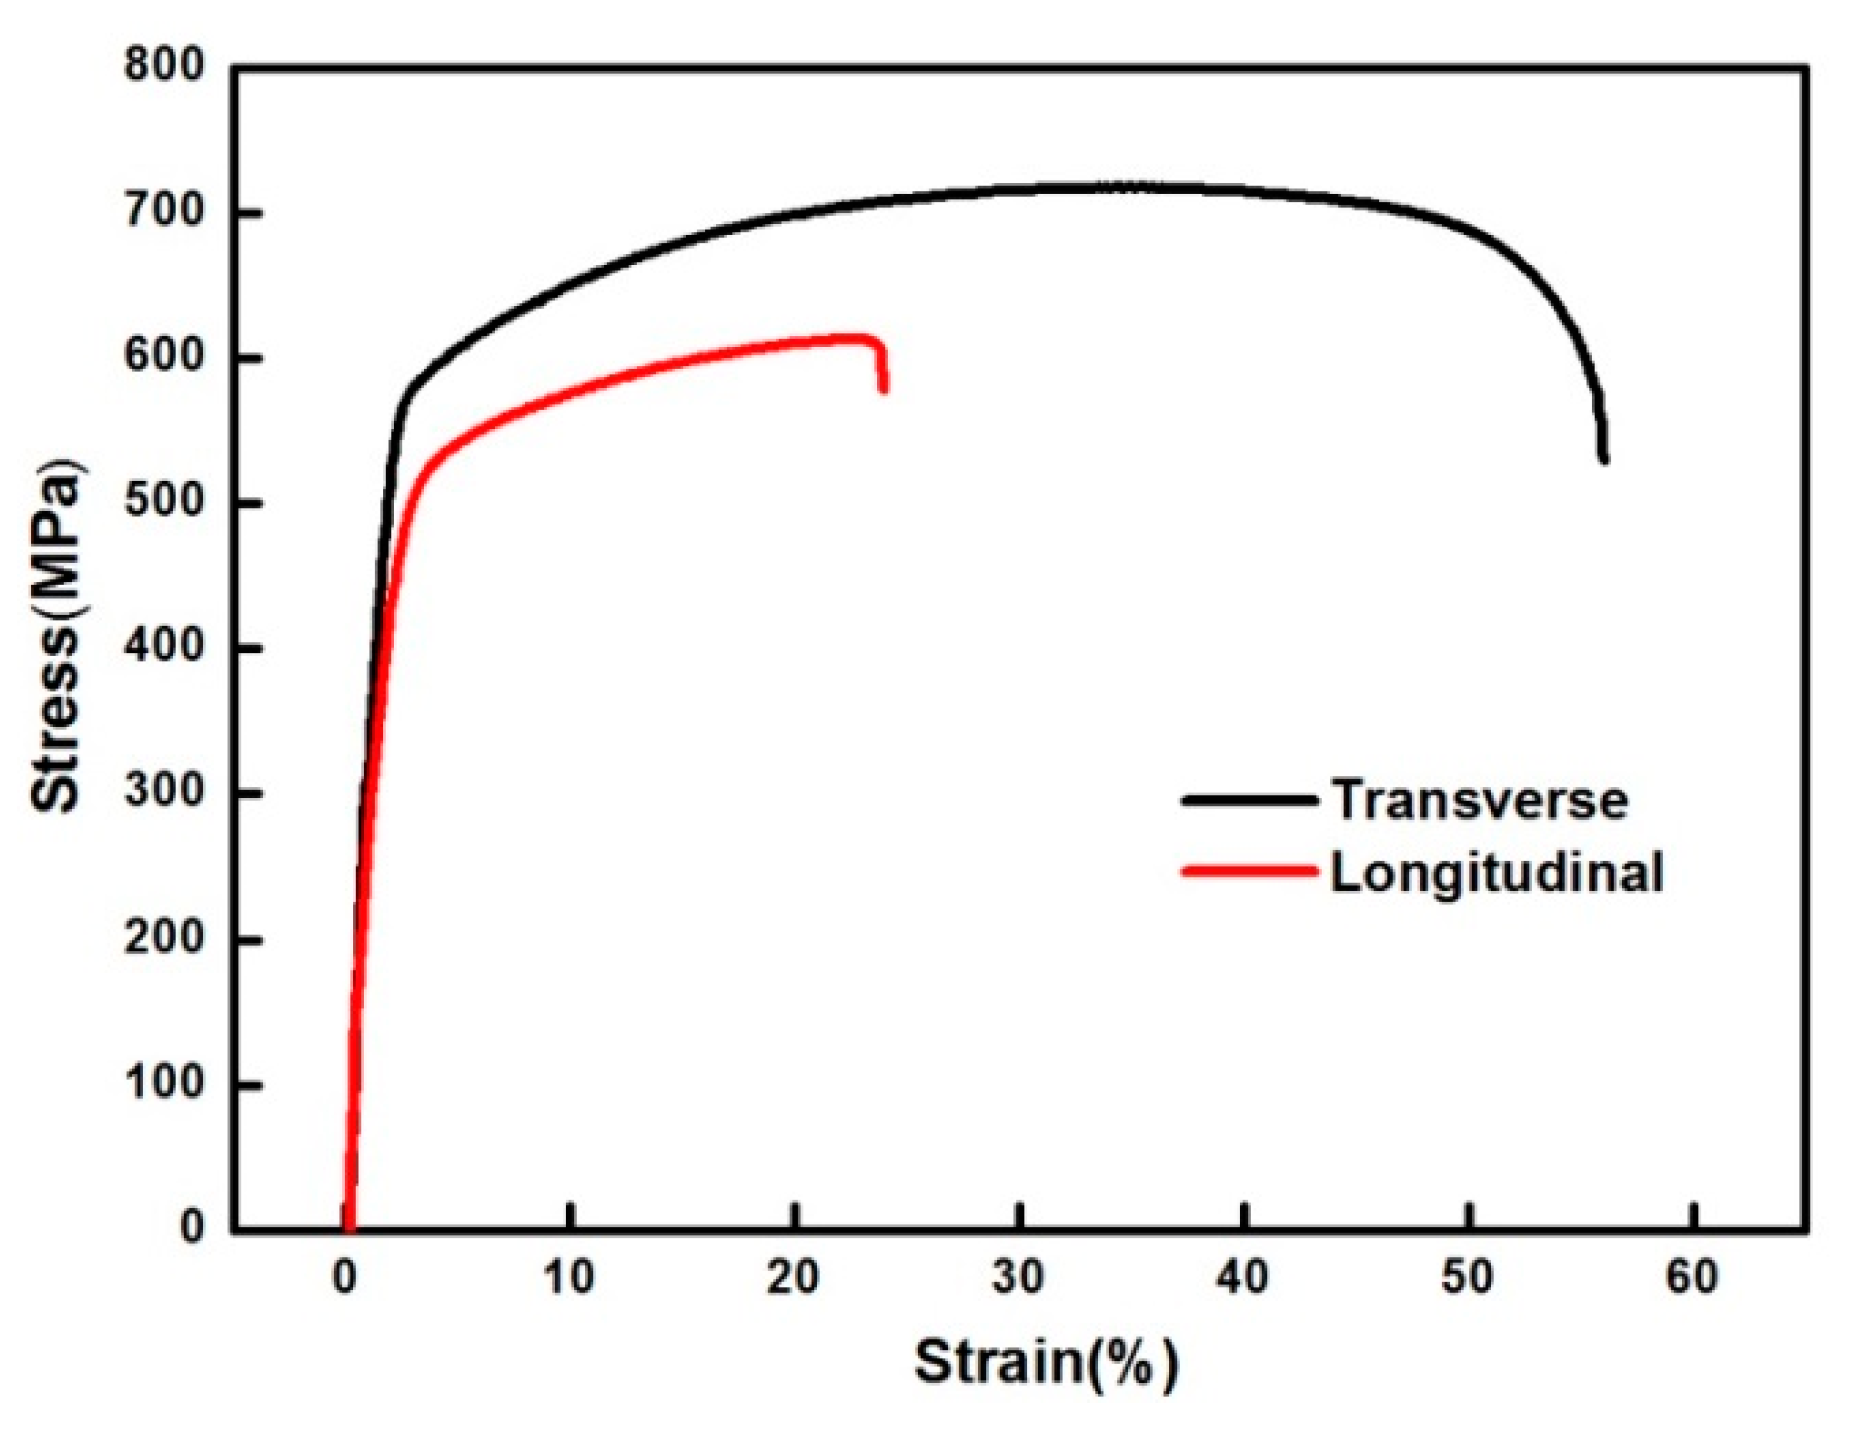
Both directions of the SLM-manufactured 316L SS have excellent strength and ductility. A strength of ~720 MPa and El of 48% are obtained in the transversal direction, whereas the corresponding properties of the longitudinal counterpart are ~615 MPa and 18%. The anisotropy of the mechanical properties of the transverse and longitudinal specimens is obvious.
(4)
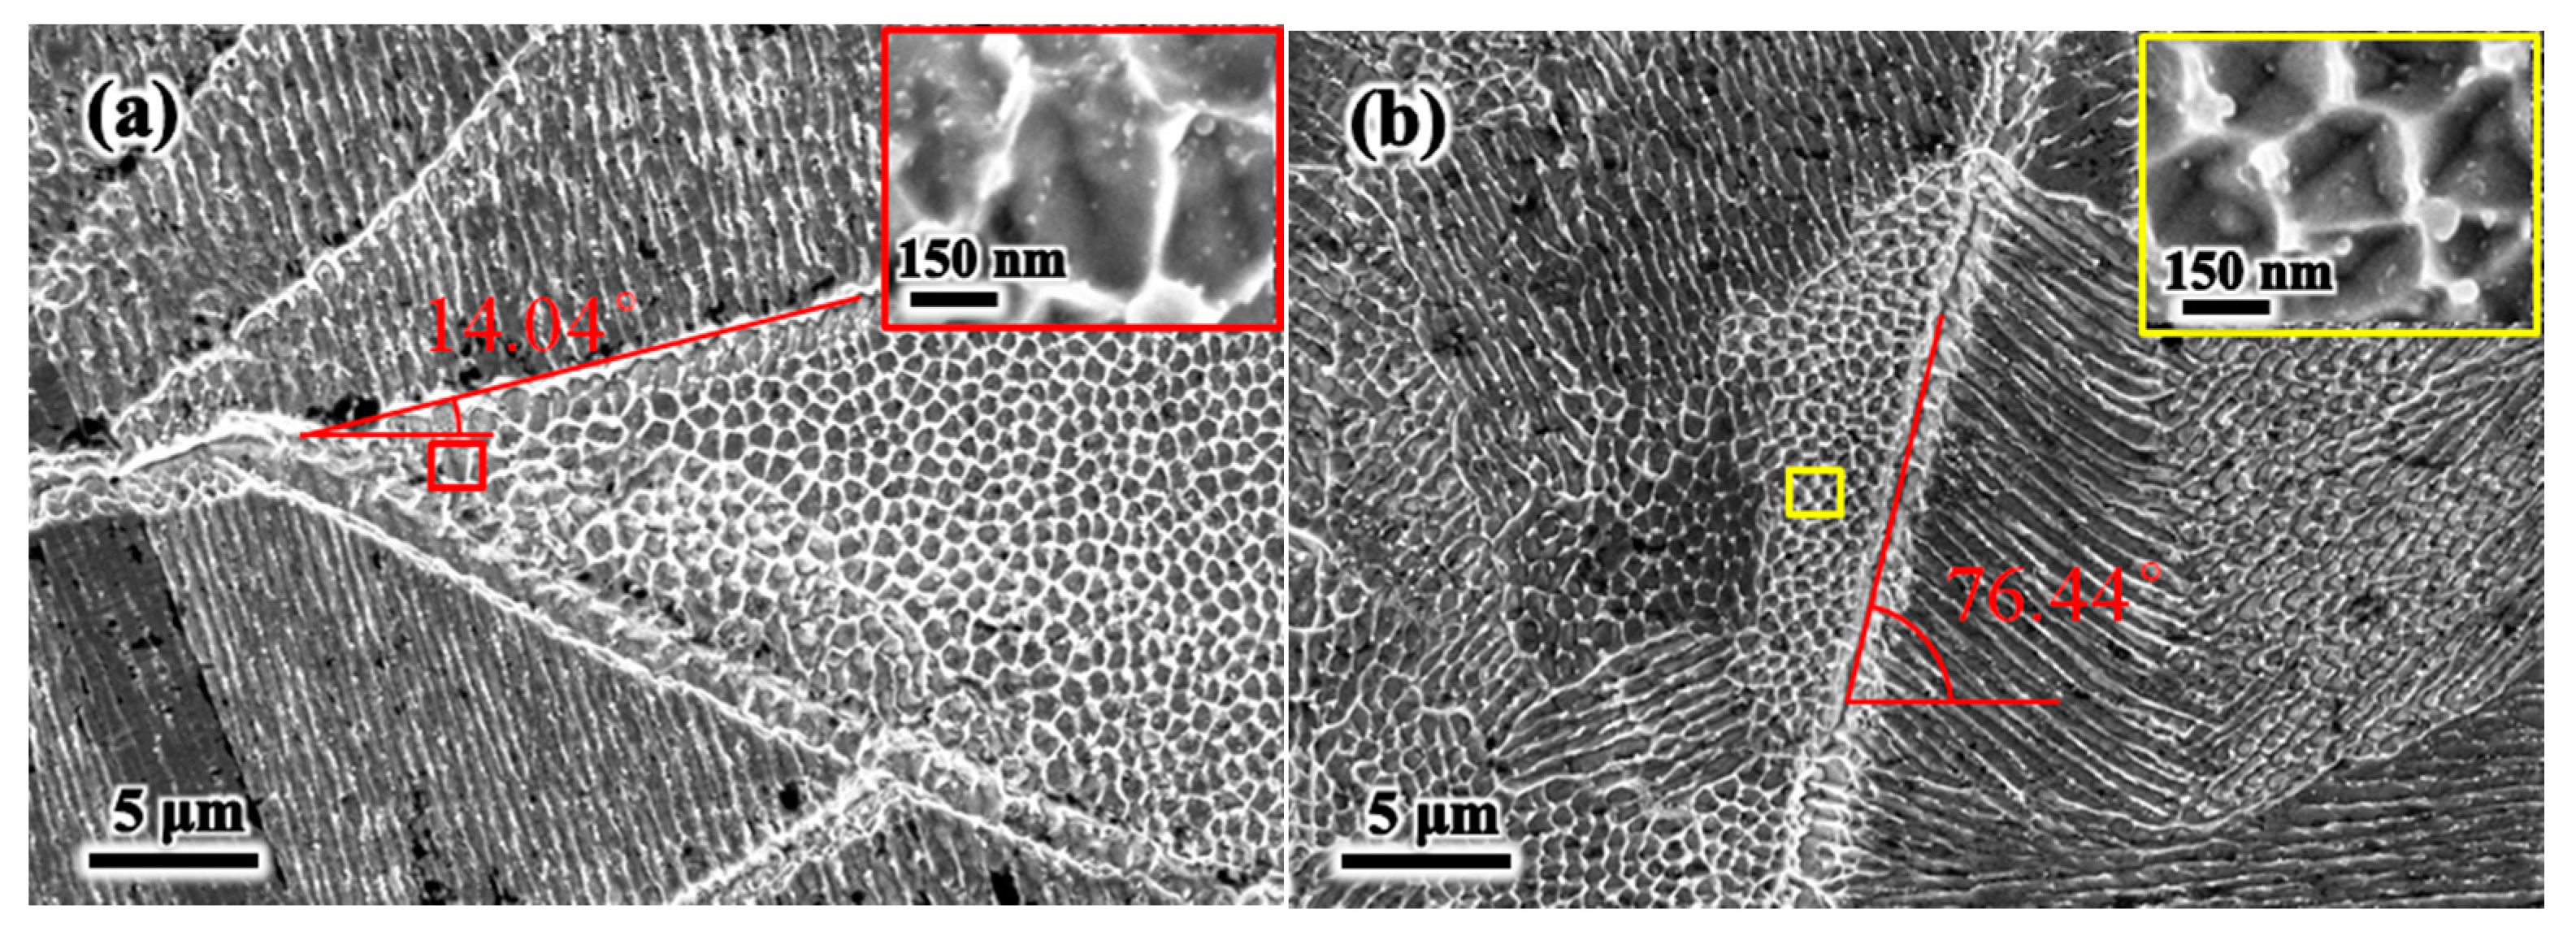
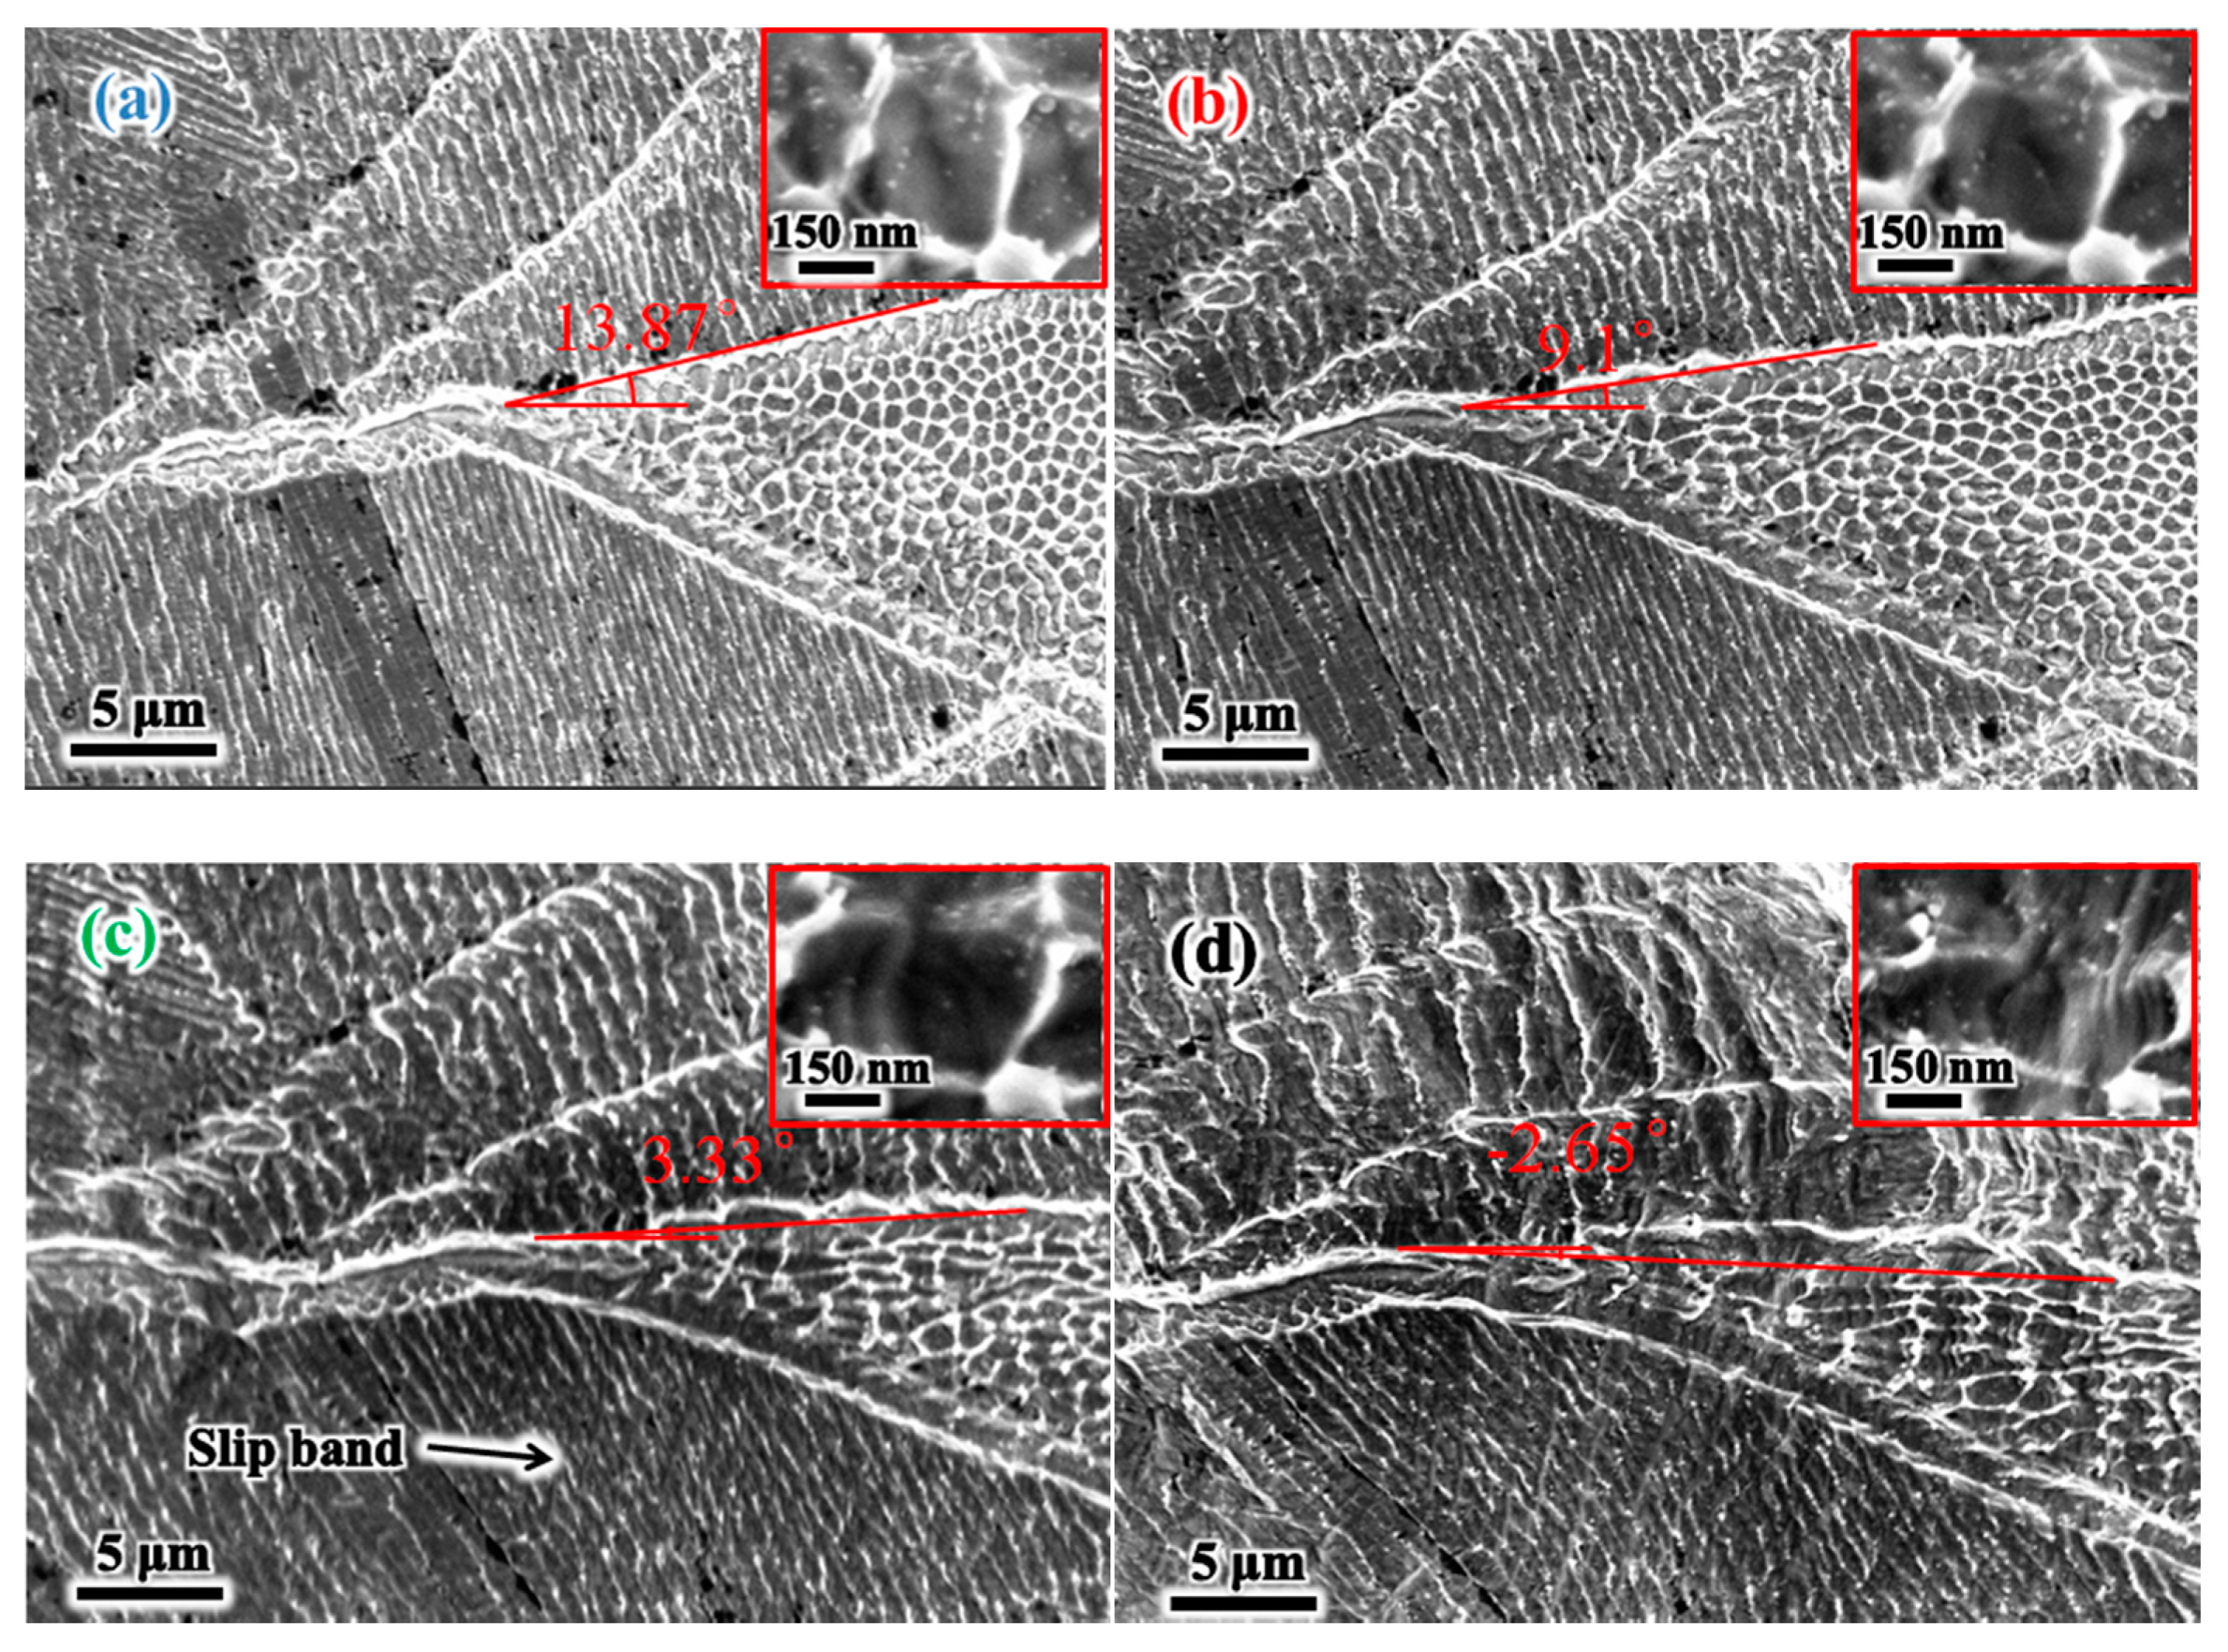
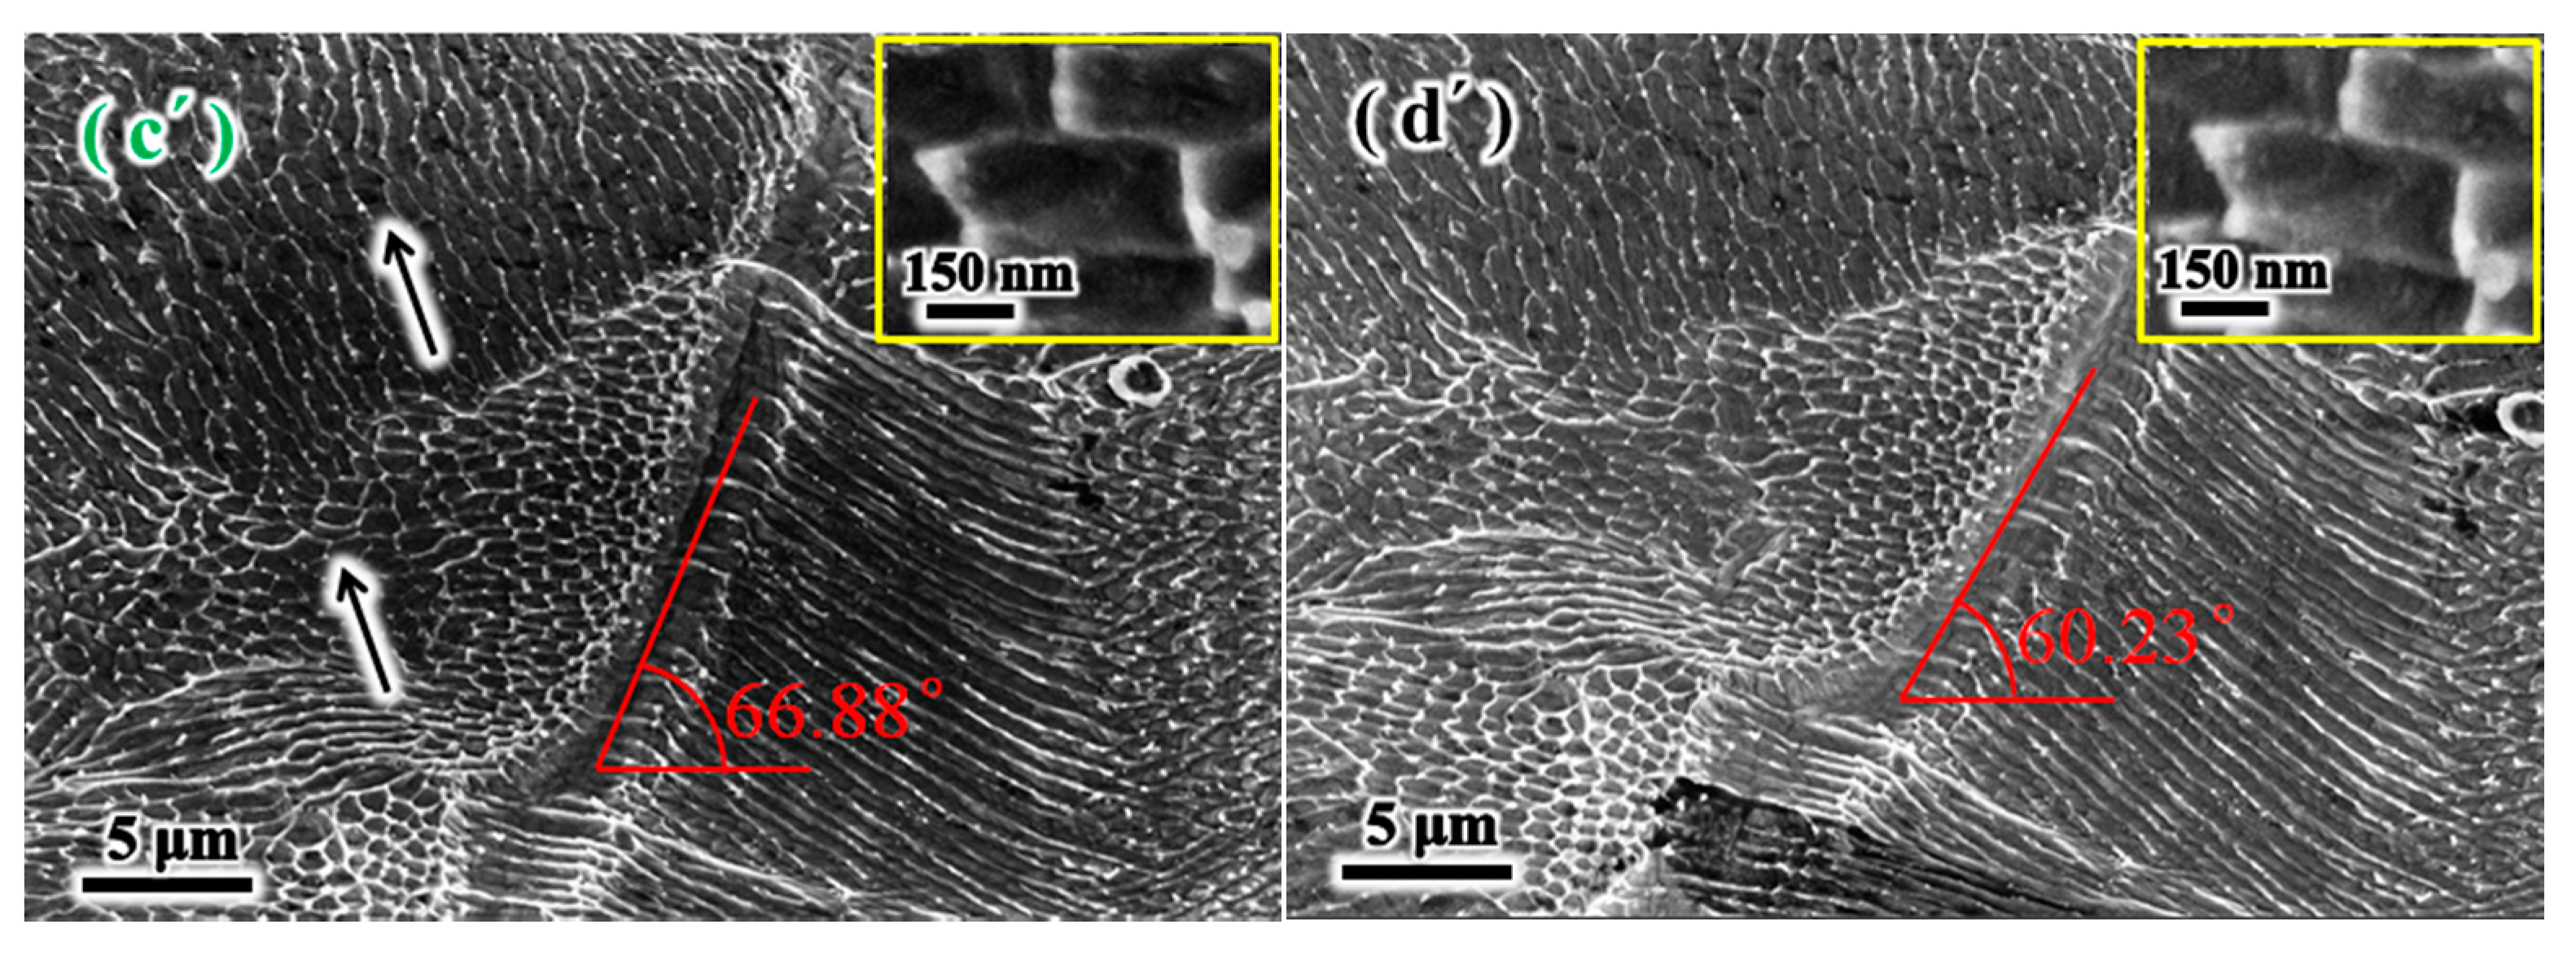
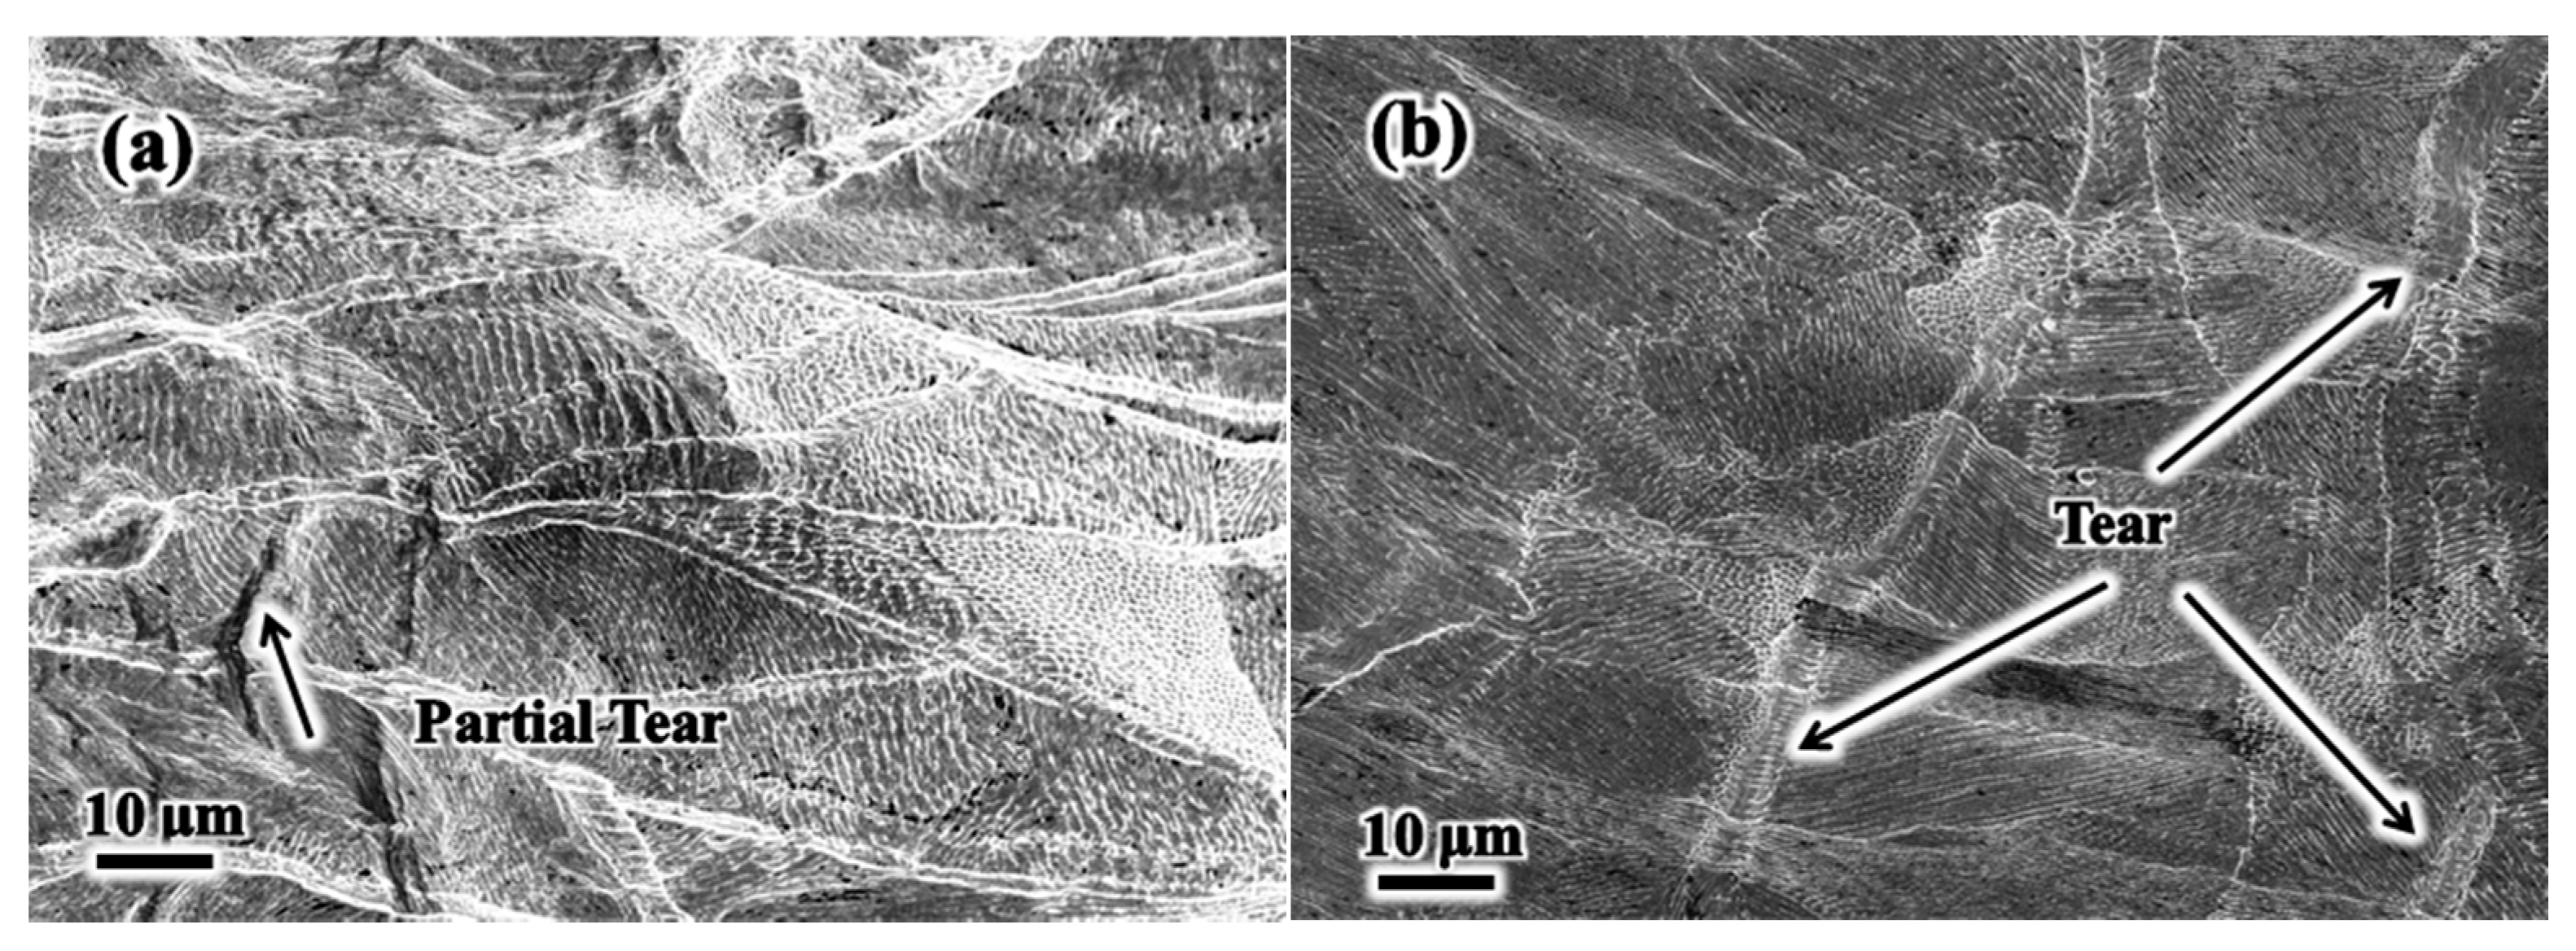
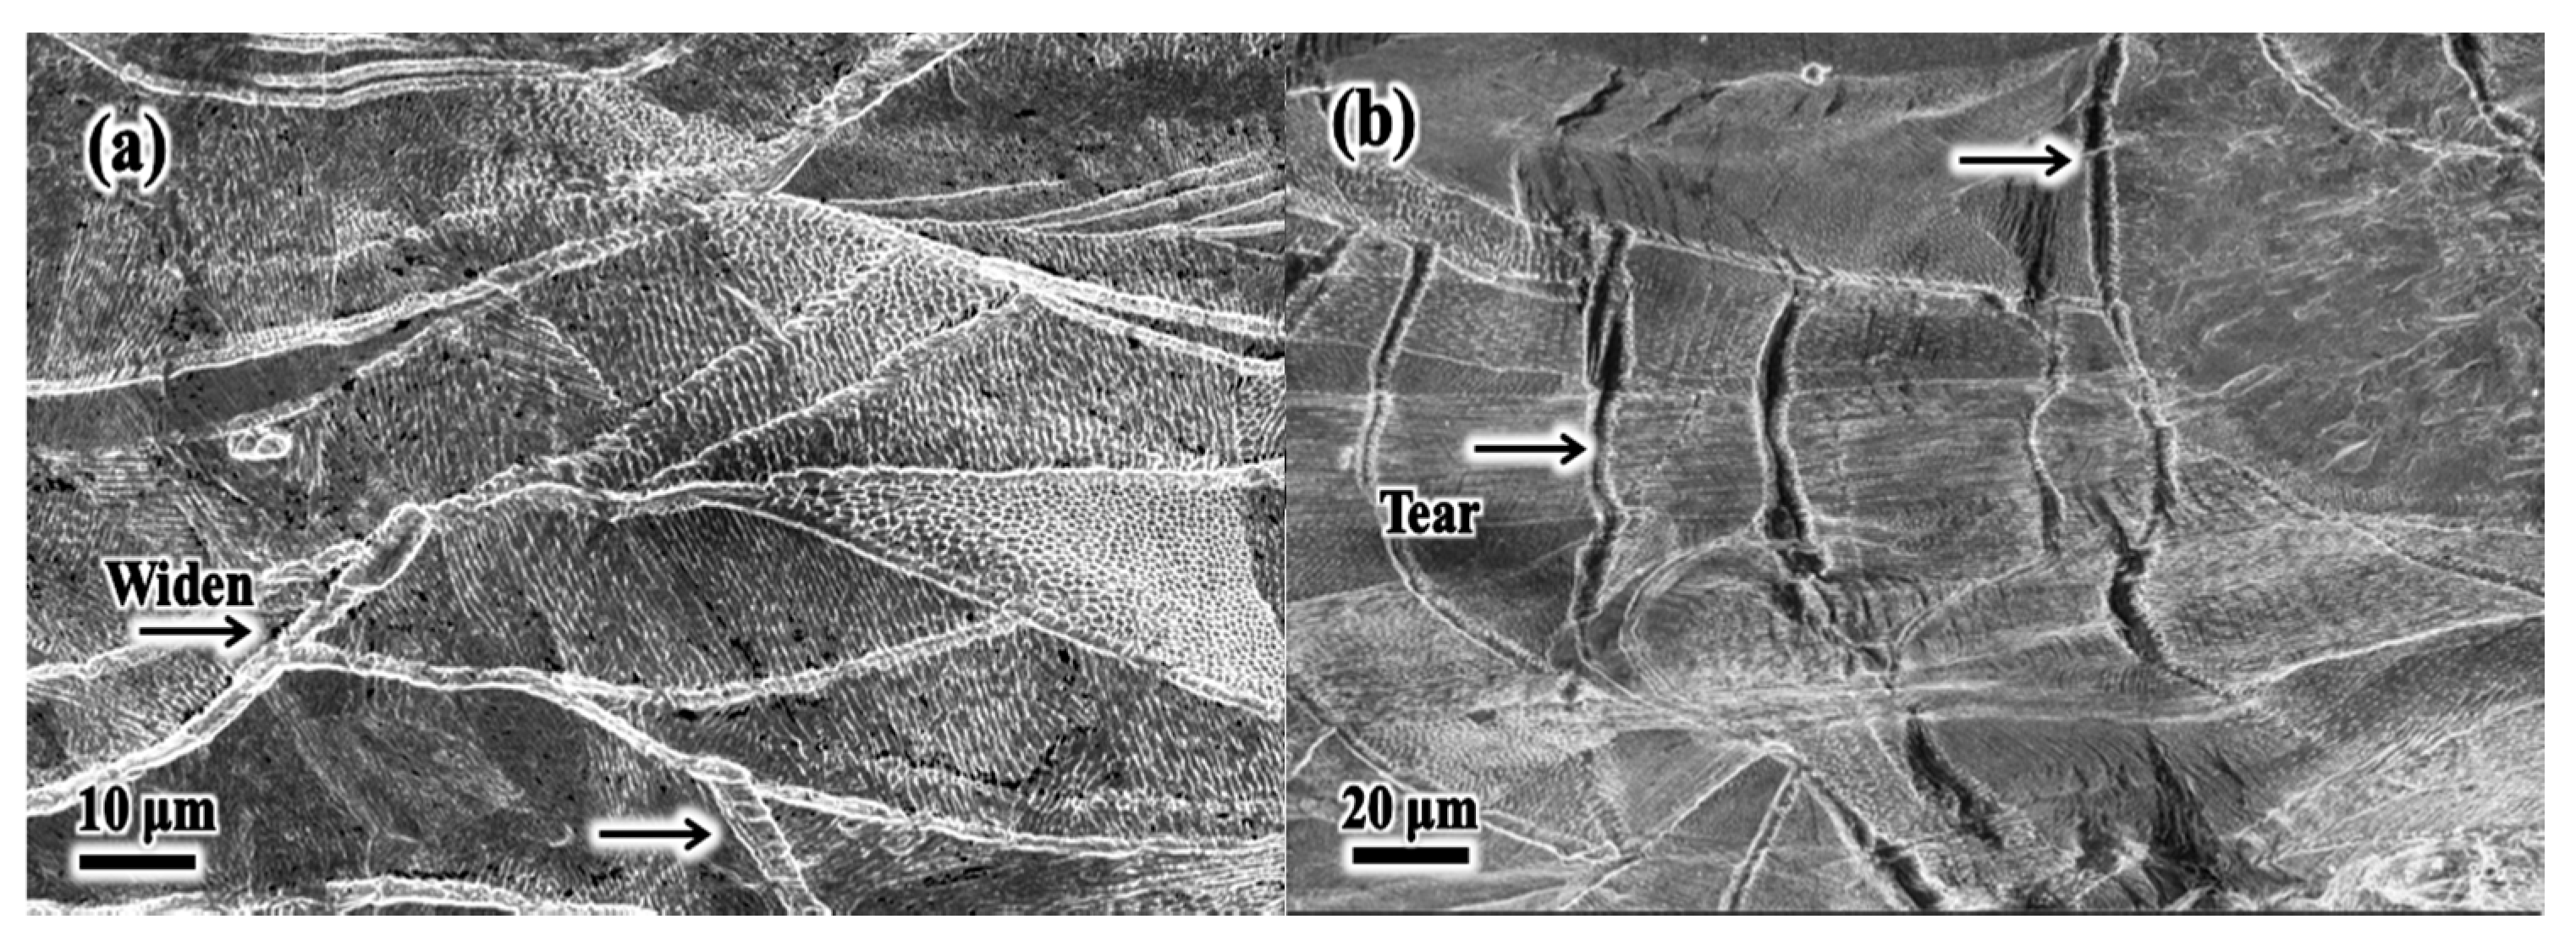
The geometric relationship between the boundary of the molten pool and the tensile force is the reason of the anisotropy of the mechanical properties. The slip deformation of the molten pool boundary is greatly constrained when the loading direction is parallel to the boundary of the molten pool, or at an acute or obtuse angle, and the cellular substructures coordinate greater deformation until it is breaks. In contrast, the molten pool boundary tears quickly when the loading directions are perpendicular to the molten pool boundary, resulting in low elongation and yield strength.

Author Contributions

Conceptualization, B.Z. and Y.L. (Yu Liang); methodology, B.Z. and Y.L. (Yu Liang); software, B.Z. and Y.L. (Yu Liang); validation, B.Z. and Y.L. (Yu Liang); formal analysis, B.Z. and Y.L. (Yu Liang); investigation, W.L. and Y.L. (Yilong Liang); resources, Y.L. (Yilong Liang); data curation, P.X. and Y.L. (Yu Liang); writing—original draft preparation, B.Z.; writing—review and editing, B.Z.; visualization, B.Z.; supervision, W.L. and P.X.; project administration, P.X.; funding acquisition, Y.L. (Yu Liang). All authors have read and agreed to the published version of the manuscript.

Funding

This research was funded by National Natural Science Foundation of China (No. 51761003, No. 51801037 and No. 51461007), Natural Science Foundation of Guizhou Province, China (No. [2017] 5788), and One Hundred Person Project of Guizhou Province, China (No. [2020] 6006).

Institutional Review Board Statement

Not applicable.

Informed Consent Statement

Not applicable.

Data Availability Statement

Not applicable.

Conflicts of Interest

The authors declare no potential conflicts of interest with respect to the research, authorship, and/or publication of this article.

References

  1. Koehnen, P.; Haase, C.; Bueltmann, J.; Ziegler, S.; Schleifenbaum, J.H.; Bleck, W. Mechanical properties and deformation behavior of additively manufactured lattice structures of stainless steel. Mater. Des. 2018, 145, 205–217. [Google Scholar] [CrossRef]
  2. Herzog, D.; Seyda, V.; Wycisk, E.; Emmelmann, C. Additive manufacturing of metals. Acta Mater. 2016, 117, 371–392. [Google Scholar] [CrossRef]
  3. Chen, W.; Yin, G.; Feng, Z.; Liao, X. Effect of Powder Feedstock on Microstructure and Mechanical Properties of the 316L Stainless Steel Fabricated by Selective Laser Melting. Metals 2018, 8, 729. [Google Scholar] [CrossRef] [Green Version]
  4. Murr, L.E.; Johnson, W.L. 3D metal droplet printing development and advanced materials additive manufacturing. J. Mater. Res. Technol-JMRT. 2017, 6, 77–89. [Google Scholar] [CrossRef]
  5. Liu, Q.; Wang, G.; Qiu, C. On the role of dynamic grain movement in deformation and mechanical anisotropy development in a selectively laser melted stainless steel. Addit. Manuf. 2020, 35, 101329. [Google Scholar] [CrossRef]
  6. Zheng, L.; Liu, Y.; Sun, S.; Zhang, H. Selective laser melting of Al–8.5Fe–1.3V–1.7Si alloy: Investigation on the resultant microstructure and hardness. Chin. J. Aeronaut. 2015, 28, 564–569. [Google Scholar] [CrossRef] [Green Version]
  7. Vilaro, T.; Colin, C.; Bartout, J.D.; Nazé, L.; Sennour, M. Microstructural and mechanical approaches of the selective laser melting process applied to a nickel-base superalloy. Mater. Sci. Eng. A 2012, 534, 446–451. [Google Scholar] [CrossRef]
  8. Gu, D.; Hagedorn, Y.-C.; Meiners, W.; Meng, G.; Batista, R.J.S.; Wissenbach, K.; Poprawe, R. Densification behavior, microstructure evolution, and wear performance of selective laser melting processed commercially pure titanium. Acta Mater. 2012, 60, 3849–3860. [Google Scholar] [CrossRef]
  9. Verhaeghe, F.; Craeghs, T.; Heulens, J.; Pandelaers, L. A pragmatic model for selective laser melting with evaporation. Acta Mater. 2009, 57, 6006–6012. [Google Scholar] [CrossRef]
  10. Pokharel, R.; Balogh, L.; Brown, D.W.; Clausen, B.; Gray, G.T., III; Livescu, V.; Vogel, S.C.; Takajo, S. Signatures of the unique microstructure of additively manufactured steel Check for observed via diffraction. Scr. Mater. 2018, 155, 16–20. [Google Scholar] [CrossRef]
  11. Miller, J.T.; Martin, H.J.; Cudjoe, E. Comparison of the effects of a sulfuric acid environment on traditionally manufactured and additive manufactured stainless steel 316L alloy. Addit. Manuf. 2018, 23, 272–286. [Google Scholar] [CrossRef]
  12. Chao, Q.; Cruz, V.; Thomas, S.; Birbilis, N.; Collins, P.; Taylor, A.; Hodgson, P.D.; Fabijanic, D. On the enhanced corrosion resistance of a selective laser melted austenitic stainless steel. Scr. Mater. 2017, 141, 94–98. [Google Scholar] [CrossRef]
  13. Li, B.; Wang, T.; Li, P.; Wang, S.; Wang, L. Selective Laser Melting of 316L Stainless Steel: Influence of Co-Cr-Mo-W Addition on Corrosion Resistance. Metals 2021, 11, 597. [Google Scholar] [CrossRef]
  14. Feng, Z.; Cheng, X.; Dong, C.; Xu, L.; Li, X. Passivity of 316L stainless steel in borate buffer solution studied by Mott–Schottky analysis, atomic absorption spectrometry and X-ray photoelectron spectroscopy. Corros. Sci. 2010, 52, 3646–3653. [Google Scholar] [CrossRef]
  15. Kurgan, N.; Varol, R. Mechanical properties of P/M 316L stainless steel materials. Powder Technol. 2010, 201, 242–247. [Google Scholar] [CrossRef]
  16. German, R.M.J.J.W.; Sons, I. Powder Metallurgy of Iron and Steel; John Wiley & Sons, Inc.: New York, NY, USA, 1998; pp. 578–579. [Google Scholar]
  17. Dobrzanski, L.; Brytan, Z.; Grande, M.A.; Rosso, M. Properties of duplex stainless steels made by powder metallurgy. Arch. Mater. Sci. 2007, 218, 218. [Google Scholar]
  18. Callister, W.D.; Rethwisch, D.G. Materials Science and Engineering; John Wiley & Sons: New York, NY, USA, 2011; Volume 5. [Google Scholar]
  19. Casati, R.; Lemke, J.; Vedani, M. Microstructure and Fracture Behavior of 316L Austenitic Stainless Steel Produced by Selective Laser Melting. J. Mater. Sci. Technol. 2016, 32, 738–744. [Google Scholar] [CrossRef]
  20. AlHazaa, A.; Haneklaus, N. Diffusion Bonding and Transient Liquid Phase (TLP) Bonding of Type 304 and 316 Austenitic Stainless Steel—A Review of Similar and Dissimilar Material Joints. Metals 2020, 10, 613. [Google Scholar] [CrossRef]
  21. Gray, G.T.; Livescu, V.; Rigg, P.A.; Trujillo, C.P.; Cady, C.M.; Chen, S.R.; Carpenter, J.S.; Lienert, T.J.; Fensin, S.J. Structure/property (constitutive and spallation response) of additively manufactured 316L stainless steel. Acta Mater. 2017, 138, 140–149. [Google Scholar] [CrossRef]
  22. Saeidi, K.; Gao, X.; Zhong, Y.; Shen, Z.J. Hardened austenite steel with columnar sub-grain structure formed by laser melting. Mater. Sci. Eng. A 2015, 625, 221–229. [Google Scholar] [CrossRef]
  23. Hong, Y.; Zhou, C.; Zheng, Y.; Zhang, L.; Zheng, J. The cellular boundary with high density of dislocations governed the strengthening mechanism in selective laser melted 316L stainless steel. Mater. Sci. Eng. A 2021, 799, 140279. [Google Scholar] [CrossRef]
  24. Oliveira, J.P.; Santos, T.G.; Miranda, R.M. Revisiting fundamental welding concepts to improve additive manufacturing: From theory to practice. Prog. Mater. Sci. 2020, 107, 100590. [Google Scholar] [CrossRef]
  25. Liu, J.; Sun, Q.; Zhou, C.A.; Wang, X.; Li, H.; Guo, K.; Sun, J. Achieving Ti6Al4V alloys with both high strength and ductility via selective laser melting. Mater. Sci. Eng. A 2019, 766, 138319. [Google Scholar] [CrossRef]
  26. Ziętala, M.; Durejko, T.; Polański, M.; Kunce, I.; Płociński, T.; Zieliński, W.; Łazińska, M.; Stępniowski, W.; Czujko, T.; Kurzydłowski, K.J.; et al. The microstructure, mechanical properties and corrosion resistance of 316L stainless steel fabricated using laser engineered net shaping. Mater. Sci. Eng. A 2016, 677, 1–10. [Google Scholar] [CrossRef]
  27. Zhong, Y.; Liu, L.; Wikman, S.; Cui, D.; Shen, Z. Intragranular cellular segregation network structure strengthening 316L stainless steel prepared by selective laser melting. J. Nucl. Mater. 2016, 470, 170–178. [Google Scholar] [CrossRef]
  28. Suryawanshi, J.; Prashanth, K.G.; Ramamurty, U. Mechanical behavior of selective laser melted 316L stainless steel. Mater. Sci. Eng. A 2017, 696, 113–121. [Google Scholar] [CrossRef]
  29. Barkia, B.; Aubry, P.; Haghi-Ashtiani, P.; Auger, T.; Gosmain, L.; Schuster, F.; Maskrot, H. On the origin of the high tensile strength and ductility of additively manufactured 316L stainless steel: Multiscale investigation. J. Mater. Sci. Technol. 2020, 41, 209–218. [Google Scholar] [CrossRef]
  30. Wang, Y.M.; Voisin, T.; McKeown, J.T.; Ye, J.; Calta, N.P.; Li, Z.; Zeng, Z.; Zhang, Y.; Chen, W.; Roehling, T.T.; et al. Additively manufactured hierarchical stainless steels with high strength and ductility. Nat. Mater. 2018, 17, 63–71. [Google Scholar] [CrossRef] [PubMed] [Green Version]
  31. Pham, M.S.; Dovgyy, B.; Hooper, P.A. Twinning induced plasticity in austenitic stainless steel 316L made by additive manufacturing. Mater. Sci. Eng. A 2017, 704, 102–111. [Google Scholar] [CrossRef]
  32. Jeon, J.M.; Park, J.M.; Yu, J.-H.; Kim, J.G.; Seong, Y.; Park, S.H.; Kim, H.S. Effects of microstructure and internal defects on mechanical anisotropy and asymmetry of selective laser-melted 316L austenitic stainless steel. Mater. Sci. Eng. A 2019, 763, 138152. [Google Scholar] [CrossRef]
  33. Bahl, S.; Mishra, S.; Yazar, K.U.; Kola, I.R.; Chatterjee, K.; Suwas, S. Non-equilibrium microstructure, crystallographic texture and morphological texture synergistically result in unusual mechanical properties of 3D printed 316L stainless steel. Addit. Manuf. 2019, 28, 65–77. [Google Scholar] [CrossRef]
  34. HIS EMEA. SAE AMS 2759/11; IHS EMEA; An SAE International Group, 2005. [Google Scholar]
  35. Baciu, F.; Rusu-Casandra, A.; Pastramă, Ş.D. Low strain rate testing of tensile properties of steel. Mater. Today Proc. 2020, 32, 128–132. [Google Scholar]
  36. Kocks, U.F.; Tomé, C.N.; Wenk, H.-R. Texture and Anisotropy: Preferred Orientations in Polycrystals and Their Effect on Materials Properties; Cambridge University Press: Cambridge, UK, 1998; p. 391. [Google Scholar]
  37. Hou, J.; Chen, W.; Chen, Z.; Zhang, K.; Huang, A. Microstructure, tensile properties and mechanical anisotropy of selective laser melted 304L stainless steel. J. Mater. Sci. Technol. 2020, 48, 63–71. [Google Scholar] [CrossRef]
  38. Deev, A.A.; Kuznetcov, P.A.; Petrov, S.N. Anisotropy of Mechanical Properties and its Correlation with the Structure of the Stainless Steel 316L Produced by the SLM Method. Phys. Procedia. 2016, 83, 789–796. [Google Scholar] [CrossRef] [Green Version]
  39. Handbook, M.J.I.Y.Z.; Alloys, I. Properties and Selection: Stainless Steels. Tool Mater. Spec.-Purp. Met. 1980, 3, 781–791. [Google Scholar]
  40. Park, J.M.; Choe, J.; Park, H.K.; Son, S.; Jung, J.; Kim, T.-S.; Yu, J.-H.; Kim, J.G.; Kim, H.S. Synergetic strengthening of additively manufactured (CoCrFeMnNi)99C1 high-entropy alloy by heterogeneous anisotropic microstructure. Addit Manuf. 2020, 35, 101333. [Google Scholar] [CrossRef]
  41. Liu, L.; Ding, Q.; Zhong, Y.; Zou, J.; Wu, J.; Chiu, Y.-L.; Li, J.; Zhang, Z.; Yu, Q.; Shen, Z. Dislocation network in additive manufactured steel breaks strength–ductility trade-off. Mater. Today 2018, 21, 354–361. [Google Scholar] [CrossRef] [Green Version]
  42. Gorsse, S.; Hutchinson, C.; Gouné, M.; Banerjee, R.J.S.; MaTerialS, T.O.A. Additive manufacturing of metals: A brief review of the characteristic microstructures and properties of steels, Ti-6Al-4V and high-entropy alloys. Sci. Technol. Adv. Mater. 2017, 18, 584–610. [Google Scholar] [CrossRef] [PubMed] [Green Version]
  43. Yim, D.; Sathiyamoorthi, P.; Hong, S.-J.; Kim, H.S. Fabrication and mechanical properties of TiC reinforced CoCrFeMnNi high-entropy alloy composite by water atomization and spark plasma sintering. J. Alloys Compd. 2019, 781, 389–396. [Google Scholar] [CrossRef]
  44. Hansen, N. Hall–Petch relation and boundary strengthening. Scr. Mater. 2004, 51, 801–806. [Google Scholar] [CrossRef]
  45. Shifeng, W.; Shuai, L.; Qingsong, W.; Yan, C.; Sheng, Z.; Yusheng, S. Effect of molten pool boundaries on the mechanical properties of selective laser melting parts. J. Mater. Process. Technol. 2014, 214, 2660–2667. [Google Scholar] [CrossRef]
Figure 1. (a) SLM equipment of YLM-300; (b) chess scanning strategy, each layer is rotated 67°; (c) schematic of the built parts showing the positions from which the tensile specimens were extracted and the areas on which the microstructural analyses were performed; (d) dimensions of dog-bone shaped tensile specimens (mm).
Metals 11 00775 g001
Figure 2. Optical micrograph, in which (a) “fish scale” morphology on the lateral surface and (b) scanning traces on the top surface are observed. (c) Low magnification SEM micrographs of the lateral surface and (d) top surface; high magnification SEM micrographs of (e) the lateral surface and (f) the top surface.
Metals 11 00775 g002
Figure 3. EBSD inverse pole figure (IPF) of the SLM-manufactured 316L SS: (a) Columnar grain arranged along the building direction on the lateral surface and (b) grain size distribution, (c) fine grain on the top surface, and (d) grain size distribution.
Metals 11 00775 g003aMetals 11 00775 g003b
Figure 4. TEM image of the SLM-manufactured 316L SS: (a) A cellular substructure of the top surface with dislocation entanglement as the boundary, (b) a magnified cellular substructure, (c) a typical columnar substructure of the lateral surface, (d) a magnified image of c, (e) a high-resolution image of the dislocation, and (f) an image obtained by Fourier transformation.
Metals 11 00775 g004aMetals 11 00775 g004b
Figure 5. Transverse and longitudinal stress‑strain curves of SLM-manufactured 316L SS.
Metals 11 00775 g005
Figure 6. The yield strength and ductility data of the SLM-manufactured and conventional 316L SS from literature.
Metals 11 00775 g006
Figure 7. Fracture morphology of the SLM-manufactured 316L SS. (a) Low-magnification views of the fracture surface of a transverse specimen, (b) fracture unit and secondary crack, (c) low-magnification views of the fracture surface of a longitudinal specimen, (d) unmelted area.
Metals 11 00775 g007
Figure 8. (a) The schematic diagram of tensile force loading, (b) stress–strain curves of the transverse and longitudinal specimens during in situ tensile test. (The same four strain values are selected for observation in both the transverse and longitudinal samples, and mark them with letters on the curve. The transverse samples are a, b, c, d. The longitudinal samples are a′, b′, c, d′.)
Metals 11 00775 g008
Figure 9. The microstructure of the original specimens before tensile test. (a) Transverse specimen and (b) longitudinal specimen.
Metals 11 00775 g009
Figure 10. Microstructural changes in the transverse specimen under different tensile strains: (a) 4.08%; (b) 10%; (c) 14.17%; (d) 17.08%.
Metals 11 00775 g010
Figure 11. Microstructural changes in the longitudinal specimen under different tensile strains: (a’) 4.08%; (b’) 10%; (c) under 14.17%; (d) 17.08%.
Metals 11 00775 g011aMetals 11 00775 g011b
Figure 12. Low magnification morphology of the specimen under 17.08% strain. (a) Transverse specimen and (b) longitudinal specimen.
Metals 11 00775 g012
Figure 13. The theoretical calculated value and experimental value of YS of the transverse sample.
Metals 11 00775 g013
Figure 14. GND density. calculations are performed using the EBSD orientation maps of lateral surface.
Metals 11 00775 g014
Figure 15. (a) Stress-strain curve and (b) new grains formed after solution of the transverse sample.
Metals 11 00775 g015
Figure 16. Contribution of each strengthening mechanism.
Metals 11 00775 g016
Figure 17. The deformation tendency of the transverse specimen and the longitudinal specimen under 14.17% strain. (a) Transverse specimen and (b) longitudinal.
Metals 11 00775 g017
Publisher’s Note: MDPI stays neutral with regard to jurisdictional claims in published maps and institutional affiliations.

