Abstract
High-power disk laser welding a steel plate using the Inconel 82 (IN82) filler wire with a 1.2 and 3.0 m/min feeding rate has been investigated in the experiment. The rapid thermal cycle combined with convection induced by the keyhole mechanism in laser welding results in the rapid solidification of the fusion zone (FZ). However, the microstructure of the FZ is not homogeneous at the macroscopic scale. The dilution of the FZ is important in determining the final microstructure of the weldment. For the specimen with a 1.2 m/min wire feeding rate, a lower amount of Ni-based IN82 filler is introduced into the weld pool, and the dilution of the FZ is between 65% and 100%. The BCC structure with high density boundaries dominates the entire FZ. For the specimen with a 3.0 m/min wire feeding rate, part of the filler melt is trapped on the top of the weld pool, and solidified into austenite alloyed with a Ni concentration above 15 at%. The range of dilution in the FZ with a 3.0 m/min wire feeding rate is decreased to 50–90%. There are hot cracks initiated/propagated along interdendritic austenite and in the austenite free of boundaries. Boundaries, especially for high-angle ones, in the BCC structure retard hot crack propagation in the FZ. The application of quantitative chemical analyses of Fe or Ni concentrations in the weldment provides a good approximation in evaluating the dilution of the FZ in laser welding. The methodology proposed in this study shows potential to obtain the dilution of any specific location in the FZ for industrial application in the future.
1. Introduction
Cold reciprocating rolling is usually applied to manufacture steel strips [1,2]. The production line carries out multi-pass rolling back and forth until the final thickness of the plate is obtained. For the alloy with low ductility, increasing the number of rolling passes and/or reducing the amount of thickness reduction in each rolling pass are required to avoid the fracture of the strip during the cold rolling process. The multi-pass reciprocating cold rolling process is slow and the manufacturing cost is high, which is not as good as continuous cold rolling in mass production. Therefore, developing a modified rolling process to manufacture steel strips has become an attractive approach with advantages of high production rate and low cost [3,4,5]. Kozhevnikov et al. proposed a procedure aimed at the optimization of adjusting the mill, which makes it possible to exclude the possibility of dangerous vibration of the mill and increase the average speed of rolling by 7~15% [6]. In addition to mechanical vibration consideration in mass production, metallurgical factors are also important in developing the continuous cold rolling process.
One of the key issues in the modified cold rolling process is that the steel strip must be welded during the process [7]. The steel strip goes through a series of processes such as rolling, annealing, and pickling without catastrophic failure of the weldment before the end product is obtained [7,8,9]. The weldment must be strong enough to bear a series of harsh manufacturing steps, such as a highly stressed strip in combination with biaxial compression and tension. It is an extremely challenging task. If a welded strip with a poor-quality joint is sent into the line of the production, then a fracture of the weld metal and a complete long stop of the line may occur until the strip is removed. The production yield is significantly deteriorated.
High-power lasers have been widely studied, such as cladding, surface modification and welding, in recent years, and they demonstrate high potential for industrial application [10,11,12,13]. High-power disk laser welding is featured with high heat flux and low total heat input [14]. A purified weldment with minimum distortion is achieved as compared with other traditional fusion welding processes. It has been reported that the high quality weldment was obtained in many applications, so a high-power disk laser has been chosen in the study [15]. The filler metal with a similar chemical composition of the base metal (BM) applied in laser welding the steel plate results in the coarsening of the grain size in the fusion zone (FZ), and the strength of the weldment is significantly deteriorated. Therefore, a nickel-based filler wire has been selected in the experiment in order to obtain higher strength of the FZ. Inconel 82 (IN82) filler wire is characterized by high strength, toughness and resistance to hot cracking after welding [16,17,18]. A steel plate cut from the steel strip with the chemical composition of 94.21 Fe and 5.79 Si in at% is prepared in the experiment. The application of the Ni-based IN82 filler wire in laser welding the steel plate results in the dilution of the BM. The chemical composition of the FZ is quite different from that of the nickel-based IN82 filler wire and steel BM.
The chemical composition of the FZ is not uniform due to incomplete mixing of the weld pool after laser welding featured with rapid thermal history. Dilution always plays a crucial role in evaluating alloying element distributions of the FZ. For example, the structure of IN82 filler is face-centered cubic (FCC). The structure of the steel base metal (BM) is body-centered cubic (BCC). There is an austenite with the FCC structure resulting from the dilution of FZ. The austenite is stabilized to room temperature if it is alloyed with enough Ni concentration. The distribution of Ni concentration in the FZ can be quantified if the dilution of FZ is obtained from the experiment.
It has been reported that the distribution of phase/structure in the FZ is strongly related to the susceptibility of hot cracking in the FZ [17,18]. Additionally, hot cracking of the weld metal is frequently observed in many welded strips [19,20]. It is important to propose a methodology to evaluate the dilution of the FZ in laser weldment before developing practical solutions of continuous cold rolling processes with various combinations of alloy steel strips. Toth et al. completed an elaborate work on electron beam welding of 2205 duplex stainless steel using the pre-placed nickel-based filler alloy, and the average chemical composition of the FZ has been calculated by means of a mixing equation [21]. The dilution and chemical composition of the FZ play crucial roles in heterogeneous welding. The purpose of this study is focused on the dilution and microstructure of the laser welded steel plate using the IN82 filler wire.
2. Material and Experimental Procedures
An 8 kW TRUMPF high-power disk laser (TRUMPF Taiwan Co. Ltd., Tao-Yuan City, Taiwan) was used in the experiment. A few preliminary laser welding experiments were performed in order to achieve full penetration of the BM with minimum distortion and heat affected zone (HAZ). The optimized laser power was kept at 3.6 kW, and the travel speed of the disk laser head was 4.2 m/min. Two different IN82 wire feeding speeds were 1.2 and 3.0 mm/min, respectively. Three welding specimens were prepared for each condition, and only one randomly selected specimen performed the following dilution analysis.
The steel plate was cut from the steel strip with the dimension of 150 mm in width, 100 mm in length and 2.3 mm in thickness. The length of the weldment was 100 mm. The steel BM is free of any cleaning procedure before laser welding in order to simulate the condition of mass production. IN82 filler with a wire diameter of 1.0 mm was applied in laser welding the cold rolled steel. The steel BM with the chemical composition of 94.21 Fe and 5.79 Si in at% was prepared specifically for the purpose of evaluating the dilution of the FZ in the experiment. The nickel-based IN82 filler wire was purchased from Giant-Welding Metal Co. Ltd. (Taichung City, Taiwan), and its chemical composition according to the mill certificate in at% is 0.04 C, 20.69 Cr, 0.25 Fe, 3.39 Mn, 1.66 Nb, 73.76 Ni and 0.21 Si. A square butt joint with flat position was used in the laser welding experiment.
Figure 1a shows the infrastructure of high-power disk laser welding the steel plate in the laboratory. Figure 1b displays the top view of the laser weldment. The FZ and BM are labeled in the figure. There is a 3D synthesis image illustrated in Figure 1c. The cross section of the weldment (Figure 1c) was mounted and ground by SiC papers and diamond suspensions. The specimen was finally chemically etched by a dilute SiO2 suspension in order to obtain a stress-free surface before the inspection of electron back scattered diffraction (EBSD). A Vickers micro-hardness tester, Duramin-100 AC3 (Struers Inc., Cleveland, OH, USA), was used to measure the micro-hardness in different regions of a weld. The ASTM E384-99 code, the standard test method for the microindentation hardness of materials, was applied to all hardness measurements in the experiment. The Vickers hardness (Hv) is obtained under the test condition of 200 g applied load and 10 s duration time. Three tensile tests of the FZ were performed for each welding condition. A JXA-8530F Plus electron probe microanalyzer (EPMA, JEOL, Tokyo, Japan) equipped with wavelength dispersive spectroscopy (WDS) was utilized for quantitative chemical analyses of the selected area. Secondary electron image (SEI) was used in the experiment. The operation voltage was kept at 15 kV, and the minimum spot size was 1 μm. A JSM-7800F Prime field emission scanning electron microscope (FESEM, JEOL, Tokyo, Japan) equipped with the Nordlys Max 3 electron backscatter diffraction (EBSD, Oxford Instruments, Abingdon, UK) was used for crystallographic analyses in order to identify various phases/structures in the weldment. Its operation voltage was set at 20 kV.
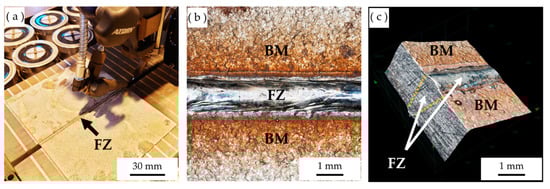
Figure 1.
(a) The infrastructure of high-power disk laser welding the steel plate in laboratory, (b) the top view of laser weldment, (c) 3D synthesis image of the laser weldment.
3. Results and Discussion
3.1. Laser Weldment with 3.0 m/min IN82 Wire Feeding Rate
Figure 2a shows the EPMA SEI cross section of the macroscopic photo from the laser weldment with a 3.0 m/min IN82 wire feeding rate. The laser beam was irradiated on the top surface of the square butt joint, and the IN82 filler wire was also fed from the top of the square butt joint. Both the FZ and BM are labeled in the figure. After laser welding, the width at the top weldment is much wider than that of the lower portion of the weldment. The cross section of the weldment is similar to a trumpet. Figure 2j displays the EBSD crystallographic map of the weldment. The BM is ferrite with a body center cubic (BCC) structure in red color [22]. There are at least two structures in the FZ including the BCC structure marked by red color and face-centered cubic (FCC) austenite marked by blue color [21]. The upper portion of the weldment is primarily composed of austenite, and the BCC structure dominates the middle and lower portions of the weldment. The convection of the FZ during laser welding was incomplete for the weldment with a 3.0 m/min IN82 wire feeding rate. The mixing between the nickel-based IN82 filler wire and steel BM was insufficient to form a homogeneous FZ due to the rapid thermal history of laser welding.
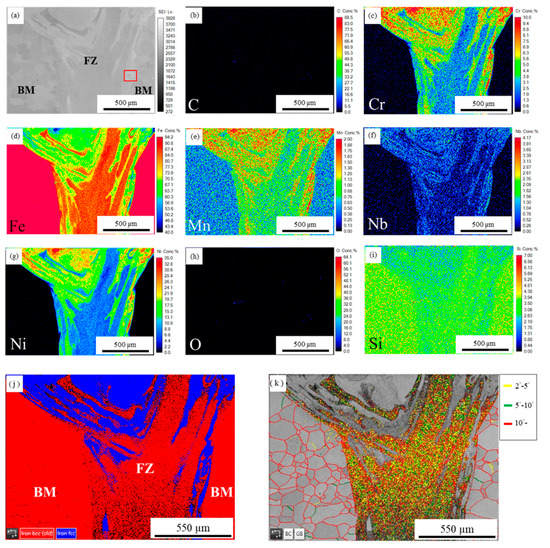
Figure 2.
The cross section of the laser weldment with 3.0 m/min IN82 wire feeding rate: (a) EPMA SEI, (b–i) WDS quantitative mappings of C, Cr, Fe, Mn, Nb, Ni, O and Si in at%, (j) EBSD crystallographic map, (k) EBSD boundary misorientation map.
Figure 2b–i illustrate WDS quantitative element mappings of C, Cr, Fe, Mn, Nb, Ni, O and Si in at%. In comparison between the EBSD crystallographic map (Figure 2j) and quantitative element mapping results (Figure 2b–i), the BCC structure is rich in Fe and Si (Figure 2d,i). In contrast, the austenite is alloyed with Cr, Mn, Nb and Ni (Figure 2c,e–g). There are almost no carbon contamination and oxidation of the weldment as demonstrated in Figure 2b,h.
The dilution of the FZ plays a crucial role in determining the final microstructure of the weldment. Dilution is expressed in terms of dilution of the filler metal by the BM. Mathematically, dilution is the ratio of the amount of melted BM to the total amount of fused metal [17]. It has been reported that the dilution can be estimated by the original joint geometry, or the actual composition of the FZ determined by quantitative chemical analysis [17]. The dilution calculated by the original joint geometry is difficult for a laser square butt weldment. Additionally, the dilution of a laser weldment is not uniform, and this makes the estimation of average dilution from the joint geometry not satisfactory in practical application. Consequently, the dilution of the FZ is determined by quantitative WDS chemical analyses of the weldment in the experiment.
Fe and Si are major alloying elements in the BM. The IN82 filler wire is primarily comprised of Cr, Mn, Nb and Ni. There are three major elements in the FZ including Cr, Fe and Ni. The Cr and Ni contents of the nickel-based IN82 filler wire are 20.69 and 73.76 in at%, respectively. However, the steel BM is free of both. The BM contains 94.21 at% Fe, and the IN82 filler is only alloyed with 0.25 at% Fe. The dilution of the FZ in the laser weldment can be calculated from the WDS quantitative element mappings of Cr, Fe and Ni, as illustrated in Figure 2c,d,g. For example, the maximum Fe concentration is 94.21 at% in the BM. If the chemical composition of Fe at a location of the FZ is 60.0 at%, its dilution can be estimated by (60.0 at%/94.21 at%) × 100% = 63.69%. The dilution of a specific location in the FZ can also be derived from using concentrations of Cr or Ni in WDS quantitative element mappings (Figure 2c,g). For instance, the maximum Ni content is 73.76 at% in the IN82 filler wire. If the chemical composition of Ni at a location of the FZ is 30.0 at%, its dilution can be estimated by (1 − 30.0 at%/73.76 at%) × 100% = 59.33%.
Based on the experimental observation of the Cr mapping (Figure 2c), the maximum Cr concentration in the weldment is approximately 10 at%. Its concentration is not high enough to calculate the dilution of the FZ with good accuracy. Both Ni and Fe are suitable elements in the estimation of the FZ dilution in the weldment. Figure 3 shows the dilution of the FZ calculated according to Fe or Ni concentrations in quantitative WDS mappings. According to Figure 3, the dilution of any specific location in the FZ can be calculated from the concentrations of Fe or Ni in Figure 2d,g. Fe has the highest concentration among all other elements in the FZ, and the use of quantitative Fe mapping (Figure 2d) to estimate the dilution of the FZ is the most straightforward way.
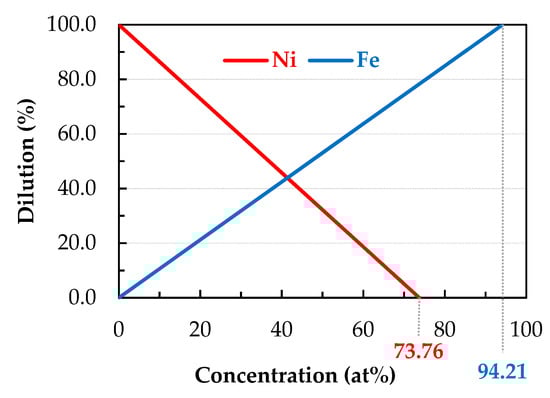
Figure 3.
The dilution of FZ calculated based on Fe and Ni concentrations in quantitative WDS mappings of Figure 2d,g.
According to Figure 2d and Figure 3, the dilution of the FZ ranges between 50% and 90%. Although the keyhole mode in laser welding promotes the convection of the FZ, its fast thermal cycle results in the rapid solidification of the FZ. The microstructure of the FZ is not homogeneous at a macroscopic scale. Figure 2k displays the EBSD boundary misorientation map of the FZ and BM. It is noted that boundary misorientations below 2° cannot be identified by the EBSD analysis, and they are represented by gray color in the figure [23]. The grain size of most ferrite in the BM is between 50 and 250 μm, and high-angle grain boundaries, i.e., misorientation >10°, are observed in BM ferrite [23]. There are few boundaries detected in the austenite of the FZ. However, the BCC structure in the FZ contains a huge amount of boundaries. Boundary misorientations in the BCC structure of the FZ contain wide ranges of low- and high-angle boundaries. Additionally, the number of boundaries in the BCC structure of the FZ is much more than those in the FZ austenite and BM ferrite. The BCC structure in the FZ is not ferrite, and needs further study in the future. The distribution of different structures in the FZ results in a significant change in microhardness at various locations of the FZ. It is expected that rolling properties of the weldment are strongly position-dependent in the FZ.
Figure 4a shows the EPMA SEI of the selected area in Figure 2a at higher magnification. There are a few hot cracks in the FZ next to the BM. Figure 4b displays the EBSD crystallographic map of Figure 4a. In Figure 4b, the red BCC phase on the right side of the figure is BM ferrite. The FZ consists of austenite (blue) and BCC structure (red). There are huge blocky and banded austenites and BCC structure at a macroscopic scale due to incomplete mixing in laser welding. Additionally, interdendritic austenite is widely observed next to the BCC structure at a microscopic scale. The formation of interdendritic austenite results from the final stage of solidification in the FZ. Figure 4c shows EBSD boundary misorientation at the identical location of Figure 4b. According to Figure 4b,c, hot cracks were initiated/propagated along interdendritic austenite as well as in the banded austenite free of boundaries. Boundaries, especially for high-angle ones, in the BCC structure prevent hot crack propagation in the FZ, as illustrated in Figure 4c.
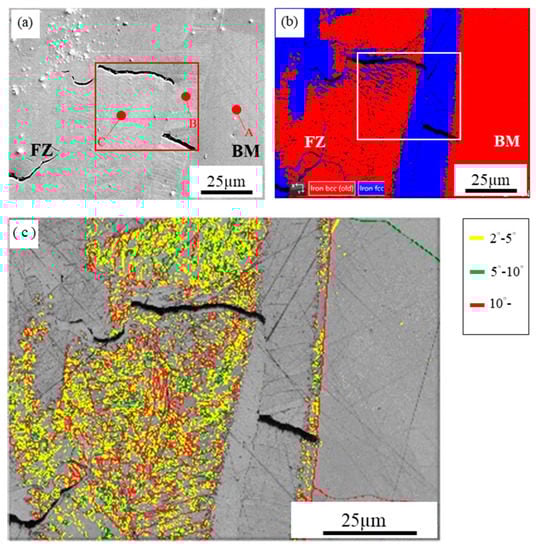
Figure 4.
Selected area in Figure 2a at higher magnification: (a) EPMA SEI, (b) EBSD crystallographic map, (c) EBSD boundary misorientation map.
Figure 5 displays EPMA SEI and WDS quantitative mappings of C, Cr, Fe, Mn, Nb, Ni, O and Si in at% of the selected area in Figure 4a. As the sample was polished by SiC papers and SiO2 suspensions, hot cracks are rich in C, O and Si, as demonstrated in Figure 5b,h,i. The other portion of the weldment is not contaminated by carbon and oxide. According to the quantitative element mappings of Figure 5b–i, the huge banded austenite is rich in Cr, Mn, Nb and Ni, and the BCC structure is rich in Fe and Si. It is consistent with the aforementioned result. The dilution of banded austenite is as low as 50%. In contrast, the dilution in the BCC structure in the FZ is between 60% and 90%. The formation of phase/structure in different positions of the FZ is strongly related to dilution.
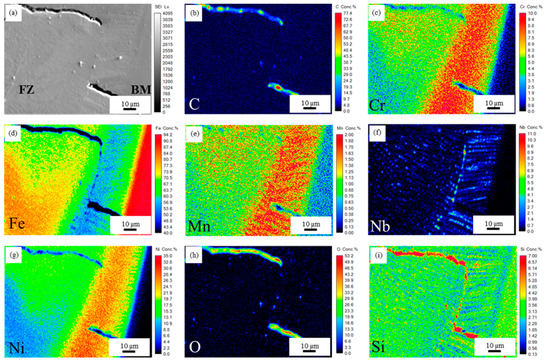
Figure 5.
Selected area in Figure 4a at higher magnification: (a) EPMA SEI, (b–i) WDS quantitative mappings of C, Cr, Fe, Mn, Nb, Ni, O and Si in at%.
3.2. Laser Weldment with 1.2 m/min IN82 Wire Feeding Rate
Figure 6a displays the EPMA SEI cross section of the macroscopic photo from the laser weldment with a 1.2 m/min IN82 wire feeding rate. Decreasing the wire feeding speed from 3.0 m/min to 1.2 m/min results in lower amounts of IN82 filler wire introduced into the FZ. Figure 6j shows the EBSD crystallographic map of Figure 6a. Most of the FZ is dominated by the BCC structure (red), and only a few percent austenite (blue) is left in the FZ. Figure 6b–i are WDS quantitative mappings of C, Cr, Fe, Mn, Nb, Ni, O and Si in at%, respectively. According to Figure 6d, the dilution of the FZ with a 1.2 m/min IN82 wire feeding rate is between 65% and 100%, and it is much higher than that with 3.0 m/min (50–90%).
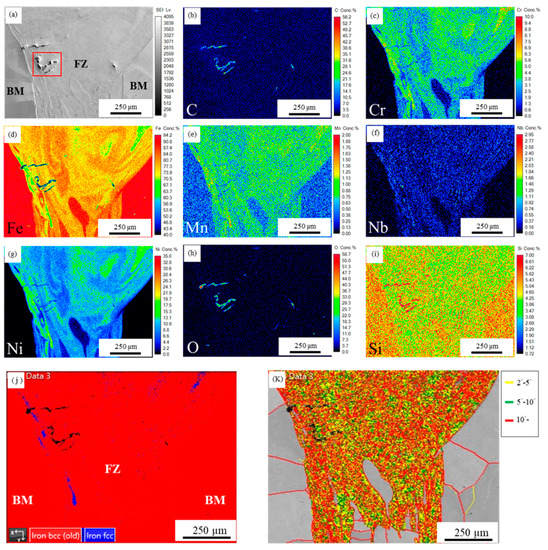
Figure 6.
The cross section of the laser weldment with 1.2 m/min IN82 wire feeding rate: (a) EPMA SEI, (b–i) WDS quantitative mappings of C, Cr, Fe, Mn, Nb, Ni, O and Si in at%, (j) EBSD crystallographic map, (k) EBSD boundary misorientation map.
The dilution of the FZ is strongly related to weld pool convection driven by the keyhole mechanism in laser welding, and it results in a strong mixing of FZ melt at a macroscopic scale. The total amount of IN82 filler wire introduced into the weld pool is decreased with the lower IN82 wire feeding rate, 1.2 m/min. For the specimen with a 3.0 m/min IN82 wire feeding rate, a portion of the filler melt is trapped on the top of the weld pool, and solidified into austenite alloyed with a high Ni content (Figure 2g). In contrast, when decreasing the IN82 wire feeding rate to 1.2 m/min, the dilution of the FZ is greatly increased, and the amount of austenite with a high Ni concentration is significantly decreased (Figure 6g,j). In Figure 6g, the BCC structure with the lower Ni concentration, approximately below 15 at%, dominates a large portion of the FZ. In contrast, the dilution is close to 100% (the area with 94.21 at% Fe and almost no Ni) in the lower portion of the FZ, as illustrated in Figure 6d,g.
Figure 6k displays the EBSD boundary misorientation map of the FZ. The grain size of ferrite in the BM is above 200 μm with high-angle grain boundaries. It is noted that there are a few ferrite grains with high-angle grain boundaries in the bottom portion of the FZ. The chemical composition of the ferrite in the bottom portion of the FZ is close to that of BM ferrite, and its dilution is close to 100%. There is a very limited dissolution of IN82 filler wire into the weld pool in the bottom portion of the FZ after laser welding due to insufficient time to complete the mixing between IN82 filler wire and the BM. Actually, the ferrite formation in the bottom of the FZ is attributed to resolidification of the BM. The density of low- and high-angle boundaries in the BCC structure of the FZ is much higher than those of austenite and ferrite in the FZ. The detailed microstructure of the BCC structure in the FZ is not identified in the experiment, and needs further study in the future.
Figure 7a shows the EPMA SEI of the selected area in Figure 6a at higher magnification. There are a few hot cracks in the figure. Figure 7b is the EBSD crystallographic map at the identical location of Figure 7a. The BCC structure dominates the entire region of the FZ. Figure 7c shows the EBSD boundary misorientation map at the same location of Figure 7a. The propagation of hot cracks is retarded by high-angle boundaries in the BCC structure.

Figure 7.
Selected area in Figure 6a at higher magnification: (a) EPMA SEI, (b) EBSD crystallographic map, (c) EBSD boundary misorientation map.
Figure 8 shows EPMA SEI and WDS quantitative mappings of C, Cr, Fe, Mn, Nb, Ni, O and Si in at%. Based on Figure 8d,g, the dilution exceeds 80% with Ni concentration below 15 at%. It is consistent with the aforementioned result, and the primary solidified phase is transformed into the BCC structure if the Ni concentration is below 15 at%. Additionally, the chemical composition of the BCC structure is not homogeneous at the microscopic scale. Fine cellular solidified BCC structure in the FZ is observed in Figure 7d,g,i. The primary cellular BCC structure is rich in Fe and Si (Figure 8d,i), and the segregation of Ni is observed next to the cellular BCC structure (Figure 8g).

Figure 8.
Selected area in Figure 6a at higher magnification: (a) EPMA SEI, (b–i) WDS quantitative mappings of C, Cr, Fe, Mn, Nb, Ni, O and Si in at%.
3.3. Dilution and Microstructural Evolution of FZ
Table 1 shows calculated dilutions and EPMA quantitative chemical analysis results in at% of selected locations. The quantitative WDS chemical analysis results shown in Table 1 are in at%. If the carbon concentration in the table is converted into wt%, the carbon concentration ranges between 0.2 and 0.5. The detection of carbon concentration in WDS quantitative chemical analysis is always a little higher than its true value due to a little contamination from the diffusion pump oil in EPMA. The accuracy of carbon concentration in WDS quantitative chemical analysis is approximately 0.2 wt%, and the carbon concentration shown in Table 1 is an acceptable value.

The 73.76 at% Ni in the IN 82 filler wire is all dissolved into the weld pool, and the FZ contains approximately below one-fourth Ni concentration of its original value. The Ni concentration exceeding 15 at% stabilizes austenite in the FZ, and contributes to the toughness of the FZ. Locations A–F in Table 1 are marked in Figure 4a and Figure 7a. The original nickel-based IN82 filler wire is alloyed with 20.69 Cr and 73.76 Ni in at%. According to Table 1, the dilution of the FZ ranges between 74% and 91%. For example, a FZ of 80% dilution means that 80% steel base metal free of Cr and Ni is dissolved into the FZ after laser welding. Therefore, concentrations of Cr and Ni in the fusion zone are significantly decreased into approximately 20% of their original values. The dilution can be calculated based on either Fe or Ni concentrations in the FZ. According to Table 1, the dilution estimated by Fe concentration is similar to that estimated by Ni concentration. Both provide a good approximation in evaluating the dilution of the FZ in laser welding for industrial application.
Spot sizes of WDS quantitative chemical analyses used in Figure 4a and Figure 7a are 5 and 1 μm, respectively. For the specimen with a wire feeding speed of 3.0 m/min in Figure 4a, location A is the steel BM. Location B is the banded austenite in the FZ, and it is alloyed with 16.2 at% Ni. In contrast, location C is the BCC structure in the FZ alloyed with 8.6 at% Ni. A lower Ni concentration results in the transformation of the primary solidified phase into the BCC structure. For the specimen with a wire feeding speed of 1.2 m/min in Figure 7a, high dilution results in lower Ni concentrations in location D–F, as shown in Table 1. It is worth mentioning that location D in Figure 7a is the cellular boundary with higher segregation concentrations of Ni and Si. It is consistent with element mappings displayed in Figure 8g,i.
There are many studies in laser welding steel strips [15,24,25]. Choi performed a disk laser line welding of an ultra-thin steel strip applied in an industrial cold-rolling mill [15]. Defect-free joints with adequate FZ profiles and good mechanical properties were successfully produced by using a single pass hybrid laser-arc welding of 25 mm thick square groove butt joints [24]. Microstructures and failure analyses of a DP980 laser welded plate were investigated [25]. However, the effect of element distribution in the FZ of the laser weldment is not well established. The dilution of the FZ calculated by the graphical method is an average value. It is far away from the real situation of the FZ. As there is a keyhole mechanism associated with laser welding, the weld pool convection in laser welding is not the same as that of traditional fusion processes.
The measured chemical composition of the FZ in laser welding is not a constant. The dissolution of the BM into the weld pool cannot form an ideal liquid solution with a uniformly distributed composition due to insufficient time period to complete the mixing. Consequently, there is no measured average chemical composition of the weld metal after laser welding. According to the experimental observation, the dilution of the laser weldment is not a constant in the FZ. The huge variation in the composition of the FZ at a macroscopic scale becomes a prerequisite in the explanation of many metallurgical phenomena, e.g., the solidification of weld metal, segregation along the boundary, hot cracking, etc., in laser welding. The proposed methodology combined with quantitative WDS mappings and EBSD crystallographic analyses shows the first attempt to quantify variable dilution of the FZ. It is a great improvement to identify mass transport of the FZ at a macroscopic scale with aid of the dilution measurement.
The FZ is composed of austenite and BCC structure. The Vickers microhardness of blocky/banded austenite is below 200 Hv. In contrast, the Vickers hardness of the BCC structure in the FZ is between 300 and 360 Hv. The microhardness of ferrite in the BM is between 200 and 250 Hv. It is noted that the hardness of the BCC structure in the FZ is much higher than that of austenite and ferrite. Average tensile strengths of the laser weldments with 1.2 and 3.0 m/min wire feeding rate are 484 ± 5 and 486 ± 9 MPa, respectively. Fracture of the BM is observed for all tensile specimens. The strength of the weldment is superior to the BM in the experiment.
4. Conclusions
Evaluations of the dilution and microstructure of the FZ in high-power disk laser welding a steel plate using the IN82 filler with two wire feeding speeds have been investigated. Important conclusions are summarized below:
- The microstructure of the FZ is not homogeneous at the macroscopic scale due to incomplete mixing of the weld pool during laser welding. The FZ is composed of austenite, ferrite and BCC structure depending on the dilution of the FZ.
- For the specimen with a 1.2 m/min wire feeding rate, a lower amount of Ni-based IN82 filler was introduced into the weld pool, and the dilution of the FZ is between 65% and 100%. The BCC structure with high density boundaries dominates the entire FZ. There are ferrite grains in the bottom portion of the FZ, and its dilution is close to 100%.
- For the specimen with a 3.0 m/min wire feeding rate, the dilution of the FZ ranges between 50% and 90%. Part of the filler melt is trapped on the top of the weld pool, and solidified into the stable austenite alloyed with a Ni concentration above 15 at%. There are huge blocky/banded austenite and BCC structure at a macroscopic scale due to incomplete mixing of the weld pool in laser welding. Additionally, interdendritic austenite is also observed next to the BCC structure at a microscopic scale formed in the final solidification stage of the FZ.
- There are hot cracks initiated/propagated along interdendritic austenite as well as in the blocky/banded austenite free of boundaries. Boundaries, especially for high-angle ones, in the BCC structure retard hot crack propagation in the FZ.
- The dilution of the FZ in the laser welded butt joint can be obtained by using the WDS quantitative chemical analyses of Fe or Ni concentrations. The methodology proposed in the study shows potential to obtain the dilution of any specific location in the FZ for industrial application in the future.
Author Contributions
Experiment, M.-F.C., T.-Y.L., P.-H.C., C.-H.C., K.-C.C.; formal analysis, M.-F.C.; writing—original draft preparation, R.-K.S.; writing—review and editing, A.-C.Y.; funding acquisition, R.-K.S. All authors have read and agreed to the published version of the manuscript.
Funding
This research was funded by the Ministry of Science and Technology, ROC (Contract No. MOST 109-2221-E-002-042-MY3).
Institutional Review Board Statement
Not applicable.
Informed Consent Statement
Not applicable.
Data Availability Statement
Not applicable.
Acknowledgments
Thanks to H.C. Lin, C.Y. Kao, C.S. Lin and Y.T. Lee of Instrumentation Center, National Taiwan University for EPMA and FEG-SEM experiments.
Conflicts of Interest
The authors declare no conflict of interest.
References
- Goncalves, J.L.; de Mello, J.D.B.; Costa, H.L. Wear in cold rolling milling rolls: A methodological approach. Wear 2019, 426, 1523–1535. [Google Scholar]
- He, H.; Liu, Y.; Yang, Q.; Wang, X.C.; Wang, S.; Wang, Q.N. Symmetry variable taper work roll technology for silicon steel profile control in hot strip mills. Ironmak. Steelmak. 2020, 47, 587–595. [Google Scholar] [CrossRef]
- Wang, R.; Bai, Z.H.; Du, J.C.; Wang, Y.X.; Cui, Y.Y.; Guo, Z.S.; Song, Z.F. Comprehensive tension setting optimisation technique for a cold rolled strip during continuous annealing. Ironmak. Steelmak. 2018, 45, 523–527. [Google Scholar] [CrossRef]
- Hao, K.D.; Gao, M.; Zhang, C.; Wu, R.; Zeng, X.Y. Achieving continuous cold rolling of martensitic stainless steel via online induction heat treatment. Mater. Sci. Eng. A 2019, 739, 415–426. [Google Scholar] [CrossRef]
- Orta, A.H.; Kayabasi, I.; Senol, M. Prediction of mechanical properties of cold rolled and continuous annealed steel grades via analytical model integrated neural networks. Ironmak. Steelmak. 2020, 47, 596–605. [Google Scholar] [CrossRef]
- Kozhevnikov, A.V.; Smirnov, A.S.; Kozhevnikova, I.A.; Antonov, P.V.; Zhilenko, S.V.; Aralov, A.I. Investigation of self-oscillations and the development of a procedure of stabilization of the process in a continuous mill for strip cold rolling. Metallurgist 2020, 64, 770–779. [Google Scholar] [CrossRef]
- Pawar, S.; Sahoo, S.; Mukhopadhyay, G. Failure analysis of weld joint of high strength quality steel sheets in cold rolling mill. Eng. Fail. Anal. 2019, 103, 392–399. [Google Scholar] [CrossRef]
- Hao, K.D.; Gao, M.; Zhang, C.; Wu, R.; Zeng, X.Y. Cold-rolling performance of non-equilibrium martensitic stainless steel produced by laser-arc hybrid welding. J. Mater. Process. Technol. 2019, 267, 359–365. [Google Scholar] [CrossRef]
- Gao, Q.Z.; Liu, Z.Y.; Li, H.J.; Zhang, H.L.; Jiang, C.C.; Hao, A.M.; Qu, F.; Lin, X.P. High-temperature oxidation behavior of modified 4Al alumina-forming austenitic steel: Effect of cold rolling. J. Mater. Sci. Technol. 2021, 68, 91–102. [Google Scholar] [CrossRef]
- Konovalov, S.; Osintsev, K.; Golubeva, A.; Smelov, V.; Ivanov, Y.; Chen, X.; Komissarova, I. Surface modification of Ti-based alloy by selective laser melting of Ni-based superalloy powder. J. Mater. Res. Technol. 2020, 9, 8796–8807. [Google Scholar] [CrossRef]
- Geng, Y.; Konovalov, S.V.; Chen, X. Research status and application of the high-entropy and traditional alloys fabricated via the laser cladding. Prog. Phys. Met. 2020, 21, 26–45. [Google Scholar] [CrossRef]
- Viňáš, J.; Brezinová, J.; Brezina, J.; Maruschak, P.O. Structural and mechanical features of laser-welded joints of zinc-coated advanced steel sheets. Mater. Sci. 2019, 55, 46–51. [Google Scholar] [CrossRef]
- Raghawendra, P.S.S.; Gáspár, M. Investigation of metallurgical and mechanical properties of laser beam welded and post-weld heat treated DP1400 steel. J. Mater. Eng. Perform. 2021, 30, 1703–1710. [Google Scholar]
- Viňáš, J.; Brezinová, J.; Sailer, H.; Brezina, J.; Sahul, M.; Maruschak, P.; Prentkovskis, O. Properties evaluation of the welded joints made by disk laser. Materials 2021, 14, 2002. [Google Scholar] [CrossRef] [PubMed]
- Choi, J. Characterization of a Yb:YAG disk laser line welder for ultra-thin steel strip in industrial cold-rolling mill. Lasers Eng. 2019, 42, 15–29. [Google Scholar]
- Indimath, S.S.; Shunmugasundaram, R.; Balamurugan, S.; Dutta, M.; Gudimetla, S.K.; Kant, K. Online ultrasonic technique for assessment of mash seam welds of thin steel sheets in a continuous galvanizing line. Int. J. Adv. Manuf. Technol. 2017, 91, 3481–3491. [Google Scholar] [CrossRef]
- Lippold, J.C. Welding Metallurgy and Weldability; John Wiley & Sons: New York, NY, USA, 2015. [Google Scholar]
- Kou, S. Welding Metallurgy, 2nd ed.; John Wiley & Sons: New York, NY, USA, 2003. [Google Scholar]
- Lee, S.H. A hot cracking on dissimilar metal weld between a106Gr.B and A312 TP316L with buttering ERNiCr-3. Metals 2019, 9, 533. [Google Scholar] [CrossRef]
- Wu, W.; Tsai, C.H. Hot cracking susceptibility of fillers 52 and 82 in alloy 690 welding. Met. Mater. Trans. A 1999, 30, 417–426. [Google Scholar] [CrossRef]
- Toth, T.; Krasnorutskyi, S.; Henselm, J.; Dilger, K. Electron beam welding of 2205 duplex stainless steel using pre-placed nickel-based filler material. Int. J. Press. Vessel. Pip. 2021, 191, 104354. [Google Scholar]
- Massalski, T.B. Binary Alloy Phase Diagrams, 2nd ed.; ASM International: Materials Park, OH, USA, 1992. [Google Scholar]
- Cheng, T.C.; Yu, C.; Yang, T.C.; Huang, C.Y.; Lin, H.C.; Shiue, R.K. Microstructure and impact toughness of offshore steel. Arch. Met. Mater. 2018, 63, 167–172. [Google Scholar]
- Wahba, M.; Mizutani, M.; Katayama, S. Single pass hybrid laser-arc welding of 25 mm thick square groove butt joints. Mater. Des. 2016, 97, 1–6. [Google Scholar] [CrossRef]
- Bandyopadhyay, K.; Panda, S.K.; Saha, P.; Baltazar-Hernandez, V.H.; Zhou, Y.N. Microstructures and failure analyses of DP980 laser welded blanks in formability context. Mater. Sci. Eng. A 2016, 652, 250–263. [Google Scholar] [CrossRef]


Publisher’s Note: MDPI stays neutral with regard to jurisdictional claims in published maps and institutional affiliations. |
© 2021 by the authors. Licensee MDPI, Basel, Switzerland. This article is an open access article distributed under the terms and conditions of the Creative Commons Attribution (CC BY) license (https://creativecommons.org/licenses/by/4.0/).