Article

Influence of Direct Energy Deposition Parameters on Ti–6Al–4V Component’s Structure-Property Homogeneity

1
Titanium Department, Advanced Metals Division, Korea Institute of Materials Science, Changwon 51508, Korea
2
Department of Materials Science and Engineering, Pusan National University, Busan 46241, Korea
3
School of Materials Science and Engineering, Gyeongsang National University, Jinju 52828, Korea
*
Authors to whom correspondence should be addressed.
These authors contributed equally to this paper.
Metals 2021, 11(6), 887; https://doi.org/10.3390/met11060887
Submission received: 26 April 2021 / Revised: 12 May 2021 / Accepted: 26 May 2021 / Published: 28 May 2021

Abstract

:
Ti–6Al–4V alloy is a typical 3D printing metal, and its application has been expanded to various fields owing to its excellent characteristics such as high specific strength, high corrosion resistance, and biocompatibility. In particular, direct energy deposition (DED) has been actively explored in the fields of deposition and the repair of large titanium parts. However, owing to the complicated thermal history of the DED process, the microstructures of the fusion zone (FZ), heat-affected zone (HAZ), and base metal (BM) are different, which results in variations of their mechanical characteristics. Therefore, the process reliability needs to be optimized. In this study, the microstructure and hardness of each region were investigated with respect to various DED process parameters. An artificial neural network (ANN) model was used to correlate the measured characteristics of the FZ, HAZ, and BM of Ti–6Al–4V components with the process parameters. The variation in the mechanical characteristics between the FZ, HAZ, and BM was minimized through post-heat treatment. Heat treatment carried out at 950 °C for 1 h revealed that the microstructure and hardness values throughout the component were homogeneous.

1. Introduction

Titanium alloys, in particular, Ti–6Al–4V alloy, are widely used in the energy plant, aerospace, defense, and biomedical industries owing to their high specific strength and corrosion resistance [1]. As the immediate and widespread application in these industries requires complex-shaped alloy products, the conventional manufacturing process leads to high material wastage and processing costs. Furthermore, complex component repair with a near-net part is challenging for designers. An expensive partial replacement can be avoided if minor component damage is repaired. Thus, a progressive manufacturing process that can overcome the limitations of conventional manufacturing processes is needed.
Recently, there has been an increasing demand for the additive manufacturing (AM) process because of its potential to produce near-net-shape components with reduced cost and time [2,3]. In particular, the direct energy deposition (DED) technique has received attention for the fabrication and repair of larger Ti–6Al–4V parts. Compared with the powder bed fusion AM processes, the DED process has a higher deposition rate and relatively flexible work environment [4,5,6,7,8]. It is important to note that successful component fabrication/repair requires clear knowledge of the process parameters so that the product is manufactured with the required properties. The disproportionate selection of processing conditions will lead to severe defects in the product and its subsequent failure.
Several studies have investigated the effect of process parameters on the microstructure of DED-processed Ti–6Al–4V parts [1,9,10,11,12,13]. Kistler et al. [14] reported the effect of processing conditions, such as substrate thickness, interlayer dwell time, temperature, hatch pattern, and number of layers, on the microstructure, porosity, and hardness of the deposition region. Carrozza et al. [13] investigated the effect of laser power, powder feed rate, and scanning speed on the grain size and mechanical properties of DED parts. Although the influence of processing conditions on the deposited material has been studied, changes in the base plate microstructure and mechanical properties require further attention. The process parameters have been reported, especially the power and scan speed, to significantly alter the microstructure of the fabricated component. In general, at constant power, the higher scan speed leads to the formation of martensite (α’), whereas the lower scan speed tends to form the α laths; this is attributed due to the cooling rate. The slow cooling rate upon lower scan speed gives higher reheating time to overlaying layers which can decompose the α’ phase and forms the α [8,15]. In particular, in the case of component repair, the higher power input during the DED process can significantly alter the base material microstructure [16]. Thus, the structure and property homogeneity should be ensured throughout the repaired component.
Recently, Scherillo et al. [17] reported welds with microstructures and hardness values similar to those of the base material. These welds were produced using linear fraction welding of EBM-processed Ti–6Al–4V components. In this regard, the powder-based DED process has the potential for component repair applications and, thus, requires significant attention. To address this gap, the present study focuses on a systematic investigation of the influence of power and scan speed on changes in the base plate as well as Ti–6Al–4V deposits. A backpropagation neural network model was utilized to correlate the characteristics of Ti–6Al–4V alloy components (e.g., microstructure and geometry) with the DED process parameters. In addition, to enhance the homogeneity of the Ti–6Al–4V alloy components after repair, post-heat treatment was performed.

2. Materials and Methods

A spherical Ti–6Al–4V alloy powder with size in the range of 45–150 μm (KOS wire, Busan, Korea) was used to fabricate five unidirectional tracks using a three-dimensional (3D) printer (InssTek, Daejeon, Korea). A wrought Ti–6Al–4V alloy with an equiaxed microstructure was used as the base plate. A total of 25 samples were deposited at a laser power varied from 200 to 600 W and a scan speed varied from 0.3 to 1.5 m/min. The width of the fusion zone (FZ), width of the heat-affected zone (HAZ), height of the deposited material, and average columnar grain width were measured with the help of optical microscopy images. The hardness values of the components in the FZ, HAZ, and deposition region were measured using a Vickers hardness machine (Mitutoyo, Kanagawa, Japan) with the load of 0.5 kgf. The post-heat treatment was carried out at the α + β phase field at two different temperatures to attain uniformity of the components. Firstly, we applied the conventional stress relief heat treatment at 550 °C; however, the resultant microstructure was quite similar to the as-fabricated condition. Upon heat treatment at several high temperature regions, we found that heat treatment 950 °C was able to provide quite a uniform microstructure throughout the fabricated sample. For the electron backscatter diffraction (EBSD) analysis, the samples were electropolished using a solution of 95% methyl alcohol and 5% perchloric acid at 30 V and −30 °C. The microstructural changes and phase fractions in the as-deposited and post-heat-treated samples were investigated using the field emission scanning electron microscope (FESEM)—EBSD analysis (JEOL, Tokyo, Japan) with a step size of 0.3 µm.

3. Artificial Neural Network

An artificial neural network (ANN) model consists of input, output, and hidden layers. The number of units in the input and output layers is usually determined by the number of independent and dependent variables, respectively. In addition, the number of hidden layers and neurons required for the model are determined by model training. Briefly, the ANN model training involves weight adjustment to minimize errors in the model predictions. The weights are adjusted by optimizing the model hyperparameters, such as hidden layers, neurons, and iterations. A detailed description of the ANN model used in this study has been reported in the authors’ previous study [18,19]. Accordingly, in the present study, an ANN model was developed to correlate power and scan speed (inputs) with various parameters, such as length and height of the FZ, HAZ, grain size, and build height, (outputs) of the manufactured Ti–6Al–4V components.

4. Results and Discussions

4.1. Design of Experiments

A total of 25 samples were obtained after the deposition of five-layer tracks of Ti–6Al–4V at various powers and scan speeds. Figure 1 shows the melt pool geometry, deposit height, and columnar size of the samples measured. The results are summarized in Table 1. The total data were utilized to develop an ANN model to predict the influence of power and scan speed on the melt pool and deposit geometries and the corresponding grain size. In terms of melt pool and deposit geometries, it can be observed that a high scan speed and a low power result in a smaller size, whereas a low scan speed and a high power significantly increase the geometries of the deposit and melt pool. Overall, at a constant power, an increase in the scan speed decreases the deposit height. Similarly, at a constant scan speed, an increase in the power enhances both the melt pool and deposit geometries. For a better understanding of the effect of the scan speed and power on the melt pool geometry, deposit geometry, and columnar grain size, an ANN model was developed and implemented to estimate the relationship between the input and output variables more accurately. These findings promote a better understanding of the influence of process parameters on the resultant physical and mechanical properties of the deposits.

4.2. Model Training and Performance

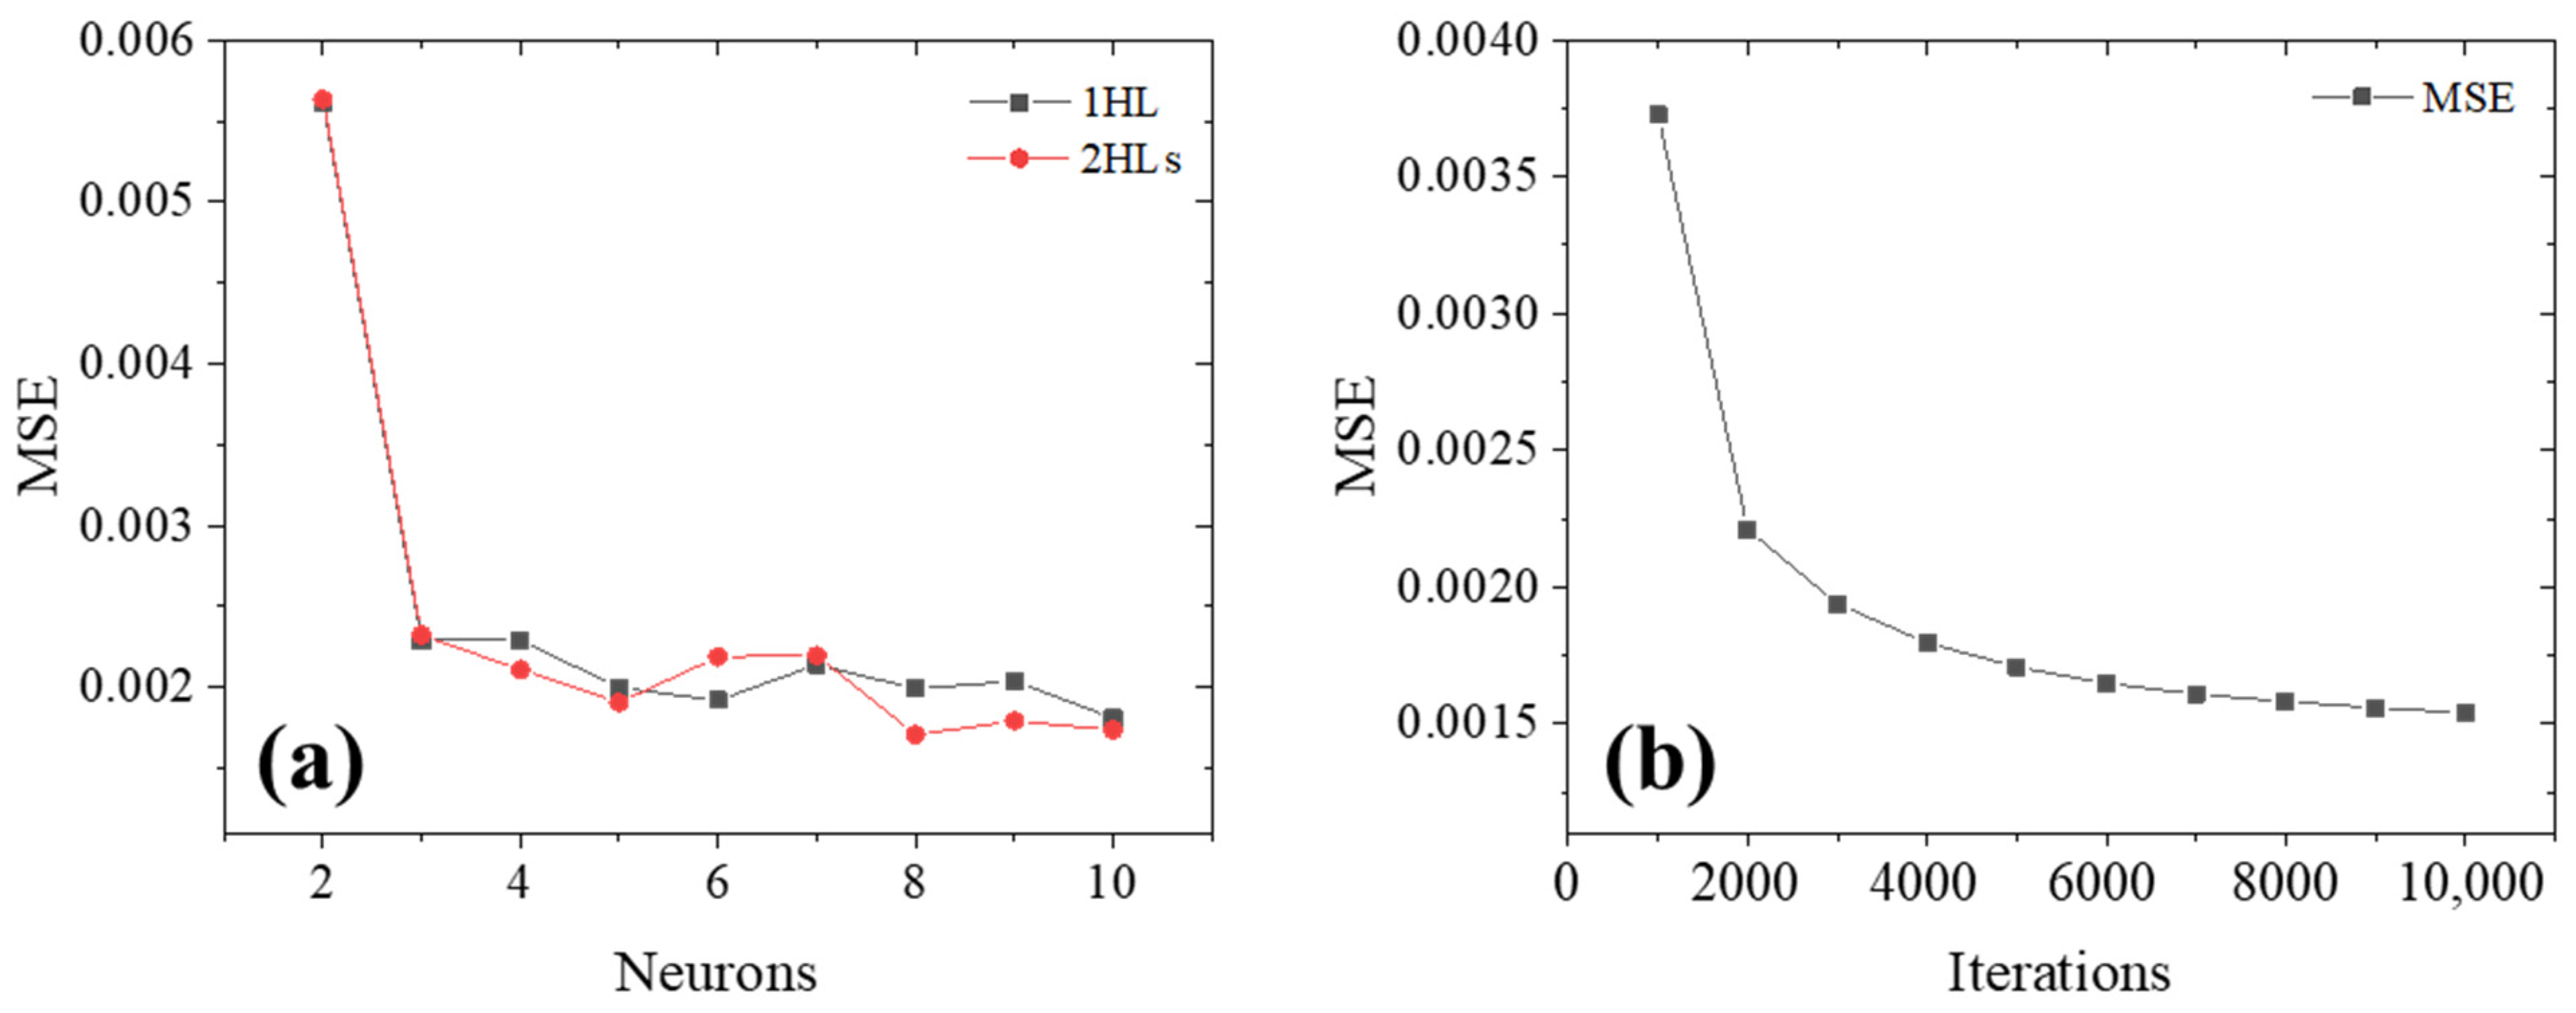
4.2.1. Model Training

Initially, the ANN model was trained by varying the number of hidden layers (one and two) and hidden neurons (varied from two to ten). To choose the optimum hidden layer(s), the mean squared error (MSE) variation between the models with a single and two hidden layers was studied. The respective plot is illustrated in Figure 2a.
M S E = 1 p   p i ( T i O i ) 2
where p is the data point, the (TiOi)2 squares of the error. The model with a single hidden layer yielded higher error values than that with two hidden layers. In particular, the two hidden layers consisting of eight hidden neurons in each layer showed a minimal MSE value of 0.0017. Therefore, the optimum model architecture was selected as 2–8–8. Similarly, the number of iterations was varied from 1000 to 10,000. The obtained variation in the MSE value is depicted in Figure 2b. The error in the predictions gradually decreased with the number of iterations. Finally, the model with 10,000 iterations showed a minimum error of ~0.0015. During the model training, other model parameters were constant. For example, the learning rate and the momentum term values were 0.4 and 0.6, respectively.

4.2.2. Model Performance

Figure 3 illustrates the correlation plots of various deposit characteristics of the DED-processed Ti–6Al–4V components. Owing to the high accuracy of the predictions (Figure 2), the model successfully correlated the complex interactions between the process parameters and the component characteristics. The average error and the corresponding correlation coefficient values (Adj. R2) of the length and width of the FZ, HAZ, build height, and grain size are listed in Table 2.

4.3. Effect of Power and Scan Speed: Estimated Using ANN

The ANN-estimated effect of power on the geometry of the FZ (Figure 4a,b), HAZ (Figure 4c,d), average width of the columnar grain (Figure 4e), and deposit height (Figure 4f) are depicted in Figure 4. For a constant scan speed value, an increase in the power steadily increases the geometries of the FZ, HAZ, and deposit, as well as the columnar grain size. In particular, the effect was more significant for the combinations of a low scan speed (0.3 m/min) and a high power (500–600 W). In the case of the columnar grain size, a high scan speed (0.9 to 1.2 m/min) showed a slight increment (from ~40–100 μm) with the laser power. However, for low scan speeds (<0.6 m/min), increasing the power from 200 W to 600 W notably increased the grain size from 200 to 320 μm, as illustrated in Figure 4e. The high energy density due to an increase in the power tends to melt the base plate wider and deeper, which can further influence the size of the columnar grains. In addition, the height of the deposit tends to increase with the power. This can be explained by the overheating of the previous layer, resulting in the expansion of the deposited material. Furthermore, the high power is associated with the melting efficiency of the powder, producing the high deposit. Therefore, the height of the deposit increases with the energy density, which is directly related to the laser power. A similar behavior was observed in the previous studies [20,21].
The predicted influence of the scan speed on the geometries of the FZ, HAZ, and deposit as well as the columnar grain size is shown in Figure 5. For a constant power value, an increase in the scan speed continuously decreases the length and width of the FZ (Figure 5a,b) and HAZ (Figure 5c,d) as well as the height of the deposition region (Figure 5f). Figure 5e shows the influence of the scan speed on the grain size at various powers. For a particular power value, an increase in the scan speed significantly minimizes the size of the columnar grains. The sample fabricated at the maximum power (600 W) and a low scan speed (0.3 m/min) exhibits a coarse-columnar grain with an average size of ~300 μm. With increasing the scan speed to the maximum of 1.5 m/min, the size of the columnar grains decreases to ~90 μm within the same sample. As the laser scanning speed is increased, the melt pool geometries (length and width of the FZ and HAZ) of the sample decrease. Among all the samples, the sample fabricated at a low power (200 W) and a high scan speed (1.5 m/min) exhibits the minimum height of the deposit. This is mainly because a high scan speed leads to a decrease in the laser–metal interaction time, energy input, and amount of powder deposition per unit area, which results in a lower deposit height [22]. Moreover, at higher scan speeds, the deposit height tends to increase with the power.
Figure 6a–c show the variation in the hardness (HV) of the deposit as a function of the power and scan speed. From Figure 6a, it is clear that increasing power does not vary the hardness significantly. Overall, as the power range varies from 200 to 600 W, the hardness value varies only by ~ 9 HV. On the other hand, the effect of scan speed on the hardness exhibits a linear relation. With increasing scan speed from 0.3 to 1.5 m/min, the hardness significantly increases from ~ 373 to 402 HV, as illustrated in Figure 6b. The overall power and scan speed effect on the hardness value is plotted in Figure 6c. It can be seen that the overall hardness values vary from 372 HV to 406 HV.
From the observed microstructure and the deposition height, the plot can be categorized into two different regions: one with a lower scan speed (region-1) and another with a higher scan speed (region-2), as shown in Figure 6c. Irrespective of the laser power, when the sample was deposited at a lower scan speed (region-1), the deposit height of the deposited materials was higher (Figure 6d), and the microstructure of Ti–6Al–4V changed to thick α plates (as shown in Figure 6d1). In addition, a higher scan speed (region-2) resulted in a lower deposit height (Figure 6f) and a microstructure dominated by the martensite (α’) phase, as illustrated in Figure 6f1.
In general, the higher energy input (owing to the lower scan speed) and the higher laser–metal interaction time overheat the deposited material and result in its expansion. In addition, the needle-shaped martensite phase heats and transforms into thick α plates because of the slower cooling rate. In contrast, because of the shorter laser–metal interaction time, a higher scan speed notably decreases the component height and increases the cooling rate of the deposited material, resulting in the formation of α’. Thus, the optimum condition for the component fabrication was selected as a power of 400 W and a scan speed of 0.9 m/min, considering the quality of the deposition with acceptable hardness value. The deposit height and respective microstructure (α’) of the sample fabricated with the optimum conditions are depicted in Figure 6e,e1. At this power and speed, the hardness values were optimum, and the deposit height was reasonable.

4.4. Microstructure and Property Variations in the Components

This section discusses variations in the microstructure and properties of the DED-processed components with respect to various locations. As shown in Figure 7, the hardness values of the samples were measured perpendicular to the deposition direction (indicated in Figure 7a). The variation in the hardness with respect to the distance from the center of the deposition is plotted in Figure 7b. As expected, with the martensite α’ structure, the hardness value was high in the FZ region and gradually decreased when moving away from the FZ towards the base plate (equiaxed microstructure). It is important to mention that such components (with nonuniform structure and properties) are not favorable from the application point of view, especially in the case of repaired parts.
The variations in the microstructure and phase fraction of the as-fabricated component were examined in various regions by the EBSD analysis. The inverse pole figure (IPF) maps taken from various locations of the as-fabricated component are shown in Figure 8a–c. The deposition region of the Ti–6Al–4V alloy consists of a columnar grain with the acicular martensite α’ structure [23,24], as illustrated in Figure 8a. The HAZ (Figure 8b) and the base plate region (Figure 8c) have equiaxed α grains. In particular, the HAZ is dominated by a mixture of the α phase morphology with equiaxed α (present in the base plate) and the recrystallized fine-scale α (see Figure 8b). In addition, the phase volume fractions present in various regions of the component were identified using the phase maps (Figure 8d–f).

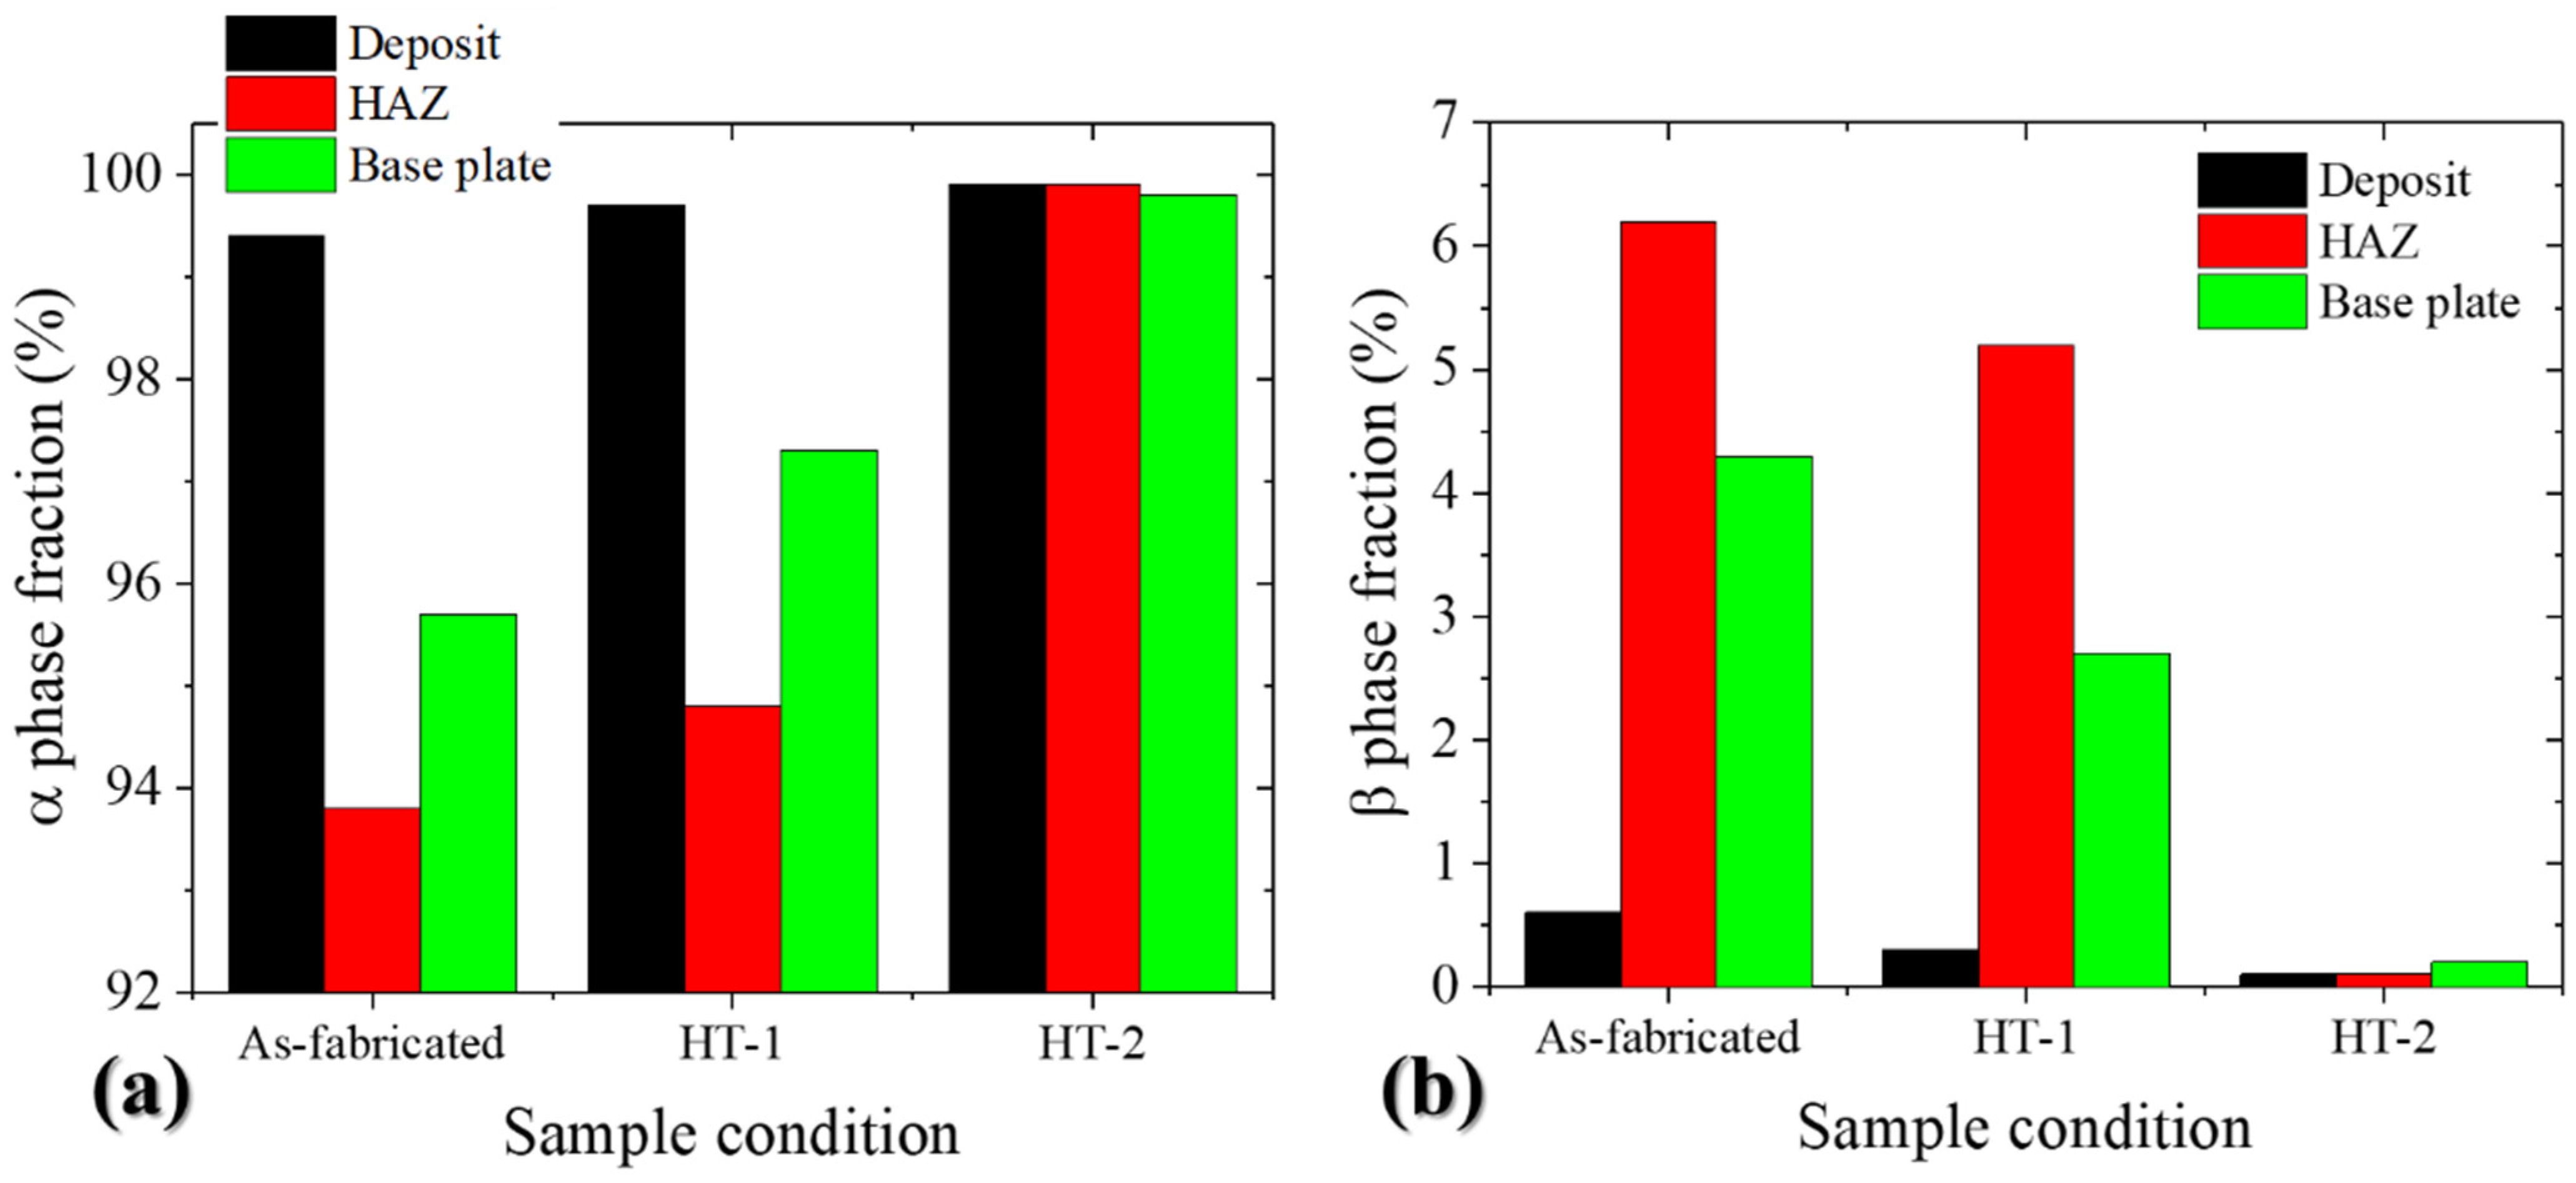
4.5. Effect of Post-Heat Treatment

Thus, to attain microstructural and hardness homogeneity throughout the component, we used post-heat treatment at two different temperatures (HT #1 at 550 °C and HT #2 at 950 °C) below the beta transus temperature for 1 h followed by air cooling to room temperature. The effects of heat treatment on the microstructure, phase fraction, and hardness were systematically investigated. The component microstructure variation after HT #1 is illustrated in Figure 9a–c (IPF) and Figure 10a–c (phase maps). The microstructure of the component after HT #1 in various regions is similar to that of the as-fabricated component. However, the component after HT #1 shows a significantly lower volume fraction (~2%) of the β phase in all regions, as compared with the as-fabricated one (Figure 10a–c).
Upon HT #2, the microstructure of the base material and the HAZ were notably changed, as compared with those under the as-fabricated and HT #1 conditions. The microstructure of the deposit was transformed into thick irregular α plates (Figure 9d). In particular, the equiaxed α grains present in the base material and the HAZ changed to a coarse bimodal morphology (with a nearly equiaxed primary α and lamellar structure [24,25]), as illustrated in Figure 9e,f. Regarding the phase fractions, unlike the as-fabricated component and the component after HT #1, the component after HT #2 had ~100% of the α fraction in the deposition region, HAZ, and base material (Figure 10d–f). The β phase present in the as-fabricated sample can be completely transformed to the α phase (β → α) during HT #2; thus, the sample contained a very small fraction of β (<0.2%).
The quantified values of the α and β phase fractions of various samples are plotted in Figure 11a,b, respectively. The hierarchy of the regions in terms of the β fraction is HAZ > base plate > deposition. This can be understood by the heating and solidification behavior of the Ti–6Al–4V alloy during the DED process. Starting from the deposition region where the alloy melts and solidifies rapidly during printing, the resultant microstructure is martensite. In contrast, the HAZ and the base metal are heated during printing, and the heating temperature of the HAZ is significantly higher than that of the base material. Thus, the fraction of β is higher in the HAZ than in the base material.
Moreover, the hardness values for the regions (base material, HAZ, and deposit) were measured and illustrated in Figure 12. The as-fabricated sample, starting from the base material with an equiaxed α structure, the hardness value gradually increased along the building direction (base material < HAZ < FZ < deposited material) and attained a maximum value of ~ 392 HV in the deposition region. Considering the notable variation in the microstructure and hardness of the as-fabricated component, such components certainly alter the performance of the entire part (anisotropic nature). Therefore, it is important to achieve a nearly homogeneous microstructure and properties throughout the fabricated components. The hardness variation in the component after HT #1 condition shown in Figure 12b. It can be noticed that the values are nonuniform. Finally, the hardness values at various locations of the component after HT #2 are plotted in Figure 12c. In contrast to the other two samples (as-fabricated and HT #1), the hardness value of the HT #2 component does not vary with the location and shows a constant value of ~350 ± 10 HV, as depicted in Figure 12c. Therefore, on the basis of the microstructure and hardness results, HT #2 is beneficial for fabricating DED-processed components with homogeneous microstructure and mechanical properties, which further helps to handle anisotropic regions in the repaired parts.

5. Conclusions

In this study, the homogeneity of the Ti–6Al–4V alloy components fabricated by DED was evaluated. Furthermore, the influence of the process variables on the microstructure and hardness was studied. The conclusions are as follows.
  • For the constant scan speed, an increase in the laser power tends to increase the melt pool geometry, grain size, and deposit height of the components. In contrast, for the constant power, an increase in the scan speed tends to decrease these parameters of the components.
  • The ANN model successfully correlated the relationship between the process parameters (power and scan speed) and the geometries of the melt pool and deposit as well as the grain size.
  • The hardness was measured along the scanning direction. Starting from the base metal, the hardness gradually increased up to the FZ and again decreased when moving away from the FZ.
  • The microstructural features of the as-fabricated component varied significantly from the base plate (equiaxed) to the deposition region (martensite); thus, the hardness value was notably varied for each region.
  • Post-heat treatment at a lower temperature (HT #1 ~ 550 °C) did not alter the microstructure of the components. However, the heat treatment (HT #2) at 950 °C resulted in a homogeneous microstructure with irregular α plates, which resulted in a uniform hardness value throughout the base plate and deposition regions.

Author Contributions

Conceptualization, J.H.K., N.K. and J.-K.H.; methodology, S.-W.C., and C.H.L.; software, N.S.R.; validation, P.L.N., J.H.K. and C.H.L.; formal analysis, J.H.K.; investigation, C.H.L.; resources, J.-K.H.; data curation, C.H.L., and P.L.N.; writing—original draft preparation, C.H.L.; writing—review and editing, J.H.K., N.K.; visualization, J.-K.H.; supervision, J.H.K., N.K., and J.-K.H.; project administration, J.-K.H., J.H.K.; funding acquisition, J.-K.H. All authors have read and agreed to the published version of the manuscript.

Funding

This work was supported by the Ministry of Trade, Industry, and Energy, grant numbers 20013095 and 20013202, and the Fundamental Research Program of the Korea Institute of Materials Science, grant number PNK7520.

Institutional Review Board Statement

Not applicable.

Informed Consent Statement

Not applicable.

Data Availability Statement

The data presented in this study are available on request from the corresponding author.

Conflicts of Interest

The authors declare no conflict of interest.

References

  1. Liu, S.; Shin, Y.C. Additive manufacturing of Ti6Al4V alloy: A review. Mater. Des. 2019, 164, 107552. [Google Scholar] [CrossRef]
  2. Hedges, M.; Calder, N. Near net shape rapid manufacture & repair by LENS. In Proceedings of the Cost Effective Manufacturing via Net-Shape Processing, Meeting Proceedings RTO-MP-AVT-139, Paper, Neuilly-sur-Siene, France, 15 May 2006. [Google Scholar]
  3. Nursyifaulkhair, D.; Park, N.; Baek, E.R.; Lee, J.-B. Effect of Process Parameters on the Formation of Lack of Fusion in Directed Energy Deposition of Ti-6Al-4V Alloy. J. Weld. Join. 2019, 37, 579–584. [Google Scholar] [CrossRef] [Green Version]
  4. Najmon, J.C.; Raeisi, S.; Tovar, A. Review of additive manufacturing technologies and applications in the aerospace industry. Addit. Manuf. Aerosp. Ind. 2019, 7–31. [Google Scholar] [CrossRef]
  5. Mudge, R.P.; Wald, N.R. Laser engineered net shaping advances additive manufacturing and repair. Weld. J. N. Y. 2007, 86, 44. [Google Scholar]
  6. Portolés, L.; Jordá, O.; Jordá, L.; Uriondo, A.; Esperon-Miguez, M.; Perinpanayagam, S. A qualification procedure to manufacture and repair aerospace parts with electron beam melting. J. Manuf. Syst. 2016, 41, 65–75. [Google Scholar] [CrossRef]
  7. Kim, C.Y.; Kim, J.S.; Lee, H.; Park, M.K.; Kim, S.W.; Shin, S.S.; Hwang, J.H.; Kim, H.D. Effect of Laser Power Feedback Control on Mechanical Properties of Stainless Steel Part Built by Direct Energy Deposition. Korean Weld. Join. Soc. 2020, 38, 197–202. [Google Scholar] [CrossRef] [Green Version]
  8. Byun, Y.; Lee, S.; Seo, S.M.; Yeom, J.T.; Kim, S.E.; Kang, N.H.; Hong, J.K. Effects of Cr and Fe Addition on Microstructure and Tensile Properties of Ti–6Al–4V Prepared by Direct Energy Deposition. Met. Mater. Int. 2018, 24, 1213–1220. [Google Scholar] [CrossRef]
  9. Wu, X.; Liang, J.; Mei, J.; Mitchell, C.; Goodwin, P.; Voice, W. Microstructures of laser-deposited Ti–6Al–4V. Mater. Des. 2004, 25, 137–144. [Google Scholar] [CrossRef]
  10. Qiu, C.; Ravi, G.; Dance, C.; Ranson, A.; Dilworth, S.; Attallah, M.M. Fabrication of large Ti–6Al–4V structures by direct laser deposition. J. Alloys Compd. 2015, 629, 351–361. [Google Scholar] [CrossRef]
  11. Wolff, S.; Lee, T.; Faierson, E.; Ehmann, K.; Cao, J. Anisotropic properties of directed energy deposition (DED)-processed Ti–6Al–4V. J. Manuf. Process. 2016, 24, 397–405. [Google Scholar] [CrossRef] [Green Version]
  12. Sterling, A.J.; Torries, B.; Shamsaei, N.; Thompson, S.M.; Seely, D.W. Fatigue behavior and failure mechanisms of direct laser deposited Ti–6Al–4V. Mater. Sci. Eng. A 2016, 655, 100–112. [Google Scholar] [CrossRef]
  13. Carrozza, A.; Mazzucato, F.; Aversa, A.; Lombardi, M.; Bondioli, F.; Biamino, S.; Valente, A.; Fino, P. Single Scans of Ti-6Al-4V by Directed Energy Deposition: A Cost and Time Effective Methodology to Assess the Proper Process Window. Met. Mater. Int. 2021, 1–13. [Google Scholar] [CrossRef]
  14. Kistler, N.A.; Corbin, D.J.; Nassar, A.R.; Reutzel, E.W.; Beese, A.M. Effect of processing conditions on the microstructure, porosity, and mechanical properties of Ti-6Al-4V repair fabricated by directed energy deposition. J. Mater. Process. Technol. 2019, 264, 172–181. [Google Scholar] [CrossRef]
  15. Motyka, M. Martensite Formation and Decomposition during Traditional and AM Processing of Two-Phase Titanium Alloys-An Overview. Metals 2021, 11, 481. [Google Scholar] [CrossRef]
  16. Shrestha, S.; Panakarajupally, R.P.; Kannan, M.; Morscher, G.; Gyekenyesi, A.L.; Scott-Emuakpor, O.E. Analysis of microstructure and mechanical properties of additive repaired Ti–6Al–4V by Direct Energy Deposition. Mater. Sci. Eng. A 2021, 806, 140604. [Google Scholar] [CrossRef]
  17. Scherillo, F.; Astarita, A.; Carrino, L.; Pirozzi, C.; Prisco, U.; Squillace, A. Linear friction welding of Ti-6Al-4V parts produced by electron beam melting. Mater. Manuf. Processes 2019, 34, 201–207. [Google Scholar] [CrossRef]
  18. Anderson, D.; McNeill, G. Artificial neural networks technology. Kaman Sci. Corp. 1992, 258, 1–83. [Google Scholar]
  19. Reddy, N.; Krishnaiah, J.; Hong, S.-G.; Lee, J.S. Modeling medium carbon steels by using artificial neural networks. Mater. Sci. Eng. A 2009, 508, 93–105. [Google Scholar] [CrossRef]
  20. Akinlabi, E.T.; Akinlabi, S.A. Advanced coating: Laser metal deposition of aluminium powder on titanium substrate. In Proceedings of the World Congress on Engineering, London, UK, 29 June–1 July 2016. [Google Scholar]
  21. Sobiyi, K.; Akinlabi, E.; Akinlabi, S. The Influence of scanning speed on the laser metal deposition of Ti/Tic powders. Mater. Technol. 2017, 2, 345–351. [Google Scholar] [CrossRef]
  22. Kobryn, P.; Moore, E.; Semiatin, S. The effect of laser power and traverse speed on microstructure, porosity, and build height in laser-deposited Ti-6Al-4V. Scr. Mater. 2000, 43, 299–305. [Google Scholar] [CrossRef]
  23. Narayana, P.; Lee, S.; Choi, S.-W.; Li, C.-L.; Park, C.H.; Yeom, J.-T.; Reddy, N.; Hong, J.-K. Microstructural response of β-stabilized Ti–6Al–4V manufactured by direct energy deposition. J. Alloys Compd. 2019, 811, 152021. [Google Scholar] [CrossRef]
  24. Reichardt, A.; Dillon, R.P.; Borgonia, J.P.; Shapiro, A.A.; McEnerney, B.W.; Momose, T.; Hosemann, P. Development and characterization of Ti-6Al-4V to 304L stainless steel gradient components fabricated with laser deposition additive manufacturing. Mater. Des. 2016, 104, 404–413. [Google Scholar] [CrossRef]
  25. Suprobo, G.; Ammar, A.A.; Park, N.; Baek, E.R.; Kim, S. Thermal Decomposition of Massive Phase to Fine Lamellar α/β in Ti–6Al–4V Additively Manufactured Alloy by Directed Energy Deposition. Met. Mater. Int. 2019, 25, 1428–1435. [Google Scholar] [CrossRef]
Figure 1. Macroscopic images of direct energy deposition-processed Ti–6Al–4V alloy samples fabricated at various powers and scan speeds.
Metals 11 00887 g001
Figure 2. Variation in the MSE value as a function of the (a) number of hidden layers (HLs) and neurons and (b) number of iterations.
Metals 11 00887 g002
Figure 3. Correlation plots showing the experimental versus predicted results of the (a) length of the fusion zone (FZ), (b) width of the FZ, (c) length of the heat-affected zone (HAZ), (d) width of the HAZ, (e) deposit height, and (f) grain size. All values are in mm.
Metals 11 00887 g003
Figure 4. Estimated effect of the laser power on (a) the length of the fusion zone (FZ), (b) width of the FZ, (c) length of the heat-affected zone (HAZ), (d) width of the HAZ, (e) columnar grain size, and (f) build height of the direct energy deposition-processed Ti–6Al–4V alloy components at various scan speeds.
Metals 11 00887 g004
Figure 5. Estimated effect of the laser scan speed on the (a) length of the fusion zone (FZ), (b) width of the FZ, (c) length of the heat-affected zone (HAZ), (d) width of the HAZ, (e) columnar grain size, and (f) build height of the direct energy deposition-processed Ti–6Al–4V alloy components at various power levels.
Metals 11 00887 g005
Figure 6. Variation in the hardness values of the deposited materials as a function of the (a) power, (b) scan speed and (c) combined contour plot estimated with ANN. The effect of power and scan speed on deposit height (df) and microstructure (d1f1) of various regions is indicated in (c).
Metals 11 00887 g006
Figure 7. (a) Measured hardness locations in the as-fabricated sample. (b) Variation in the hardness of the DED-processed Ti–6Al–4V component with respect to the distance from the deposition center.
Metals 11 00887 g007
Figure 8. Electron backscatter diffraction–inverse pole figure (ac) and phase maps (df) of the as-direct energy deposition-processed Ti–6Al–4V alloy taken from the deposition region, heat-affected zone (HAZ), and base plate, respectively.
Metals 11 00887 g008
Figure 9. Electron backscatter diffraction–inverse pole figure maps of the deposition region, heat-affected zone (HAZ), and base plate of the DED-processed Ti–6Al–4V component after heat treatment: (ac) HT #1 and (df) HT #2.
Metals 11 00887 g009
Figure 10. Electron backscatter diffraction–phase maps of the deposition region, HAZ, and base plate of the DED-processed Ti–6Al–4V component after heat treatment: (ac) HT #1, (df) HT #2.
Metals 11 00887 g010
Figure 11. Variation in the phase fractions in the deposition region, heat-affected zone (HAZ), and base plate after direct energy deposition processing of the Ti–6Al–4V alloy: (a) α fraction and (b) β fraction.
Metals 11 00887 g011
Figure 12. Variation in the hardness of the deposition region, heat-affected zone (HAZ), and base plate after direct energy deposition processing of the Ti–6Al–4V alloy: (a) as-fabricated, (b) HT #1, and (c) HT #2.
Metals 11 00887 g012
Table 1. Measured values of the melt pool and deposit geometries and average columnar grain size of DED-processed Ti–6Al–4V alloy samples under various process conditions.
Power (W)Scan Speed (m/min)Length of FZ (mm)Width of FZ (mm)Length of HAZ (mm)Width of HAZ (mm)Columnar Width (mm)Deposited Height (mm)
2000.30.1250.9680.3361.3510.20951.0857
3000.30.2131.3050.3821.7120.21081.3429
4000.30.2671.5380.4682.1150.26931.5914
5000.30.3681.8770.4972.5280.26861.84
6000.30.4222.4150.6762.9430.3062.1
2000.60.0990.9160.3211.2470.08550.6314
3000.60.1681.1320.3541.5290.09330.7843
4000.60.2331.3450.381.7430.09790.8986
5000.60.3111.5390.4042.1040.12971.06
6000.60.331.8210.4632.4010.26831.1229
2000.90.0790.7620.2651.140.08890.3972
3000.90.1641.0320.2921.3580.07170.41
4000.90.2151.2280.3351.6750.09020.6371
5000.90.2741.4110.3541.8910.09740.7486
6000.90.2921.5810.4192.0270.08670.7614
2001.20.0960.7390.2281.0420.05920.2614
3001.20.140.9290.2611.2460.06370.3429
4001.20.191.1310.291.4120.08960.45
5001.20.2251.2680.311.6370.07740.5029
6001.20.2641.4180.3471.8520.07930.5495
2001.50.0460.6420.2130.990.0350.1543
3001.50.1050.890.2371.1540.05060.2314
4001.50.1831.0440.2511.3410.07330.3714
5001.50.2031.2150.2931.5150.07330.4
6001.50.2561.3620.3251.7340.07830.4143
Table 2. Average error in predictions and correlation coefficient values of various deposit parameters of the DED-processed Ti–6Al–4V alloy components.
Build FeatureAverage ErrorAdj. R2
Length of FZ, µm0.0090.99
Width of FZ, µm0.0150.96
Length of HAZ, µm0.0070.99
Width of HAZ, µm0.0190.97
Build height, mm0.0050.99
Grain size, µm0.0200.99
Publisher’s Note: MDPI stays neutral with regard to jurisdictional claims in published maps and institutional affiliations.

