Article

Study on the Correlation between the Microstructure Characteristics and Corrosion Behaviors of 2A12-T4 Aluminum Alloy under Thermal Strain

1
Jiangxi Key Laboratory of Forming and Joining Technology for Aviation Components, Nanchang Hangkong University, Nanchang 330063, China
2
State Key Laboratory of Advanced Welding and Joining, Harbin Institute of Technology, Harbin 150001, China
3
State Key Laboratory of Advanced Metals and Materials, University of Science and Technology, Beijing 100083, China
*
Authors to whom correspondence should be addressed.
Metals 2021, 11(6), 924; https://doi.org/10.3390/met11060924
Submission received: 16 April 2021 / Revised: 21 May 2021 / Accepted: 3 June 2021 / Published: 6 June 2021

Abstract

:
In this study, the welding thermal simulation technology was used to prepare samples under different peak temperatures and strain levels in order to reveal the effects of thermal strain on the microstructure characteristics and corrosion resistance of aluminum alloy. Furthermore, the correlation between microstructure evolution law and corrosion behavior was studied by analyzing the microstructure characteristics and performing electrochemical polarization curve tests. Results showed that the amount and distribution of the precipitated phase were the main factors affecting the corrosion behavior of aluminum alloy. The precipitated phase was distributed along the direction of tensile strain, and the grain size was coarsened from 152 to 260 μm (and even exceeded 280 μm) after experiencing peak temperatures of 300 and 400 °C. In addition, the risk of corrosion for the samples that experienced thermal strain was increased compared to those that did not undergo tensile strain. The samples that experienced a peak temperature of 300 °C presented the best corrosion resistance as the precipitated phase was evenly distributed in the matrix. However, when the peak temperature was 400 °C and the strain was 8%, the number and density of the precipitated phase increased due to the dynamic recrystallization, and the corrosion resistance of the sample became the worst. Finally, the microstructure analysis results showed that dynamic recrystallization occurred in the sample with a peak temperature of 400 °C, and the precipitated phase was mainly distributed along the grain boundaries. This led to the decrease of the corrosion resistance of grain boundaries, and the corrosion developed from pitting corrosion to intergranular corrosion.

1. Introduction

With the development of the manufacturing industry, aluminum alloy has become one of the most commonly used materials in this field. The popular material, 2A12 aluminum alloy, is a kind of Al-Cu-Mg aluminum alloy with high strength. It is widely used in the marine, automobile, and aerospace fields [1,2,3,4]. As the 2A12 aluminum alloy is very sensitive to heat input, welding defects such as pores, deformations, and cracks are usually formed in welded joints, which are created using the traditional fusion welding method [5,6,7]. Friction stir welding (FSW), a new solid phase welding technology, has the advantages of environmental protection, high efficiency, excellent performance of welded joints, etc., and is a common welding method used in processing the 2A12 aluminum alloy [8,9,10].
However, this aluminum alloy structure is highly sensitive to the effects of marine atmosphere, humid air, and other corrosive elements in the environment, which in turn, lead to corrosion-induced problems, such as pitting corrosion, intergranular corrosion or exfoliation corrosion. In addition, the effects of thermal mechanical strain in FSW could lead to the microstructure inhomogeneity of the welded joint, thus increasing the possibility of corrosion failure. In relation to this, it is necessary to deeply investigate the correlation between microstructure characteristics and corrosion behavior of aluminum alloy joints created via FSW.
Meng et al. [11] studied the corrosion resistance of AA2060-T8 aluminum alloy welded joints, and concluded that the corrosion resistance of the heat engine affected area is worse than that of the thermal-mechanical affected zone (TMAZ) and also worse than that of the heat affected zone (HAZ). However, Chen Yong et al. [12] investigated the corrosion behavior of the FSW joint of 7050-T76 aluminum alloy in different sub-areas, and found that the corrosion resistance of HAZ is the worst. Bocchi et al. [13] studied the FSW of AA2024-T3 aluminum alloy and found that, compared with other areas, intergranular corrosion with stress enhancement occurred in the area subjected to thermal-mechanical action, which was also the place where corrosion occurred previously. During FSW, the TMAZ is affected by both thermal cycling and mechanical stirring, resulting in significant changes in grain characteristics, precipitate morphology, and stress-strain state.
Therefore, the TMAZ is the weak part of the whole welded joint, which can easily become the source of corrosion failure. Many studies have investigated the causes of TMAZ corrosion, but reached different conclusions. For example, Bousquet et al. [14] explored the relationship between microstructure and intergranular corrosion sensitivity of the AA 2024-T3 FSW joint. Their results showed that the HAZ near the TMAZ had the greatest sensitivity to intergranular corrosion. They also found that the existence of continuous S0(S) intergranular precipitates at grain boundaries was the main reason for the occurrence of intergranular corrosion sensitivity. Wadeson et al. [15] investigated the corrosion behavior of FSW joints of AA7108-T79 aluminum alloy and found that the edge area of the TMAZ was the most vulnerable to corrosion. The uneven distribution of precipitated phase η/η (MgZn2) in the TMAZ is an important reason for local corrosion. Wang et al. [16] explored the stress corrosion sensitivity of 2024-T3 aluminum alloy FSW joint, and concluded that the main reason influencing the stress corrosion sensitivity was that the size of the precipitated phase particles increased due to thermal cycling, which in turn, led to pitting corrosion expansion, ultimately leading to stress corrosion. When aluminum alloy undergoes thermo-mechanical coupling, the grain morphology, structure type, and stress-strain state of the material will change, which in turn, change its corrosion resistance. Therefore, exploring the correlation between TMAZ microstructure and corrosion behavior is necessary.
In the current paper, the 2A12-T4 aluminum alloy was used as the research object, and the welding thermal simulation technique was used to prepare enlarged TMAZ specimens with different peak temperatures and tensile strain levels. Subsequently, the relationship among “the thermo-mechanical parameter evolution of microstructure characteristic corrosion behavior” was systematically investigated. The findings of this study can be used to provide the theoretical basis for the optimization of FSW parameters.

2. Materials and Methods

In this study, the 2A12-T4 aluminum alloy (composition wt%: Cu—4.29, Si—0.11, Fe—0.29, Mn—0.61, Mg—1.48, Zn—0.02, Al—Bal) was used in the experiment. Samples with the size of 100 × 16 × 3 mm were cut along the rolling direction using the Electrical Discharge Machining (EDM) wire cutting technology. Then, they were cleaned with acetone and dried by cold air for subsequent use. The thermocouple was fixed by spot welding in the middle and bottom of the sample length direction, and then the simulated sample of TMAZ was prepared by the Gleeble-3500 made by DSI USA thermal simulation machine. The peak temperatures were selected as 200, 300, and 400 °C, the heating rate was 50 °C/s, and the strain levels of 0%, 4%, and 8% were applied on each sample at peak temperature. Comparison samples were prepared at room temperature (expressed by RT). Detailed parameters are shown in Table 1.
Then, the samples for analysis were prepared through standard metallographic procedures. Keller’s reagent was used to soak the samples for 10–20 s. After being cleaned and dried with alcohol, optical microscopy, scanning electron microscopy (SEM, Phenom-XL made by Shanghai Fona Scientific Instrument limited company, China), and the BSD (back-scattered) mode were used to analyze the microstructures of the thermal simulation samples. In order to quantitatively analyze the grain size variation, the grain size was measured according to the line intercept method in the standard GB/T 6394-2017. The specific methods are shown in Figure 1. First, three test lines were uniformly placed in the microstructure along the horizontal and vertical directions. Second, the interceptions were counted. The intersection points represent the test wire cut grain boundaries. Each intersection point count 1, each tangential intersection point count 1, 0.5 when one end of the test line ends just at the grain boundary, and 1.5 when the intersection occurs at the triple point. Third, the grain size is obtained by the formula D = L/N, wherein D, L, and N represented the grain size, the length of the test line, and the number of nodes, respectively. Finally, each sample is measured at least three times and the average value was taken to determine the grain size.
Transmission electron microscope (TEM) was used to observe the size of the dislocation structure and dislocation densities. To ensure the accuracy of the experiment, the thickness of the obtained thermal simulation sample was ground to 100 µm, then the small wafer of Ø3 mm was taken out, and the sample was analyzed by transmission electron microscopy using the point solution and double spray. The electrolyte was HNO3:CH3OH = 3:7, and the acceleration voltage was 200 kV under Talos F200X made by FEI USA field emission TEM.
A CS310H electrochemical workstation featuring a three-electrode system was used in the electrochemical testing experiment. The scanning point range of the potentiometric polarization curve ranged from −0.3 to 0.8 V (vs. Open Circuit Potential (OCP)), and the scanning rate was 0.5 mV/s. After the electrochemical test, the corrosion morphologies of the samples were observed using the Phenom-XL (SEM) BSD mode. Finally, the influence of microstructural changes on the micro-corrosion morphology of the 2A12-T4 aluminum alloy was analyzed.

3. Results

3.1. Microscopic Observation

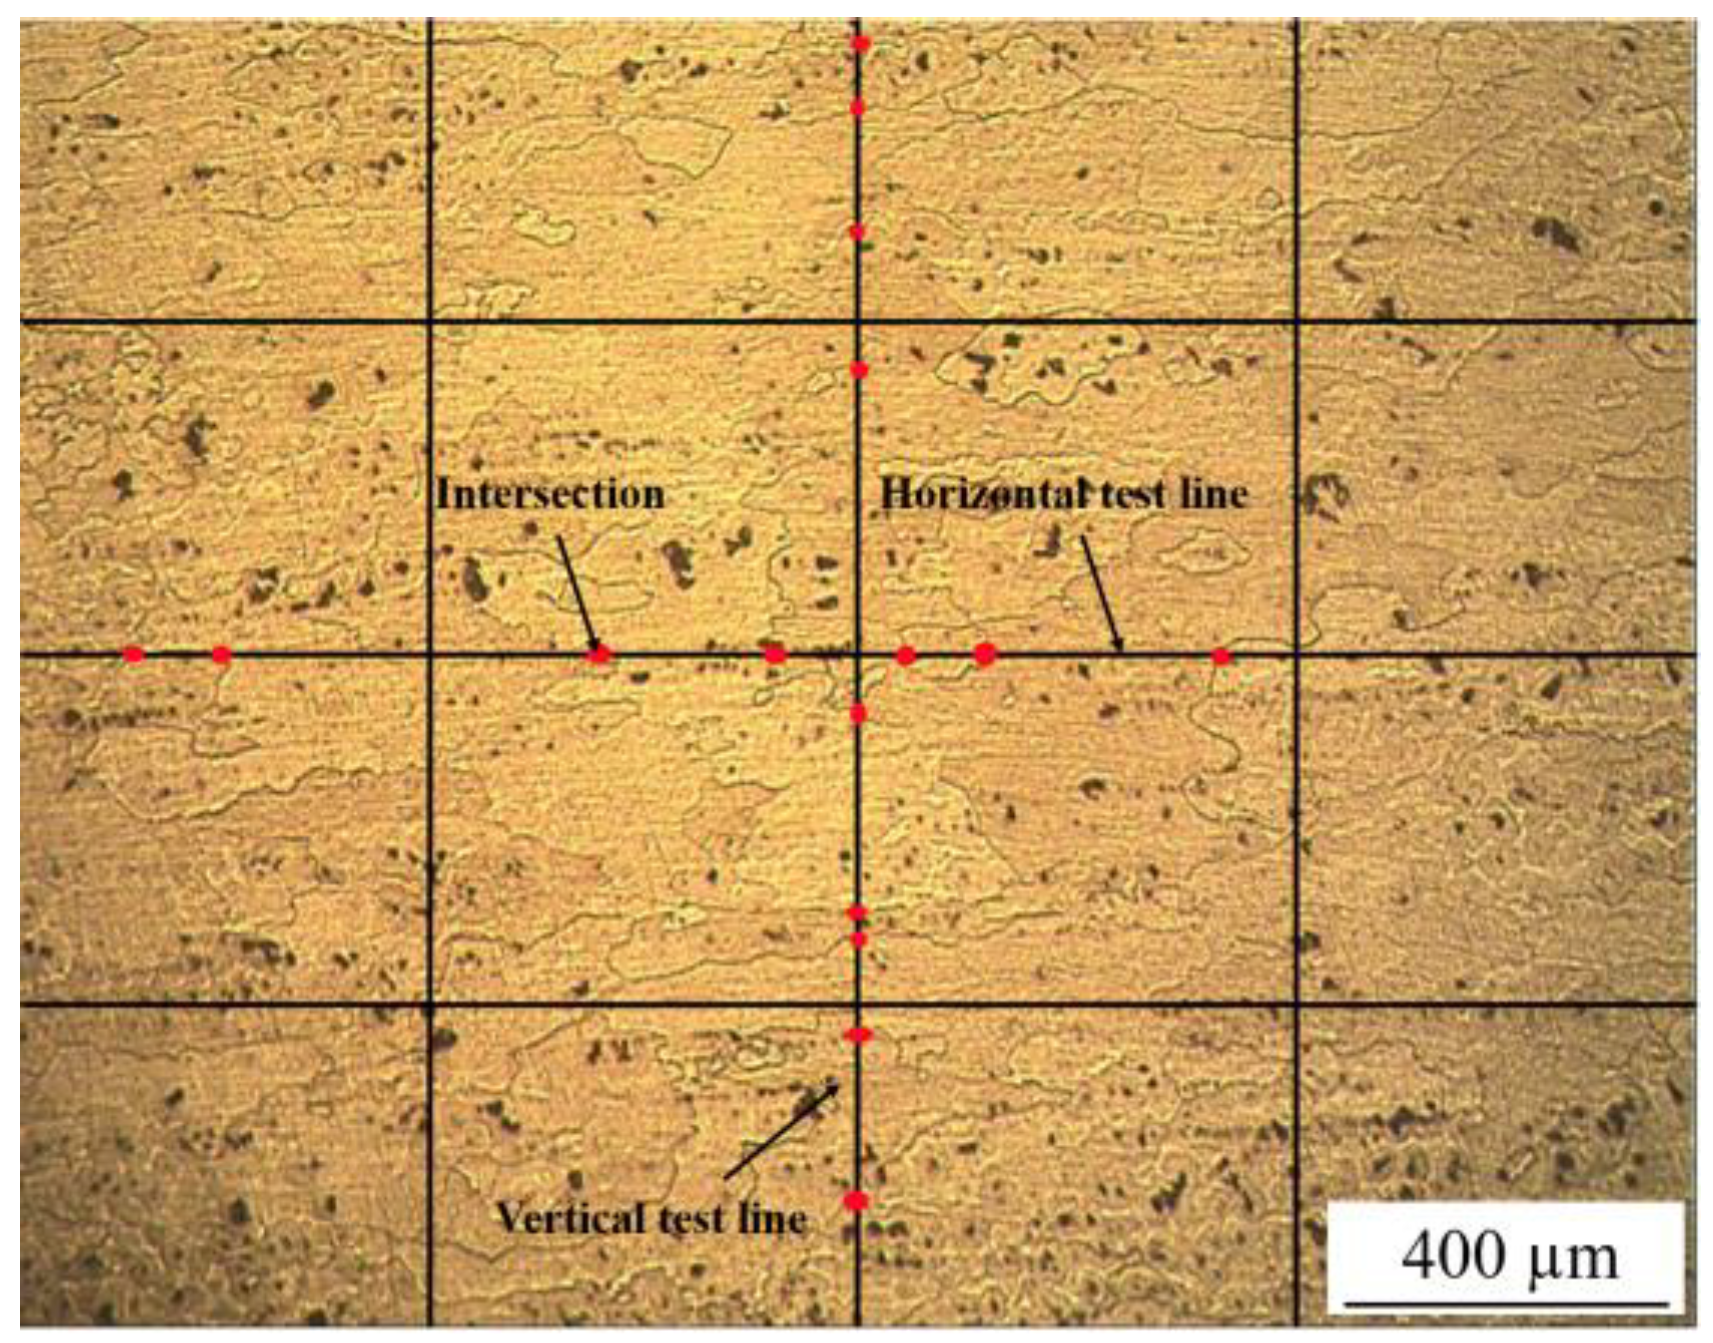
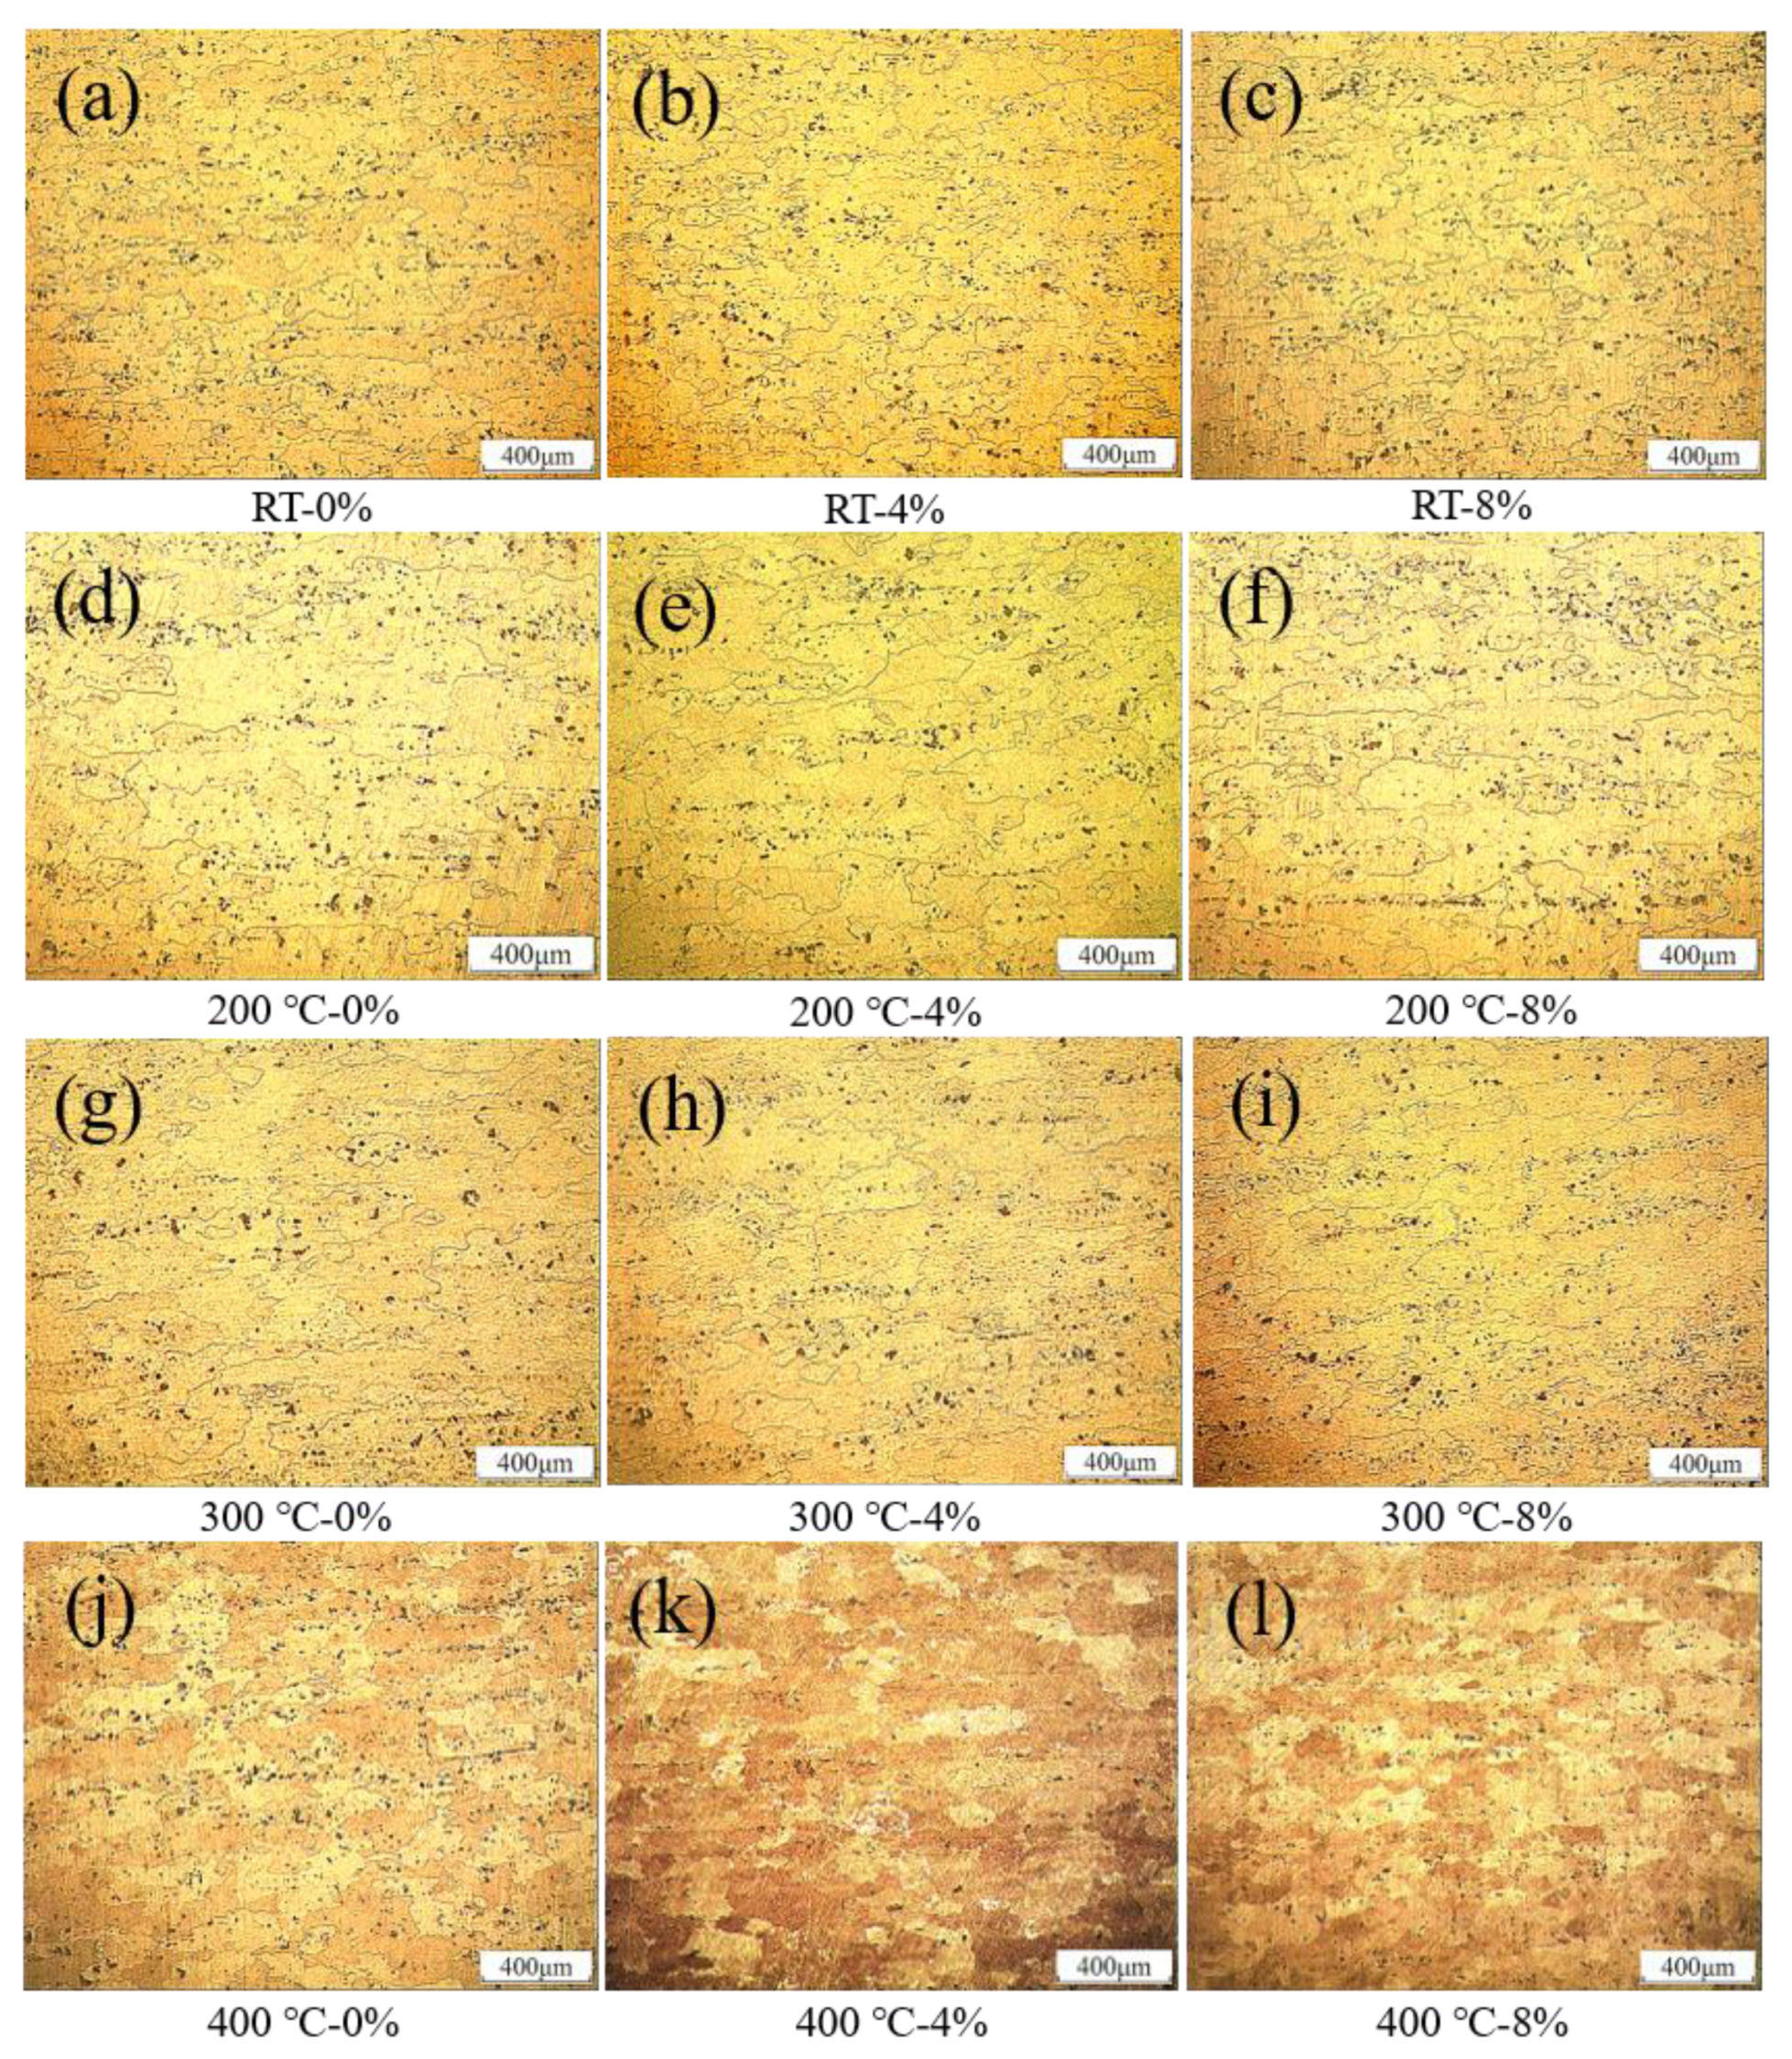
3.1.1. Metallographic Observation

The microstructures of the 2A12-T4 aluminum alloy under different peak temperatures and different tensile strain degrees are shown in Figure 2. Table 2 presents the statistical analysis of grain sizes under different thermal strain conditions using the line intercept method. Figure 2a shows the original microstructure of the 2A12-T4 aluminum alloy. As can be seen, the microstructure had a strip-like appearance due to the rolling process, and the grain size was about 152 µm. The grain was slightly elongated after applying the tensile strains of 4% and 8%, as shown in Figure 2b,c, respectively. Figure 2d shows the microstructure of the sample after the peak temperature of 200 °C. Due to the effect of peak temperature, the grain size exceeded 200 µm. It can be seen from Figure 2e,f, with the increase of tensile strain, that the grains gradually became slender, and some small near-equiaxial grains were intermingled with these large grains. At the peak temperatures of 300 and 400 °C, the grain size exceeded 260 µm, as shown in Figure 2g–l. With the increase in the level of tensile strain, the original fine grains were polymerized and transformed into irregular polygons.

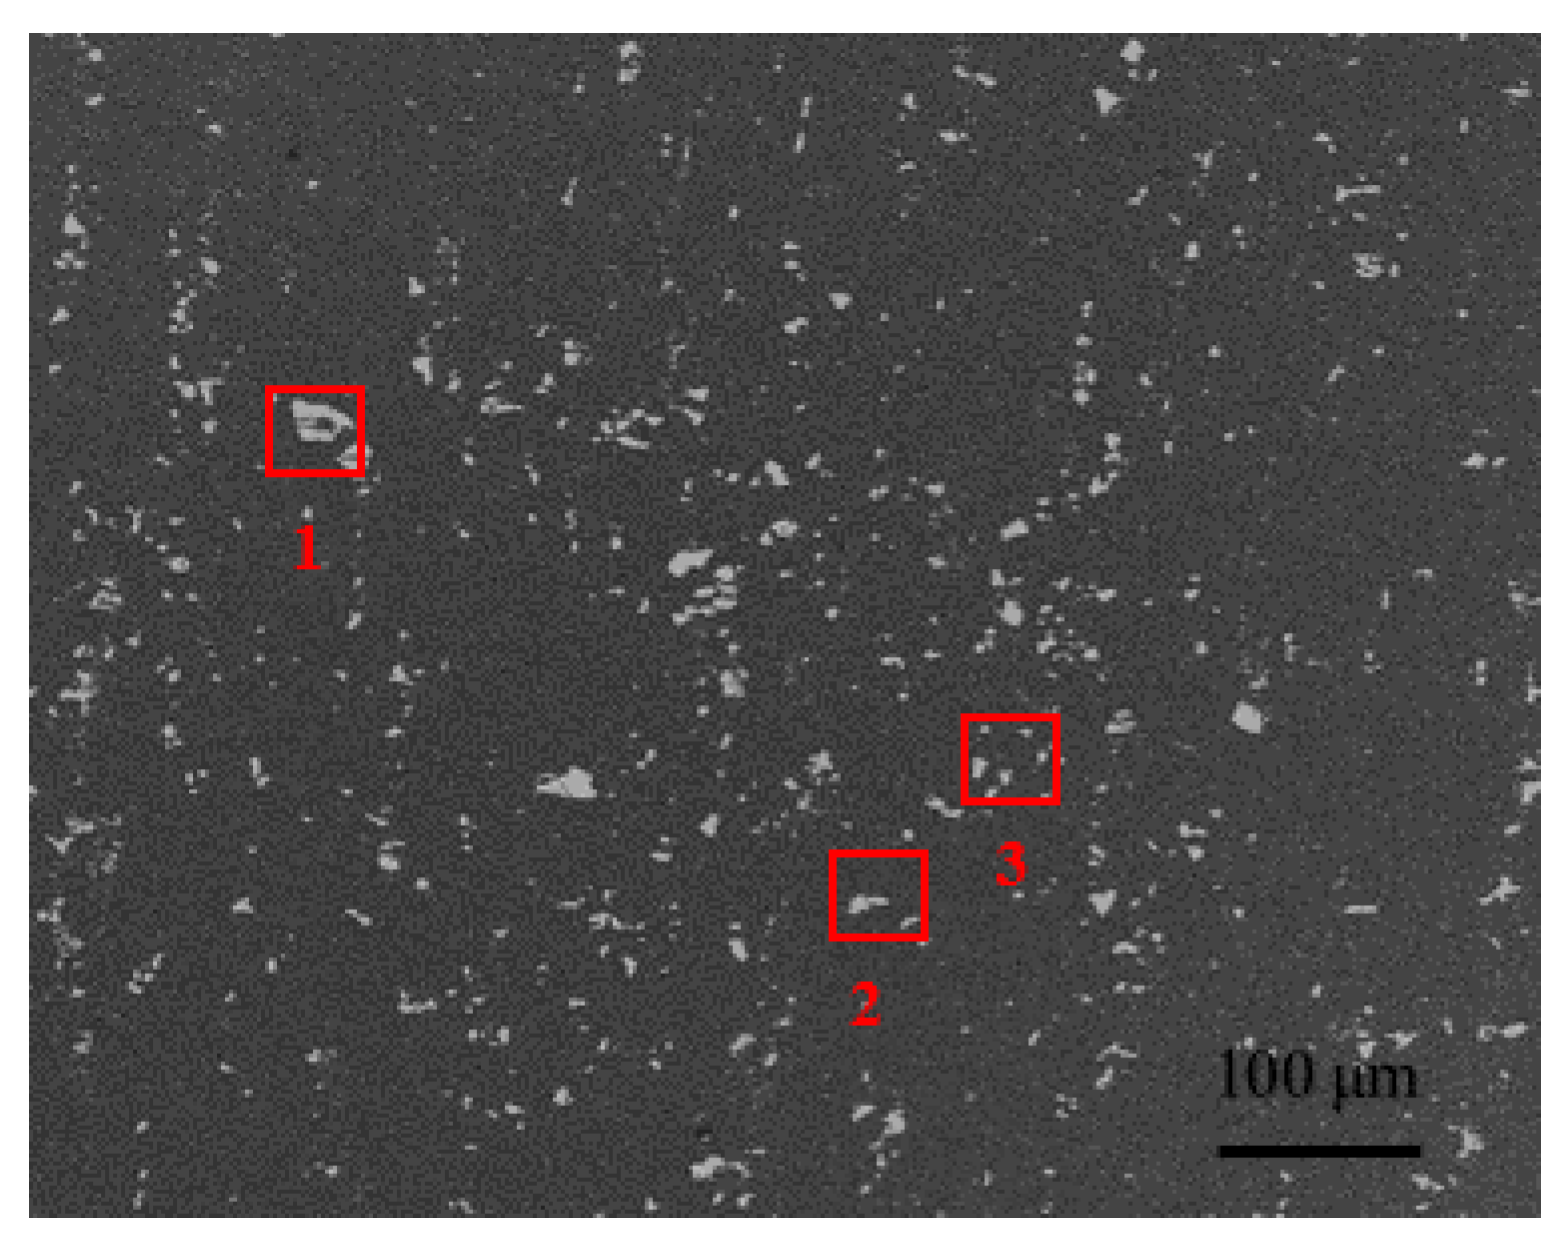
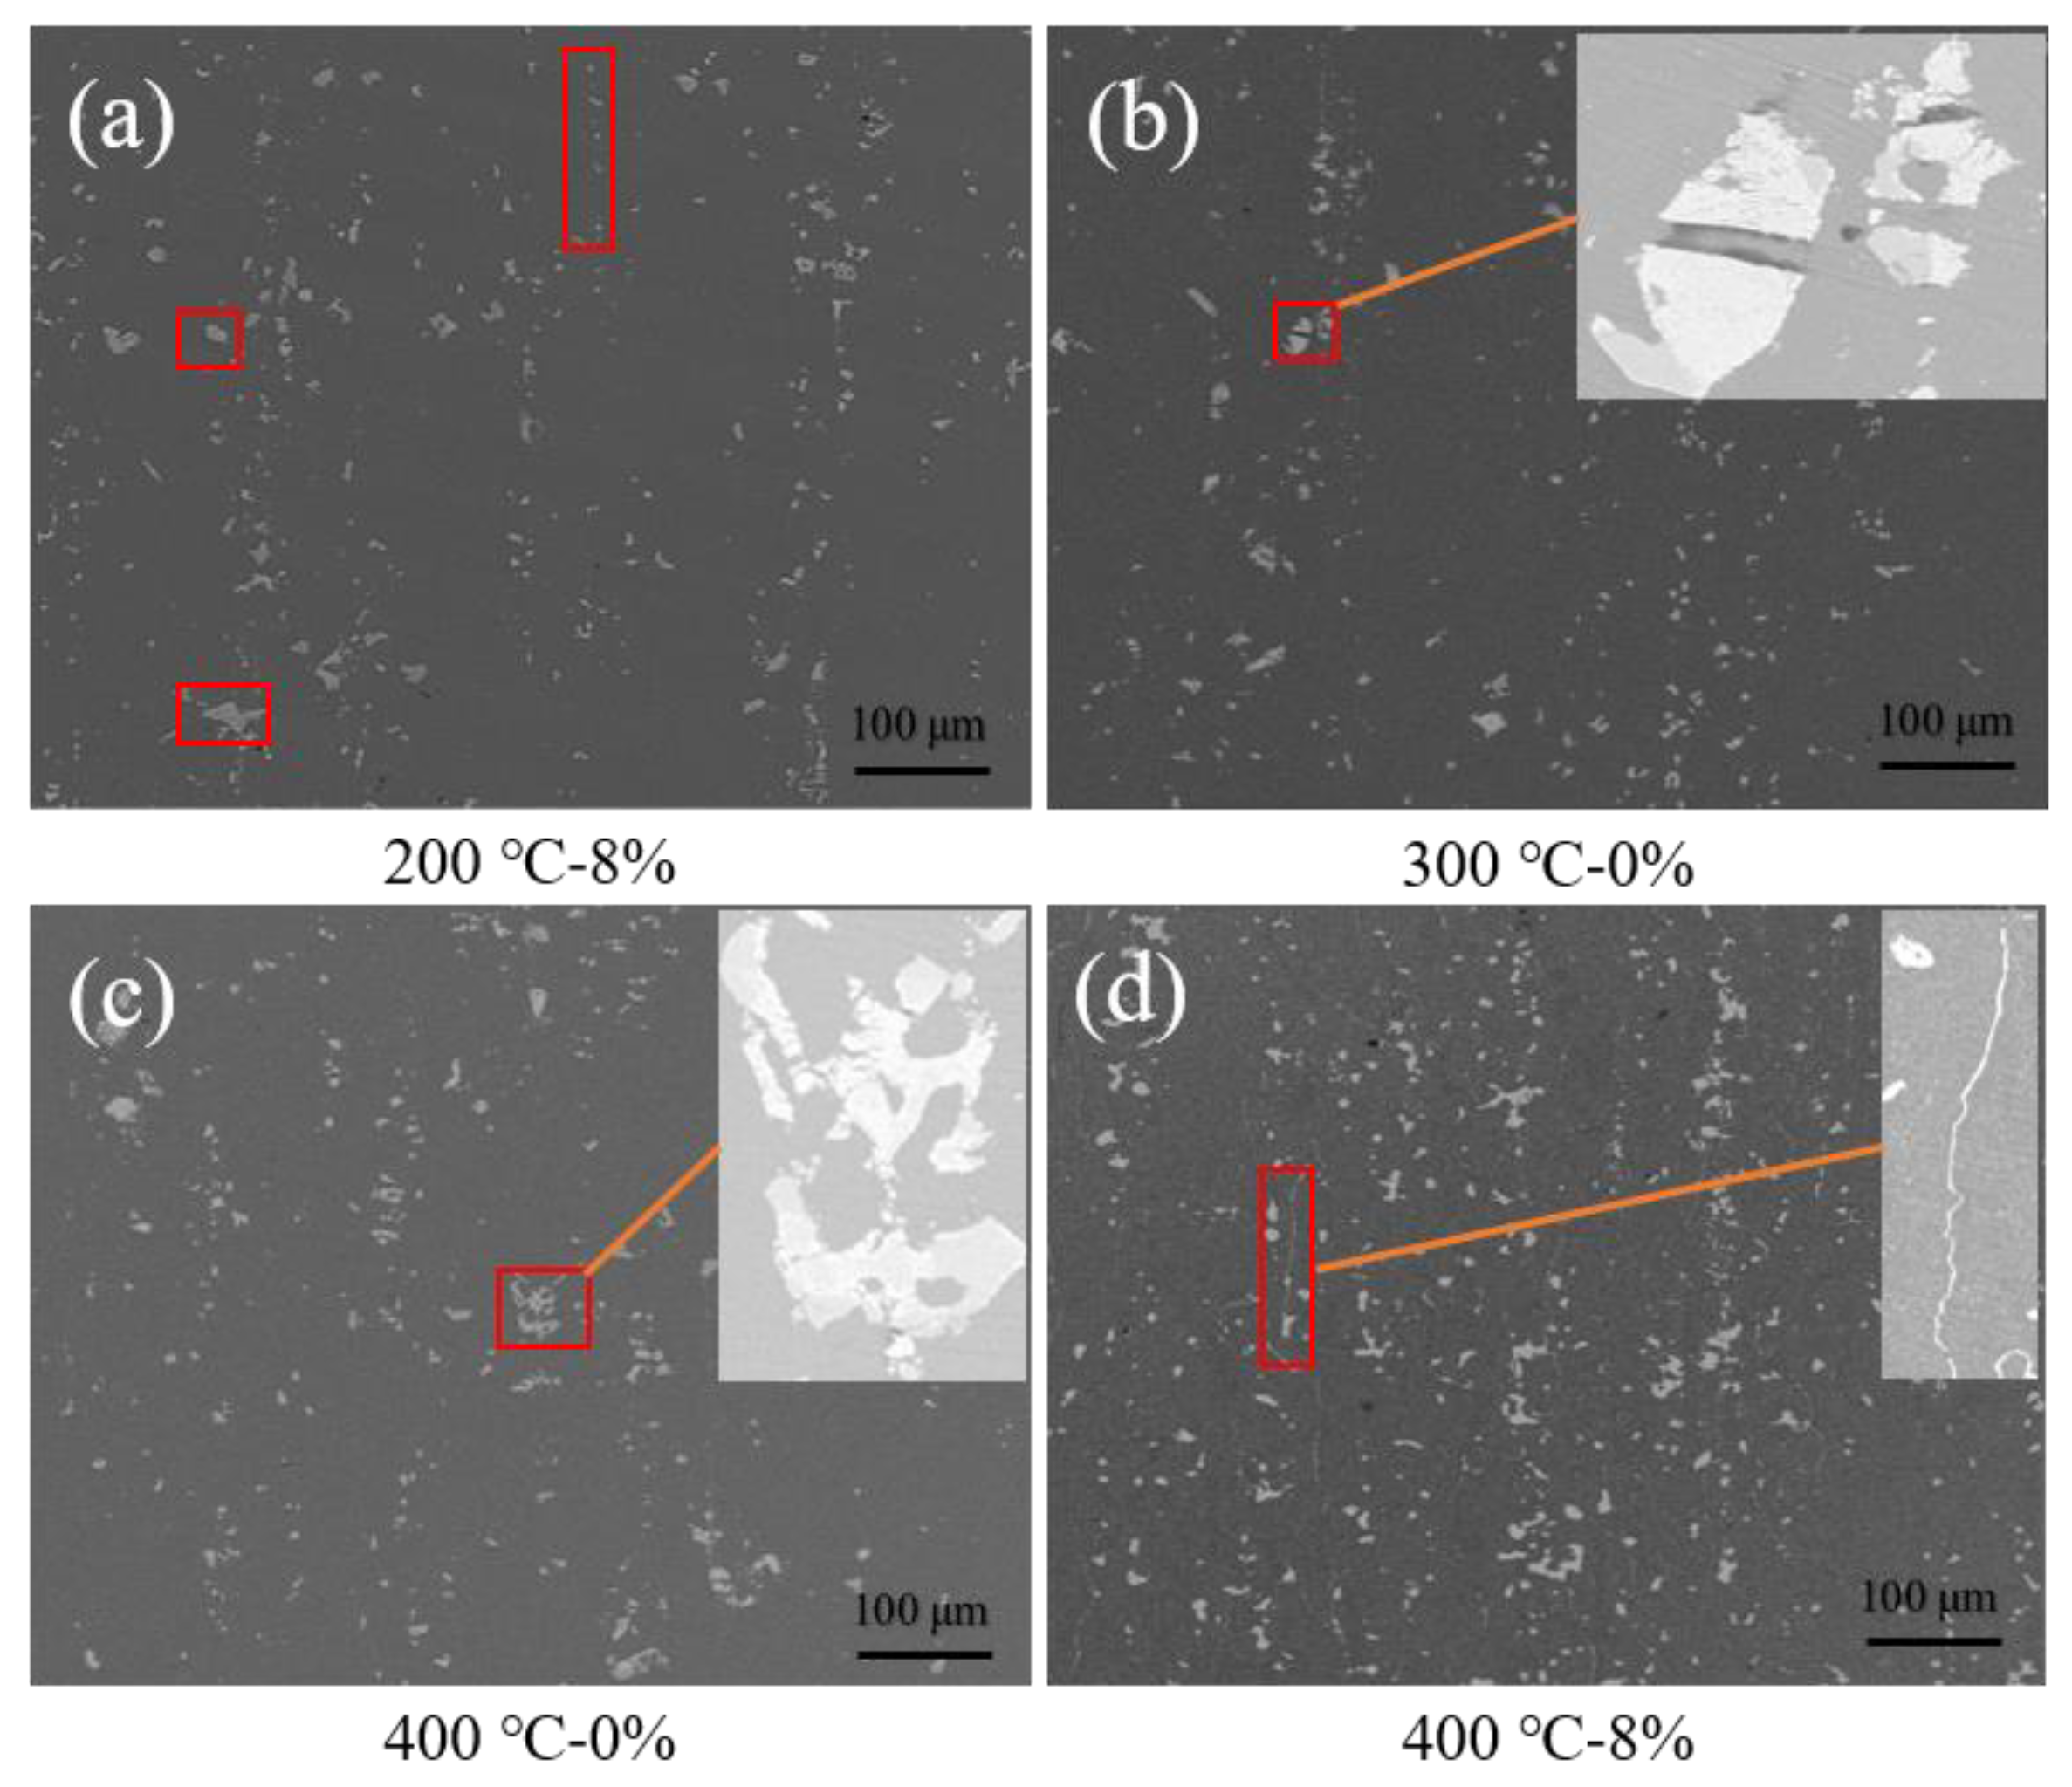
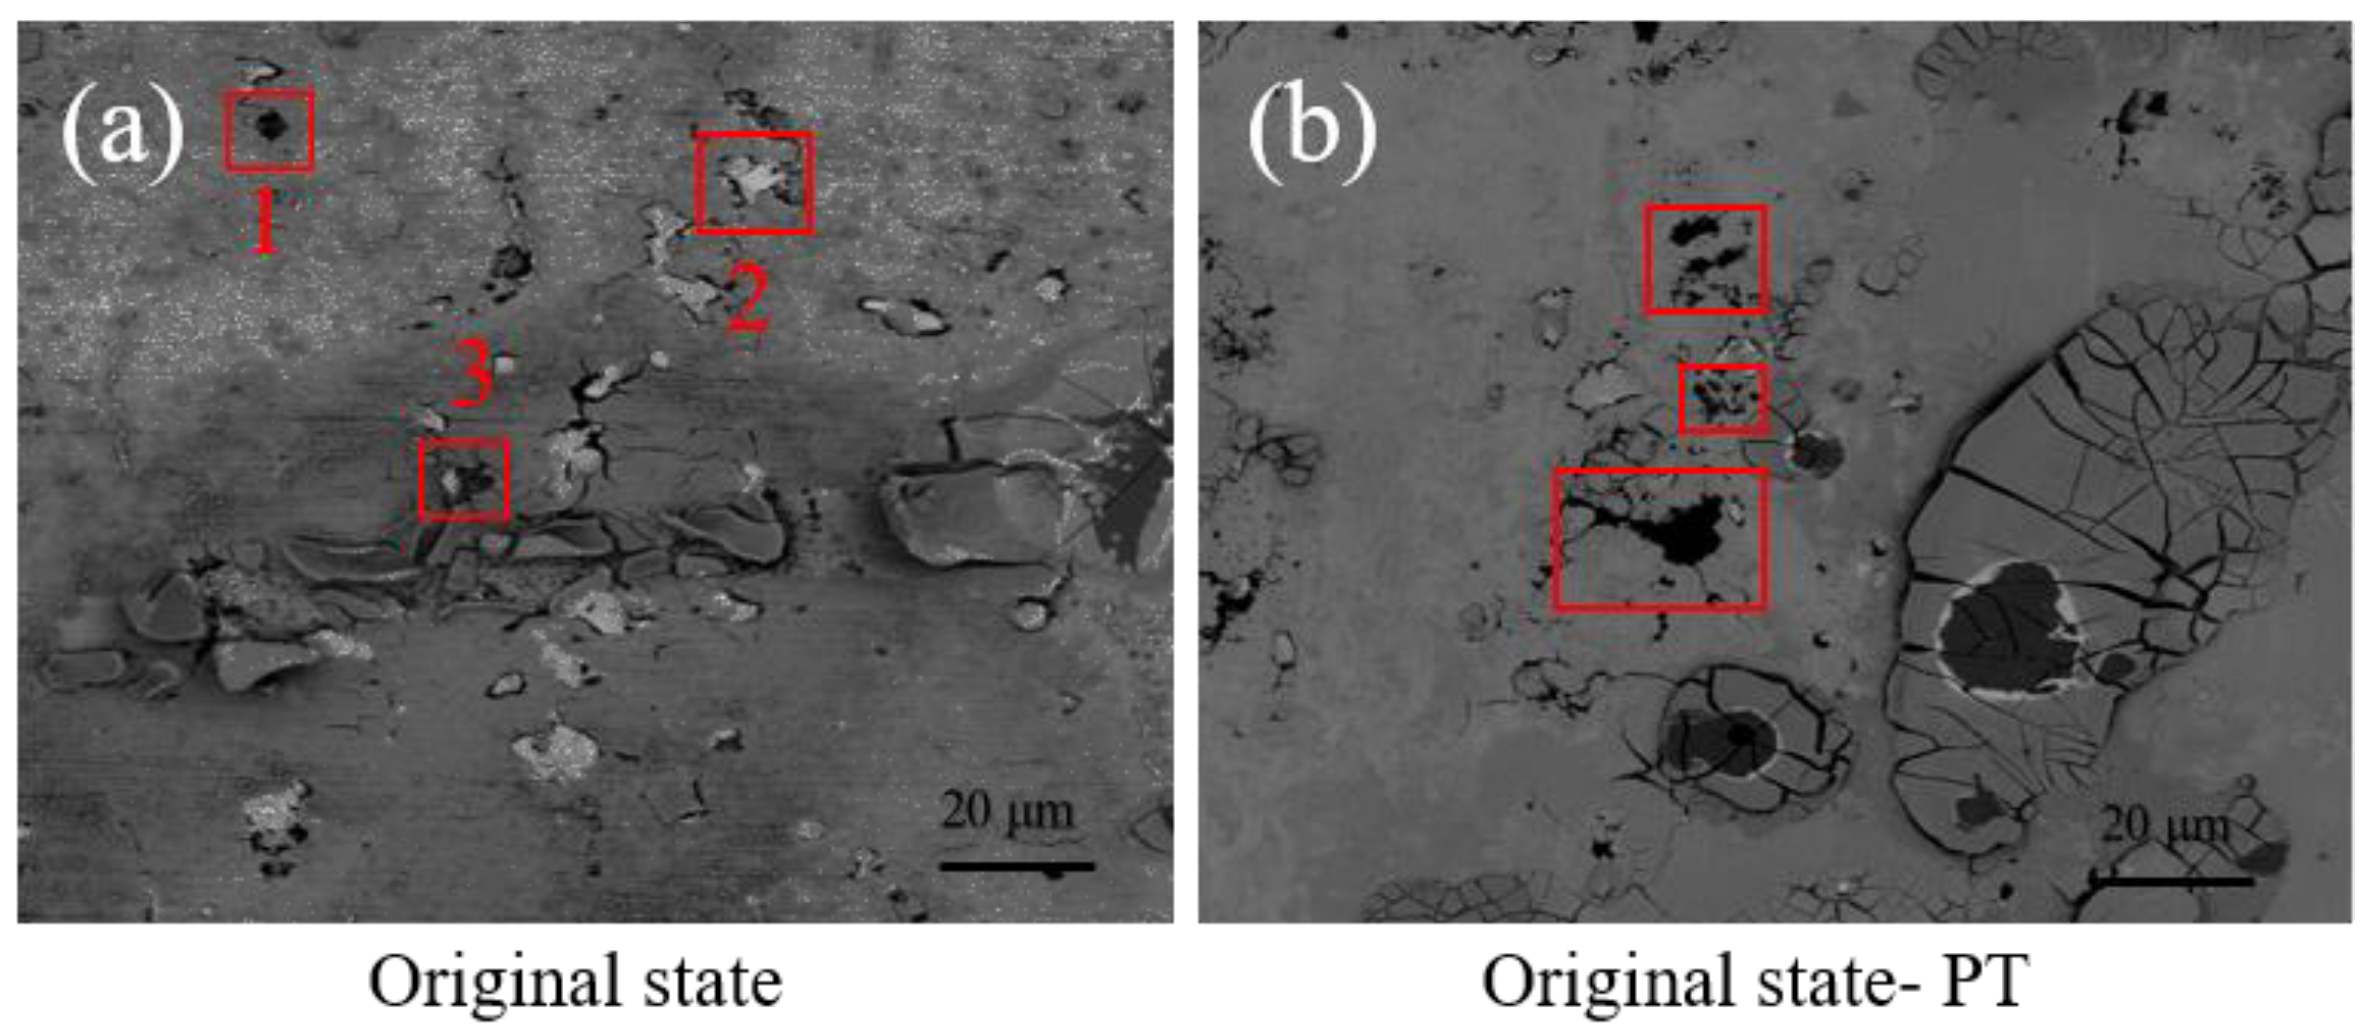
3.1.2. Precipitated Phase Observation

The cross-section morphology of the precipitated phase of 2A12-T4 aluminum alloy is diffusely distributed, and has three kinds of morphologies. As shown in Figure 3, “1” is a large flake, “2” is a short rod, and “3” is fine granular. The energy spectrum (EDS) analysis was carried out for the precipitated phase of the above three morphologies. The results are shown in Table 3, where w/% represents the mass fraction of the element, and x/% represents the atomic fraction of the element. The main elements in the particles of the precipitated phase are Al and Cu. According to a review of relevant literature review [17,18], the components of the precipitated phase are mainly θ (Al2Cu) and S (Al2CuMg).
With the increase of peak temperature, the morphology and distribution state of the precipitated phase were also in different degrees, as shown in Figure 4. When the peak temperature was 200 °C, the morphology of the precipitated phase did not change significantly. As shown in Figure 4a, there were still three morphologies, namely, fine grain shape, short rod shape, and large flake shape. However, under the action of tensile strain, the distribution trend of the precipitated phase along the tensile direction was more obvious. When the peak temperature was 300 °C, the number of the precipitated phase was significantly reduced. This is due to the fact that, at a high temperature, some dispersed granular precipitated phase may dissolve into the matrix, and the new phase cannot be precipitated due to the short residence time at high temperature, as shown in Figure 4b. When the peak temperature was 400 °C, due to the rapid increase in heat, recrystallization occurred, which increased the number and the density of precipitated phase increased. However, part of the large size of the precipitated phases showed a trend of disintegrating along the stress direction, as shown in Figure 4c, further proving that the dispersed fine precipitated phase dissolved into the matrix at a high temperature. In Figure 4d, as the strain degree increased, the elongated filamentous precipitated phase appeared, and the number of the precipitated phase increased and aggregated. Then, the precipitated phase was distributed along the stretching direction. In summary, under the condition of 8% strain, a significant plastic deformation and dislocation multiplication occur in the aluminum alloy, which provide a particle for the precipitation of the precipitated phase in the cooling process.

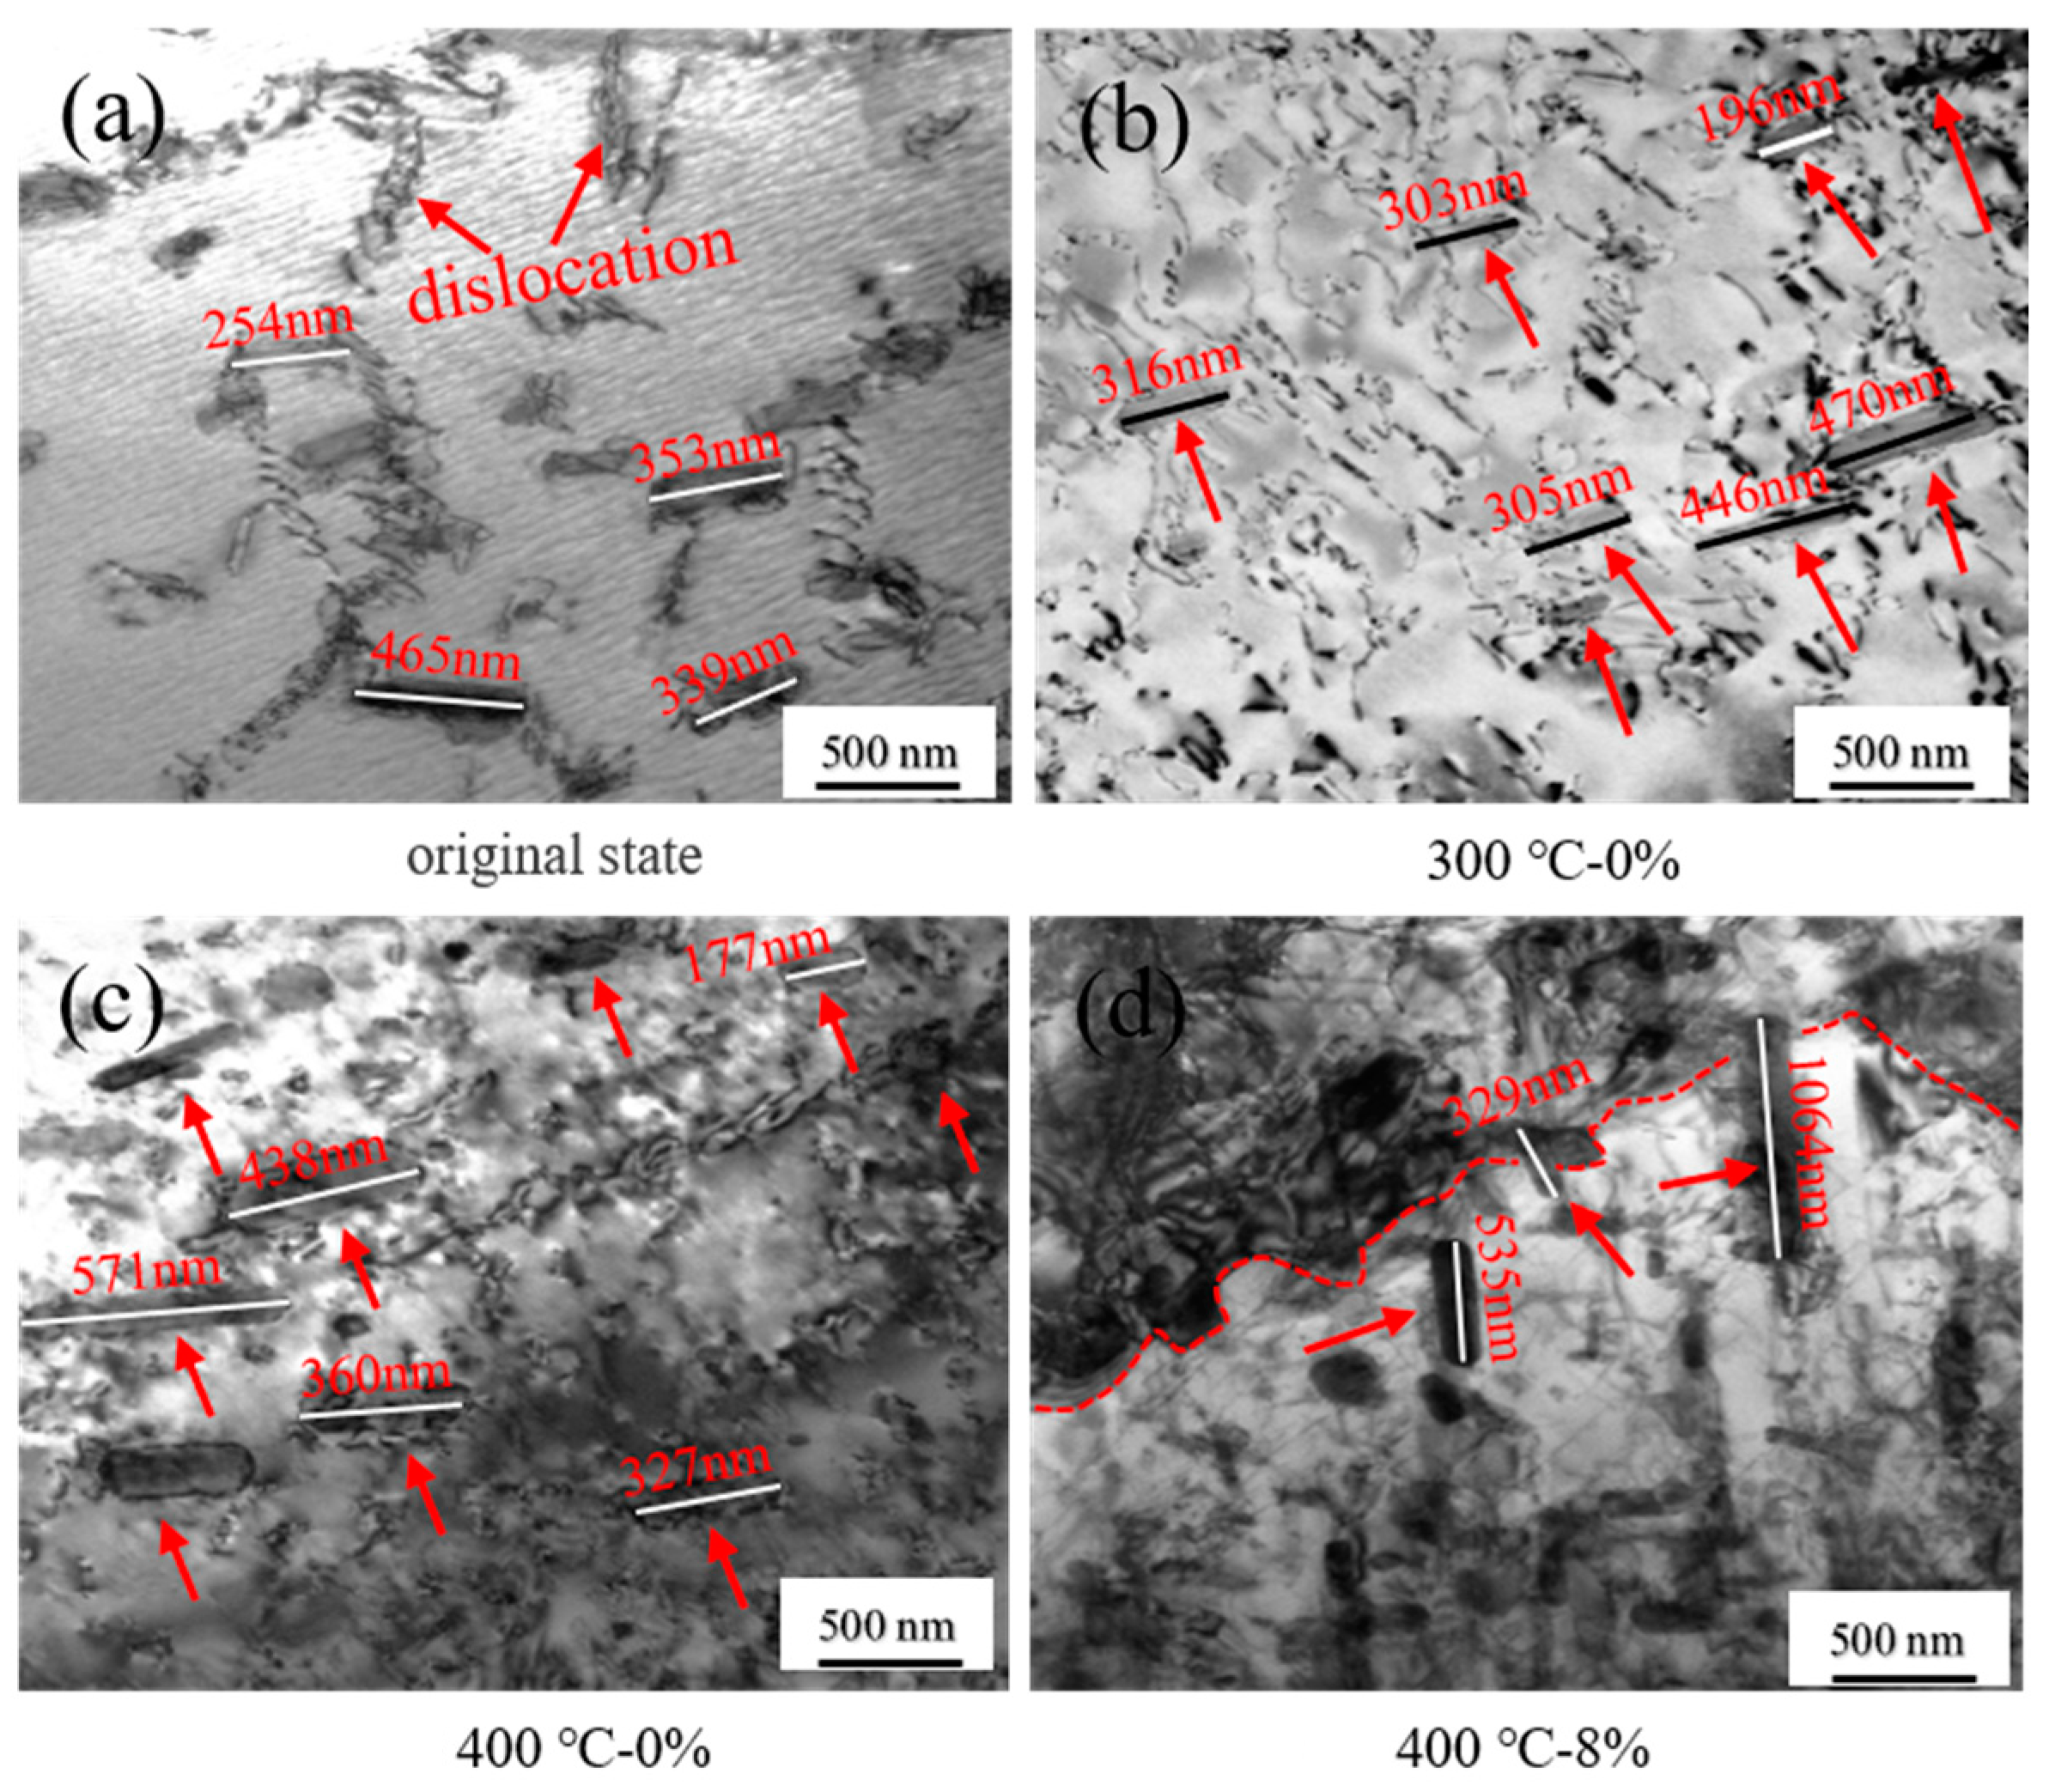
3.1.3. TEM Observation

The TEM morphologies of the 2A12-T4 aluminum alloy under different thermal strain coupling effects are shown in Figure 5. As shown in Figure 5a, a small amount of dislocation can be found in the supplied aluminum alloy, showing a cross-sectional shape of a “suture line.” The cross-section of the precipitated phase had the shape of a bar, and the distribution direction was basically the same, with the size ranging from 200–500 nm. At the peak temperature of 300 °C without stretching, the dislocation tissue changed from “suture line” to the line shape. Compared to the parent material, the dislocation density decreased due to the intensified dislocation annihilation. Furthermore, the size of the precipitated phase changed, showing different lengths and a decrease in number. When the peak temperature was 400 °C, the internal tissues reverted to recrystallization, and in the process of recrystallization, dislocations were generated. This provided the particle effect for the precipitation of the precipitated phase, which in turn, led to the increase in the number of the precipitated phase. After applying 8% of the peak temperature and strain, the dislocation density became larger, along with a large precipitated phase. As shown in Figure 5d, the red arrow mark, in the grain boundary precipitate (red continuous line mark), the largest size exceeded 1000 nm, and the direction was basically perpendicular to the grain boundary. Furthermore, there were some aggregated, small sized phase precipitation surrounding the grain boundary dislocations which are caused by the tensile plastic strain dislocation proliferation in great quantities. This induced the precipitated phase to nucleate and grow at the dislocation, leading to the increased precipitated phase density.

3.2. Corrosion Behavior Study

3.2.1. Polarization Curve Test

Figure 6 shows the potentiodynamic polarization curve of the 2A12-T4 aluminum alloy in a 3.5% NaCl solution under different thermal strain coupling conditions. It can be seen that the polarization curves measured under all the parameters showed anodic dissolution without obvious passivation characteristics.
As shown in the results presented in Table 4, generally speaking, the lower the corrosion potential, the higher the corrosion tendency. Furthermore, the lower the corrosion current density, the lower the corrosion rate. When the thermal cycle peak temperature of the 2A12-T4 aluminum alloy was 300 °C, the corrosion current density was lower, and the self-corrosion potential was higher, indicating good corrosion resistance. On the contrary, when the peak temperature of the thermal cycle was 400 °C, the corrosion current density was higher, and the corrosion potential was relatively lower, (i.e., the corrosion tendency and corrosion rate were higher).
The test results showed that the sample with a peak temperature of 300 °C and no strain had the most optimal corrosion resistance. The corrosion current density and corrosion potential were 10.04 mA·cm−2 and −0.5495 V (Ag/AgCl), respectively. In comparison, the 2A12-T4 aluminum alloy with a peak temperature of 400 °C and to which the 8% strain was applied had the worst corrosion resistance. The corrosion current density and corrosion potential were 14.50 mA·cm−2 and −0.6267 V (Ag/AgCl), respectively. The good corrosion resistance of the 2A12-T4 aluminum alloy under peak temperature of 300 °C is due to several factors: Increased grain size under the peak temperature, decreased electrochemical performance of the grain-grain boundary uneven area, the area of the grain boundary coming into contact with the corrosive medium, and the reduced location of the pitting [19]. However, after the peak temperature exceeded 300 °C, the material inside the electrochemical inhomogeneity increased due to the grain showing greater precipitation in the precipitated phase. This resulted in a decreased level of corrosion resistance.
By comparing the test results of the same peak temperature with different pre-strain levels, it can be observed that the corrosion potential of the aluminum alloy under the pre-strain action shows a downward trend, that is, the corrosion tendency increases after the pre-strain treatment. Due to the increase of dislocation density under the action of tensile strain, the material has a higher activity than the sample without the tensile strain. At the same time, the greater precipitation of the precipitated phase in the area with high dislocation density, results in the reduced corrosion resistance of the pre-strain aluminum alloy due to the combined effect of the two aspects.

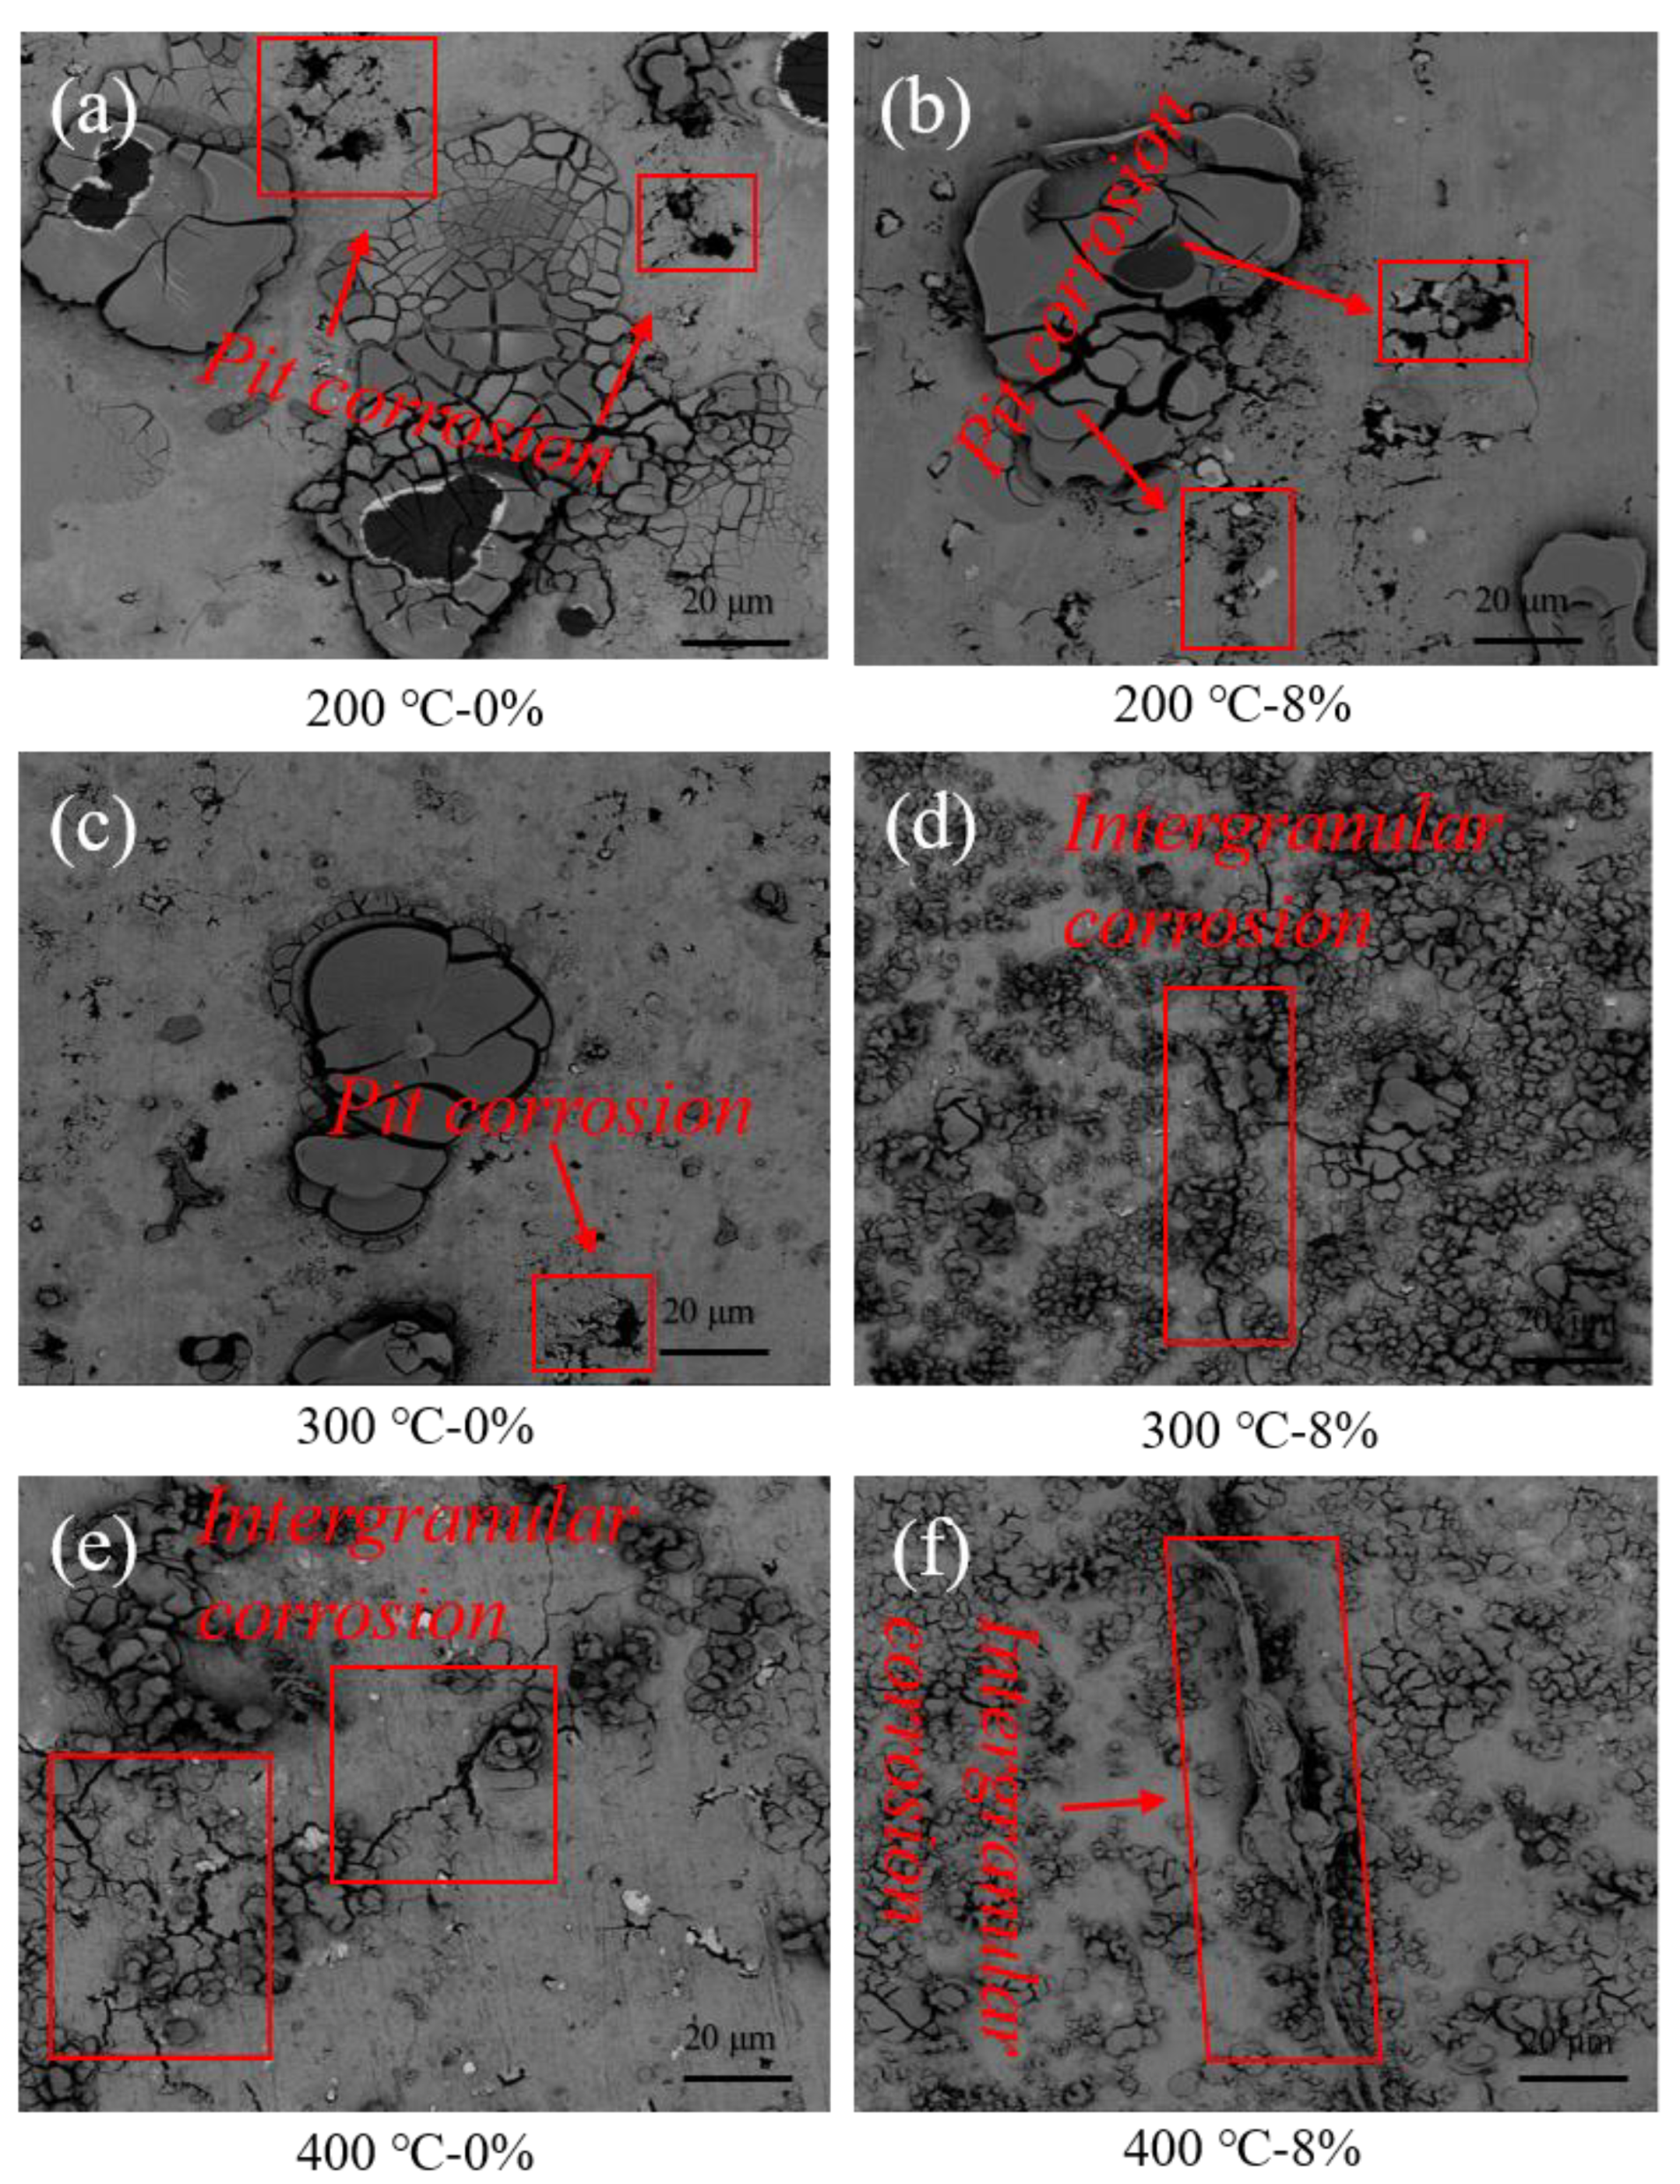
3.2.2. Corrosion Morphology Observation

The precipitated phase particles of aluminum alloy are closely related to corrosion, and are the main cause of corrosion failure. Corrosion of aluminum alloys generally starts from the pitting corrosion [20,21], and the precipitated phase plays an important role in matrix corrosion. Figure 6 presents the corrosion morphology after electrochemical corrosion under SEM. It can be seen that the sample surface has varying degrees of corrosion, the precipitated phase of the 2A12-T4 aluminum alloy is mainly the S phase (Al2CuMg) and θ phase (Al2Cu), in which Cu belongs to inert elements, compared to the aluminum matrix with higher potential, similar to the cathode, leading to the Cu element around the aluminum matrix as the anodic dissolution. As an active element, Mg has a lower potential than the aluminum matrix and forms a potential difference with the aluminum matrix. When the Mg in Al2CuMg dissolves, this leads to the enrichment of Cu in the S phase. At this time, the S phase reforms a new micro-cell with the matrix, thus resulting in matrix dissolution [22].
As shown in Figure 7a, the 2A12 aluminum alloy without thermal strain mainly had three corrosion forms, among which “1” was the corrosion pit formed after the precipitated phase falls off due to matrix dissolution; “2” was the corrosion pit formed after the precipitated phase has not fallen off, but the surrounding corrosion has begun; and “3” was the corrosion pit and residual precipitated phase formed by the precipitated phase not being completely peeled off. The reason for this phenomenon is that the precipitated phase of smaller size, forms a large potential difference with the surrounding matrix under the same corrosion time. Furthermore, under the combination of a large anode and a small cathode, the matrix gives priority to corrosion, leading to the formation of corrosion pits via the peeling of the precipitated phase. Due to the limitation of corrosion time, the larger sized precipitated phases showed the above two morphologies of “2” and “3”, respectively.
Figure 7b shows the corrosion morphology after the corrosion time is prolonged (expressed by “PT”). As there was no precipitated phase around the corrosion pits of “1” above, the potential difference is not big. In addition, the corrosion rate of the matrix near the corrosion pit slowed down, while the precipitated phase in the corrosion morphologies of “2” and “3” began to peel further, resulting in the deterioration of the corrosion degree of the matrix. Therefore, in the case of sufficient corrosion time, the precipitated phase with a small size played a role in slowing down the corrosion of the matrix, while the precipitated phase with a large size aggravated the corrosion of the matrix.
The corrosion of the 2A12-T4 aluminum alloy is not only related to the size of the precipitated phase, but is also closely related to the distribution of the precipitated phase. As shown in Figure 8a, when the thermal cycle peak temperature of the 2A12-T4 aluminum alloy was 200 °C, the surface morphology corrosion form was mainly the pitting corrosion. Meanwhile, after the pre-strain, pitting pits began to gather along the direction of the precipitated phase and tended to crack due to the precipitated phase becoming distributed along the direction of force, as shown in Figure 8b. When the peak temperature was 300 °C, the area of pitting corrosion on the sample surface was reduced, as shown in Figure 8c. This is due to the small number of the precipitated phase. After the peak temperature reached 300 °C and the strain was applied, the corrosion form was mainly intergranular corrosion, as shown in Figure 8d. This is due to the plugging of dislocations at grain boundaries during the tensile process, which in turn, leads to the increase of energy and activity at grain boundaries, and then intergranular corrosion occurred.
For the corrosion surface after the peak temperature of 400 °C, shown in Figure 8e, cracks occur on the surfaces of some areas, along with intergranular corrosion. In addition, the number and density of the precipitated phase increased under this peak temperature and strain, and the trend of the precipitated phase showed increased distribution along the grain boundary, leading to the groove distribution of corrosion pits along the direction of the precipitated phase.

4. Conclusions

In this work, the microstructure evolution and corrosion behavior of the 2A12-T4 aluminum alloy under varying levels of thermal strain were studied, and the link between the two was identified. On the basis of the experimental results, the following conclusions are drawn:
  • The precipitated phase was distributed along the direction of tensile strain, and the grain size coarsened from 152 to 260 µm (even more than 280 µm), after experiencing peak temperatures of 300 and 400 °C.
  • The risk of corrosion for the samples that experienced thermal strain increased compared to those that did not undergo tensile strain. The samples that experienced a peak temperature of 300 °C presented the best corrosion resistance, as the precipitated phase was evenly distributed in the matrix. When the peak temperature was 400 °C and the strain was 8%, the number and density of the precipitated phase increased due to the dynamic recrystallization, and the worsening corrosion resistance of this sample.
  • Dynamic recrystallization occurred in the sample with a peak temperature of 400 °C, and the precipitated phase was mainly distributed along the grain boundaries. This led to the decrease of the corrosion resistance of the grain boundaries, and corrosion developed from pitting corrosion to intergranular corrosion.

Author Contributions

Conceptualization, T.Z. and Y.C.; methodology, J.X.; data curation, H.L.; investigation and writing—original draft preparation, S.Q.; visualization, P.H. All authors have read and agreed to the published version of the manuscript.

Funding

This work was financially funded by the State Key Lab of Advanced Welding and Joining, Harbin Institute of Technology, grant number AWJ-21M17; State Key Lab of Advanced Metals and Materials, grant number 2020-Z04; Natural Science Foundation of Jiangxi Province, grant number 20202BABL214031; Aeronautical Science Foundation of China, grant number 2020Z048056002; and the Graduate Innovation Special Fund Project (provincial level), grant number YC2020-S518.

Conflicts of Interest

The authors declare no conflict of interest.

References

  1. Xu, W.-F.; Ma, J.; Wang, M.; Lu, H.-J.; Luo, Y.-X. Effect of cooling conditions on corrosion resistance of friction stir welded 2219-T62 aluminum alloy thick plate joint. Trans. Nonferrous Met. Soc. China 2020, 30, 1491–1499. [Google Scholar] [CrossRef]
  2. Li, G.; Zhou, L.; Luo, L.; Wu, X.; Guo, N. Microstructural evolution and mechanical properties of refill friction stir spot welded alclad 2A12-T4 aluminum alloy. J. Mater. Res. Technol. 2019, 8, 4115–4129. [Google Scholar] [CrossRef]
  3. Jiang, J.; Zhang, Y.; Wang, Y.; Xiao, G.; Liu, Y.; Zeng, L. Microstructure and mechanical properties of thixoforged complex box-type component of 2A12 aluminum alloy. Mater. Des. 2020, 193, 108859. [Google Scholar] [CrossRef]
  4. Du, C.; Zhao, H.; Dai, Z.; Tian, Z.; Wang, J.; Wang, Z. The preparation and properties of black coating by micro arc oxidation on 2A12 aluminum alloy. Mater. Lett. 2018, 236, 723–726. [Google Scholar] [CrossRef]
  5. Prapas, M.; Jennarong, N.; Woraphot, P. Effect of post-weld heat treatment on microstructure and mechanical properties of friction stir welded SSM7075 aluminum alloy. J. Wuhan Univ. Technol. 2017, 32, 1420–1425. [Google Scholar] [CrossRef]
  6. Sadoun, A.M.; Meselhy, A.F.; Deabs, A.W. Improved strength and ductility of friction stir tailor-welded blanks of base metal AA2024 reinforced with interlayer strip of AA7075. Results Phys. 2020, 16, 102911. [Google Scholar] [CrossRef]
  7. Rajendran, C.; Srinivasan, K.; Balasubramanian, V.; Balaji, H.; Selvaraj, P. Effect of tool tilt angle on strength and microstructural characteristics of friction stir welded lap joints of AA2014-T6 aluminum alloy. Trans. Nonferrous Met. Soc. China 2019, 29, 1824–1835. [Google Scholar] [CrossRef]
  8. Iqbal Perwej, M.; Jain, R.; Pal, S.K. Numerical and experimental study on friction stir welding of aluminum alloy pipe. J. Mater. Process. Technol. 2019, 274, 116258. [Google Scholar] [CrossRef]
  9. Deng, H.; Chen, Y.; Jia, Y.; Pang, Y.; Zhang, T.; Wang, S.; Yin, L. Microstructure and mechanical properties of dissimilar NiTi/Ti6Al4V joints via back-heating assisted friction stir welding. J. Manuf. Process. 2021, 64, 379–391. [Google Scholar] [CrossRef]
  10. Sen, M.; Shankar, S.; Chattopadhyaya, S. Investigations into FSW joints of dissimilar aluminum alloys. Mater. Today Proc 2020, 27, 2455–2462. [Google Scholar] [CrossRef]
  11. Meng, Q.; Liu, Y.; Kang, J.; Fu, R.-D.; Guo, X.-D.; Li, Y.-J. Effect of precipitate evolution on corrosion behavior of friction stir welded joints of AA2060-T8 alloy. Trans. Nonferrous Met. Soc. China 2019, 29, 701–709. [Google Scholar] [CrossRef]
  12. Chen, Y.; Wang, Y.; Zhou, L.; Meng, G.; Liu, B.; Wang, J.; Shao, Y.; Jiang, J. Macro-galvanic effect and its influence on corrosion behaviors of friction stir welding joint of 7050-T76 Al alloy. Corros. Sci. 2019, 164, 108360. [Google Scholar] [CrossRef]
  13. Bocchi, S.; Cabrini, M.; D’Urso, G.; Giardini, C.; Lorenzi, S.; Pastore, T. Stress enhanced intergranular corrosion of friction stir welded AA2024-T3. Eng. Fail. Anal. 2020, 111, 104483. [Google Scholar] [CrossRef]
  14. Bousquet, E.; Poulon-Quintin, A.; Puiggali, M.; Devos, O.; Touzet, M. Relationship between microstructure, microhardness and corrosion sensitivity of an AA 2024-T3 friction stir welded joint. Corros. Sci. 2011, 53, 3026–3034. [Google Scholar] [CrossRef]
  15. Wadeson, D.A.; Zhou, X.; Thompson, G.E.; Skeldon, P.; Djapic Oosterkamp, L.; Scamans, G. Corrosion behaviour of friction stir welded AA7108 T79 aluminium alloy. Corros. Sci. 2006, 48, 887–897. [Google Scholar] [CrossRef]
  16. Wang, W.; Li, T.; Wang, K.; Cai, J.; Qiao, K. Effect of Travel Speed on the Stress Corrosion Behavior of Friction Stir Welded 2024-T4 Aluminum Alloy. J. Mater. Eng. Perform. 2016, 25, 1820–1828. [Google Scholar] [CrossRef]
  17. Yan, J.; Zeng, X.; Gao, M.; Lai, J.; Lin, T. Effect of welding wires on microstructure and mechanical properties of 2A12 aluminum alloy in CO2 laser-MIG hybrid welding. Appl. Surf. Sci. 2009, 255, 7307–7313. [Google Scholar] [CrossRef]
  18. Chen, G.; Fu, X.; Zhao, F.; Zhou, W. Microstructure and mechanical properties of 2A12 aluminum alloy after age forming. Trans. Nonferrous Met. Soc. China 2012, 22, 1975–1980. [Google Scholar] [CrossRef]
  19. Cui, Q.; Yi, D.; Wang, H.; Zhang, J.; Xu, J.; Wang, B. Effects of grain size and secondary phase on corrosion behavior and electrochemical performance of Mg-3Al-5Pb-1Ga-Y sacrificial anode. J. Rare Earths 2019, 37, 1341–1350. [Google Scholar] [CrossRef]
  20. Zhang, S.; Zhang, T.; He, Y.; Liu, D.; Wang, J.; Du, X.; Ma, B. Long-term atmospheric corrosion of aluminum alloy 2024-T4 in coastal environment: Surface and sectional corrosion behavior. J. Alloys Compd. 2019, 789, 460–471. [Google Scholar] [CrossRef]
  21. Chen, M.; Deng, Y.; Tang, J.; Fan, S.; Zhang, X. A study of the crystallographic pitting behavior of Al-0.54Mg-0.66Si aluminum alloy in acidic chloride solutions. Mater. Charact. 2019, 148, 259–265. [Google Scholar] [CrossRef]
  22. Andreatta, F.; Terryn, H.; de Wit, J.H.W. Effect of solution heat treatment on galvanic coupling between intermetallics and matrix in AA7075-T6. Corros. Sci. 2003, 45, 1733–1746. [Google Scholar] [CrossRef]
Figure 1. Sketch of the line intercept method.
Metals 11 00924 g001
Figure 2. Metallographic structure of 2A12-T4 aluminum alloy under the thermal strain condition. (a) Room temperature untreated, E.g. base material; (b) 4% pre-strain was given at room temperature; (c) 8% pre-strain was given at room temperature; (d) Without strain under peak temperature of 200 °C; (e) 4% pre-strain was given at peak temperature of 200 °C; (f) 8% pre-strain was given at peak temperature of 200 °C; (g) Without strain under peak temperature of 300 °C; (h) 4% pre-strain was given at peak temperature of 300 °C; (i) 8% pre-strain was given at peak temperature of 300 °C; (j) Without strain under peak temperature of 400 °C; (k) 4% pre-strain was given at peak temperature of 400 °C; (l) 8% pre-strain was given at peak temperature of 400 °C.
Metals 11 00924 g002
Figure 3. The scanning electron microscopy (SEM) image of the precipitated phase structure of 2A12-T4 aluminum alloy.
Metals 11 00924 g003
Figure 4. Precipitated phase morphology under different thermal strain conditions. (a) 8% pre-strain was given at peak temperature of 200 °C; (b) Without strain under peak temperature of 300 °C; (c) Without strain under peak temperature of 400 °C; (d) 8% pre-strain was given at peak temperature of 400 °C.
Metals 11 00924 g004
Figure 5. Transmission electron microscope (TEM) images of 2A12-T4 aluminum alloy under different thermal strain coupling parameters. (a) Room temperature untreated, e.g., base material; (b) Without strain under peak temperature of 300 °C; (c) Without strain under peak temperature of 400 °C; (d) 8% pre-strain was given at peak temperature of 400 °C.
Metals 11 00924 g005
Figure 6. Potentiodynamic polarization curves of 2A12-T4 aluminum alloy at different thermal strain coupling parameters.
Metals 11 00924 g006
Figure 7. SEM figures of corrosion morphologies at different times. (a) Room temperature untreated, E. g. base material. (1) Corrosion pit formed after the precipitated phase falls off; (2) Corrosion pit formed after the precipitated phase has not fallen off, but the surrounding corrosion has begun; (3) Corrosion pit and residual precipitated phase formed by the precipitated phase not being completely peeled off; (b) Room temperature untreated, E. g. base material, and corrosion time is prolonged.
Metals 11 00924 g007
Figure 8. SEM figures of corrosion morphology. (a) Without strain under peak temperature of 200 °C; (b) 8% pre-strain was given at peak temperature of 200 °C; (c) Without strain under peak temperature of 300 °C; (d) 8% pre-strain was given at peak temperature of 300 °C; (e) Without strain under peak temperature of 400 °C; (f) 8% pre-strain was given at peak temperature of 400 °C.
Metals 11 00924 g008
Table 1. Experimental parameters of thermal cycle. RT: Room temperature.
Peak Temperature (°C)Strain (%)Heating Rate (°C/s)Cooling Rate (°C/s)Peak Temperature Residence Time (s)
RT0, 4,8---
2000, 4, 85051
3000, 4, 85051
4000, 4, 85051
Table 2. Grain size under the thermal strain condition.
Peak Temperature (°C)Grain Size (µm)
RT—0%152.04 ± 1
RT—4%171.05 ± 1
RT—8%177.09 ± 1
200 °C—0%211.84 ± 1
200 °C—4%233.03 ± 1
200 °C—8%245.01 ± 1
300 °C—0%261.04 ± 1
300 °C—4%269.46 ± 1
300 °C—8%275.21 ± 1
400 °C—0%271.55 ± 1
400 °C—4%279.61 ± 1
400 °C—8%282.09 ± 1
Table 3. Composition of the precipitated phase of 2A12-T4 aluminum alloy tested using energy spectrum analysis (EDS).
Element123
w/%x/%w/%x/%w/%x/%
Mg0.670.888.5710.908.3410.70
Al60.4671.9056.1171.2063.2475.36
Si4.234.831.161.28--
Fe14.418.28----
Mn10.195.95----
Cu10.048.1634.1616.6328.4213.94
Table 4. Fitting results of the potentiodynamic polarization curves of the 2A12-T4 aluminum alloy.
Peak Temperature/°CPotential, Ecorr (E/V)Current Density, Icorr (mA·cm2)
RT—0%−0.574012.27
RT—0%−0.577212.51
RT—0%−0.579712.77
200 °C—0%−0.554112.13
200 °C—4%−0.587113.02
200 °C—8%−0.572312.24
300 °C—0%−0.549510.04
300 °C—4%−0.568911.61
300 °C—8%−0.565611.21
400 °C—0%−0.611913.45
400 °C—4%−0.624814.46
400 °C—8%−0.626714.50
Publisher’s Note: MDPI stays neutral with regard to jurisdictional claims in published maps and institutional affiliations.

