4.1. Effect of Dephosphorization Endpoint Temperature on and
In the dephosphorization reaction, the iron oxide in slag acts as the main oxidant for dephosphorization. Therefore, the content of iron oxide in dephosphorization slag has a significant effect on the dephosphorization ability of dephosphorization slag. In this study, it is assumed that all iron oxides in slag exist in the form of FeO, so as to analyze the effect of dephosphorization endpoint temperature on
. It should be noted that the activity of each substance in the dephosphorization slag adopts pure substances as the standard state, and
in the dephosphorization slag is expressed as Equation (3) [
24].
Xi is the mole fraction of oxide
i in dephosphorization slag, and
is the activity coefficient of oxide
i. The percent work uses the regular solution model to calculate
, because this model can avoid the problem that the structure of the silicate anion changes with the number and type of cations and the temperature. In this model, it is assumed that various cations, such as Ca
2+, Fe
2+, Si
4+, and P
5+, are randomly distributed in the O
2- matrix, and O
2- is the common anion of various cations in the melt. According to the interaction energy between cations summarized by Ban-ya [
25],
γFeO can be expressed as Equation (4).
During the dephosphorization process of the converter, as the temperature of the hot metal rises and the dephosphorization reaction proceeds, carbon and phosphorus will undergo a selective oxidation transformation. The selective oxidation reaction of carbon and phosphorus is shown in Equation (5). Namely, when the temperature is lower than the selective oxidation temperature of carbon and phosphorus, the phosphorus in hot metal is preferentially oxidized. At the higher temperature, carbon is preferentially oxidized. The value of
PCO in a selective oxidation reaction of carbon and phosphorus is directly related to the selective oxidation temperature of carbon and phosphorus. Therefore, it is significant to study the relationship between the partial pressure of CO and dephosphorization endpoint temperature in the selective oxidation of carbon and phosphorus for the dephosphorization of hot metal. In this paper,
is used to represent the partial pressure of CO in the selective oxidation of carbon and phosphorus.
Equation (6) is the Gibbs free energy of the carbon and phosphorus selective oxidation reaction (J). Equation (7) is the equilibrium constant expression of the reaction. P
2O
5 in dephosphorization slag adopts pure substance as the standard state.
a[C] and
a[P] represent the activities of carbon and phosphorus in hot metal, respectively. The standard state of the activity of
a[C] and
a[P] in hot metal is 1% mass fraction solution, which conforms to Henry’s law. Therefore,
a[C] and
a[P] can be expressed by Equations (8) and (9).
is expressed as Equation (10).
It should be noted that
is calculated by empirical Equation (11) [
26]. The reason for not using regular solution calculation is that the value of
in the actual slag is too small, usually smaller than 10
−17. [
27] There is an error in the process of converting
to
obtained by the regular solution model, and the obtained
is far from the calculated values in previous studies. [
28,
29,
30] Based on the above reasons, the empirical formula summarized by Turkdogan and Pearson is selected to calculate
[
26], and the activity coefficients of phosphorus and carbon in hot metal can be calculated by Equations (12) and (13).
and
are the interaction coefficients of solute element
i to phosphorus and carbon dissolved in hot metal, respectively. With the progress of the dephosphorization reaction, a part of phosphorus in hot metal is fixed in dephosphorization slag and removed from hot metal. At the endpoint of dephosphorization stage in the double slag converter steelmaking process, it can be regarded that the dephosphorization quasi-equilibrium state is reached under the conditions of lower temperature and lower basicity. The value of
can be calculated by Equations (3) and (4), and the value of
can be calculated by Equations (6)–(13). Considering that
is mainly affected by the basic oxide contents in slag and the dephosphorization endpoint temperature, through the multiple linear regression on
, Equation (14) can be obtained with the regression coefficient R
2 of is 0.97.
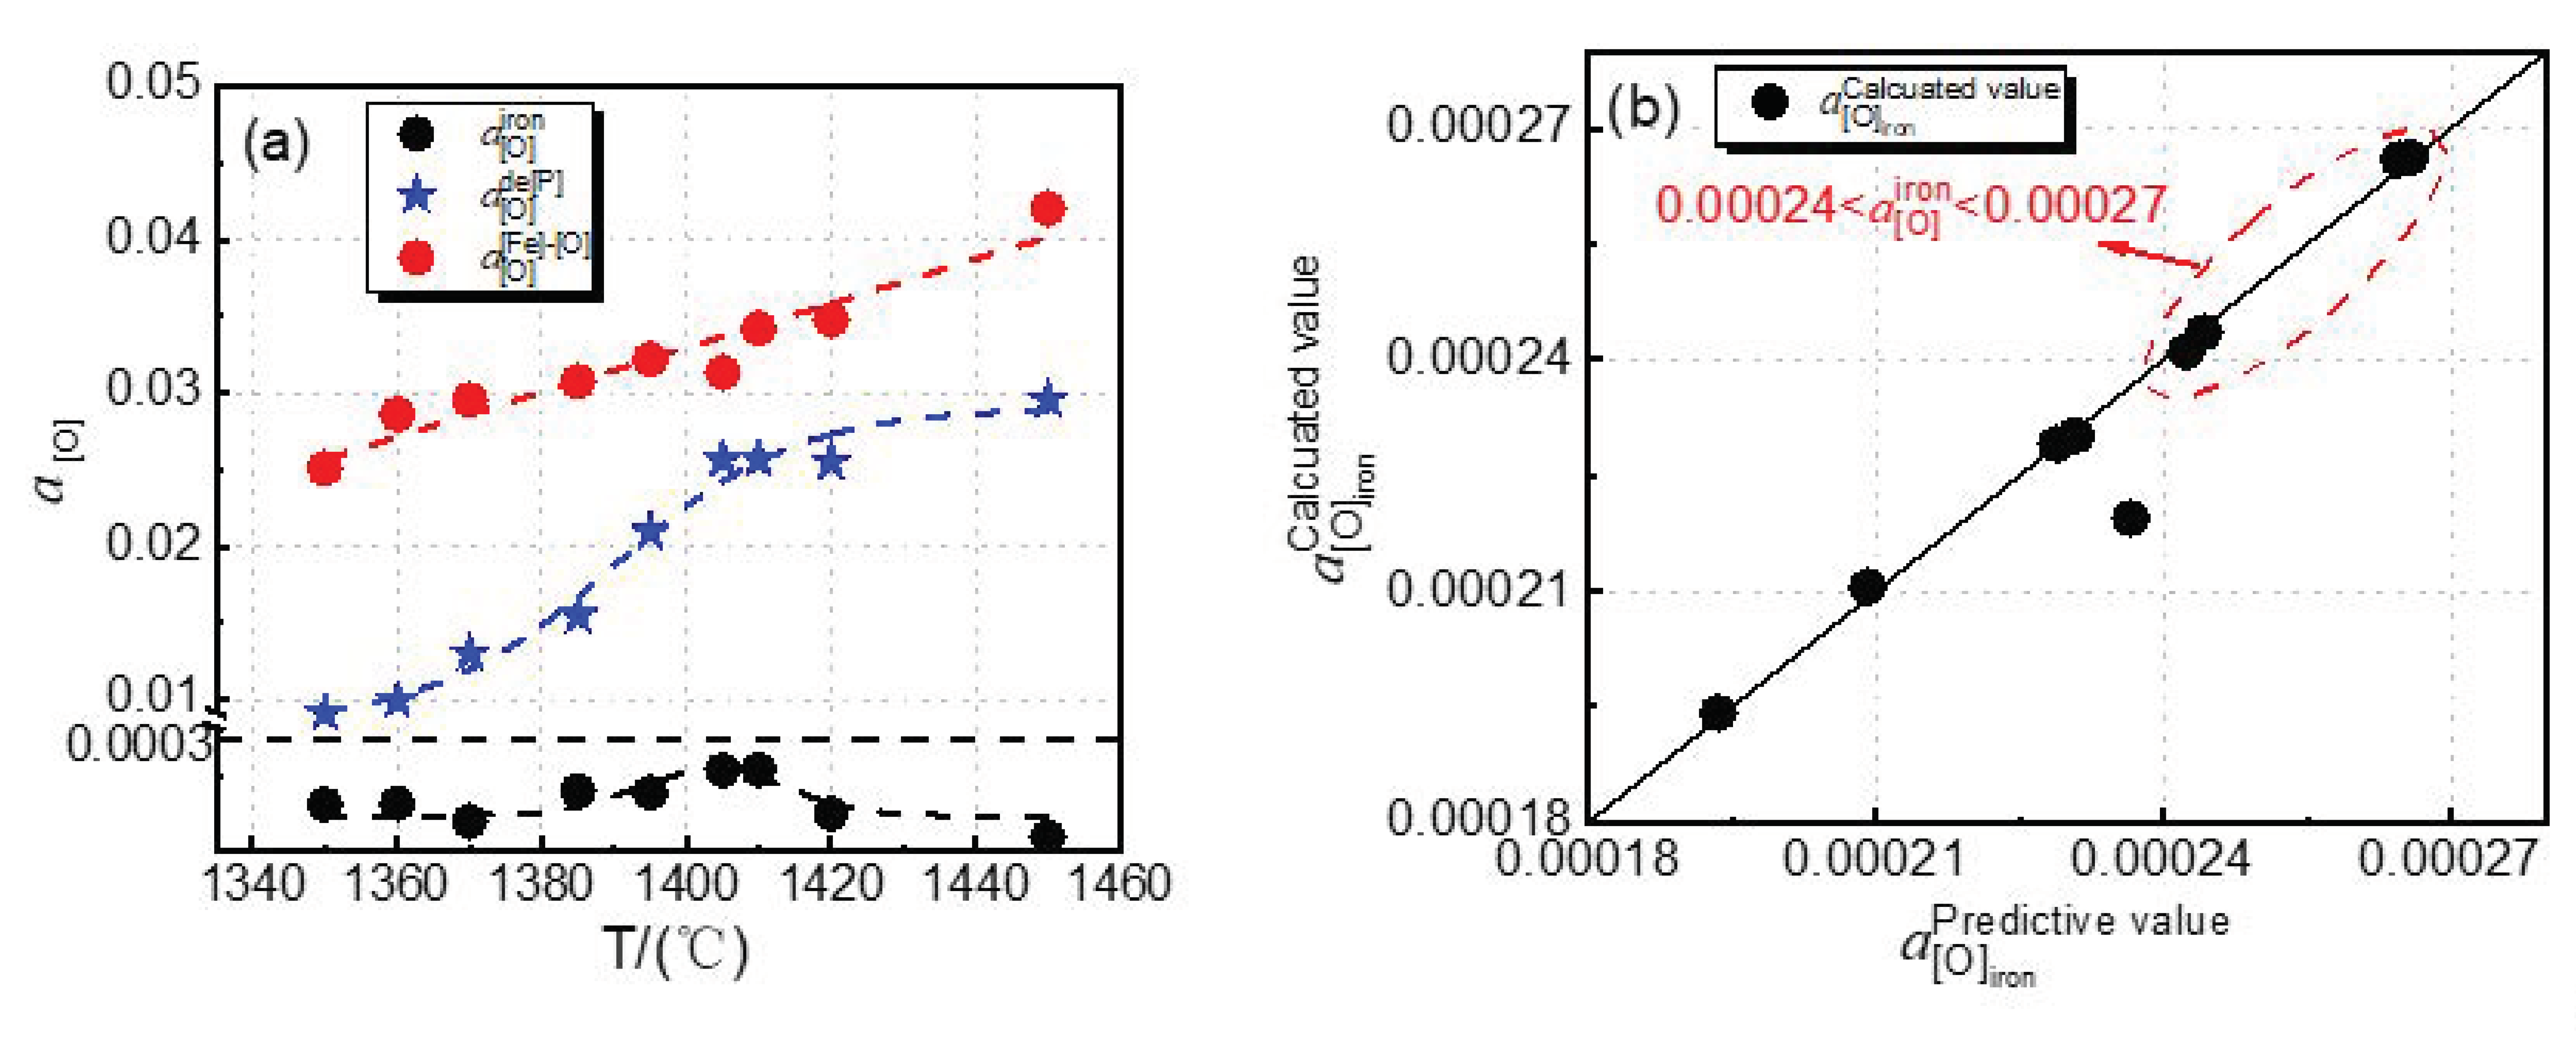
Figure 8a shows the comparison between the predicted value based on multiple regression and the calculated value of
from the regular solution model of Equations (3) and (4). The predicted value is well consistent with the calculated result.
Figure 8b shows the effect of dephosphorization endpoint temperature on
of a selective oxidation reaction of carbon and phosphorus. In
Figure 8b,
data were fitted by an exponential curve, and the regression coefficient, R
2, is 0.98, which indicates that there is a good exponential relationship between the endpoint temperature of dephosphorization and
; the fitting equation is shown in Equation (15). With increasing dephosphorization endpoint temperature,
shows an exponential upward trend.
The blue dashed line area in
Figure 8b shows that the dephosphorization ratio is greater than 55%, and the temperature range is 1385–1410 °C. In this range, the dephosphorization result is preferential, the
value is 53–80 Pa, and
is 0.284–0.312. These two ranges are conducive to the dephosphorization of the converter.
4.2. Effect of Dephosphorization Endpoint Temperature on the Oxygen Activity on Hot Metal Surface, the Phosphorus Oxidation Equilibrium Oxygen Activity, and the Iron Oxidation Equilibrium Oxygen Activity at Slag–Hot Metal Interface
In the converter dephosphorization process, the oxygen in hot metal is mainly used to remove elements such as silicon, manganese, phosphorus, and carbon. Before dephosphorization reaches quasi equilibrium, with the decarburization reaction going on, the carbon in hot metal decreases continuously, and the carbon–oxygen reaction is in the state of excess oxygen. The equilibrium oxygen content in hot metal mainly depends on the carbon content in hot metal [
16]. The carbon–oxygen reaction in the hot metal is shown in Equation (16), the Gibbs free energy of the reaction is expressed by Equation (17), and the equilibrium constant is given by Equation (18). It should be noted that
PCO in Equation (16) is the partial pressure of CO in the converter, and it is assumed to the value of 1 atm. In this paper,
is used to represent the partial pressure of CO in the converter.
Combined with Equations (16)–(18), the theoretical oxygen activity on the surface of hot metal of
can be deduced as shown in Equation (19).
At the slag–hot metal reaction interface, phosphorus in hot metal is oxidized to P
2O
5, which enters slag and exists in the form of C
2S-C
3P solid solution. The oxidative dephosphorization reaction occurs as Equation (20). Equation (21) is the equilibrium constant of dephosphorization reaction obtained by Turkdogan and Pearson [
26], and Equation (22) is the expression of the equilibrium constant.
When the dephosphorization reaction of slag and hot metal reaches quasi equilibrium, by combining Equations (20)–(22), the oxygen activity of phosphorus oxidation at the slag–hot metal interface of
is derived as Equation (23).
The oxygen activity in the slag is mainly determined by the oxygen in the form of iron oxides. This article assumes that all iron oxides exist in the form of FeO, and the slag–hot metal interface reaches the quasi-equilibrium state of oxidation. Therefore, the oxygen activity of iron oxidation at the slag–hot metal interface can be expressed by the iron oxide reaction, as shown in Equation (24). The Gibbs free energy of reaction is shown in Equation (25) [
24], and the equilibrium constant is shown in Equation (26).
The concentration of [Fe] in hot metal is very high, and the value of
a[Fe] is taken as 1. When the iron oxidation reaction at the slag–hot metal interface reaches quasi equilibrium, by combining Equations (3), (4), and (26), the oxygen activity of the iron oxidation at the slag–hot metal interface of
is obtained as shown in Equation (27).
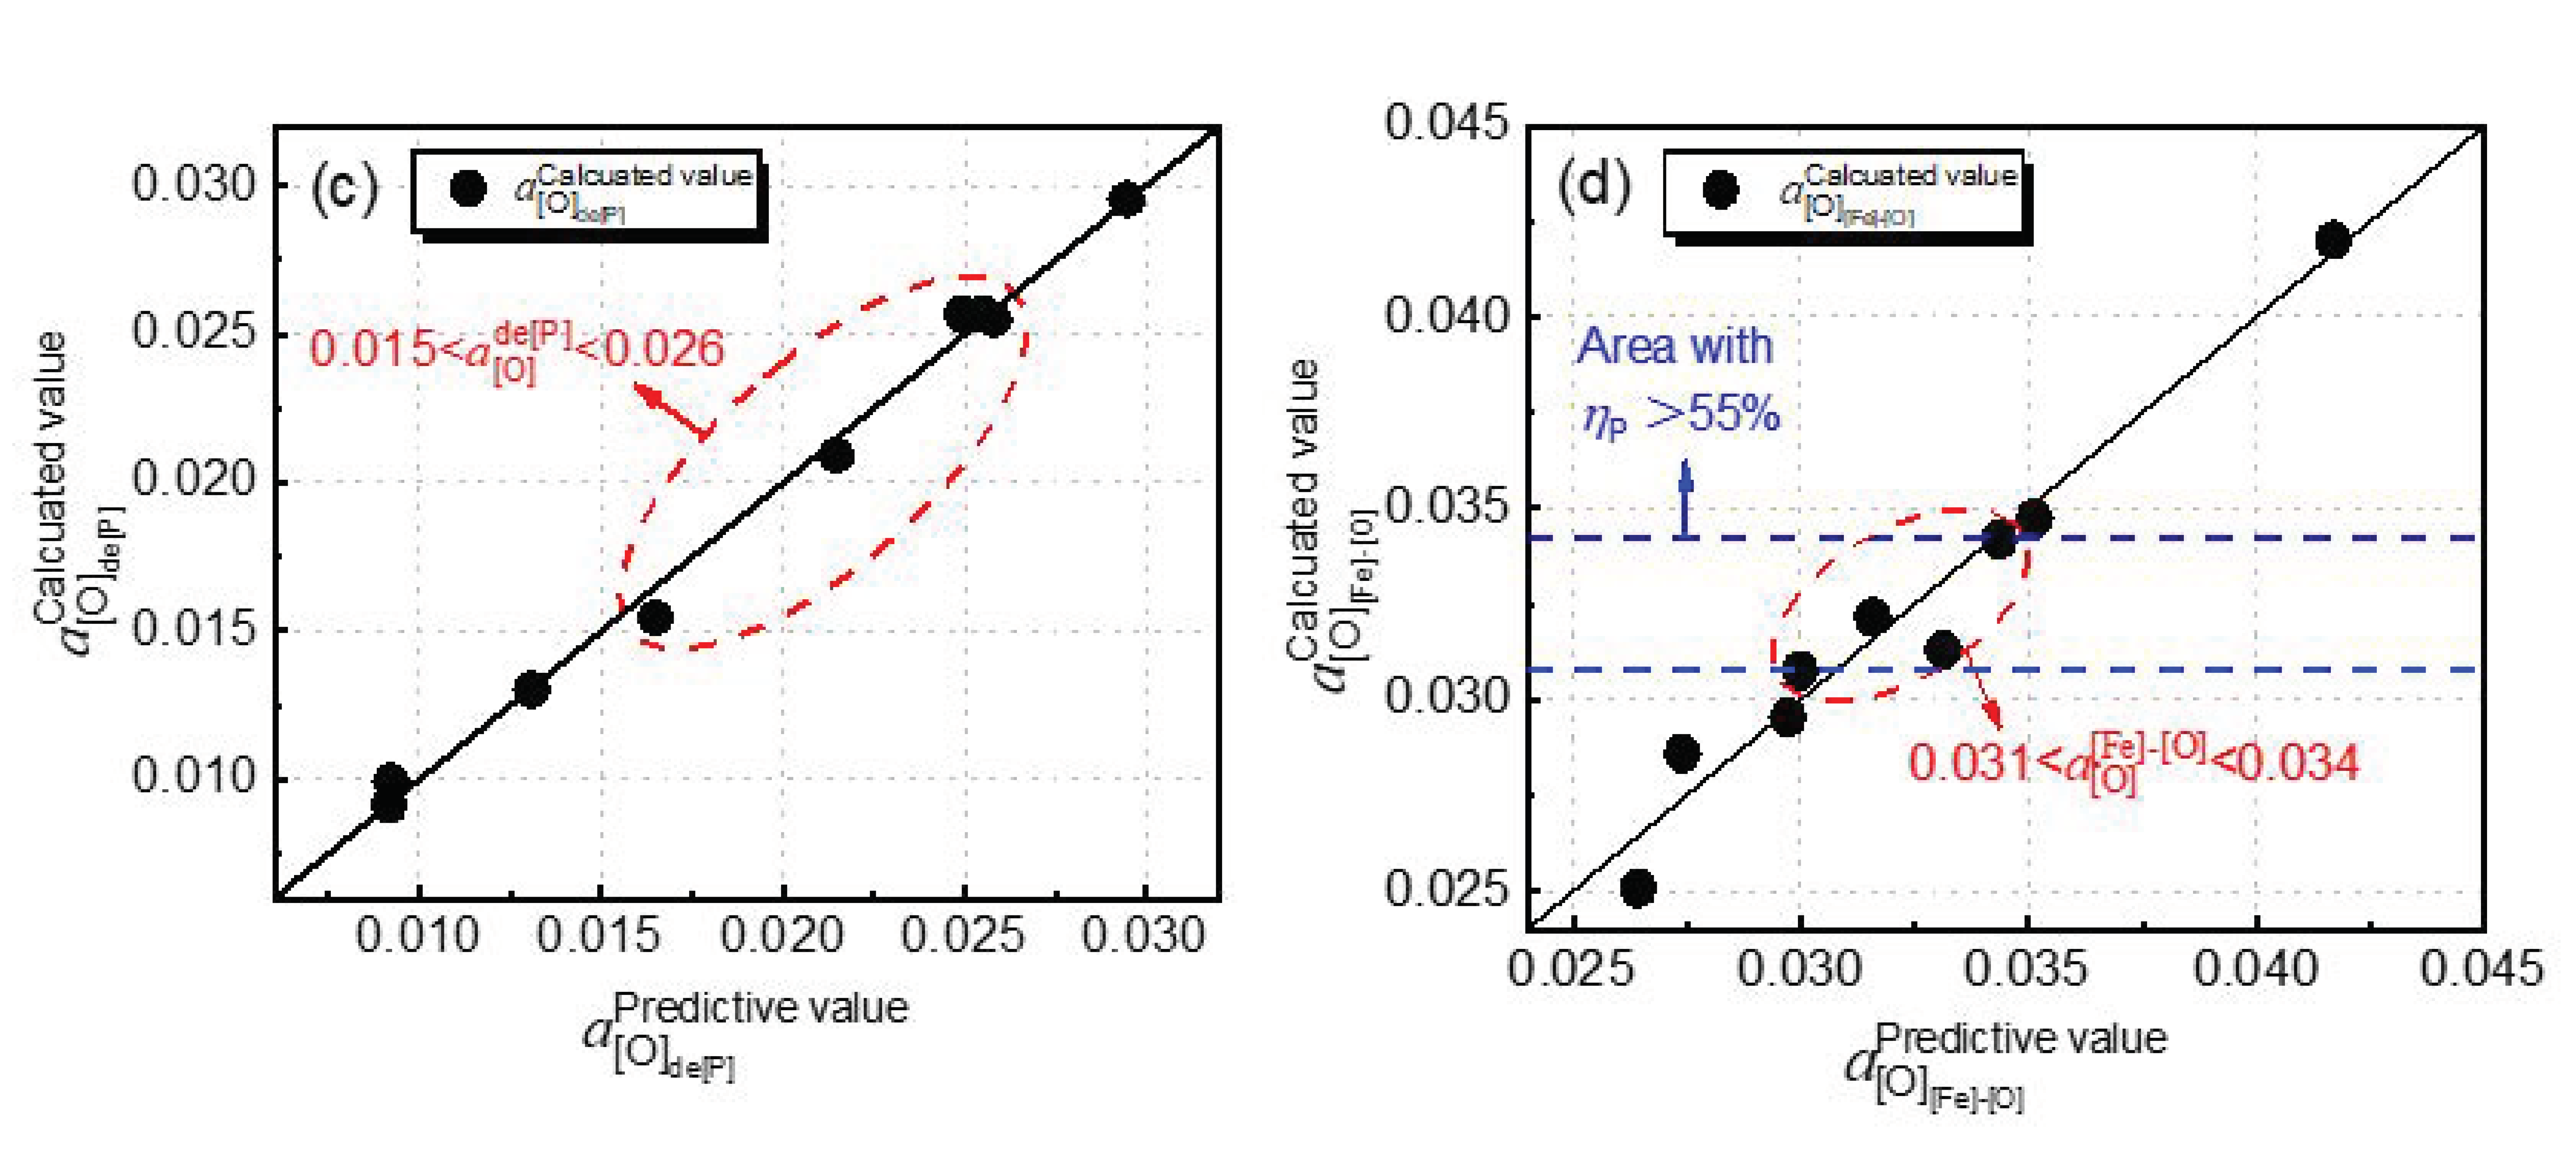
The effect of the dephosphorization endpoint temperature on oxygen activity at different reaction interfaces in the dephosphorization stage of the converter is calculated by using Equations (19), (23), and (27), as shown in
Figure 9a. It can be seen from
Figure 9a that
and
both increase with increasing dephosphorization endpoint temperature as a whole, while
first increases and then decreases. These results can be explained by the thermodynamic principle. The main decarburization reaction in steelmaking is Equation (16), which is an exothermic reaction. With dephosphorization endpoint temperature from 1350 to 1410 °C, the carbon–oxygen product increases; under the condition of little change in carbon content, the
and
increase rapidly [
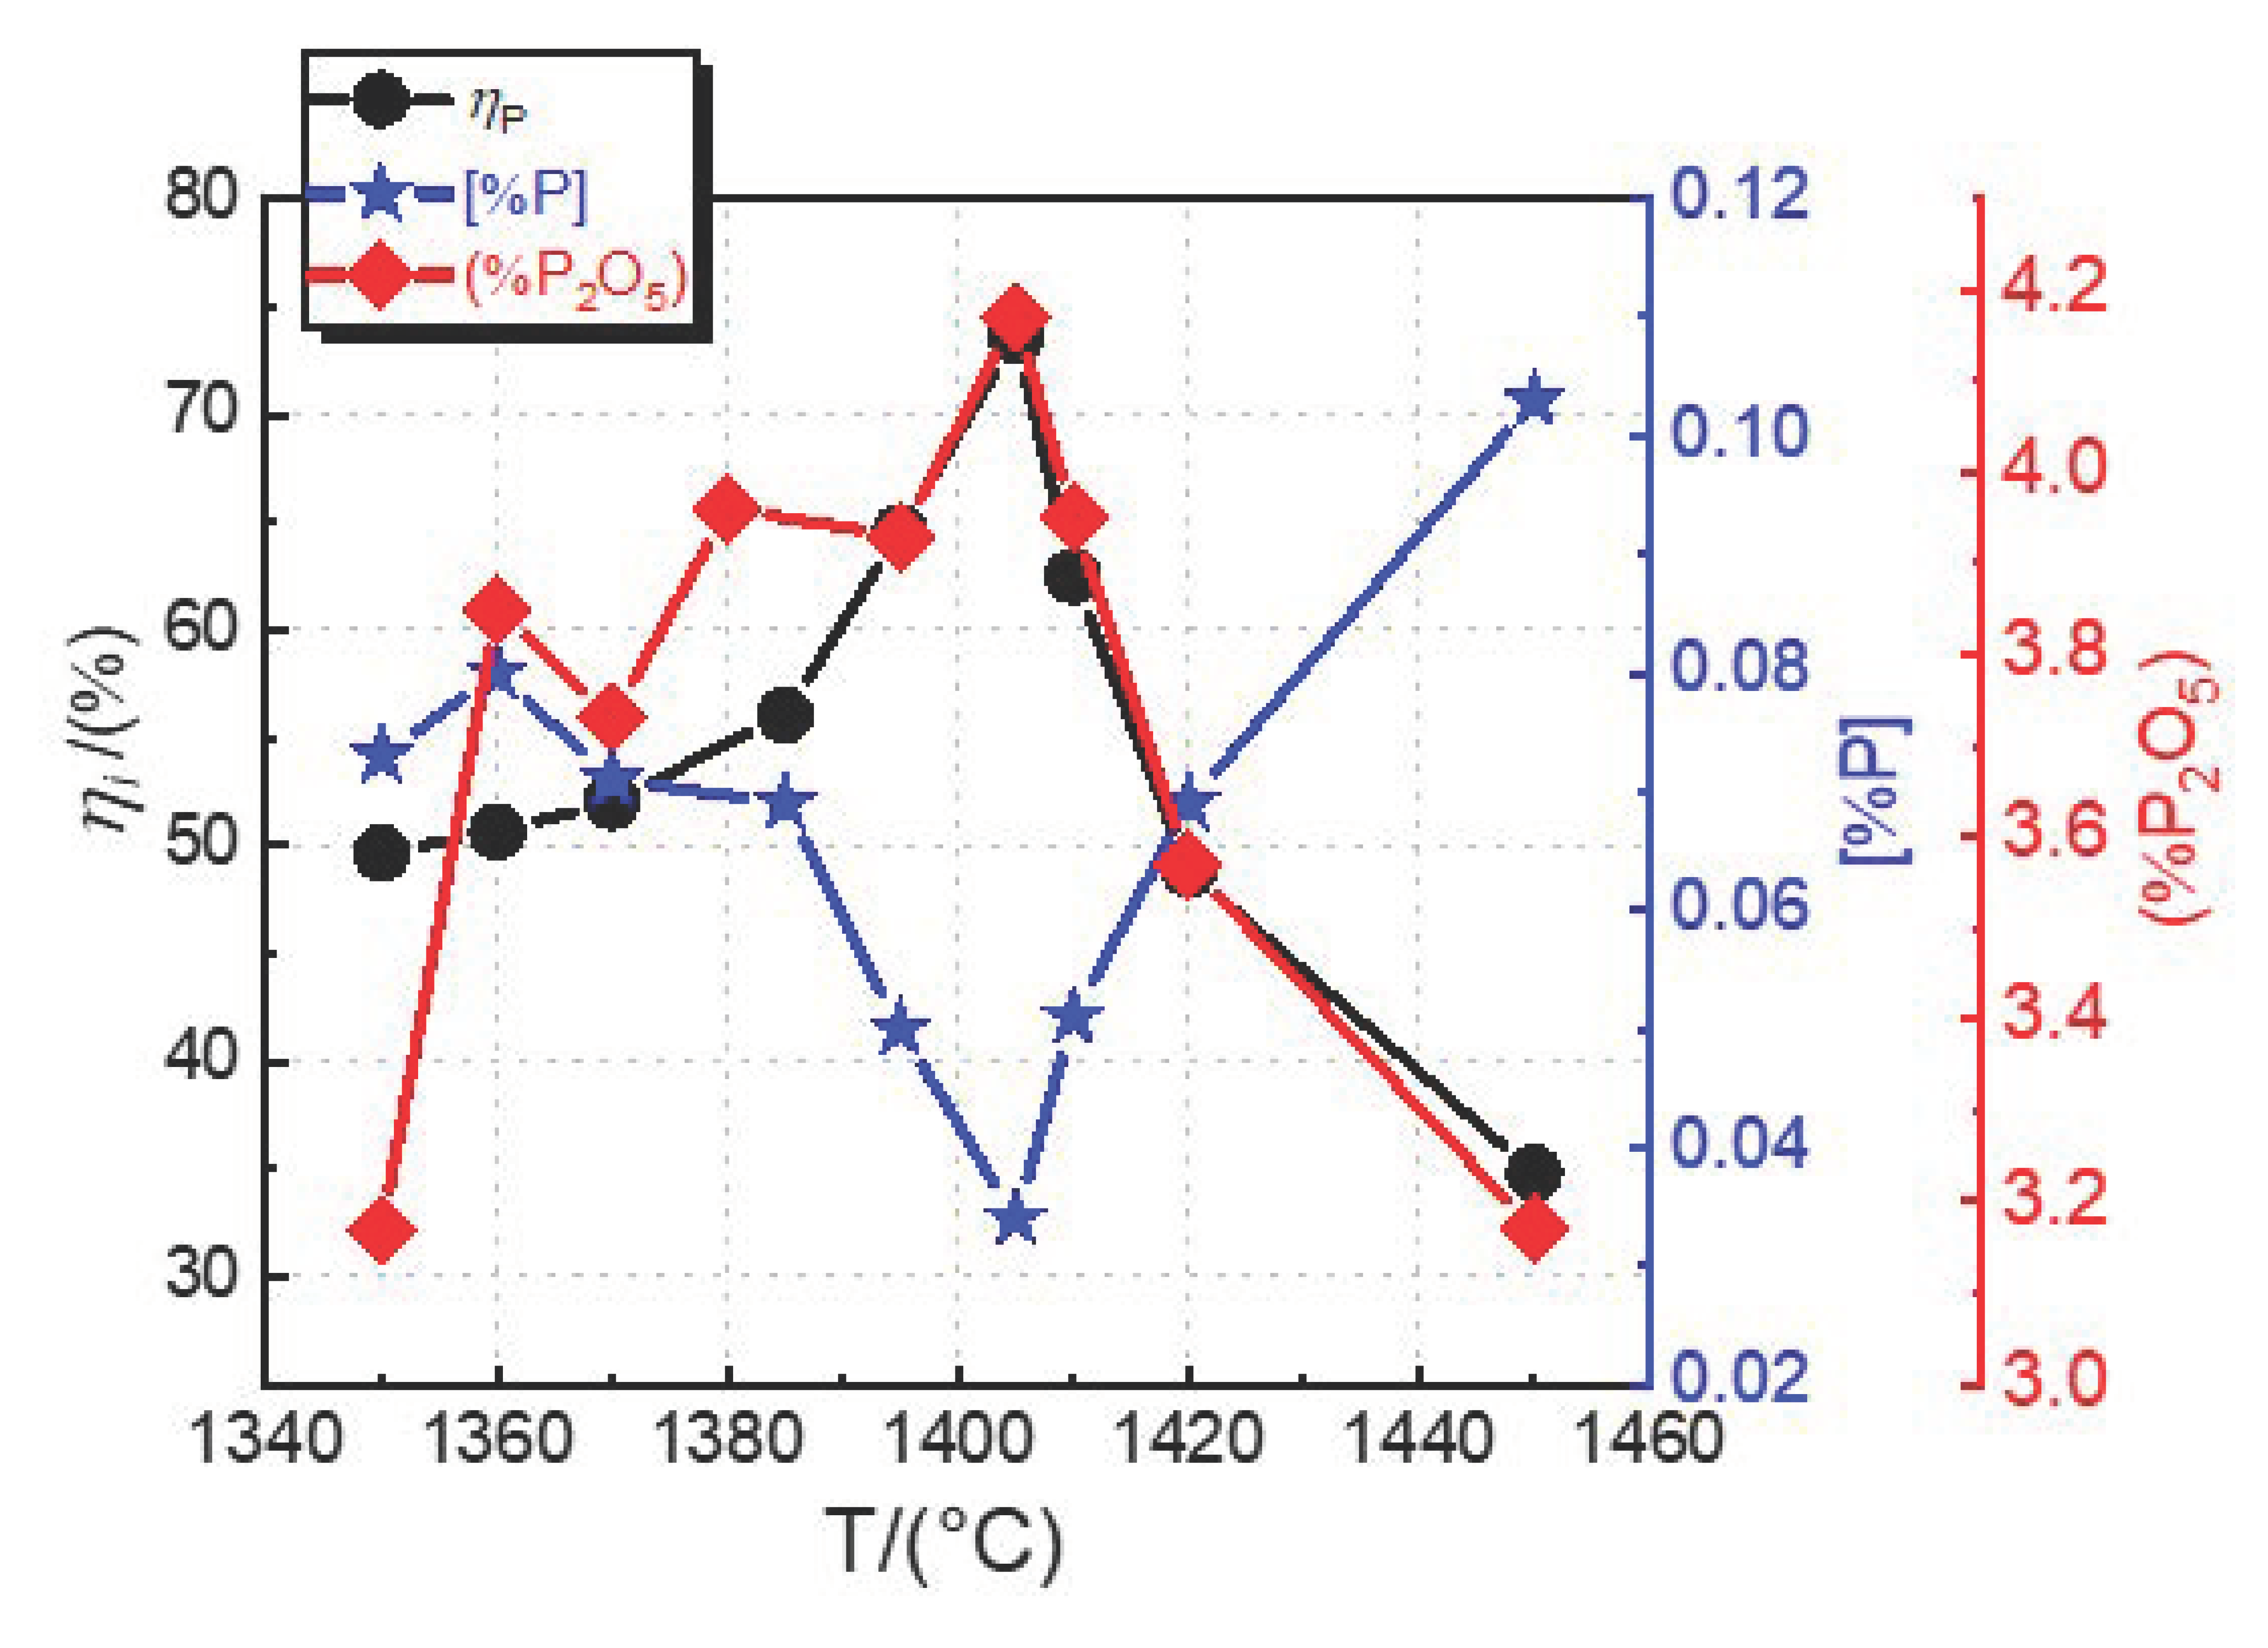
31]. When the dephosphorization endpoint temperature is 1410–1450 °C, the dephosphorization reaction is weakened, the oxygen content of reaction with phosphorus is reduced, the phosphorus content increases from 0.051% to 0.103%, and the carbon content increases from 2.94% to 3.49% in hot metal, so the
decreases, and
increases slowly. Since
is mainly affected by the iron oxide content in slag and temperature,
increases with the increase of temperature when the iron oxide content does not change obviously.
According to the different reaction interfaces of dephosphorization in the converter, the relationships between
,
,
, the dephosphorization endpoint temperature, and the compositions of hot metal and slag are fitted by multiple linear regression, which are expressed as Equations (28)–(30), respectively. It is found that the values of
a[O] calculated by Equations (19), (23), and (27) all have a good multiple linear relationship with the regression coefficients, R
2, of 0.99, 0.97, and 0.96, respectively.
It can be seen from
Figure 9a that the increase trend of
is slightly faster, and the growth trends of
and
are slightly slower in the temperature range of 1350–1405 °C, which indicates that the effect of temperature on the phosphorus oxygen equilibrium of the slag–hot metal interface is relatively large in the temperature range of 1350–1405 °C. The increase trend of
is slightly faster in the temperature range of 1405–1450 °C, which indicates that the temperature has a greater effect on the iron oxygen equilibrium in the slag in temperature range of 1405–1450 °C.
In the range of 1350–1450 °C,
. The results show that
is the highest, while
is the lowest, which is consistent with the research results of Kitamura. [
17] Since there is a large amount of Fe in the dephosphorization process, the oxygen activity at the slag–hot metal interface mainly depends on the oxygen activity in equilibrium with iron. According to the analysis in
Figure 9,
plays a major role in the dephosphorization reaction in the range of 1350–1450 °C. Since the temperature range of the high dephosphorization ratio is 1385–1410 °C,
should be between 0.031 and 0.034.
4.3. Effect of Dephosphorization Endpoint Temperature on Phosphorus Capacity and Phosphorus Distribution Ratio of Dephosphorization Slag
The solubility of phosphorus in molten slag can be expressed by phosphorus capacity, which is an important indicator of the potential dephosphorization capacity of slag. During the dephosphorization process of hot metal, the phosphorus that is oxidized and transferred to slag mainly exists in the form of phosphate ion
. According to the theory of ion dephosphorization, the formation reaction of
is Equation (31) [
32].
Wagner proposed the concept of phosphate capacity
based on the gas–slag equilibrium; the reaction expression is Equation (32), which is expressed as Equation (33) [
33]. Yang et al. [
32,
34] defined the phosphorus capacity index,
, which is based on slag–metal equilibrium. The reaction expression is Equation (31), with
expressed as Equation (34). The deduced relationship between
and
can be expressed as Equation (35), and it can be applicable to any slag system [
34].
In Equations (33) and (34),
is the phosphate content in the slag, and the relationship between
and
is shown in Equation (36) [
32,
34].
Mi represents the molecular weight of oxide
i. The expression of
is obtained by combining Equations (27) and (33)–(36), as shown in Equation (37).
In Equation (37),
a[P] is calculated by Equation (11). Iron oxide is the main oxidant in the dephosphorization process. According to the discussion in
Section 4.2, the oxygen activity in the slag is mainly determined by the oxygen activity of the iron oxidation equilibrium at slag–hot metal interface. Therefore,
a[O] in Equation (37) is calculated by using
in Equation (27).
The empirical formulas for calculating
are listed in
Table 5, where
represents the optical basicity of the slag, which is expressed as Equation (38).
xi is the mole fraction of cations in oxide
i, which is expressed as Equation (39).
ni is the number of oxygen atoms in oxide
i and
x’
i is the mole fraction of oxide
i.
Table 6 lists the optical basicities of various oxides [
28].
.
Figure 10 shows the comparison of
between the calculated value of the empirical formulas and the calculated value in this paper at different dephosphorization endpoint temperatures.
in
Figure 10 is calculated by Equation (37) and different empirical formulas in
Table 5. It can be concluded that the calculated values of
from the empirical formulas of Maruoka et al. [
35], Selin et al. [
36], and Sobandi et al. [
37] all decrease with increasing dephosphorization endpoint temperature, and the changing trend is similar, which is consistent with the thermodynamic result that the increase in temperature is not conducive to the dephosphorization of hot metal. The calculated values of
from Yang’s empirical formula do not change with the increasing dephosphorization endpoint temperature significantly. This is because Yang et al. [
28] mainly studied the effect of dephosphorization slag basicity on phosphorus capacity, and the optical basicity plays a decisive role in their empirical formula. The calculated values of
in the present work show a trend of first decreasing, then increasing, and then decreasing again. The value of the calculated results at 1385–1410 °C in the present work are consistent to those of Yang et al. [
24]. This is because the experimental temperature, dephosphorization slag basicity, and composition in the present work are similar to the experimental temperature of 1380 °C, slag basicity of 1.40–1.83, and slag compositions of CaO-MnO-MgO-SiO
2-P
2O
5-Fe
tO-Al
2O
3 in their paper, and they did the laboratorial experiments based on the double slag steelmaking process.
The calculated results in the present work are smaller than those calculated by the empirical formulas, which become smaller when the temperature is increased. This is because most of the formulas in
Table 6 are the results of laboratory equilibrium under ideal experimental conditions. However, the dephosphorization reaction has not reached equilibrium value due to the short time of dephosphorization in the industrial experiment, which is only about 5 min. Therefore, the
value calculated in the percent work is smaller than those calculated by empirical formulas.
From Equations (12), (27), and (37), Equation (40) of the phosphorus distribution ratio log
LP based on the oxygen activity of iron oxidation equilibrium at the slag–hot metal interface can be deduced as follows:
Figure 11 shows the comparison of log
LP between the calculated values of the empirical formulas and the calculated values in this paper at different dephosphorization endpoint temperatures. The values of log
LP in
Figure 11 are calculated by Equation (40) and the different empirical formulas in
Table 7. According to
Figure 11, all empirical formulas indicate that the values of log
LP show a downward trend at first, then an upward trend around 1405 °C, and then a downward trend again with increasing dephosphorization endpoint temperature. The log
LP value calculated by the Ogawa formula is the closest to the calculated results in the present paper. It is noticed that between 1395 and 1410 °C, the log
LP values calculated by the Ogawa formula are consistent with the calculated values in the present work. This is because the Ogawa formula is based on the formula summarized in the dephosphorization stage of the typical double slag converter steelmaking process—the MURC process. Therefore, the temperature and basicity used in the Ogawa formula are similar to those in the present paper. In addition, the effect of the higher [%C] content in hot metal on
LP is taken into consideration, so that it is suitable for the dephosphorization of hot metal with the higher carbon content in the dephosphorization stage of the present work. This is consistent with our previous results on the double slag converter steelmaking process [
4].
It can be seen from
Figure 11 that with the increasing dephosphorization endpoint temperature, the calculated results in the present work show log
LP first rising and then decreasing obviously, which is consistent with the changing trend of the dephosphorization ratio in
Figure 3. When the dephosphorization endpoint temperature is in the range of 1350–1405 °C, with increasing temperature, the auxiliary materials such as lime and dolomite are easy to melt, so that the kinetic conditions of dephosphorization are improved. Although increasing temperature is unfavorable to the thermodynamic conditions of dephosphorization, the overall
LP still increases, and the dephosphorization result shows an upward trend. When the endpoint temperature of dephosphorization exceeds 1405 °C, with further increasing the temperature, the equilibrium constant of the dephosphorization reaction decreases greatly, and the dephosphorization ratio decreases, resulting in a decrease in
LP.
The calculated values of log
LP in the present work are closer to the empirical formula values of Ogawa et al. [
1], but they are lower than the empirical formula values of the others, because the empirical formulas of Healy et al. [
38], Suito et al. [
39], Usui and Yamada et al. [
41], and Zhang et al. [
42] were from an equilibrium dephosphorization reaction under laboratorial experiments and not for the double slag process. The empirical formula of Kawai et al. [
40] was from the industrial experiments but not for the double slag process. The empirical formula of Ogawa et al. [
1] was for the double slag process. However, their dephosphorization times were up to 8 min, and their experiments were carried out in an 8 t converter so that the dephosphorization reaction could be carried out close to the equilibrium results. According to the results in
Figure 11, the optimum dephosphorization temperature is in the range of 1385–1410 °C and the optimum log
LP value is in the range of 1.76–2.09.
4.4. Effect of Dephosphorization Endpoint Temperature on Dephosphorization, Rephosphorization, and the Optimum Temperature of Deslagging
According to previous scholars on the double slag converter steelmaking industrial experimental research, it is necessary to study the optimum temperature of intermediate deslagging theoretically [
18,
43,
44]. As the desiliconization and dephosphorization reactions proceed, the converter temperature increases gradually. Since phosphorus in hot metal is oxidized by FeO and reduced by carbon at the same time, combining the dephosphorization reaction Equation (41) of oxidation of P by FeO and the rephosphorization reaction Equation (42) of the reduction of P
2O
5 by C, the coupling dephosphorization reaction among FeO, C, and P can be obtained as Equation (43). The Gibbs free energy expression of the reaction is taken from the literature [
18]. Equation (46) is obtained from Equations (44) and (45).
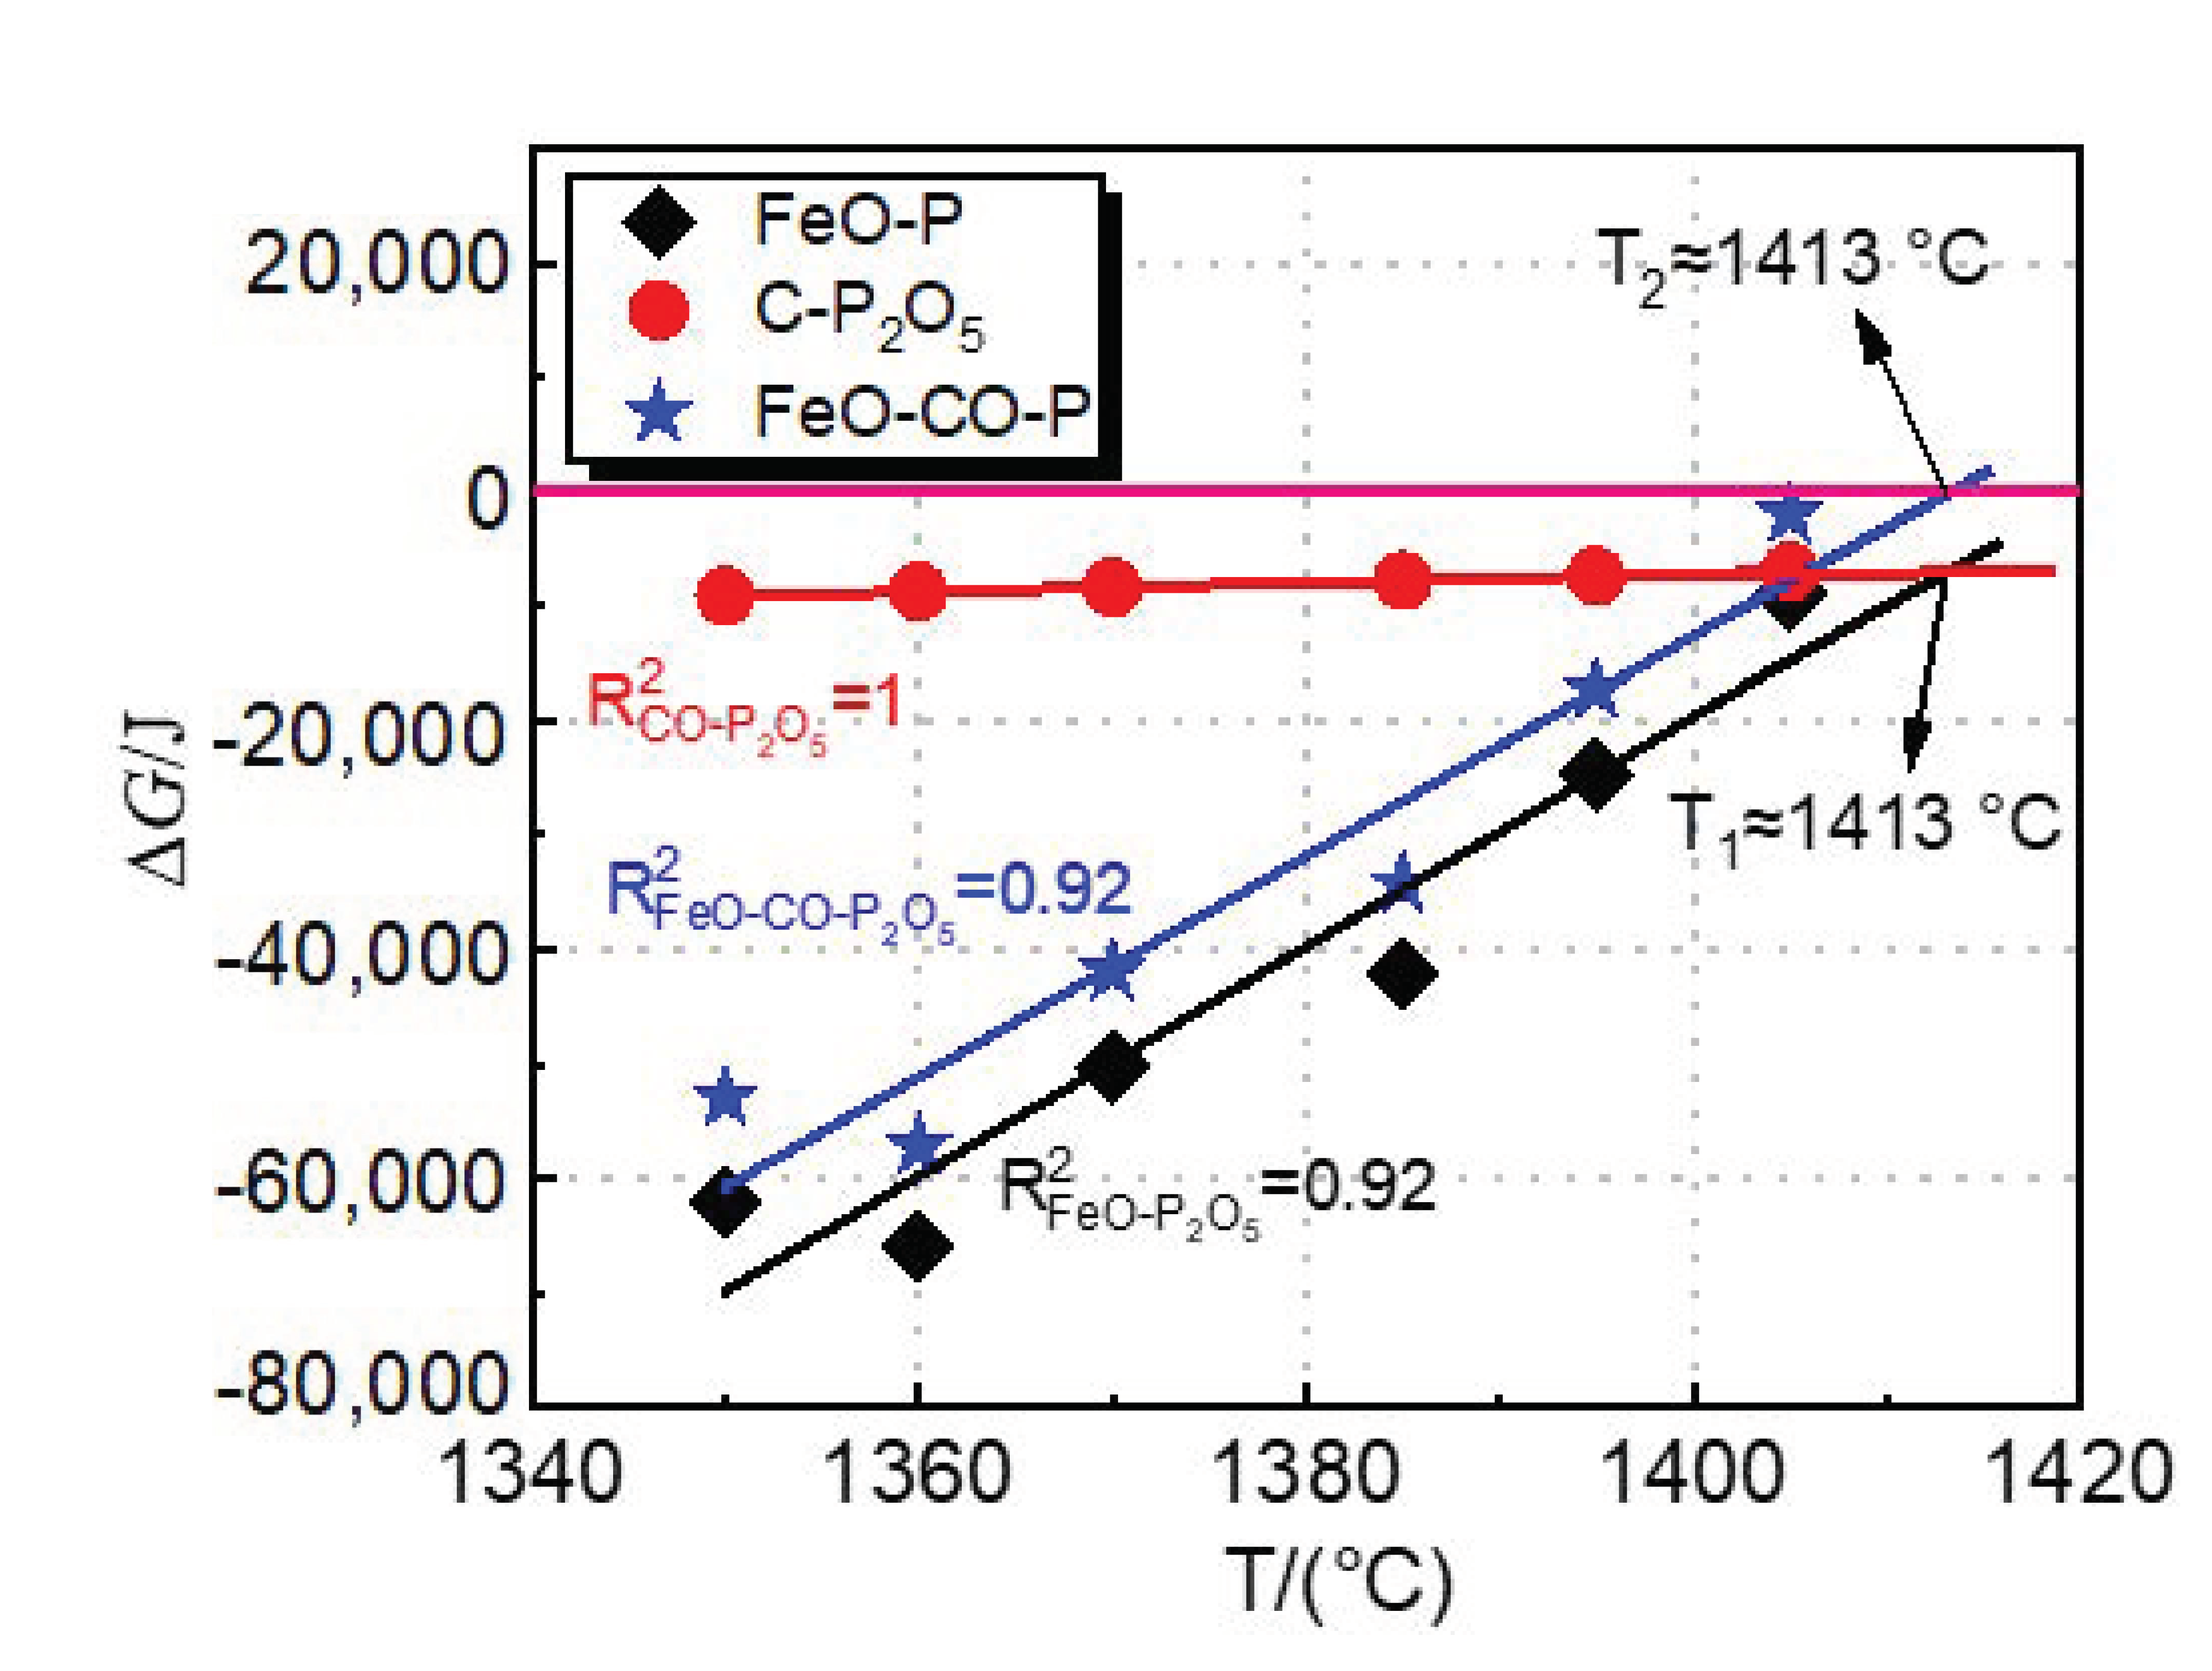
Figure 12 shows the effect of dephosphorization endpoint temperature on the actual Gibbs free energy (
) changes of FeO-P, C-P
2O
5, and FeO-CO-P reactions. The
values of the three reactions of FeO-P, C-P
2O
5, and FeO-CO-P are calculated from Equations (44)–(46), where
is calculated from Equations (10) and (11),
is calculated by Equations (6)–(13),
,
and
are calculated by Equations (8), (9), and Equations (3) and (4), respectively.
It can be seen from
Figure 12 that the
values of FeO-P and C-P
2O
5 are both smaller than 0, which means that in the dephosphorization stage with the temperature in the range of 1350–1405 °C, both the dephosphorization reaction of phosphorus oxidation by FeO and rephosphorization reaction of reduction of P
2O
5 by carbon occur. With the increasing dephosphorization endpoint temperature, the
value of the C-P
2O
5 reaction does not change significantly, which indicates that temperature has little effect on rephosphorization in 1350–1405 °C.
The values of the three reactions are linearly fitted with the dephosphorization endpoint temperature, with the regression coefficients, R2, are 0.92, 0.99, and 0.92, respectively. The fitting line of the C-P2O5 value and the fitting line of the FeO-P value cross when T1 is about 1413 °C, which means the oxidation of phosphorus by FeO and the reduction of P2O5 by carbon are in dynamic equilibrium at this temperature. At the temperature lower than 1413 °C, dephosphorization and rephosphorization reactions are carried out simultaneously in the converter, and the trend of dephosphorization reaction is greater than that of rephosphorization. When the temperature is higher than T1, the trend of the rephosphorization reaction in the converter will be greater than that of the dephosphorization reaction, resulting in the rephosphorization of hot metal.
Figure 12 also shows the result of Equation (46) obtained by coupling Equations (44) and (45), as shown by the blue line in the
Figure 12. The
value of the FeO-CO-P reaction increases with the increasing dephosphorization endpoint temperature. When the temperature
T2 exceeds 1413 °C, the
is greater than 0. The trend of rephosphorization in the FeO-CO-P coupling dephosphorization reaction is greater than that of dephosphorization.
It can be seen from
Figure 12 that the temperature
T2 at which the
value of the FeO-CO-P reaction is 0 is the same as
T1. It shows that the FeO-CO-P coupled dephosphorization reaction is equivalent to combining the dephosphorization reaction and the rephosphorization reaction. Considering the experimental results and thermodynamic calculation results of industrial experiments by the double slag dephosphorization process, the optimal temperature range for intermediate deslagging is about 1400–1420 °C.


 and
and 


