Article

A Methodology to Determine the Effective Plastic Zone Size Around Blunt V-Notches under Mixed Mode I/II Loading and Plane-Stress Conditions

1
Fracture Research Laboratory, Faculty of New Science and Technologies, University of Tehran, Tehran 1439957131, Iran
2
Department of Aerospace, Physics, and Space Sciences, Florida Institute of Technology, Melbourne, FL 32901, USA
3
Laboratory of Materials Science and Engineering (LADICIM), University of Cantabria, E.T.S. de Ingenieros de Caminos, Canales y Puertos, Av/Los Castros 44, 39005 Santander, Spain
*
Authors to whom correspondence should be addressed.
Metals 2021, 11(7), 1042; https://doi.org/10.3390/met11071042
Submission received: 10 May 2021 / Revised: 18 June 2021 / Accepted: 23 June 2021 / Published: 29 June 2021

Abstract

:
The determination of the ductile failure behavior in engineering components weakened by cracks and notches is greatly dependent on the estimation of the plastic zone size (PZS) and, particularly, the effective plastic zone size (EPZS). Usually, time-consuming complex elastic–plastic analyses are required for the determination of the EPZS. Such demanding procedures can be avoided by employing analytical methods and by taking advantage of linear elastic analyses. In this sense, this work proposed a methodology for determining the PZS around the tip of blunt V-notches subjected to mixed mode I/II loading and plane-stress conditions. With this aim, firstly, existing approximate mathematical expressions for the elastic stress field near round-tip V-notches reported in the literature are presented. Next, Irwin’s approach (fundamentally proposed for sharp cracks) and a yield criterion (von Mises or Tresca) were applied and are presented. With the aim of verifying the proposed methodology, elastic–plastic finite element analyses were performed on virtual AISI 304 steel V-notched specimens. It was shown that the analytical formulations presented cannot estimate the complete shape of the plastic zone. However, the EPZS, which is crucial for predicting the type of ductile failure in notched members, can be successfully estimated.

1. Introduction

The resistance of structures against failure is defined by their load-carrying capacity (LCC), which may be affected by stress risers such as notches of various shapes (e.g., blunt V-notches). When dealing with non-linear engineering materials (e.g., most metallic alloys), ductile failure criteria depend on the yielding behavior of the notched structure, which can be analyzed through the plastic zone size (PZS) and, alternatively, the effective plastic zone size (EPZS) at the tip of the notch. This EPZS is defined as the size of the plastic zone in a direction perpendicular to the maximum principal stress (MPS). Numerous works have been developed in previous decades analyzing the PZS for cracks and notches, some of which are presented below.
Larsson and Carlsson [1] determined the PZS at the crack tip under plane-strain conditions and improved their solution by considering the effects of T-stress on their calculations. Subsequently, the effect of T-stress on the crack tip plastic zone was studied in [2]. Afterwards, Yeh et al. [3] investigated the PZS in isotropic and anisotropic materials by using various failure criteria, and their results were compared with the results obtained in [1,2]. In 2012, Sousa et al. [4] estimated the PZS and showed that T-stress improvements are limited to medium nominal stress to yield strength ratios.
Some researchers used the Dugdale model for the estimation of PZS in cracks [5,6,7,8]. For instance, Petroski [9] used weight functions and proposed a new technique requiring only a single elastic stress intensity factor (SIF) and the elastic stress field in the un-cracked body. Another technique was used in [10], in which, with proper crack-dislocation density functions, the singularity was cancelled and the Dugdale PZS was determined. Additionally, the PZS of a Dugdale crack interacting with a circular inclusion was studied in [11].
Since analytical methods are relatively easier and faster than numerical elastic–plastic finite element (FE) methods for studying and determining the PZS, they have been used extensively in the literature for various crack types and conditions, from estimating PZS in a penny-shaped crack embedded in a transversely isotropic medium [12] to investigating the effects of the T-stress on PZS [13,14]. Kiselev and Rivkin [15] used the von Mises yield criterion to analytically study the dependence of the size of the plastic zone on the type of stress state. Chang and Ohr [16] formulated an integral equation to inspect the effects of thickness on PZS. Rogowski [17] proposed a formula considering plane strain conditions to predict the size of the plastic zone in a cracked thin elastic–plastic layer sandwiched between two ideal elastic adherents. This researcher ultimately verified the suggested equations by FEM calculations. Zhang et al. [18] analytically studied the plastic zone size of a stiffened panel with several collinear cracks. They used the weight function method, displacement compatibility, and superposition principle to derive the suggested equations, and, finally, the results were compared to those achieved from FE analysis and the literature.
Sometimes, the mathematical expressions in analytical studies of the PZS become rather long. In these cases, the best way to solve these equations is by writing a code. Bernahou et al. [19] used von Mises and Tresca yield criteria and wrote a code to analytically estimate the PZS at a crack tip under pure mode I, pure mode II, and mixed mode I/II loading conditions. Shi [20] proposed a highly accurate solution procedure to describe the interaction effect among the doubly periodic rectangular-shaped arrays of cracks and studied the interaction effects among the periodic cracks on the PZS and the crack tip opening displacement (CTOD). Many studies have also been undertaken attempting to improve Irwin’s model [21,22] or, based on Irwin’s approach, to gain a better estimation of PZS [23]. In 2016, Teimoori and Faal [24] used Irwin’s approach for the assessment of the PZS for interacting cracks in a circular plane subjected to anti-plane deformation. Regarding 3D analysis of cracks, Caputo et al. [25], proposed for the first time an analytical solution for determining the PZS in short cracks. Some other investigations worth mentioning herein concerning the 3D analysis of the PZS at the crack neighborhood have been reported in [26,27,28].
As already mentioned, FE analysis has also been used for the calculation of the PZS around the crack tip (e.g., [29,30]). Since experimental studies generally require substantial funding, FE analysis has been used for purposes like the validation of the analytical methods or the investigation about the effects of certain factors on the shape and size of the plastic zone. Kudari et al. [31] used elastic–plastic FE analyses in various specimens to assess the shape and size of the plastic zone ahead of the crack tip and compared the results with those derived from the J-integral. Bouiadjra et al. [32] studied, by utilizing non-linear FE analyses, the effect of the presence of micro-cavities ahead of the crack tip on the shape and size of the plastic zone. In 2010, Yi et al. [33] used the maximum crack opening displacement (MCOD) to suggest a new method for estimating the PZS at the crack tip. To determine the relationship between PZS and MCOD, they used FE simulation to obtain a series of PZS and MCOD values. Marques et al. [34] employed 3D elastic and elastic–plastic FE analyses to numerically predict the size, shape, and volume of the plastic zone in modified cracked specimens under pure mode I and mixed mode I/II loading conditions.
Many factors can influence the shape and size of the plastic zone. For example, the influence of deformation anisotropy, the elastic mismatch, and the tension along a crack on the plastic zone in an anisotropic body have been reported in [35,36,37], respectively. Alongside analytical and numerical methods for determination of the size and shape of the plastic zone, experimental studies have also been performed. A number of PZS measurement techniques have been reviewed or employed in [38,39,40,41].
Regarding the plastic zone and its effects on fractures under cyclic loading conditions, many studies have been conducted by various researchers (e.g., [42,43]). For instance, Besel and Breitbarth [44] coupled 3D finite element simulation with experimental results and studied different types of plastic zones generated at the tip of a crack under cyclic loading in a commercial aluminum alloy AA2024-T3. They concluded that their suggested approach of combining experimental and numerical results can offer a practical basis for the quantitative energy-based analysis of the damage accumulation process ahead of a crack tip in elastic–plastic materials under cyclic loading conditions.
Concerning the PZS in the vicinity of notches, Dugdale [45] investigated yielding at the end of a slit in a sheet and obtained a relation between the extent of plastic yielding and the applied external load. Pratap and Pandey [46] proposed a modified Smith’s model that can be used for the assessment of the PZS in elliptical and circular notches under plane-strain conditions. Youshi et al. [47] evaluated the PZS for cracks originating from a circular or an elliptical notch by using the Dugdale strip yield concept. Chatterjee [48,49] estimated the PZS in notched specimens under pure mode II loading conditions, in order to choose the specimen dimensions. Moreover, Shi and Puls [50] used the modified Neuber’s solution together with the slip-line theory to evaluate the maximum tensile stress and the PZS at a shallow notch under plane-strain and mode I loading conditions. Similar to [3], Yeh et al. [51] conducted research on the effect of the T-stress on the damage zone size prediction of notched laminated composites, reaching similar results. Torabi [52] presented some useful equations for obtaining the first and the second estimation (i.e., the Irwin estimation) of the size of the plastic zone along the bisector line of a blunt V-notch under mode I loading and plane-stress conditions, based on the Tresca yield criterion. In addition, the PZS at the neighborhood of V- and U-shaped notches under various loading conditions has been assessed in [53,54,55,56] by utilizing elastic-plastic FE analysis. Additionally, Gomez and Torabi [57] employed the equivalent material concept (EMC) together with a failure criterion to predict the failure of U-notched components in elastic–plastic materials. Torabi and Shahbazian [58] have recently proposed some explicit formulas for estimating the PZS in V- and U-shaped notches under pure mode I loading and plane-stress/strain conditions, based on the von Mises and Tresca yield criteria. They have utilized Irwin’s approach and achieved the second estimation of the PZS in such notches. They have also suggested [59] a semi-analytical approach from which the EPZS in U-shaped notches under mixed mode I/II loading can be determined.
Even though PZS can be determined by elastic–plastic FE analysis, this analysis may be complex and lengthy. This is why in this investigation the effective plastic zone size (EPZS) was analytically estimated and applied for the comprehension of the ductile failure regime in the vicinity of round-tip V-notches subjected to mixed mode I/II loading and plane-stress conditions. With this, firstly, the equations of the elastic stress field around the tip of blunt V-notches, together with the notch stress intensity factors (NSIFs) in mixed mode I/II loading are reported. Then, the elastic stress components were substituted into the von Mises and Tresca yield criteria to obtain the boundary of the plastic zone around the notch border. Next, the second estimation of the PZS was calculated by extending Irwin’s approach (initially proposed for sharp cracks under pure mode I loading) to blunt V-notches under mixed mode I/II loading. Finally, the validation of the proposed formulas was performed by means of elastic–plastic FE analyses. This investigation revealed that, for most of the cases being studied, the EPZSs can be obtained from the proposed closed-form solutions, with a good accuracy while avoiding time-consuming elastic–plastic analyses.

2. Elastic Stress Field and Plastic Zone Size at the Tip of Blunt V-Notches

2.1. Linear Elastic Stress Field for Round-Tip V-Notches under Mixed Mode I/II Loading

Filippi et al. [60] suggested an approximate closed-form expression for the linear–elastic stress distributions around a blunt V-notch under mixed mode I/II conditions (see Figure 1). As depicted in Figure 1, the origin of both the Cartesian and polar reference frames is located at the distance r0 behind the notch tip on the notch bisector line. The resulting equations in the polar coordinate system are the following:
σ θ θ ( r ,   θ ) = K I V , ρ 2 π r 1 λ 1 [ f θ θ ( θ ) ( I ) + ( r r 0 ) μ 1 λ 1 g θ θ ( θ ) ( I ) ] + K II V , ρ 2 π r 1 λ 2 [ f θ θ ( θ ) ( II ) + ( r r 0 ) μ 2 λ 2 g θ θ ( θ ) ( II ) ]
σ rr ( r ,   θ ) = K I V , ρ 2 π r 1 λ 1 [ f rr ( θ ) ( I ) + ( r r 0 ) μ 1 λ 1 g rr ( θ ) ( I ) ] + K II V , ρ 2 π r 1 λ 2 [ f rr ( θ ) ( II ) + ( r r 0 ) μ 2 λ 2 g rr ( θ ) ( II ) ]
σ r θ ( r ,   θ ) = K I V , ρ 2 π r 1 λ 1 [ f r θ ( θ ) ( I ) + ( r r 0 ) μ 1 λ 1 g r θ ( θ ) ( I ) ] K II V , ρ 2 π r 1 λ 2 [ f r θ ( θ ) ( II ) + ( r r 0 ) μ 2 λ 2 g r θ ( θ ) ( II ) ]
where σθθ, σrr, σ, KIV,ρ, and KIIV,ρ are the tangential stress, the radial stress, the in-plane shear stress, and the mode I and the mode II notch stress intensity factors (NSIFs), respectively. The superscript V means that the notch is of a V-shape, and the superscript ρ indicates that the tip of the V-notch is round and not sharp. The functions fij(θ) and gij(θ) alongside the eigenvalues λi and µi, which depend on the notch opening angle (2α), are reported in Appendix A. The parameters q and r0 can be obtained from the following equations:
q = 2 ( π α ) π
r 0 = π 2 α 2 π 2 α ρ
where ρ is the notch tip radius. The NSIFs can be calculated by employing the following equations:
K I V , ρ = 2 π ( σ θ θ ) θ = 0 r 1 λ 1 1 + ω 1 ( r r 0 ) μ 1 λ 1
K II V , ρ = 2 π ( σ r θ ) θ = 0 r 1 λ 2 1 + ω 2 ( r r 0 ) μ 2 λ 2
where ω1 and ω2 are two auxiliary parameters (see Appendix A). If their values are known, the NSIFs can be obtained from Equations (8) and (9) [61]:
K I V , ρ = 2 π σ θ θ ( r 0 , 0 ) r 0 1 λ 1 1 + ω 1
K II V , ρ = lim r r 0 2 π σ r θ ( r , 0 ) r 1 λ 2 1 ( r r 0 ) μ 2 λ 2    
Here, it should be noted that when r is equal to r0 Equation (9) becomes singular.

2.2. Formulation of the Plastic Zone in the Vicinity of Round-Tip V-Shaped Notches

2.2.1. Formulation Based on the von Mises Yield Criterion and under Plane-Stress Conditions

The von Mises yield criterion (also known as the maximum distortion energy criterion) can be written as:
( σ 1 σ 2 ) 2 + ( σ 2 σ 3 ) 2 + ( σ 3 σ 1 ) 2 = 2 σ Y 2
where σY is the yield strength of material and σ1, σ2, and σ3 are the three principal stresses. Under plane-stress conditions, where σ3 is zero, Equation (10) is simplified to:
σ 1 2 + σ 2 2 σ 1 σ 2 = σ Y
The two principal stresses σ1 and σ2 in Equation (11) can be acquired from the two-dimensional Mohr’s circle as:
σ 1 , σ 2 = σ θ θ + σ rr 2 ± [ ( σ θ θ σ rr 2 ) 2 + σ r θ 2 ] 1 2
Now, note that the stress components σθθ, σrr, and σ in Equation (12) are given in Equations (1)–(3), respectively, for the case of blunt V-notches. To calculate the plastic zone size (PZS) based on the von Mises yield criterion under mixed mode I/II loading and plane-stress conditions, first, Equations (1)–(3) should be substituted into Equation (12), obtaining the two principal stresses (i.e., σ1 and σ2). Then, these two stresses should be entered in Equation (11). Here, it should be noted that in the final form of Equation (11) r should be replaced by rY, which is the first estimation of the PZS in the vicinity of a round-tip V-notch, at any angular coordinate θ, and under the mentioned loading and stress conditions. Moreover, it is worth mentioning that by a simple coding in a proper software (e.g., MATLAB), all of these calculations can be performed conveniently and rapidly. In addition, it is crucial to understand that the corresponding values of the NSIFs, KIV,ρ and KIIV,ρ, can be computed by a linear elastic FE analysis on the V-notched component being analyzed.

2.2.2. Formulation Based on the Tresca Yield Criterion and under Plane-Stress Conditions

The Tresca yield criterion (also known as the maximum shear stress criterion) can be expressed as:
max ( | σ 1 σ 2 | , | σ 2 σ 3 | , | σ 3 σ 1 | ) = σ Y
Likewise in the von Mises yield criterion, the principal stresses σ1 and σ2 can be obtained from Equation (12). By presuming that σ3 = 0 (i.e., plane-stress conditions), and that σ1 ≥ σ2, three different conditions may occur:
First, σ1 ≥ σ2 ≥ 0. In this case, the Tresca yield criterion becomes:
σ1 = σY
Second, σ1 ≥ 0 ≥ σ2. Then, Equation (13) can be written as:
σ1 − σ2 = σY
Third, 0 ≥ σ1 ≥ σ2. On this occasion, Equation (13) can be written as:
σ2 = σY
Similarly to Section 2.2.1, herein, the first estimation of the PZS based on the Tresca yield criterion under mixed mode I/II loading and plane-stress conditions can be obtained by substituting the principal stresses σ1 and σ2 (derived from Equation (12)) into Equations (14)–(16), where r must be replaced by rY (the first estimate of the PZS). Although the final resulting equations may be formally complex, a simple coding in well-known software may easily solve them.

2.3. Second Estimation of the Plastic Zone Size (PZS)

By extending Irwin’s approach from sharp cracks subjected to pure mode I loading [62] to round-tip V-notches subjected to mixed mode I/II loading, the second estimation of the plastic zone size for blunt V-notches was obtained and presented here. Irwin’s approach ignores the effects of the material strain-hardening in the formation of the plastic zone. Hence, the tensile behavior of a ductile material is simplified by assuming an elastic perfectly plastic model (EPPM). Figure 2a shows a typical true tensile stress–strain curve of an elastic–plastic (ductile) material. In this figure, the parameters σY, σf, and εf are the yield strength, the true fracture stress, and the strain-to-failure, respectively. To simplify this curve into an elastic perfectly plastic model, a curve like that shown in Figure 2b needs to be drawn in such a way that the area under the curve is equal to the area under the curve of Figure 2a. In addition, the elastic parts of both curves and the value of εf should be identical. This means that the value of σ0 (the average flow stress) in Figure 2b will always be greater than the value of σY in Figure 2a. Note that, generally, in Irwin’s model σ0 is used instead of σY.
The elastic tangential stress (σθθ) distribution on a blunt V-notch bisector line versus the distance from the notch tip is schematically shown in Figure 3. As stated before, the strain-hardening is neglected. For this reason, the stress does not rise to any values greater than σY, meaning that the effect of zone A in Figure 3 should be taken into consideration by redistributing it into region B.
This can be done by means of Equation (17), which is suitable for round-tip V-notches and is derived analogically from Irwin’s equation for sharp cracks.
r = r 0 r = r Y σ θ θ ( r , θ ) dr = ( r P r 0 ) σ Y
where σθθ(r,θ) is the tangential stress at any arbitrary θ angle, and rp is the second estimation of the PZS. In Equation (17), rY and r0 are known, whereas rp and θ are unknown. rY can be obtained from solving Equation (11) or Equations (14)–(16) according to the von Mises and Tresca yield criteria, respectively; r0 can be calculated from Equation (5). Moreover, by considering any arbitrary value of θ, the second estimation of the PZS inside the material can be determined in that specified direction. This makes it much easier to compare the present analytical results and the numerical results obtained from the FE analyses. Evidently, obtaining the shape and size of the plastic zone around the notch round border relies on the determination of the PZS at various θ angles. Another important issue regarding Equation (17) that needs to be discussed is the proper stress term to be used. Note that in Equation (17), when using any yield criterion the stress term that reaches the material yield strength should be used instead of σθθ(r,θ). Here, when analyzing blunt V-notches under mixed mode I/II loading and plane-stress conditions, and applying the von Mises and Tresca yield criteria, the left hand side of Equations (11) and (14) to (16) should be employed instead of σθθ(r,θ), respectively.

3. Verification of the Proposed Formulations

3.1. Verification in the Particular Case of Sharp Cracks

To the authors’ best knowledge, the proposed approach has not yet been suggested in the literature, and thus, it is new. Hence, its validation and verification seem necessary. There are no available solutions for the plastic zone geometry in V-notches. However, the shape and the size of the plastic zone around sharp cracks for both the von Mises and Tresca yield criteria (under mixed mode I/II loading and plane-stress conditions) have been well studied in the literature (e.g., see [63]). Therefore, the proposed approach will be applied to this particular case, something that implies considering that both the (2α) and the notch tip radius (ρ) are equal to zero. In [63], the ratio of the mode II stress intensity factor (SIF) to the mode I SIF (Kr1) was defined as:
Kr 1 = K II K I
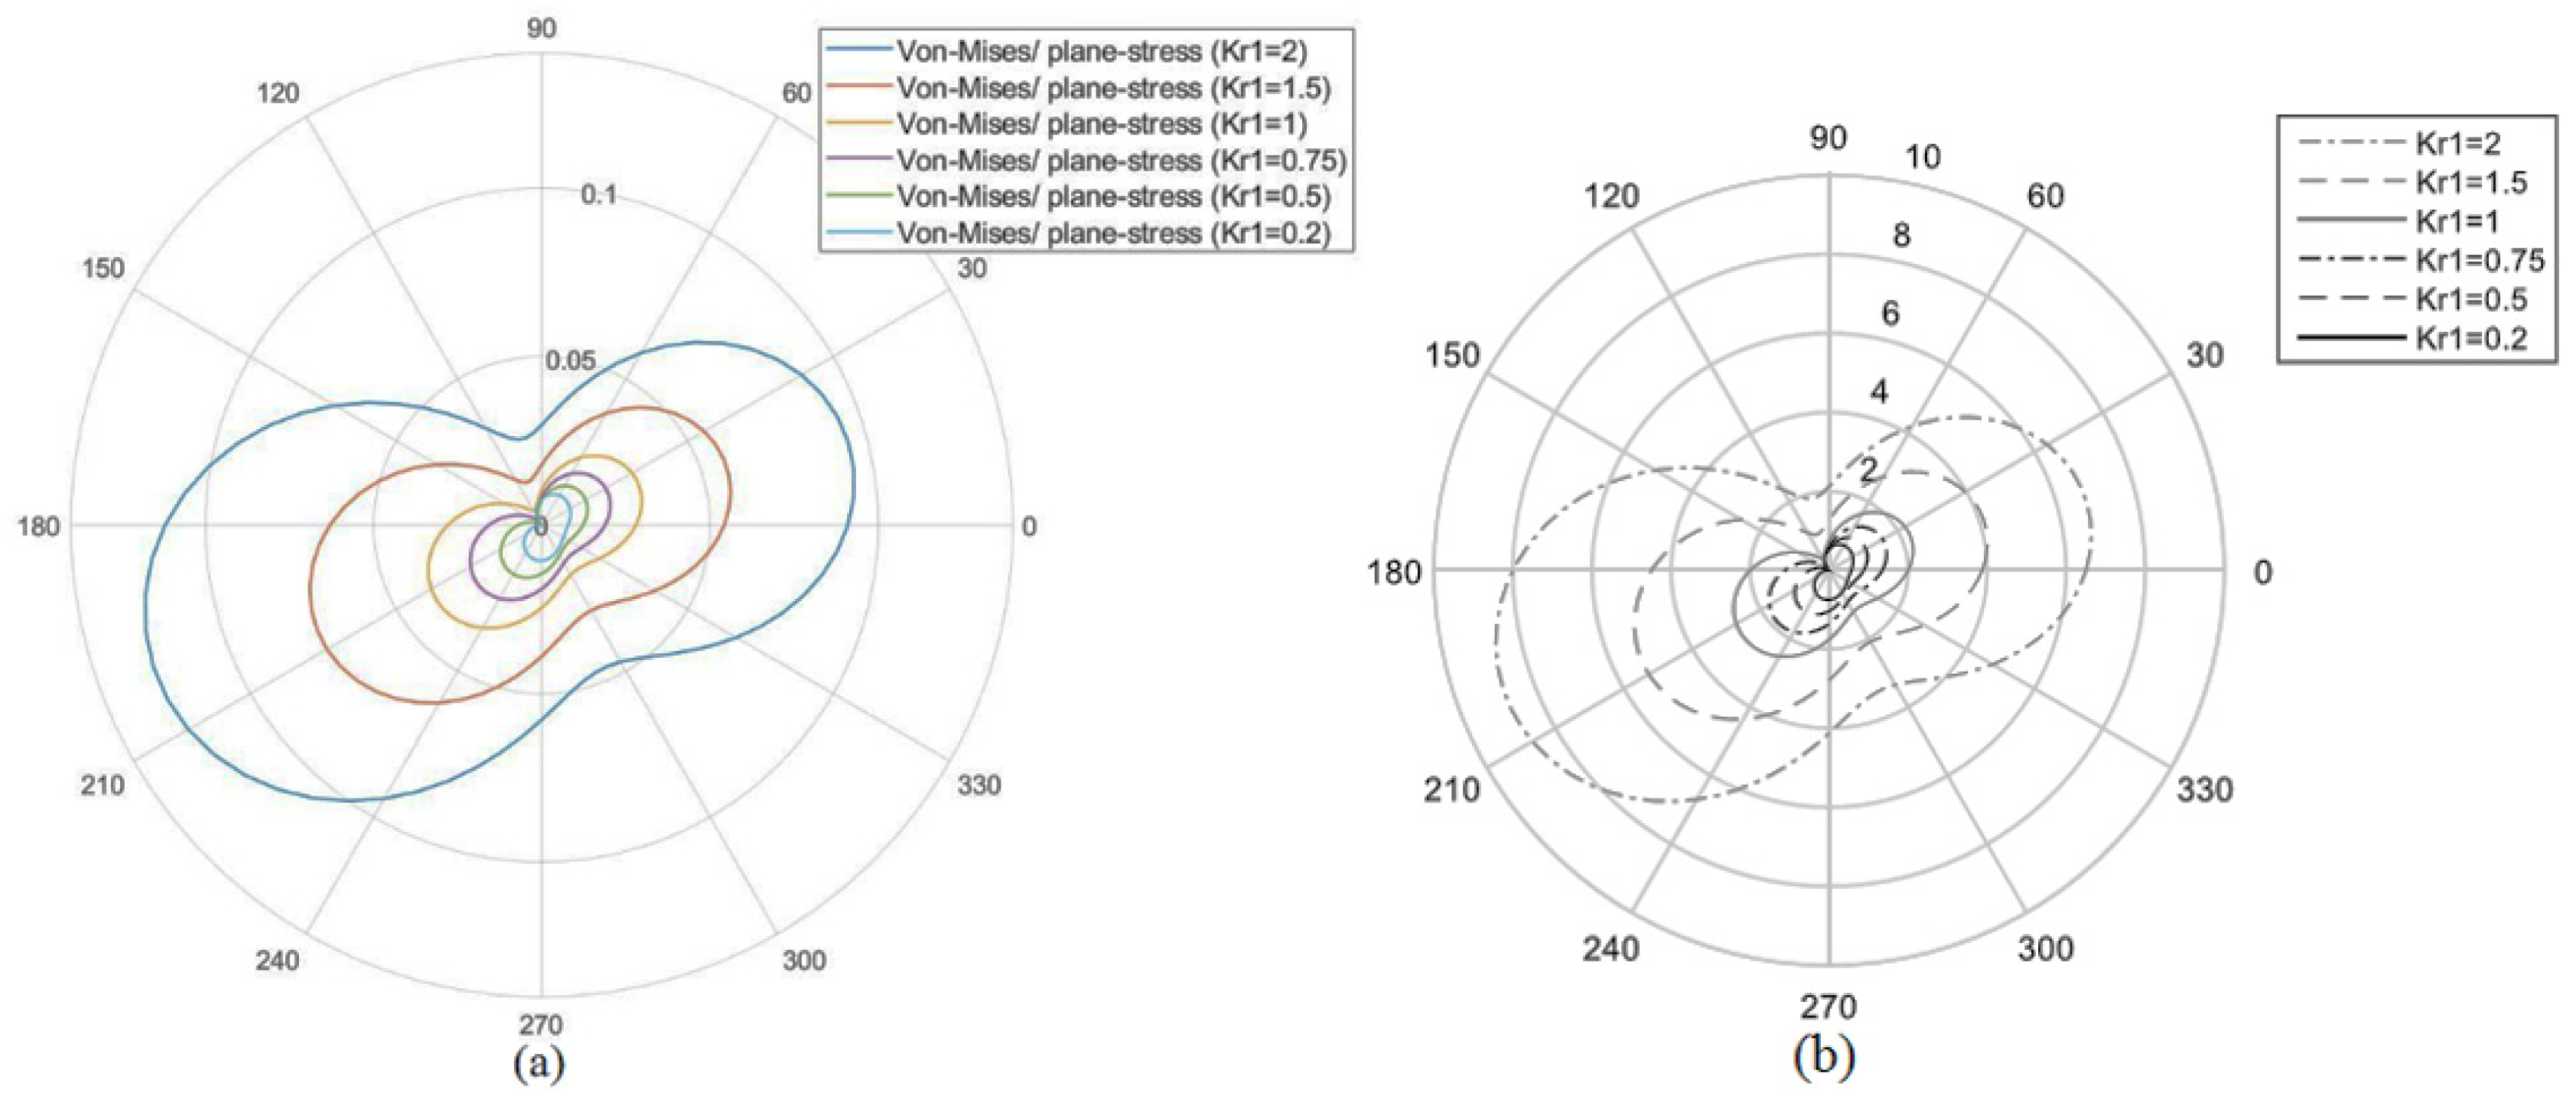
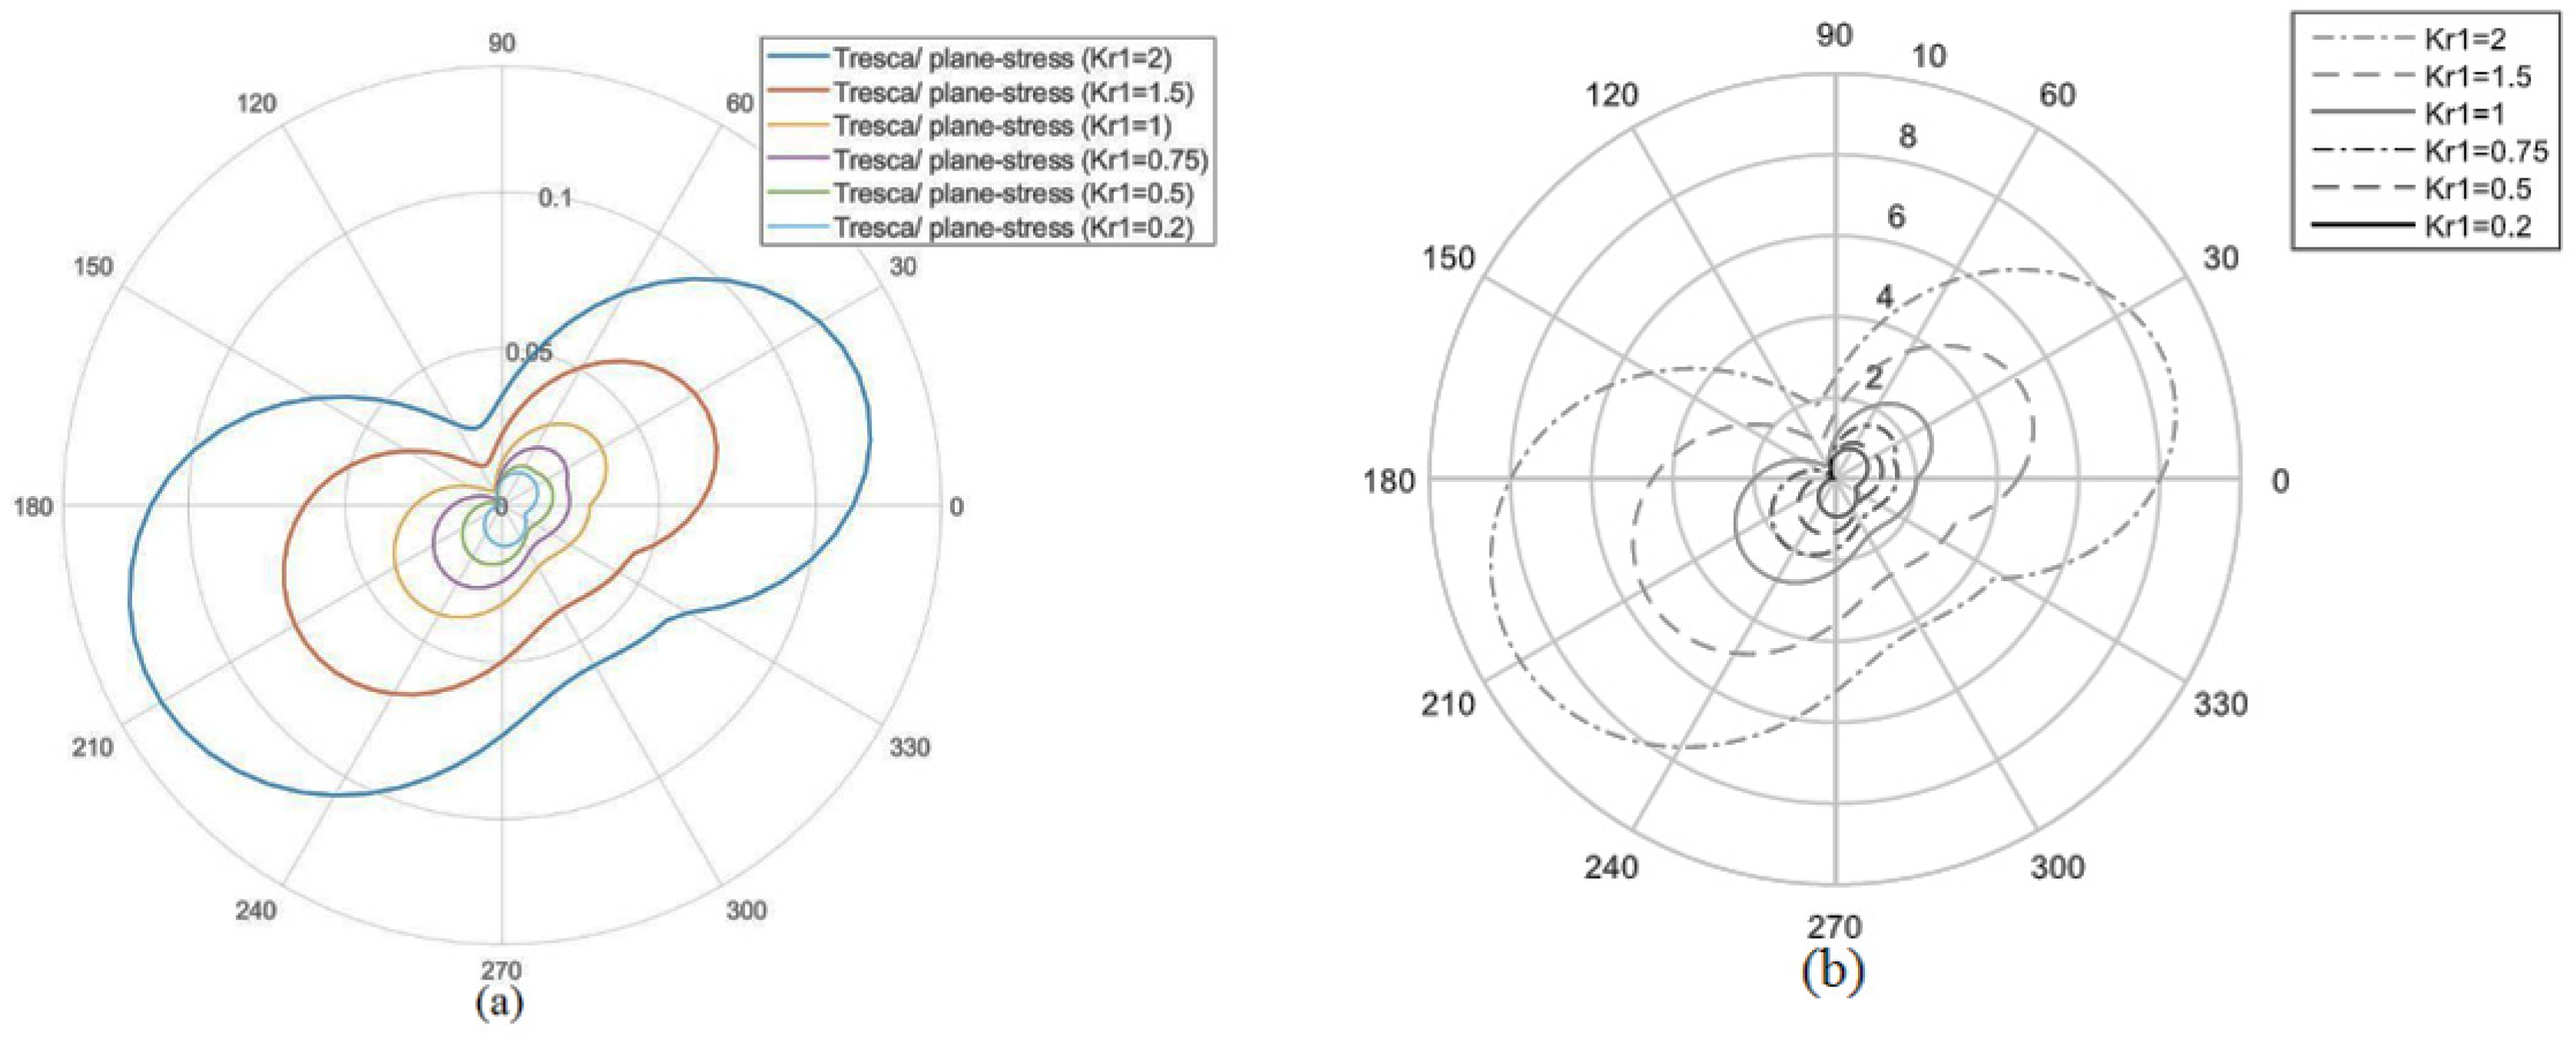
where KI and KII are the applied stress intensity factors in mode I and mode II loading conditions, respectively. Figure 4 and Figure 5 represent the shapes of the plastic zone for a sharp crack based on the von Mises and Tresca yield criteria, respectively, and under plane-stress conditions for different values of Kr1. Figure 4a and Figure 5a represent the results provided by the methodology proposed in this work, particularized to sharp cracks, whereas Figure 4b and Figure 5b are taken from [63]. It can be observed how the shape of the plastic zones obtained from the proposed approach, and for both the von Mises and Tresca criteria, are very similar to those shown in literature.

3.2. Verification of the Analytical Estimations by Finite Element Analysis

It is unquestionable that comparing the results obtained from the proposed analytical approach with the actual shape and size of the plastic zone observed in experimental tests is more genuine and precise. Nevertheless, these tests are usually costly and laborious. Because of the availability of reliable commercial FE software, numerical validation emerges as an alternative to experimental testing for the verification or validation of analytical models. Here, several two-dimensional (2D) finite element (FE) models were created and analyzed by utilizing the commercial code ABAQUS (Dassault Systèmes Simulia Corp., Johnston, RI, USA). Note that FE analyses are performed for two purposes: firstly, to compute the NSIFs; secondly, to determine (numerically) the PZS. The former can be obtained from linear elastic analyses, whereas the latter may be derived from elastic–plastic analyses by using the true material stress–strain curve.
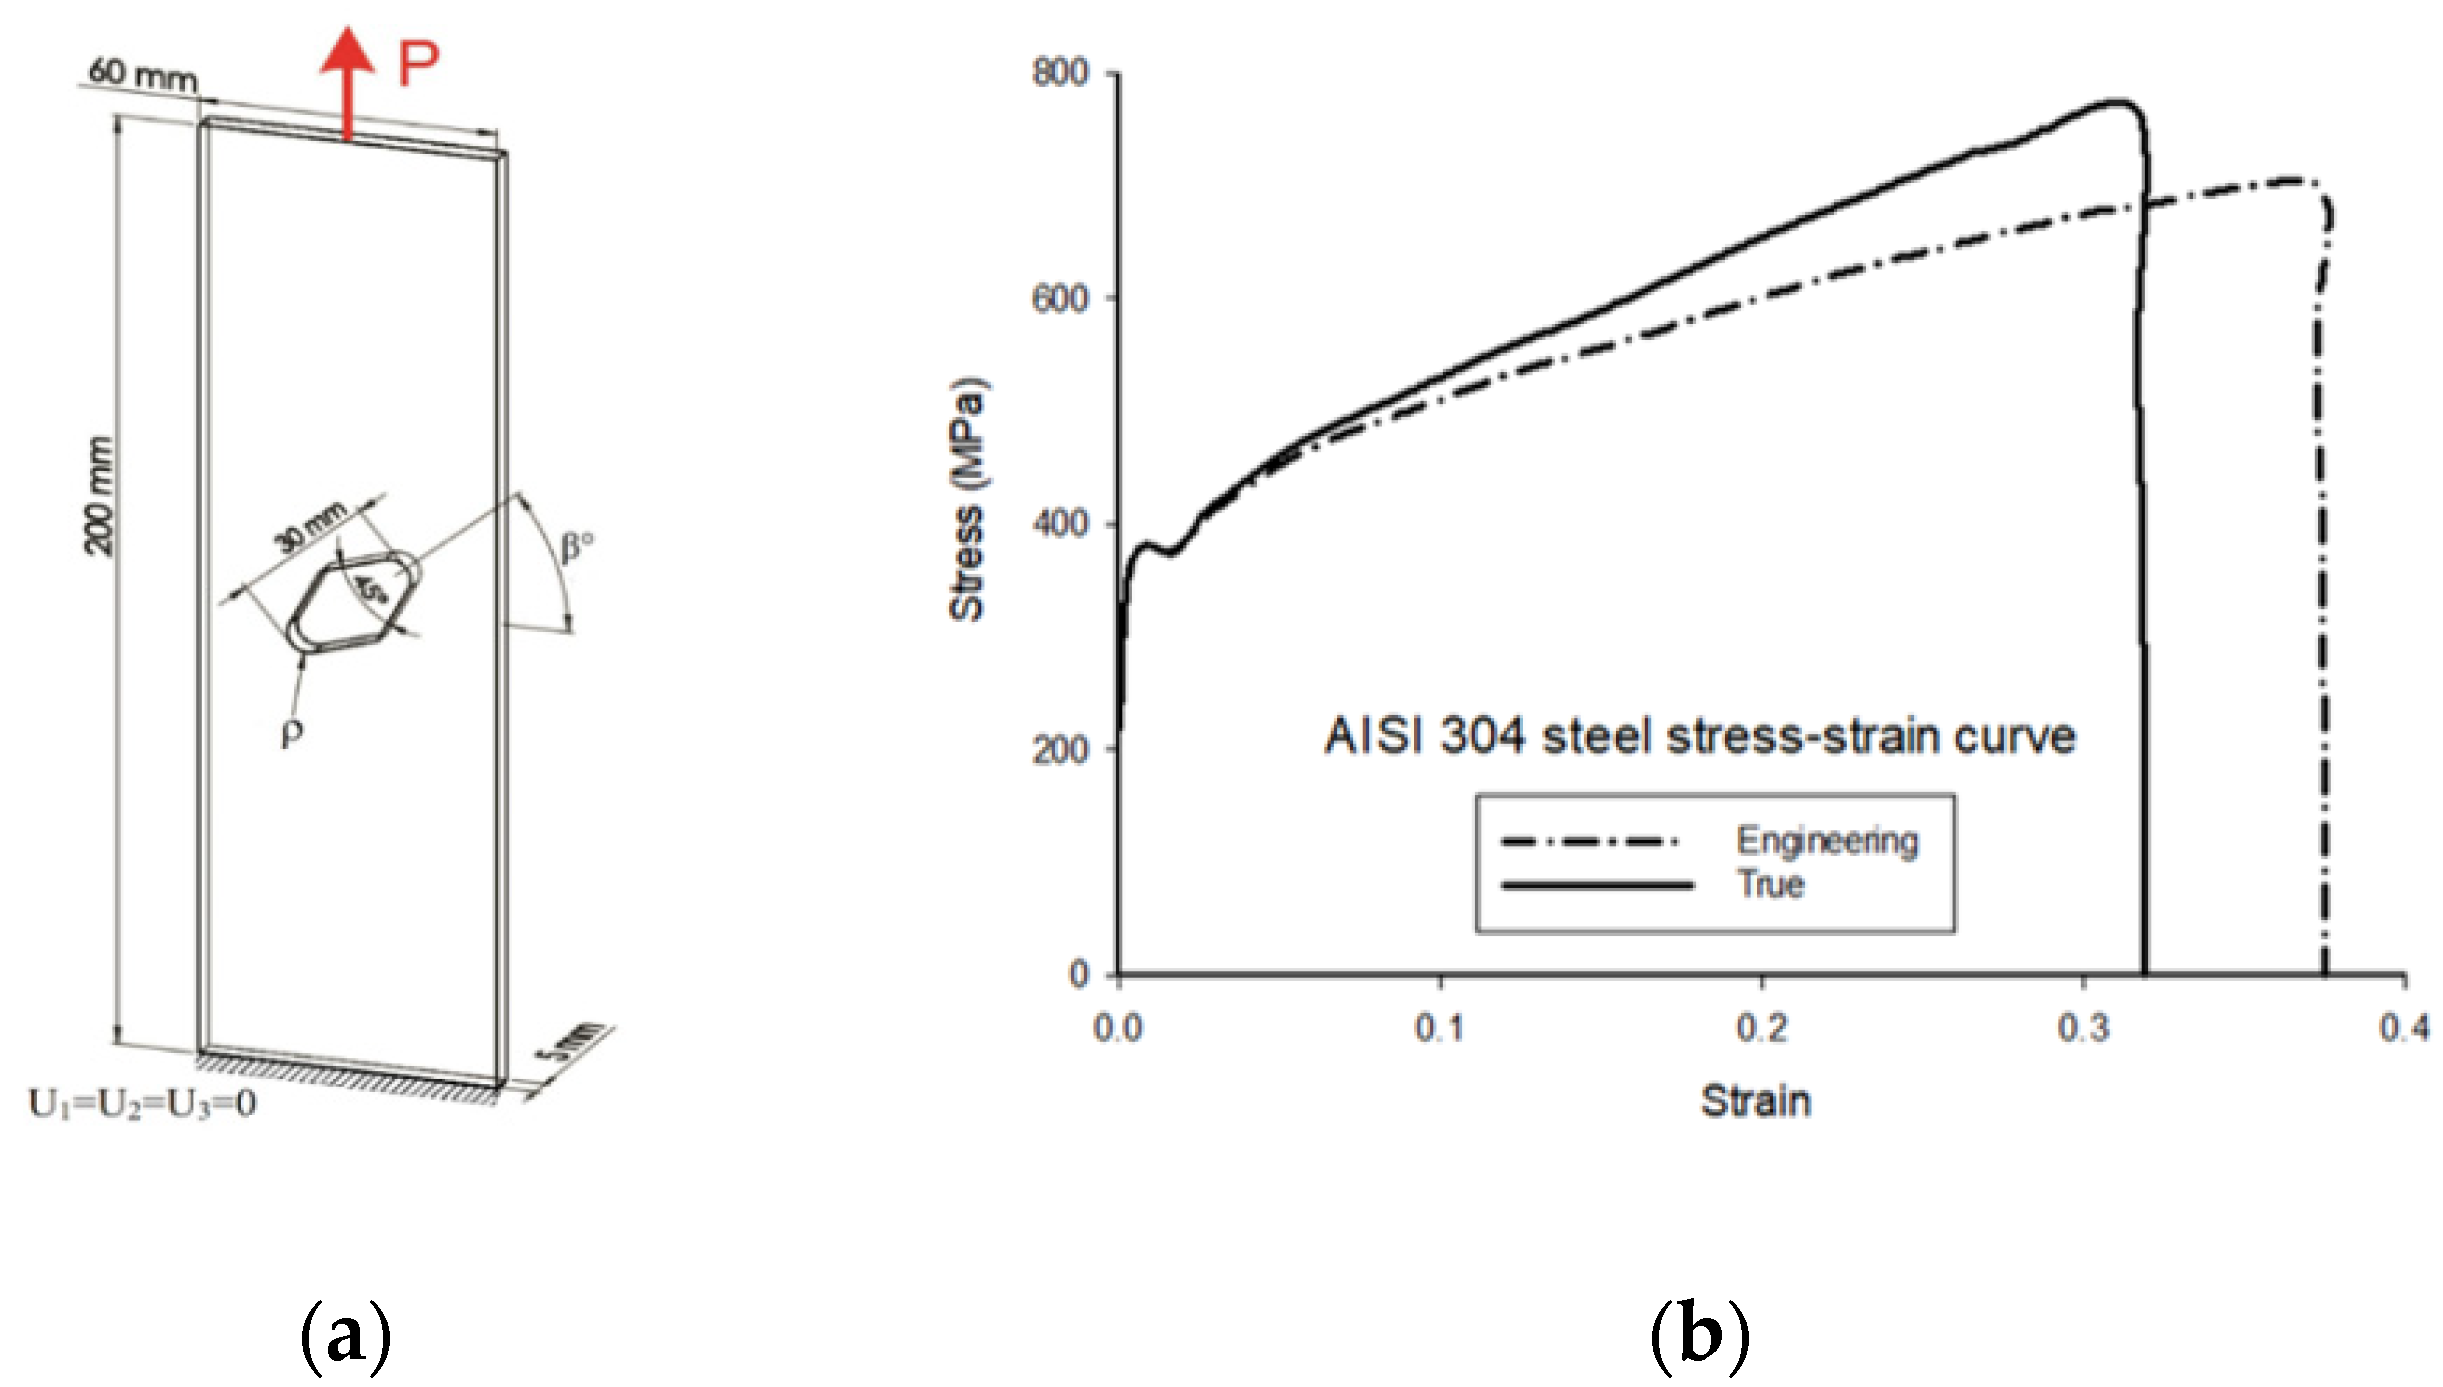
Several tensile rectangular specimens weakened by inclined blunt V-notches, as shown in Figure 6a, were analyzed under plane-stress conditions. Here, it is important to mention that in reality the plane-stress state does not occur, and this idealization is only considered when the simplification from 3D to 2D is in mind. Generally, it is presumed that when two dimensions are far greater than the other dimension, the plane-stress analysis is sufficiently accurate. As shown in Figure 6a, the length and the width of the specimens were far greater than their thickness. Thus, the plane-stress assumption seems reasonable. According to Figure 6a, it is obvious that, since the notch rotation angle (β) was greater than zero and smaller than 90°, the specimen was under mixed mode I/II loading conditions. In addition, note that for all cases the notch length was equal to 30 mm. Altogether, eight 2D specimens with two different mode mixity ratios and various notch tip radii were simulated. Four specimens with the notch rotation angle equal to 25° were studied under tensile loads (P) of 35, 40, 44, and 48 kN and notch tip radii of 0.5, 1, 2, and 4 mm, respectively. In the other four specimens, the notch rotation angle was 50°, with the applied loads being equal to 40, 43, 50, and 55 kN for the notch tip radii of 0.5, 1, 2, and 4 mm, respectively.
In order to achieve a reliable result from numerical analyses, several simulations must be repeated using different numbers of elements, examining the mesh-sensitivity. As is well known, the stress gradient is high in the vicinity of the notch tip. For this reason, refined eight-node quadratic elements with reduced integration are used in this region. In this work, the mesh-sensitivity in the notched model was checked based on the size of the element at the notch neighborhood rather than the total number of elements. One of the advantages of such an approach is that the reader can easily understand how the mesh is refined in the vicinity of the notch, whereas by presenting the total number of elements, the conditions of the meshed region around the notch would not be clear. It was found that when the element size at the notch neighborhood was smaller than 0.1 mm, optimal results can be achieved. However, for the sake of achieving the highest possible accuracy, elements with a size of 0.05 mm were utilized in the FE analyses hereunder. The bottom line of the model was meticulously fixed and a concentrated tensile force (P) according to Figure 6a was exerted on top of the specimen. For all cases studied, the Poisson’s ratio (ν) and the V-notch opening angle (2α) were considered to be equal to 0.3 and 45°, respectively. As mentioned before, the true stress–strain curve of the material was employed as the material property. The material chosen for all the specimens simulated was AISI 304 steel. Figure 6b illustrates the corresponding tensile stress–strain curve. The elastic modulus, the yield strength, and the ultimate strength of this steel were equal to 200 GPa, 342 MPa, and 702 MPa, respectively [64], with σ0 (easily derived by following Section 2.3) equal to 611.5 MPa.

4. Results and Discussion

A comparison between the plastic zones in the vicinity of the blunt V-shaped notches subjected to mixed mode I/II loading and plane-stress conditions obtained from the suggested analytical approach (rp) with those derived from the elastic-plastic FE analyses is made in this section. With the aim of checking the accuracy of the suggested formulations, a discrepancy index (Δ) was defined as follows:
Δ ( % ) = ( PZS ) FE ( PZS ) Analyt . ( PZS ) FE × 100
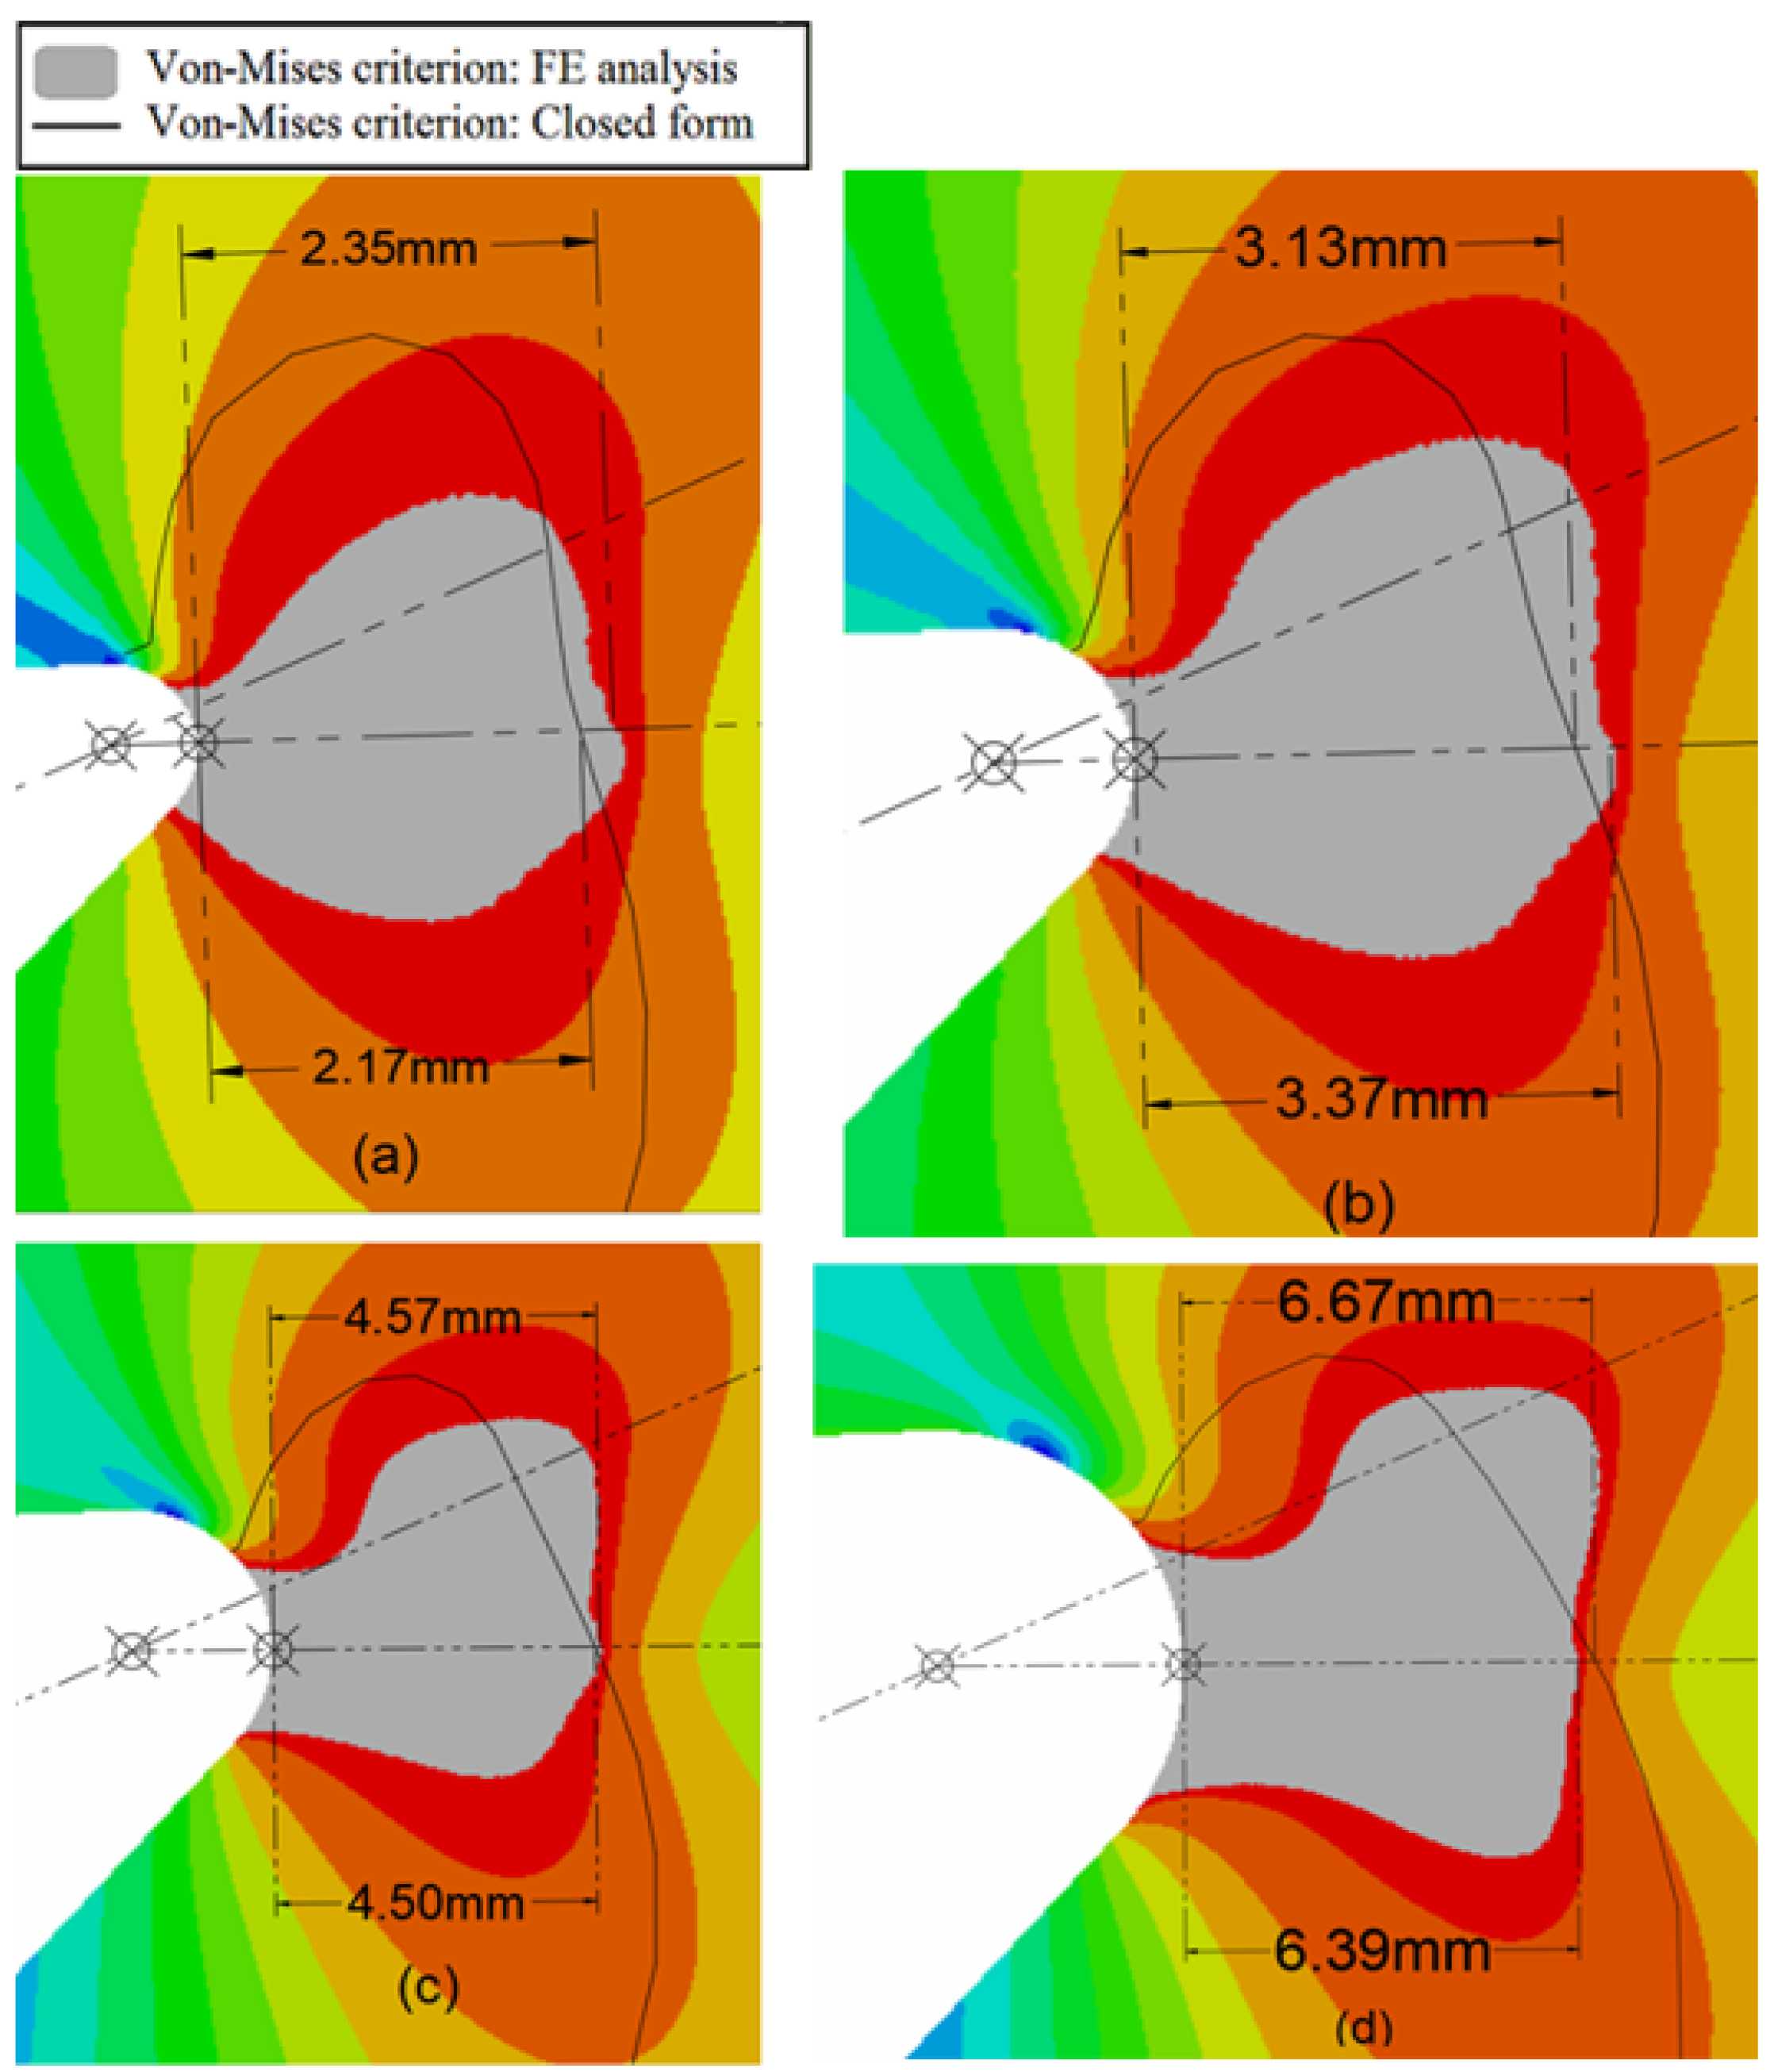
where (PZS)FE and (PZS)Analyt. are the PZSs achieved from the FE analysis and the analytical approach, respectively. Here, it should be noted that even though in this section the complete shapes of the plastic zones around the blunt V-notches were obtained from the proposed methodology (also referred to as the closed-form solution) and from FE analyses, only the effective plastic zone size was taken into consideration for comparing the results using Equation (19). The EPZS is important because it can be used to determine the ductile failure regime in notched components. Note that crack initiation on the round tip of blunt V-notches (or U-notches) usually starts from the MPS point [53,54,55,56]. Moreover, it is important to remember that the points of MPS and maximal tangential stress (MTS) are very close. Geometrically, since the blunt tip of a V-notch is a part of a circumference, any perpendicular line to the notch tip will pass through the center of curvature. This is why in the figures of this section both the MPS point and the center of curvature are pointed out with a plus sign inside of a circle. Figure 7, Figure 8, Figure 9 and Figure 10 show the plastic zones around the V-notches of the specimens described above. These plastic zones were obtained from both the proposed methodology (closed-form solution based on Irwin’s approach) and the FE analyses under the plane-stress assumption. Figure 7 illustrates the plastic zones based on the von Mises yield criterion when the notch rotation angle (β) was equal to 25° and the notch tip radii were 0.5, 1, 2, and 4 mm; Figure 8 shows the results for the same geometries but considering the Tresca yield criterion. Figure 9 and Figure 10 represent the obtained plastic zones in the specimens when β = 50°. The plastic zones in Figure 9 were based on the von Mises yield criterion, whereas the plastic zones in Figure 10 were derived assuming the Tresca yield criterion. As mentioned in Section 2.3, in Irwin’s model, σ0 is normally used instead of σY. However, herein, σY was utilized for the analytical calculation of the PZS. The reason behind this is explained below.
For both the von Mises and Tresca yield criteria, the discrepancies between the numerical and the analytical results (Δ, Equation (19)) are reported in Table 1.
According to Table 1, when β was equal to 25°, even though the results for both the von Mises and Tresca yield criteria were generally acceptable, the results obtained based on the von Mises yield criterion were more accurate for almost all the notch tip radii. On the contrary, when the notch rotation angle was equal to 50°, the results for the Tresca yield criterion were more precise.
At this point, some discussion on the reasons that cause the discrepancies between the two results (i.e., FE and analytical) seems important. Basically, they arise from the fact that it is extremely difficult to guarantee the accuracy of the stress solutions out of the direction normal to the maximum tangential stress, given that such accuracy depends on several factors. For example, because of the nature of Equations (1)–(3), which are accurate only in regions with significant stress concentrations, the precision of the solution decreases when going further away from the notch border [60]. It is for this reason that, for most parts in this study, the value of the applied load was not too great, so the generated PZS was small or moderate. Moreover, there is a considerable difference between the actual boundary of the round-tip V-notch and the boundary defined for the stress solution. Based on [60], the proposed stress solutions are satisfied on a limited number of points on the notch edge, and not on the entire edge. In addition, the precision declines when the ratio of the notch length to the notch tip radius decreases [60].
Earlier in this article, it was stated that to solve the proposed formulas (i.e., obtaining rp), five parameters need to be known. These parameters are σY, θ, σ0, and the NSIFs (KIV,ρ and KIIV,ρ). Here, the yield strength of the material (σY) is known, the average flow stress (σ0) can be calculated as explained in Section 2.3, and θ is an arbitrary angle. If it is intended to determine the PZS in a given direction, the definition of θ is straightforward. The NSIFs can be calculated from linear elastic FE analyses. In other words, only the elastic part of the stress–strain curve of the analyzed material is important when dealing with the calculation of the NSIFs. Now, suppose that two materials (material A and material B) with identical elastic parts, and also that one of them (material A) develops large ductility and hardening (like the AISI 304 steel used in this study), whereas the other one (material B) has little hardening and low ductility (it behaves as an EPPM with low strain-to-failure; see Section 2.3). In this case, by considering the same applied load and the same geometry in the notched specimens, the values of the NSIFs would be equal, but the value of the average flow stress would be different, given that the areas under the stress–strain curves are significantly different (obviously, the PZSs would be different too). This also means that the difference between σY and σ0 would be significant for material A and small for material B. In other words, the larger the area under the curve, the greater σ0. At the end, when material A is used, the proposed methodology provides estimations of PZS that are notably smaller than those obtained with material B. This shows that the accuracy of the proposed formulation depends on the hardening and the strain-to-failure of the material being analyzed, and it decreases when both parameters increase (and vice versa). Similar results have been reported in [58].
In this sense, it should be noted here that, according to Figure 6b, the hardening and the strain-to-failure of AISI 304 steel was high. Therefore, it was expected that when σ0 is used instead of σY, the PZS calculated from the suggested closed-form solution will become remarkably small in comparison to the size of the plastic zone obtained from the FE analyses. Figure 11 depicts the PZSs obtained from the numerical and the proposed analytical solutions for a blunt V-notched rectangular specimen based on the von Mises yield criterion under plane-stress conditions and using σ0 instead of σY. It is evident that when σ0 is used instead of σY, the proposed analytical formulation provides a significantly smaller PZS than that derived from the FE analyses. Thus, the authors recommend considering σY instead of σ0 when the material being analyzed develops significant hardening and strain-to-failure.

5. Conclusions

The main concluding remarks of this study are presented in the four bullet points below:
  • The stress solution around round-tip V-notches under mixed mode I/II loading is an approximation to the actual stress state. This research revealed that it can successfully be used to formulate the plastic zone size (PZS) in the neighborhood of blunt V-shaped notches under plane-stress conditions and based on the von Mises and Tresca yield criteria.
  • The accuracy of the stress solutions out of the direction normal to the maximum tangential stress (MTS) depends on many factors; namely and most importantly, the stress field only satisfies the boundary conditions on the limited area on the round edge of the notch. This makes the shape of the plastic zones acquired from the analytical solution different from that obtained from the FE analyses. However, the effective plastic zone size (EPZS), which is important for the determination of the ductile failure regime in notched components, can be accurately and conveniently obtained by using the proposed analytical formulas.
  • This research showed that when the notch rotation angle (β) was equal to 25°, the accuracy of the suggested analytical solutions for calculating the EPZS was better when the von Mises yield criterion is used. However, when β was equal to 50°, the Tresca yield criterion provided finer results.
  • The proposed methodology was derived from Irwin’s approach, which neglects the strain-hardening of the material being analyzed and assumes elastic perfectly plastic behavior. When the plasticity of the material is high, in terms of strain hardening and strain-to-failure, the difference between the average flow stress (σ0) and the yield stress (σY) increases, and the methodology provides worse estimations of the PZS. To avoid this, it is suggested to use σY when the material being analyzed develops significant hardening and strain-to-failure. Otherwise, the average flow stress should be used.

Author Contributions

Conceptualization, A.R.T.; methodology, A.R.T., B.S., M.M. and S.C.; software, B.S.; validation, A.R.T., B.S., M.M. and S.C.; investigation, A.R.T. and B.S.; writing—original draft preparation, A.R.T. and S.C; writing—review and editing, A.R.T., B.S., M.M. and S.C.; project administration, A.R.T. All authors have read and agreed to the published version of the manuscript.

Funding

This research received no external funding.

Data Availability Statement

The data presented in this study are available in the main text of this document.

Conflicts of Interest

The authors declare no conflict of interest.

Appendix A

Functions used in the stress field for round-tip V-shaped notches (modes I and II) [60]:
{ f θ θ f rr f r θ } I = 1 1 + λ 1 + χ b 1 ( 1 λ 1 ) [ { ( 1 + λ 1 ) cos ( 1 λ 1 ) θ ( 3 λ 1 ) cos ( 1 λ 1 ) θ ( 1 λ 1 ) sin ( 1 λ 1 ) θ } + χ b 1 ( 1 λ 1 ) { cos ( 1 + λ 1 ) θ cos ( 1 + λ 1 ) θ sin ( 1 + λ 1 ) θ } ]
{ g θ θ g rr g r θ } I = q 4 ( q 1 ) [ 1 + λ 1 + χ b 1 ( 1 λ 1 ) ] [ χ d 1 { ( 1 + μ 1 ) cos ( 1 μ 1 ) θ ( 3 μ 1 ) cos ( 1 μ 1 ) θ ( 1 μ 1 ) sin ( 1 μ 1 ) θ } + χ c 1 { cos ( 1 + μ 1 ) θ cos ( 1 + μ 1 ) θ sin ( 1 + μ 1 ) θ } ]
{ f θ θ f rr f r θ } II = 1 1 λ 2 + χ b 2 ( 1 + λ 2 ) [ { ( 1 + λ 2 ) sin ( 1 λ 2 ) θ ( 3 λ 2 ) sin ( 1 λ 2 ) θ ( 1 λ 2 ) cos ( 1 λ 2 ) θ } + χ b 2 ( 1 + λ 2 ) { sin ( 1 + λ 2 ) θ sin ( 1 + λ 2 ) θ cos ( 1 + λ 2 ) θ } ]
{ g θ θ g rr g r θ } II = 1 4 ( μ 2 1 ) [ 1 λ 2 + χ b 2 ( 1 + λ 2 ) ] [ χ d 2 { ( 1 + μ 2 ) sin ( 1 μ 2 ) θ ( 3 μ 2 ) sin ( 1 μ 2 ) θ ( 1 μ 2 ) cos ( 1 μ 2 ) θ } + χ c 2 { sin ( 1 + μ 2 ) θ sin ( 1 + μ 2 ) θ cos ( 1 + μ 2 ) θ } ]
Table A1. Eigenvalues for different notch opening angles in mode I loading [60].
2α (deg.) λ 1 µ 1 χ b 1 χ c 1 χ d 1
00.5000−0.50001.00004.00000.0000
π 6 0.5014−0.45601.07073.79070.0632
π 4 0.5050−0.43191.16563.5720.0828
π 3 0.5122−0.40571.31233.28320.0960
π 2 0.5448−0.34491.84142.50570.1046
2 π 3 0.6157−0.26783.00271.51500.0871
3 π 4 0.6736−0.21984.15300.99330.0673
5 π 6 0.7520−0.16246.36170.51370.0413
Table A2. Eigenvalues for different notch opening angles in mode II loading [60].
2α (deg.) λ 1 µ 1 χ b 1 χ c 1 χ d 1
00.5000−0.50001.0000−12.00000.0000
π 6 0.5982−0.44650.921211.3503−0.3506
π 4 0.6597−0.41180.814010.1876−0.4510
π 3 0.7309−0.37310.6584−8.3946−0.4788
π 2 0.9085−0.28820.2189−2.9382−0.2436
2 π 3 1.1489−0.1980−0.31394.56040.5133
3 π 4 1.3021−0.1514−0.56958.73711.1362
5 π 6 1.4858−0.1034−0.786912.91611.9376
Expressions for parameters ω 1   and ω 2   [60,61]:
ω 1 = q 4 ( q 1 ) [ χ d 1 ( 1 + μ 1 ) + χ c 1 1 + λ 1 + χ b 1 ( 1 λ 1 ) ]
ω 2 = 1 4 ( μ 2 1 ) [ χ d 2 ( 1 μ 2 ) χ c 2 1 λ 2 + χ b 2 ( 1 + λ 2 ) ] = 1

References

  1. Larsson, S.G.; Carlsson, A.J. Influence of non-singular stress terms and specimen geometry on small-scale yielding at crack tips in elastic-plastic materials. J. Mech. Phys. Solids 1973, 21, 263–277. [Google Scholar] [CrossRef]
  2. Rice, J.R. Limitations to the small scale yielding approximation for crack tip plasticity. J. Mech. Phys. Solids 1974, 22, 17–26. [Google Scholar] [CrossRef]
  3. Yeh, H.Y.; Ahmed, K.; Yeh, H.L. Change of damage zone size by T-stress. J. Reinf. Plast. Comp. 2005, 25, 645–661. [Google Scholar] [CrossRef]
  4. Sousa, R.A.; Castro, J.T.P.; Lopes, A.A.O.; Martha, L.F. On improved crack tip plastic zone estimates based on T-stress and on complete stress fields. Fatigue. Fract. Eng. Mater. Struct. 2012, 36, 25–38. [Google Scholar] [CrossRef]
  5. Folias, E.S. Estimating plastic zone sizes. Int. J. Fract. 1974, 10, 109–111. [Google Scholar] [CrossRef]
  6. Terada, H. On plastic zone size and COD of SC specimen by Dugdale’s method. Int. J. Fract. 1982, 20, R15–R20. [Google Scholar] [CrossRef]
  7. Adetifa, O.A. Estimating plastic zone sizes for edge cracks. Int. J. Fract. 1984, 24, 115–120. [Google Scholar] [CrossRef]
  8. Danyluk, H.T.; Singh, B.M.; Vrbik, J. A dugdale-type estimation of the plastic zone for a penny-shaped crack in a thick transversely isotropic layer due to radial shear. Eng. Fract. Mech. 1995, 51, 735–740. [Google Scholar] [CrossRef]
  9. Petroski, H.J. Dugdale plastic zone sizes for edge cracks. Int. J. Fract. 1979, 15, 217–230. [Google Scholar]
  10. Lee, B.H.; Chung, S.K. Determination of the plastic zone size by cancelling the singularity with proper crack-dislocation-density functions. Int. J. Fract. 1981, 17, 57–60. [Google Scholar] [CrossRef]
  11. Hoh, H.J.; Xiao, Z.M.; Luo, J. On the plastic zone size and crack tip opening displacement of a Dugdale crack interacting with a circular inclusion. Acta Mech. 2009, 210, 305–314. [Google Scholar] [CrossRef]
  12. Li, X.Y.; Gu, S.T.; He, Q.C.; Chen, W.Q. Penny-shaped Dugdale crack in a transversely isotropic medium and under axisymmetric loading. Math. Mech. Solids 2012, 18, 246–263. [Google Scholar] [CrossRef]
  13. Matvienko, Y.G. The Effect of the Non-singular T-stress Components on Crack Tip Plastic Zone under Mode I Loading. Procedia Mater. Sci. 2014, 3, 141–146. [Google Scholar] [CrossRef] [Green Version]
  14. Huang, X.; Liu, Y.; Dai, Y. Characteristics and effects of T-stresses in central-cracked unstiffened and stiffened plates under mode I loading. Eng. Fract. Mech. 2018, 188, 393–415. [Google Scholar] [CrossRef]
  15. Kiselev, V.A.; Rivkin, E.Y. Dependence of amount of crack opening and size of plastic zone on the type of stress state. Strength Mater. 1978, 10, 208–211. [Google Scholar] [CrossRef]
  16. Chang, S.J.; Ohr, S.M. Effect of thickness on plastic zone size in BCS theory of fracture. Int. J. Fract. 1983, 21, 3–13. [Google Scholar] [CrossRef]
  17. Rogowski, G. Plastic zones for 3D planar cracks embedded in an elastic-plastic layer sandwiched between two elastic adherents. Theor. Appl. Fract. Mech. 2018, 98, 199–209. [Google Scholar] [CrossRef]
  18. Zhang, B.; Xu, W.; Wu, X.; Yu, Y.; Dong, D. Stress intensity factors and plastic zones of stiffened panels with multiple collinear cracks. Theor. Appl. Fract. Mech. 2020, 110, 102816. [Google Scholar] [CrossRef]
  19. Benrahou, K.H.; Benguediab, M.; Belhouari, M.; Nait-Abdelaziz, M.; Imad, A. Estimation of the plastic zone by finite element method under mixed mode (I and II) loading. Comp. Mater. Sci. 2007, 38, 595–601. [Google Scholar] [CrossRef]
  20. Shi, P.P. On the plastic zone size of solids containing doubly periodic rectangular-shaped arrays of cracks under longitudinal shear. Mech. Res. Commun. 2015, 67, 39–46. [Google Scholar] [CrossRef]
  21. Dotsenko, A.M. Developing Irwin formula to improve the accuracy of evaluation of stresses and crack tip plastic zone size. Mater. Sci. 1993, 29, 42–46. [Google Scholar] [CrossRef]
  22. Jia, Y.J.; Shi, M.X.; Zhao, Y.; Liu, B. A better estimation of plastic zone size at the crack tip beyond Irwin’s model. J. Appl. Mech. 2013, 80, 051014. [Google Scholar] [CrossRef]
  23. Fan, M.; Yi, D.; Xiao, Z. Generalized Irwin plastic zone correction for a Griffith crack near a coated-circular inclusion. Int. J. Damage Mech. 2014, 24, 663–682. [Google Scholar] [CrossRef]
  24. Teimoori, H.; Faal, R.T. Irwin’s plastic zone size assessment for interacting cracks in a circular plane subjected to anti-plane deformation. Procedia Struct. Integr. 2016, 2, 2432–2438. [Google Scholar] [CrossRef] [Green Version]
  25. Caputo, F.; Lamanna, G.; Soprano, A. An Analytical Formulation for the Plastic Deformation at the Tip of Short Cracks. Procedia Eng. 2011, 10, 2988–2993. [Google Scholar] [CrossRef]
  26. Oudad, W.; Bachir Bouiadjra, B.; Belhouari, M.; Touzain, S.; Feaugas, X. Analysis of the plastic zone size ahead of repaired cracks with bonded composite patch of metallic aircraft structures. Comp. Mater. Sci. 2009, 46, 950–954. [Google Scholar] [CrossRef]
  27. Kudari, S.K.; Kodancha, K.G. 3D finite element analysis on crack-tip plastic zone. Int. J. Eng. Sci. Tech. 2010, 2, 47–58. [Google Scholar] [CrossRef] [Green Version]
  28. Horn, A.J.; Sherry, A.H.; Budden, P.J. Size and geometry effects in notched compact tension specimens. Int. J. Pres. Ves. Pip. 2017, 154, 29–40. [Google Scholar] [CrossRef] [Green Version]
  29. Yokobori, T.; Kamei, A. The size of plastic zone at the tip of a crack in plane strain state by the finite element method. Int. J. Fract. 1973, 9, 98–100. [Google Scholar]
  30. Panda, A.K.; Misra, S.; Misra, S.C. Application of finite element method for determination of stress intensity factor and plastic zone geometry in an aluminum alloy sheet under uniaxial tension. Bull. Mater. Sci. 1989, 12, 207–216. [Google Scholar] [CrossRef]
  31. Kudari, S.K.; Maiti, B.; Ray, K.K. The effect of specimen geometry on plastic zone size: A study using the J integral. J. Strain Anal. Eng. Des. 2007, 42, 125–136. [Google Scholar] [CrossRef]
  32. Bachir Bouiadjra, B.; Elmeguenni, M.; Benguediab, M.; Belhouari, M.; Nait-Abdelaziz, M. Numerical estimation of the effects of microcavities on the plastic zone size ahead of the crack tip in aluminum alloy 2024 T3. Mater. Des. 2009, 30, 752–757. [Google Scholar] [CrossRef]
  33. Yi, H.; Jingjie, C.; Gang, L. A new method of plastic zone size determined based on maximum crack opening displacement. Eng. Fract. Mech. 2010, 77, 2912–2918. [Google Scholar] [CrossRef]
  34. Marques, L.F.N.; Meggiolaro, M.A.; de Castro, J.T.P.; Martha, L.F. Elastoplastic 3D analyses of plastic zone size dependencies on load-to-yield strength and on crack size-to-width ratios under mixed mode I/II. Theor. Appl. Fract. Mech. 2020, 107, 102490. [Google Scholar] [CrossRef]
  35. Bastun, V.N. Influence of deformation anisotropy on the size of the plastic zone at the tip of an opening mode crack. Strength Mater. 1990, 22, 91–95. [Google Scholar] [CrossRef]
  36. Romeo, A.; Ballarini, R. The influence of elastic mismatch on the size of the plastic zone of a crack terminating at a brittle-ductile interface. Int. J. Fract. 1994, 65, 183–196. [Google Scholar]
  37. Kaminsky, A.A.; Kurchakov, E.E.; Gavrilov, G.V. Influence of tension along a crack on the plastic zone in an anisotropic body. Int. Appl. Mech. 2010, 46, 634–648. [Google Scholar] [CrossRef]
  38. Tay, T.E.; Yap, C.M.; Tay, C.J. Crack tip and notch tip plastic zone size measurement by the laser speckle technique. Eng. Fract. Mech. 1995, 52, 879–893. [Google Scholar] [CrossRef]
  39. Uguz, A.; Martin, J.W. Plastic zone size measurement techniques for metallic materials. Mater. Charact. 1996, 37, 105–118. [Google Scholar] [CrossRef]
  40. Tanaka, A.; Yamauchi, T. Size estimation of plastic deformation zone at the crack tip of paper under fracture toughness testing. J. Pack. Sci. Technol. 1997, 6, 268–276. [Google Scholar]
  41. Walker, C.A.; MacKenzie, P.M. Crack-tip plastic zones assessed by the von Mises yield criterion from strain field data. Int. J. Pres. Ves. Pip. 1994, 57, 359–363. [Google Scholar] [CrossRef]
  42. Wu, S.C.; Li, C.H.; Luo, Y.; Zhang, H.O.; Kang, G.Z. A uniaxial tensile behavior based fatigue crack growth model. Int. J. Fatigue 2020, 131, 105324. [Google Scholar] [CrossRef]
  43. Hu, Y.; Wu, S.; Withers, P.J.; Cao, H.; Chen, P.; Zhang, Y.; Shen, Z.; Vojtek, T.; Hutař, P. Corrosion fatigue lifetime assessment of high-speed railway axle EA4T steel with artificial scratch. Eng. Fract. Mech. 2021, 245, 107588. [Google Scholar] [CrossRef]
  44. Besel, M.; Breitbarth, E. Advanced analysis of crack tip plastic zone under cyclic loading. Int. J. Fatigue 2016, 93, 92–108. [Google Scholar] [CrossRef]
  45. Dugdale, D.S. Yielding of steel sheets containing slits. J. Mech. Phys. Solids 1960, 8, 100–104. [Google Scholar] [CrossRef]
  46. Pratap, C.R.; Pandey, R.K. Effect of geometry and finite root radius on plastic zone and tip opening displacement. Eng. Fract. Mech. 1984, 19, 849–861. [Google Scholar] [CrossRef]
  47. Youshi, H.; Miller, K.J.; Brown, M.W. Complex stress functions and plastic zone sizes for notch cracks subjected to various loading conditions. Fatigue Fract. Eng. Mater. Struct. 1991, 14, 237–258. [Google Scholar] [CrossRef] [Green Version]
  48. Chatterjee, S.N. Analysis of test specimens for interlaminar mode II fracture toughness, Part 1. Elastic laminates. J. Comp. Mater. 1991, 25, 470–493. [Google Scholar] [CrossRef]
  49. Chatterjee, S.N. Analysis of test specimens for interlaminar mode II fracture toughness, Part 2. Effects of adhesive layers and material nonlinearities. J. Comp. Mater. 1991, 25, 494–511. [Google Scholar] [CrossRef]
  50. Shi, S.Q.; Puls, M.P. A simple method of estimating the maximum normal stress and plastic zone size at a shallow notch. Int. J. Pres. Ves. Pip. 1995, 64, 67–71. [Google Scholar] [CrossRef]
  51. Yeh, H.Y.; Rashid, H.N.; Yeh, H.L. Effect of T-stress on damage zone size predictions of notched laminated composites. J. Reinf. Plast. Comp. 2005, 25, 89–98. [Google Scholar] [CrossRef]
  52. Torabi, A.R. Tensile failure in blunt V-notched ductile members: A new formulation of the Equivalent Material Concept. Eng. Fract. Mech. 2017, 184, 1–13. [Google Scholar] [CrossRef]
  53. Torabi, A.R.; Habibi, R. Investigation of ductile rupture in U-notched Al 6061-T6 plates under mixed mode loading. Fatigue Fract. Eng. Mater. Struct. 2015, 39, 551–565. [Google Scholar] [CrossRef]
  54. Torabi, A.R.; Mohammad Hosseini, B. Large plasticity induced crack initiation from U-notches in thin aluminum sheets under mixed mode loading. Eng. Solid Mech. 2017, 5, 39–60. [Google Scholar] [CrossRef]
  55. Torabi, A.R.; Alaei, M. Mixed-mode ductile failure analysis of V-notched Al 7075-T6 thin sheets. Eng. Fract. Mech. 2015, 150, 70–95. [Google Scholar] [CrossRef]
  56. Torabi, A.R.; Berto, F.; Campagnolo, A. Elastic-plastic fracture analysis of notched Al 7075-T6 plates by means of the local energy combined with the equivalent material concept. Phys. Mesomech. 2016, 19, 204–214. [Google Scholar] [CrossRef]
  57. Gomez, F.J.; Torabi, A.R. Application of the equivalent material concept to the study of the ductile failure due to U-notches. Int. J. Pres. Ves. Pip. 2019, 172, 65–69. [Google Scholar] [CrossRef]
  58. Torabi, A.R.; Shahbazian, B. Notch tip plastic zone determination by extending Irwin’s model. Theor. Appl. Fract. Mech. 2020, 108, 102643. [Google Scholar] [CrossRef]
  59. Torabi, A.R.; Shahbazian, B. Semi-analytical estimation of the effective plastic zone size at U-notch neighborhood in thin sheets under mixed mode I/II loading. Eng. Fract. Mech. 2020, 239, 107323. [Google Scholar] [CrossRef]
  60. Filippi, S.; Lazzarin, P.; Tovo, R. Developments of some explicit formulas useful to describe elastic stress fields ahead of notches in plates. Int. J. Solids Struct. 2002, 39, 4543–4565. [Google Scholar] [CrossRef]
  61. Lazzarin, P.; Filippi, S. A generalized stress intensity factor to be applied to rounded V-shaped notches. Int. J. Solids Struct. 2006, 43, 2461–2478. [Google Scholar] [CrossRef] [Green Version]
  62. Anderson, T.L. Fracture Mechanics: Fundamentals and Applications; Taylor & Francis/CRC Press: Boca Raton, FL, USA, 2005. [Google Scholar]
  63. Ivey, J. Analytic Solutions for the Crack-Tip Plastic Zone under Mixed Mode Loading Conditions. Master’s Thesis, The University of New Mexico, Albuquerque, NM, USA, 2017. [Google Scholar]
  64. Torabi, A.R.; Kamyab, M. The fictitious material concept. Eng. Fract. Mech. 2019, 209, 7–31. [Google Scholar] [CrossRef]
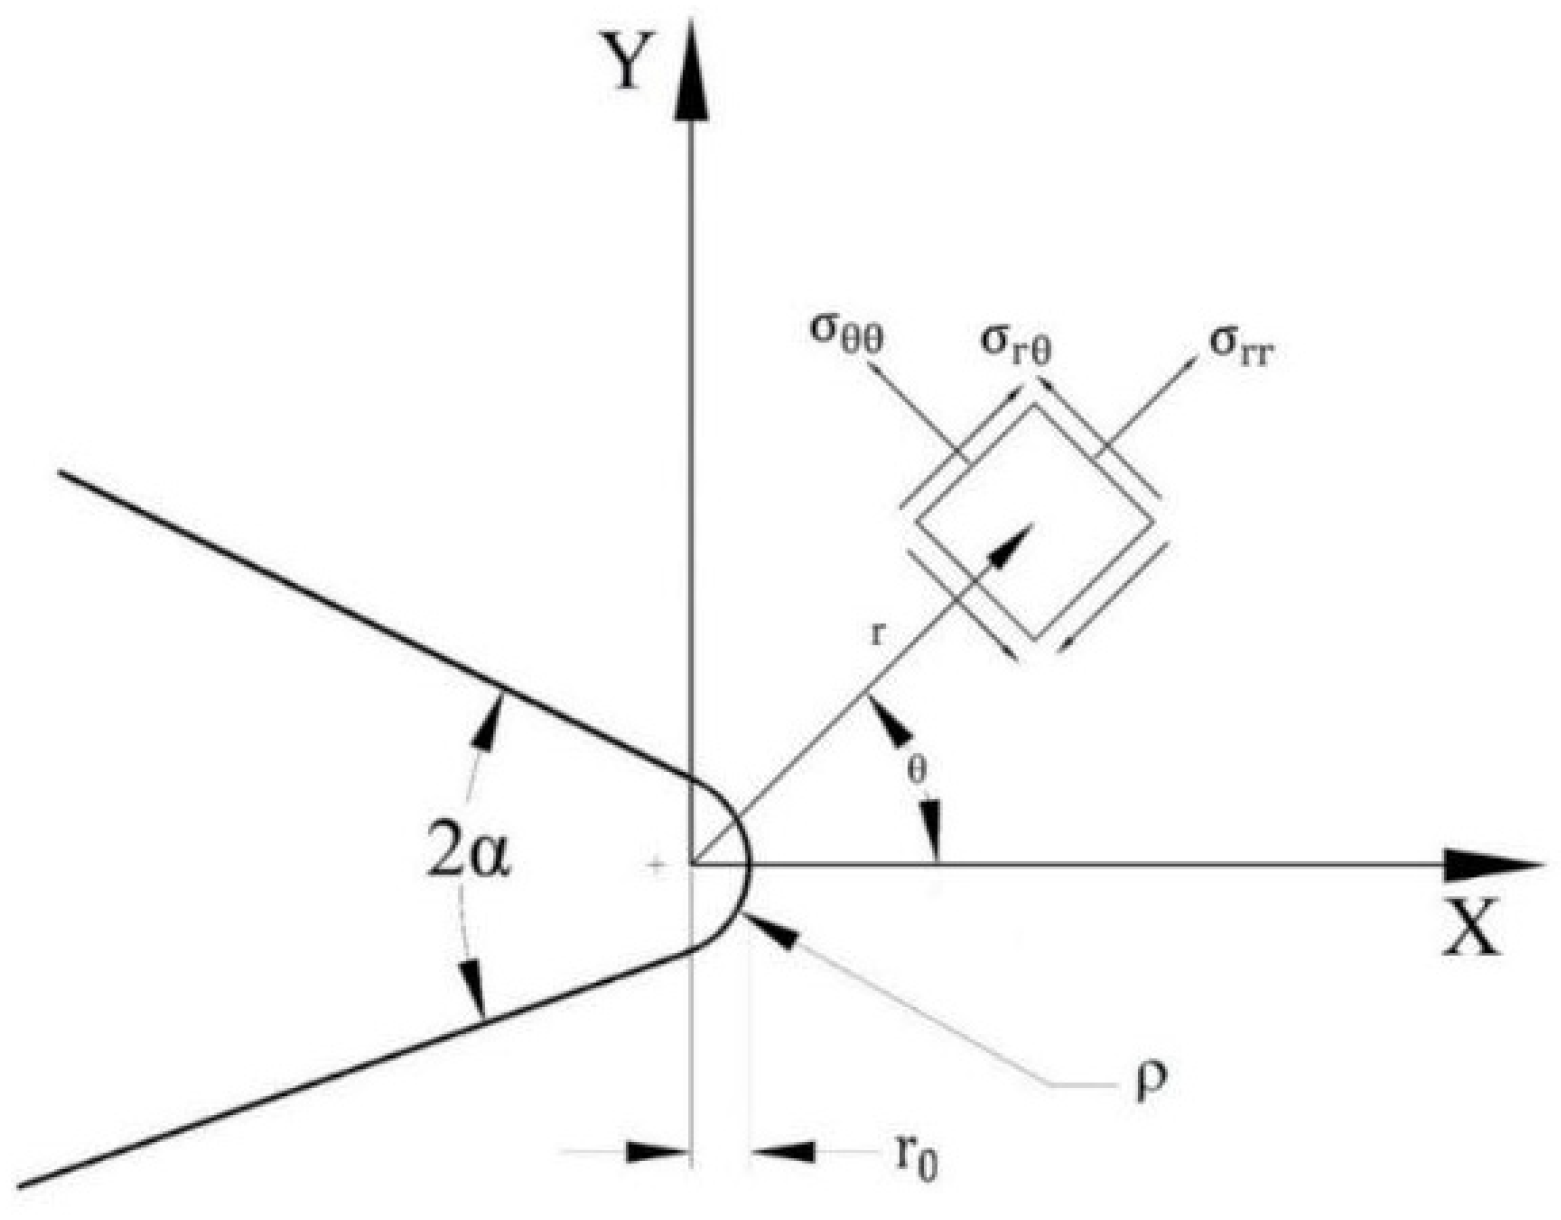
Figure 1. Round-tip V-notch with its Cartesian and polar coordinate systems.
Metals 11 01042 g001
Figure 2. Tensile stress–strain curves of ductile materials: (a) typical ductile material with strain-hardening in the plastic region; (b) elastic perfectly plastic model of the equivalent material.
Metals 11 01042 g002
Figure 3. Schematic of the elastic tangential stress variations on the notch bisector line versus the distance from the notch tip.
Metals 11 01042 g003
Figure 4. The shapes of the plastic zone around a sharp crack based on the von Mises yield criterion. (a) Results derived from the present study; (b) reported in [63].
Metals 11 01042 g004
Figure 5. The shapes of the plastic zone around a sharp crack based on the Tresca yield criterion; (a) obtained from the present study and (b) reported in [63].
Metals 11 01042 g005
Figure 6. (a) Tensile rectangular specimen containing central inclined blunt V-notches of various tip radii; (b) the tensile stress–strain curve of the AISI 304 steel [64].
Metals 11 01042 g006
Figure 7. Plastic zones obtained from FE analyses and the proposed methodology based on the von Mises yield criterion, with notch tip radii of (a) 0.5 mm, (b) 1 mm, (c) 2 mm, and (d) 4 mm. Notch rotation angle = 25°. Applied loads were 35, 40, 44, and 48 kN, respectively.
Metals 11 01042 g007
Figure 8. Plastic zones obtained from FE analyses and the proposed methodology based on the Tresca yield criterion, with notch tip radii of (a) 0.5 mm, (b) 1 mm, (c) 2 mm, and (d) 4 mm. Notch rotation angle = 25°. Applied loads are 35, 40, 44, and 48 kN, respectively.
Metals 11 01042 g008
Figure 9. Plastic zones obtained from FE analyses and the proposed methodology based on the von Mises yield criterion, with notch tip radii of (a) 0.5 mm, (b) 1 mm, (c) 2 mm, and (d) 4 mm. Notch rotation angle = 50°. Applied loads were 40, 43, 50, and 55 kN, respectively.
Metals 11 01042 g009
Figure 10. Plastic zones obtained from FE analyses and the proposed methodology based on the Tresca yield criterion, with notch tip radii of (a) 0.5 mm, (b) 1 mm, (c) 2 mm, and (d) 4 mm. Notch rotation angle = 50°. Applied loads were 40, 43, 50, and 55 kN, respectively.
Metals 11 01042 g010
Figure 11. EPZSs obtained from FE analyses and the proposed methodology (closed-form solution). Notch radius and notch rotation angle were 0.5 mm and 25°, respectively. σ0 was used instead of σY in the analytical solution.
Metals 11 01042 g011
Table 1. Discrepancies (Δ, %) between the results obtained from the numerical and analytical solutions for the EPZS based on the von Mises and Tresca yield criteria.
ρ (mm)von MisesTresca
β = 25°β = 25°
0.57.7−7.8
1.07.1−7.0
2.01.5−12.5
4.0−4.3−17.1
β = 50°β = 50°
0.53.314.7
1.0−10.68.8
2.0−19.2−1.6
4.0−27.4−8.1
Publisher’s Note: MDPI stays neutral with regard to jurisdictional claims in published maps and institutional affiliations.