Figure 1.
Homogeneous initial microstructure of X30Cr13 (V2A etchant). A ferritic matrix with chromium carbides is visible.
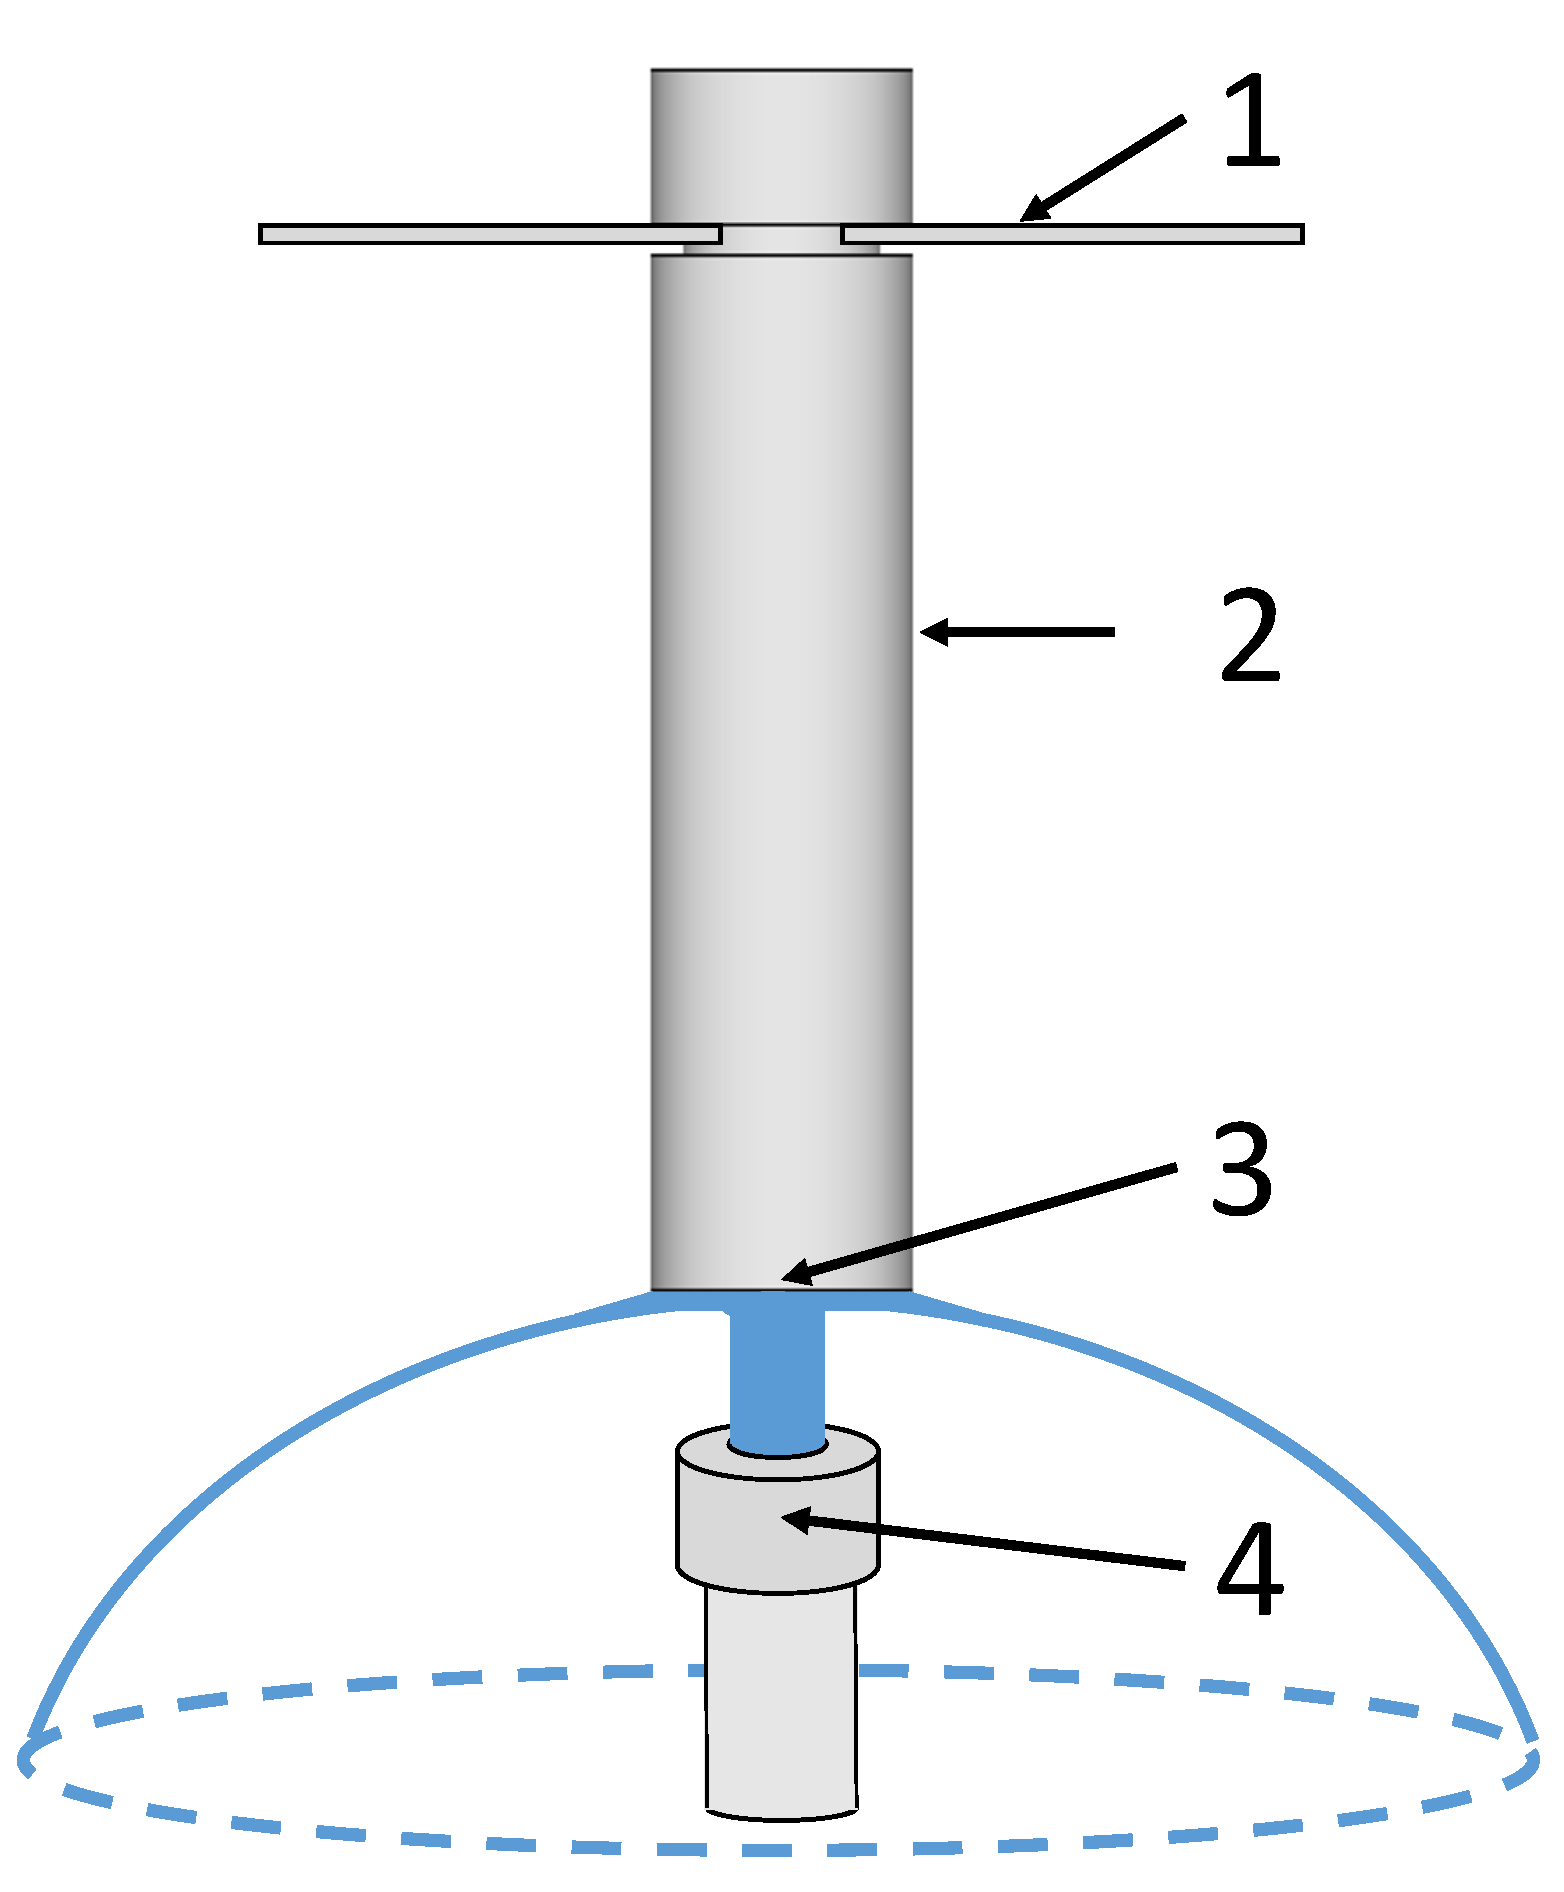
Figure 2.
Schematic illustration of the Jominy end quench device based on [
16]. (1) Mounting fixture, (2) Jominy test specimen, (3) end face of the test specimen quenched with water, and (4) water spray pipe.
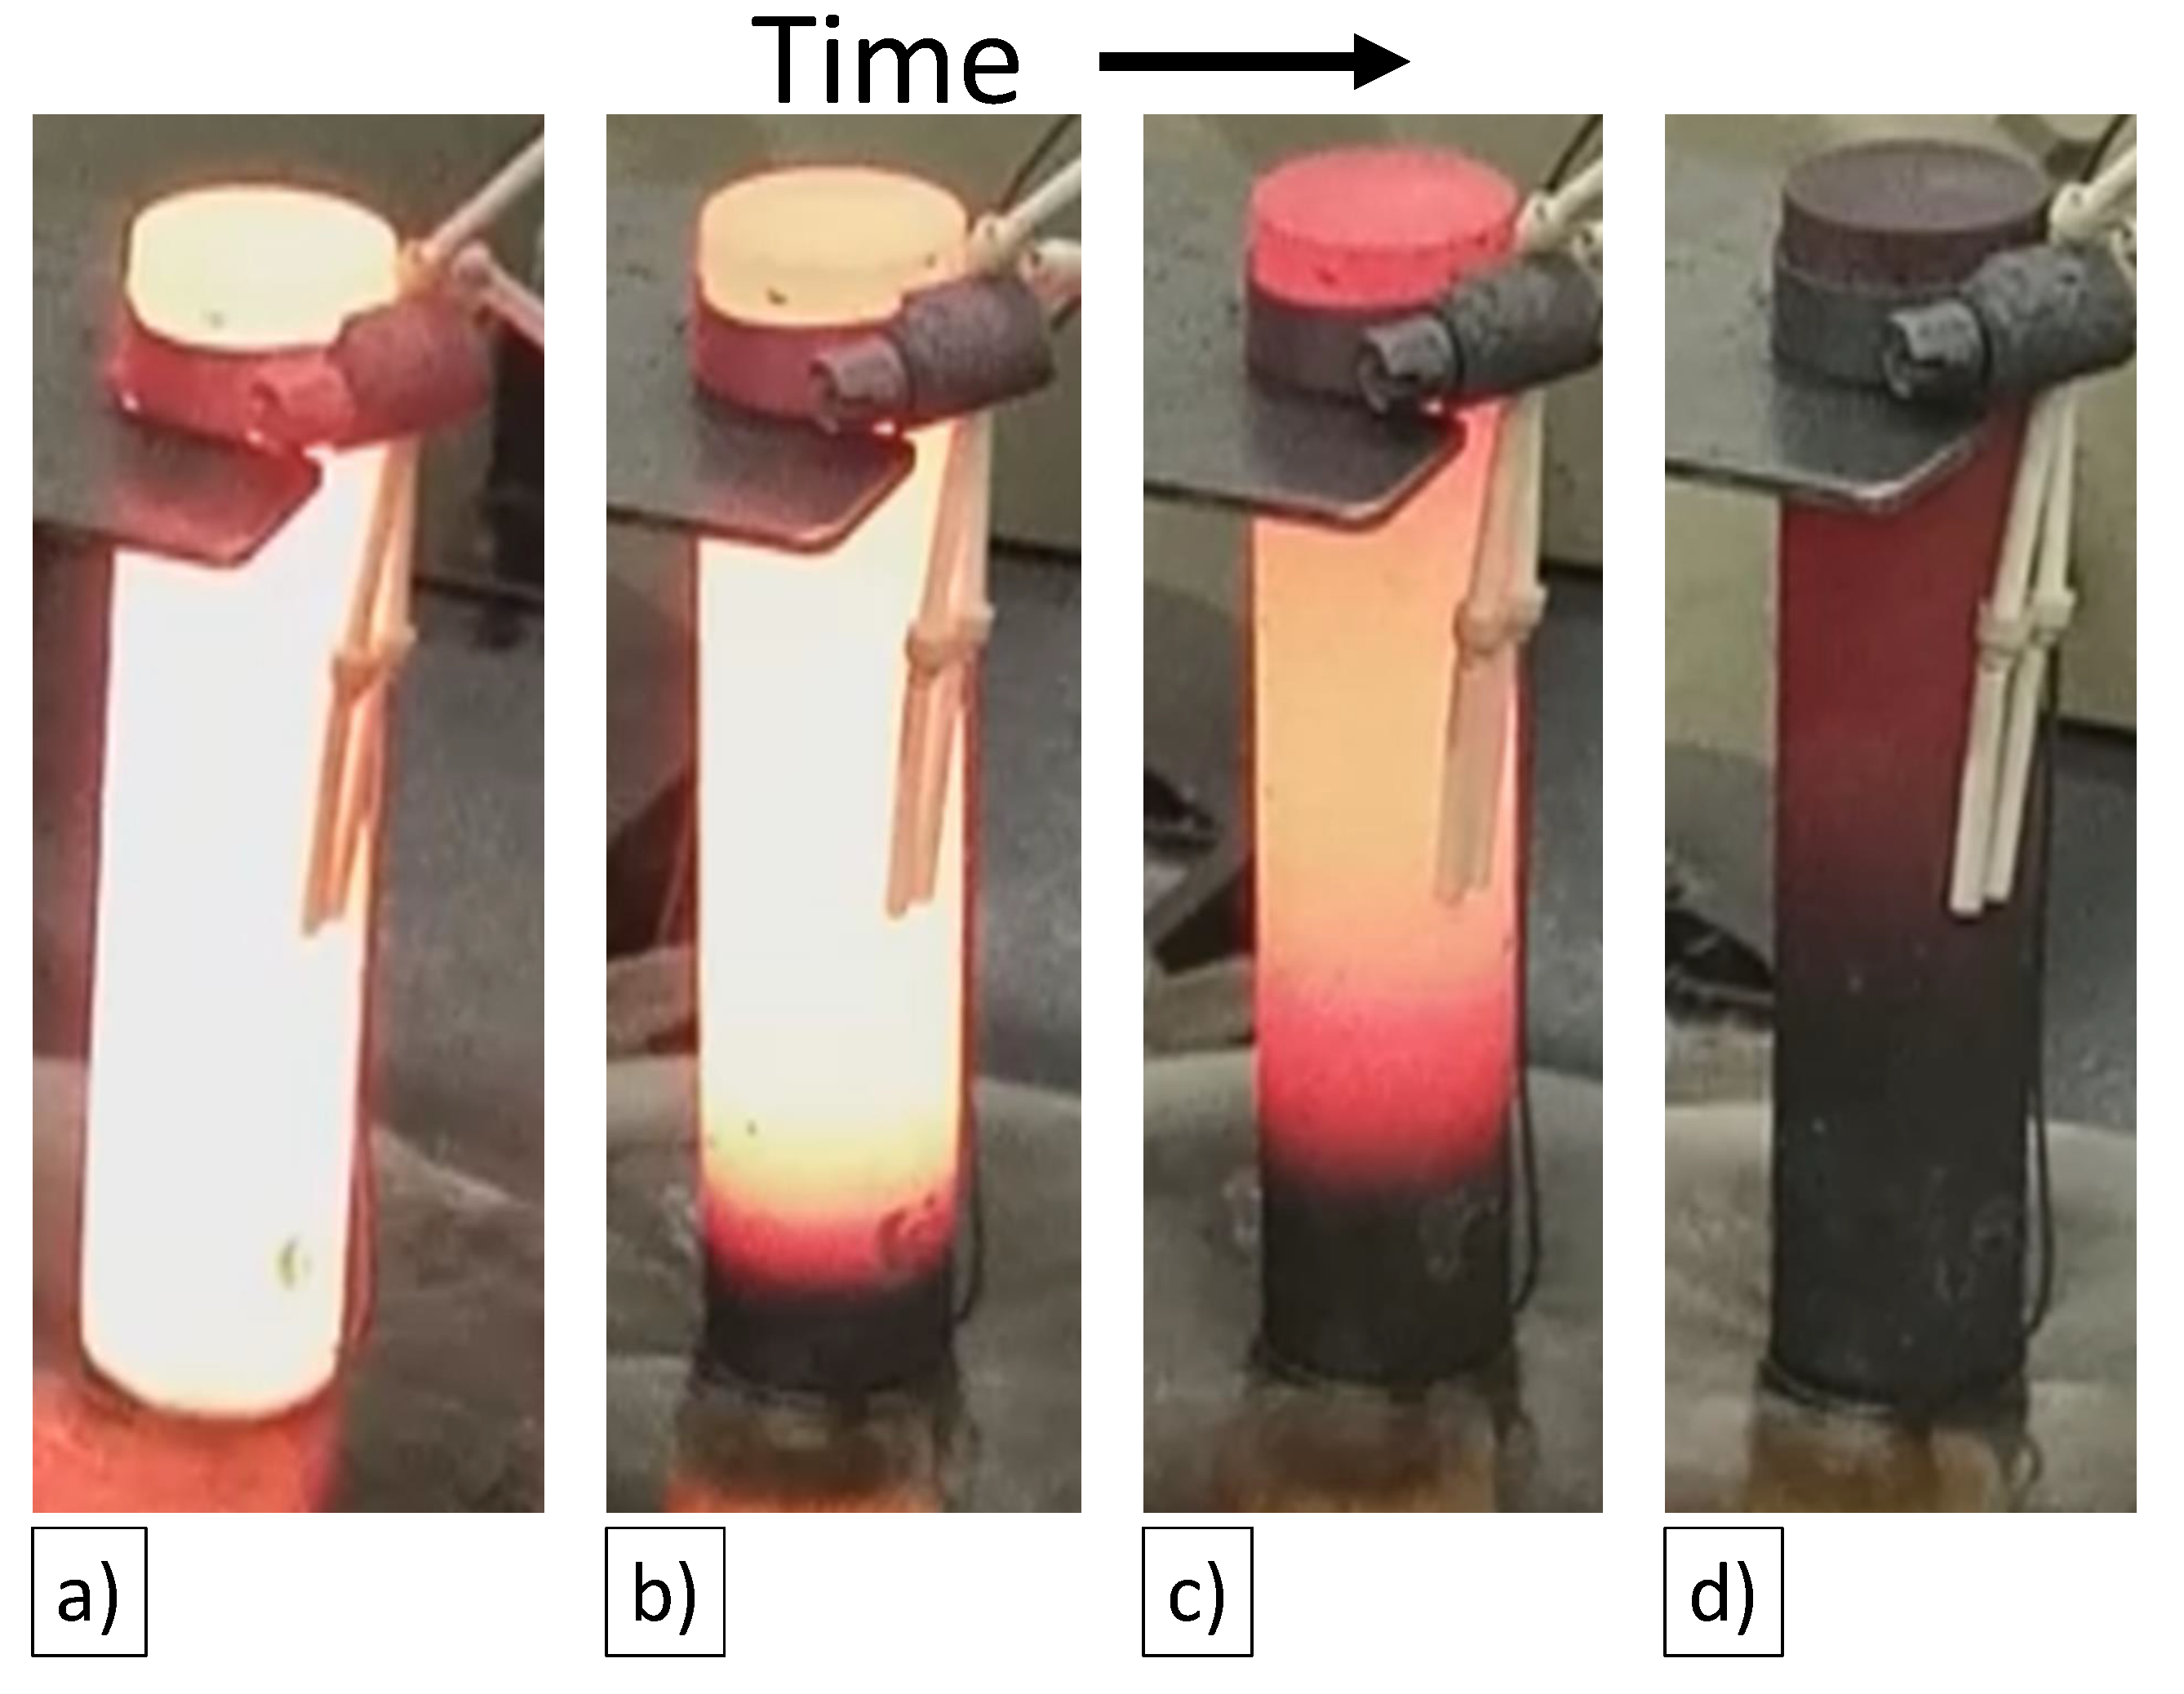
Figure 3.
Visible cooling during Jominy end quench test. Thermocouples are applied at the sample. The sample (a) directly after water contact (≈0 s), (b) after ≈15 s, (c) after ≈40 s, and (d) after ≈120 s.
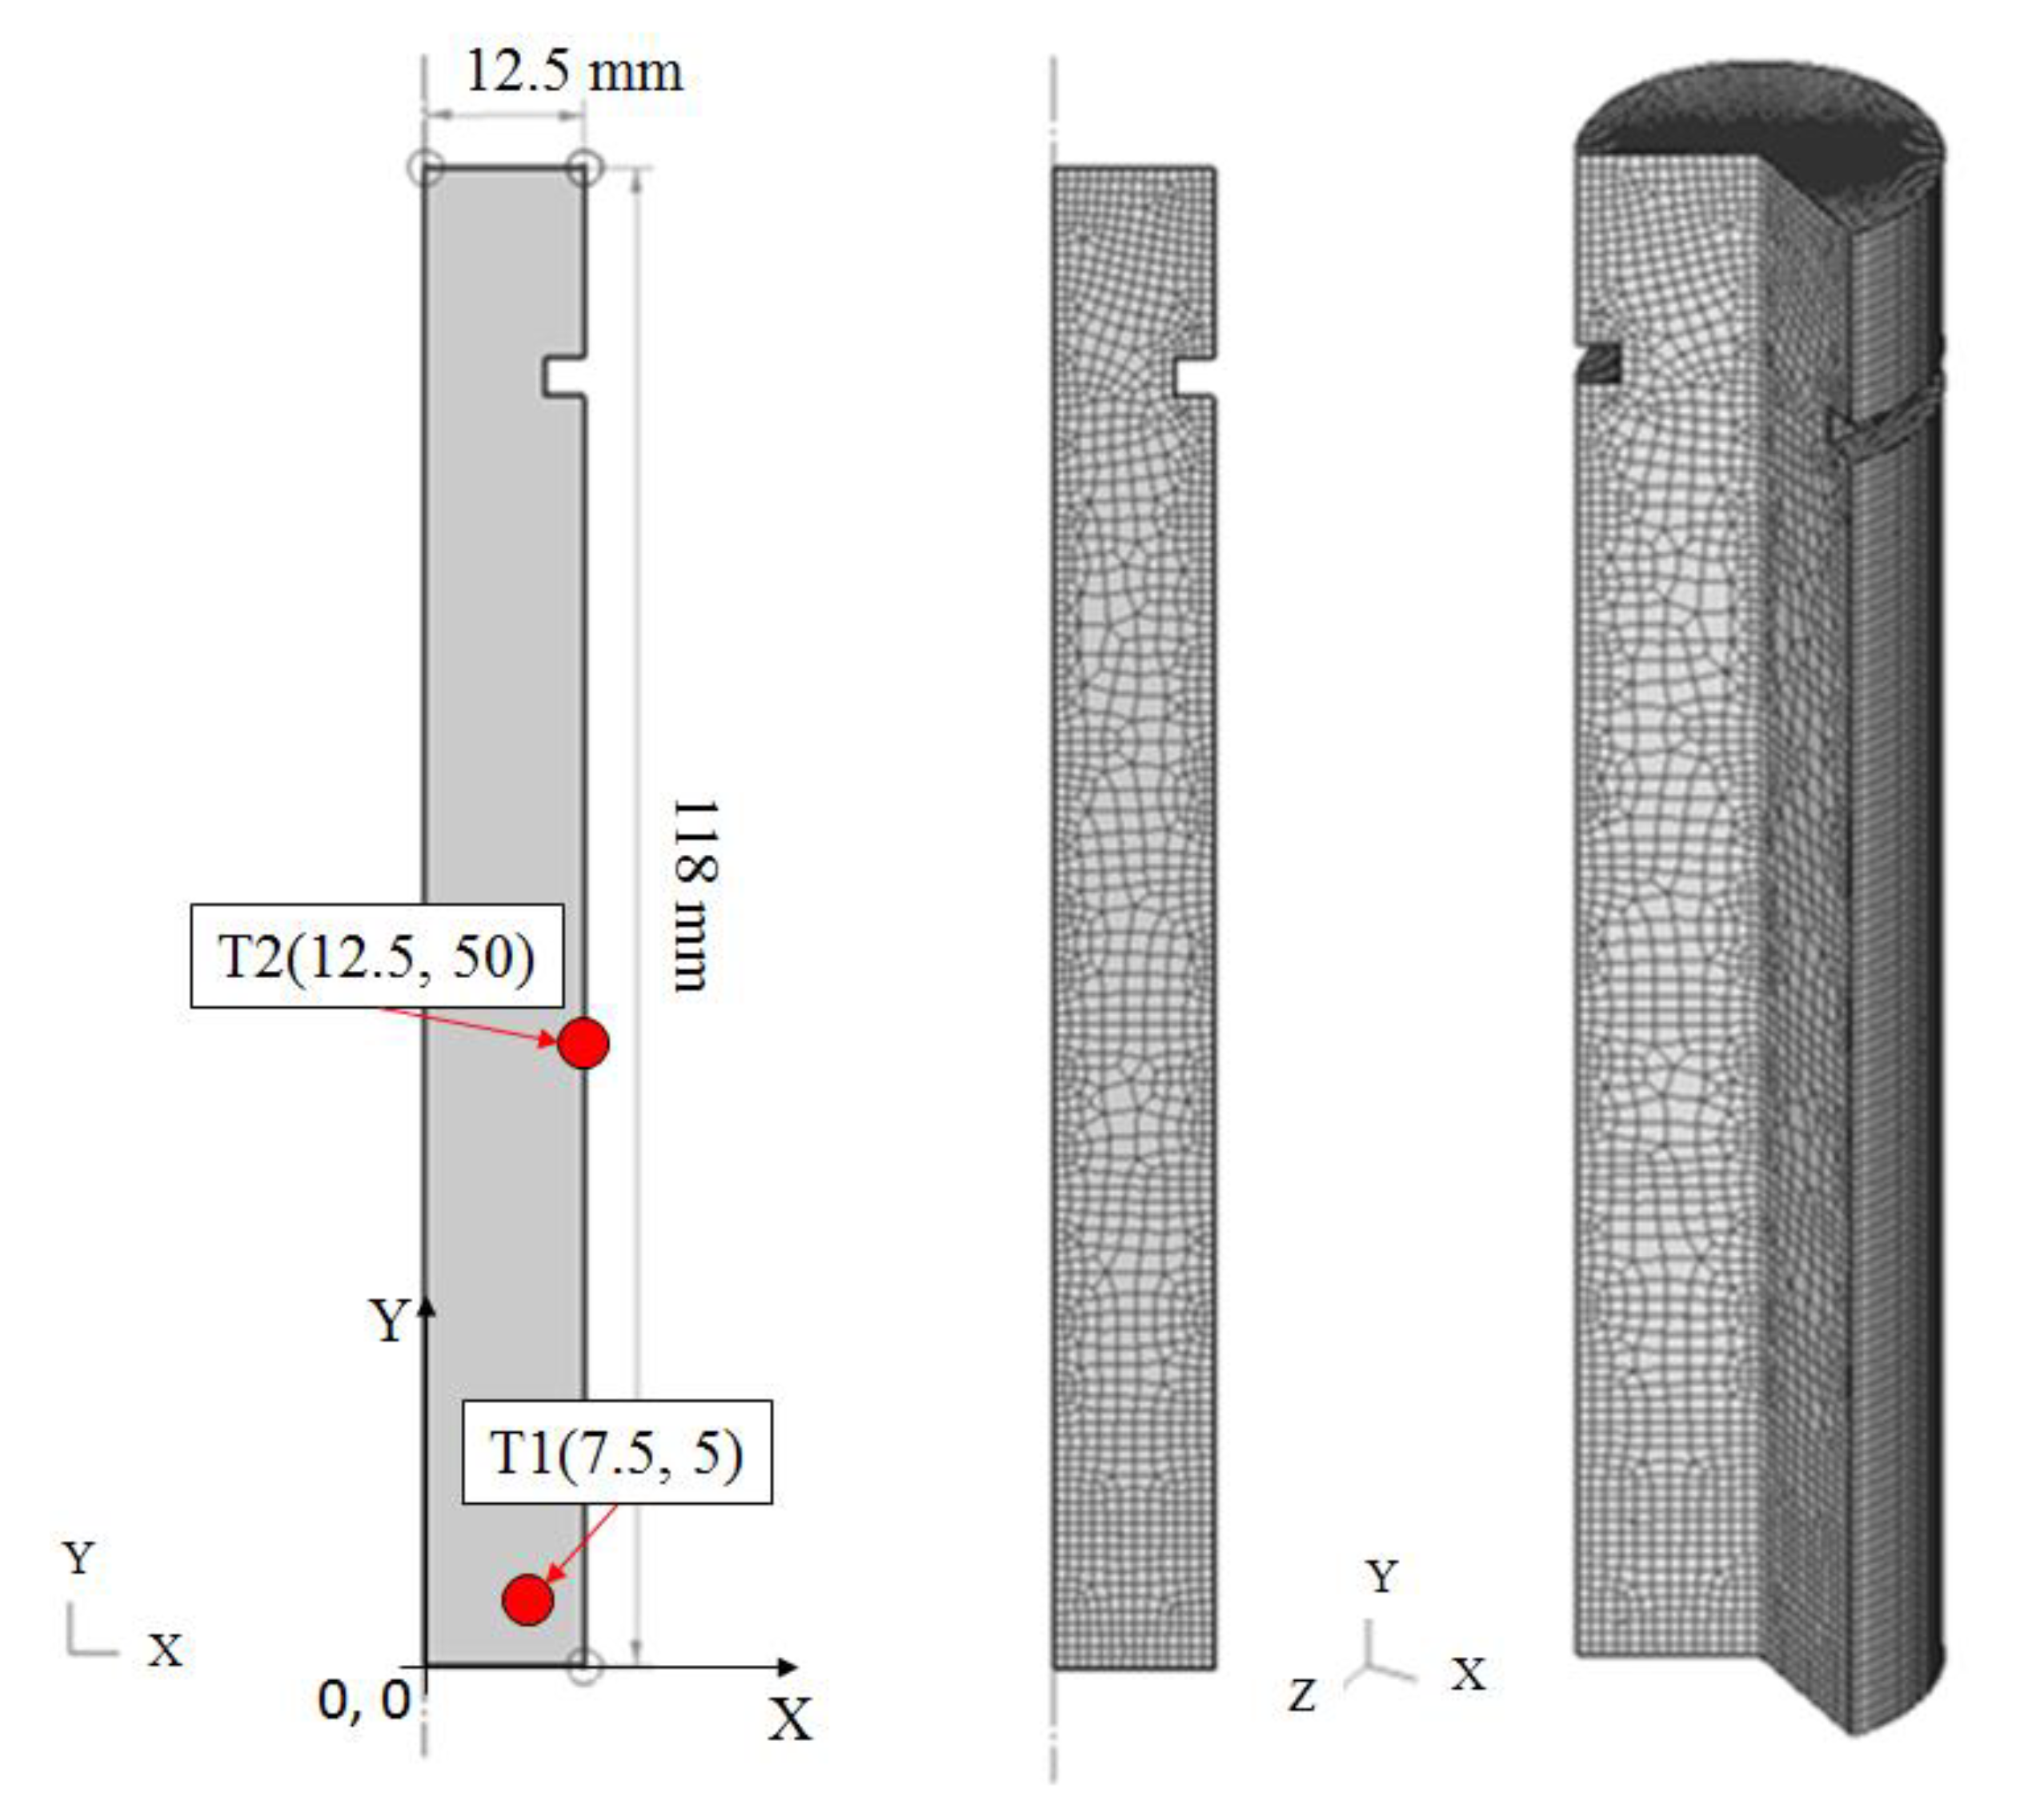
Figure 4.
Geometry of Jominy end quench test sample and transfer to FEM (2D and 3D View).
Figure 5.
Boundary conditions.
Figure 6.
Thermodynamically calculated phase composition (a) and local chemical composition of austenite (b) in equilibrium for X30Cr13.
Figure 7.
Thermal conductivity of different phases of X30Cr13 calculated by JMatPro®. The abbreviations in the legend mean the following: A: austenite, F: ferrite, P: pearlite, B: bainite, M: martensite and C: Carbides (M23C6).
Figure 8.
Volumetric heat capacity of different phases of X30Cr13 calculated by JMatPro®. The abbreviations in the legend mean the following: A: austenite, F: ferrite, P: pearlite, B: bainite, M: martensite and C: Carbides (M23C6).
Figure 9.
TTT 1% amount transformed (general steel and stainless steel mode for carbides) ASTM 7 calculated by JMatPro® used for FEM. The abbreviations in the graph mean the following: A: austenite, C: carbides, P: pearlite, B: bainite, M: martensite. In order to show the influence of the grain size, the TTT curve for 1100 °C and a grain size of ASTM 2.5 were added.
Figure 10.
TTT 0.1% and 1 amount transformed (stainless steel mode: Austenitic) calculated by JMatPro® used for FEM. Transformation data of M23C6 is shown.
Figure 11.
Experimental time-temperature sequences during the Jominy end quench test for different austenitizing temperatures.
Figure 12.
Comparison between experimental and simulated time-temperature sequences T1 and T2.
Figure 13.
Correlation between experimental and simulated time-temperature curves.
Figure 14.
Cooling rate calculated by FE simulation as a function of the distance (along the X axis equal to 12 mm from Y = 0 mm to Y = 100 mm).
Figure 15.
Selected micrographs (optical microscopy) of X30Cr13 as a function of the austenitizing temperature and the distance from the quenched end face and thus the cooling rate: (a) 1000 °C and 1 mm, (b) 1000 °C and 50 mm, (c) 1100 °C and 1 mm, and (d) 1100 °C and 50 mm. V2A reagent was used as the etchant.
Figure 16.
Selected micrographs (optical microscopy) of X30Cr13 of 1100 °C and 1 mm distance from the quenched end face using an etchant accoding to the work in [
17] consisting of 925 mL ethanol, 25 g picric acid, and 50 mL hydrochloric acid. The retained austenite is very well recognizable.
Figure 17.
Selected micrographs (SEM: EHT = 20 kV, Detector = HDBSD, WD = 6.2 mm to 7.5 mm) of X30Cr13 as a function of the austenitizing temperature and the distance from the quenched end face and thus the cooling rate: (a) 1000 °C and 1 mm, (b) 1000 °C and 50 mm, (c) 1100 °C and 1 mm, and (d) 1100 °C and 50 mm.
Figure 18.
Selected microstructures of X30Cr13 used for EDX analysis with SEM as a function of the austenitizing temperature and the distance from the quenched end face and thus the cooling rate: (a) 1000 °C and 1 mm, (b) 1000 °C and 50 mm, (c) 1100 °C and 1 mm, and (d) 1100 °C and 50 mm. The different measuring points are marked and named. The analyzed sections are framed in pink.
Figure 19.
XRD pattern of the different Jominy end quench test specimens at different austenitizing temperature and distance from the quenched end face. The counts are plotted as a function of the angle 2Θ. The postion of the phases austenite and martensite are marked.
Figure 20.
Retained austenite measured by XRD. At 1000 °C and 1050 °C the mean values are shown with the respective minimum and maximum values. Note that a mass fraction of 1% is the detection limit. Due to larger variations at 1100 °C, a total of eight measurements, each at 1 mm and 50 mm, were carried out by XRD. In this case, the mean values and the standard deviation are presented.
Figure 21.
c/a ratio of martensite with respective scattering band (minimum and maximum) measured by XRD.
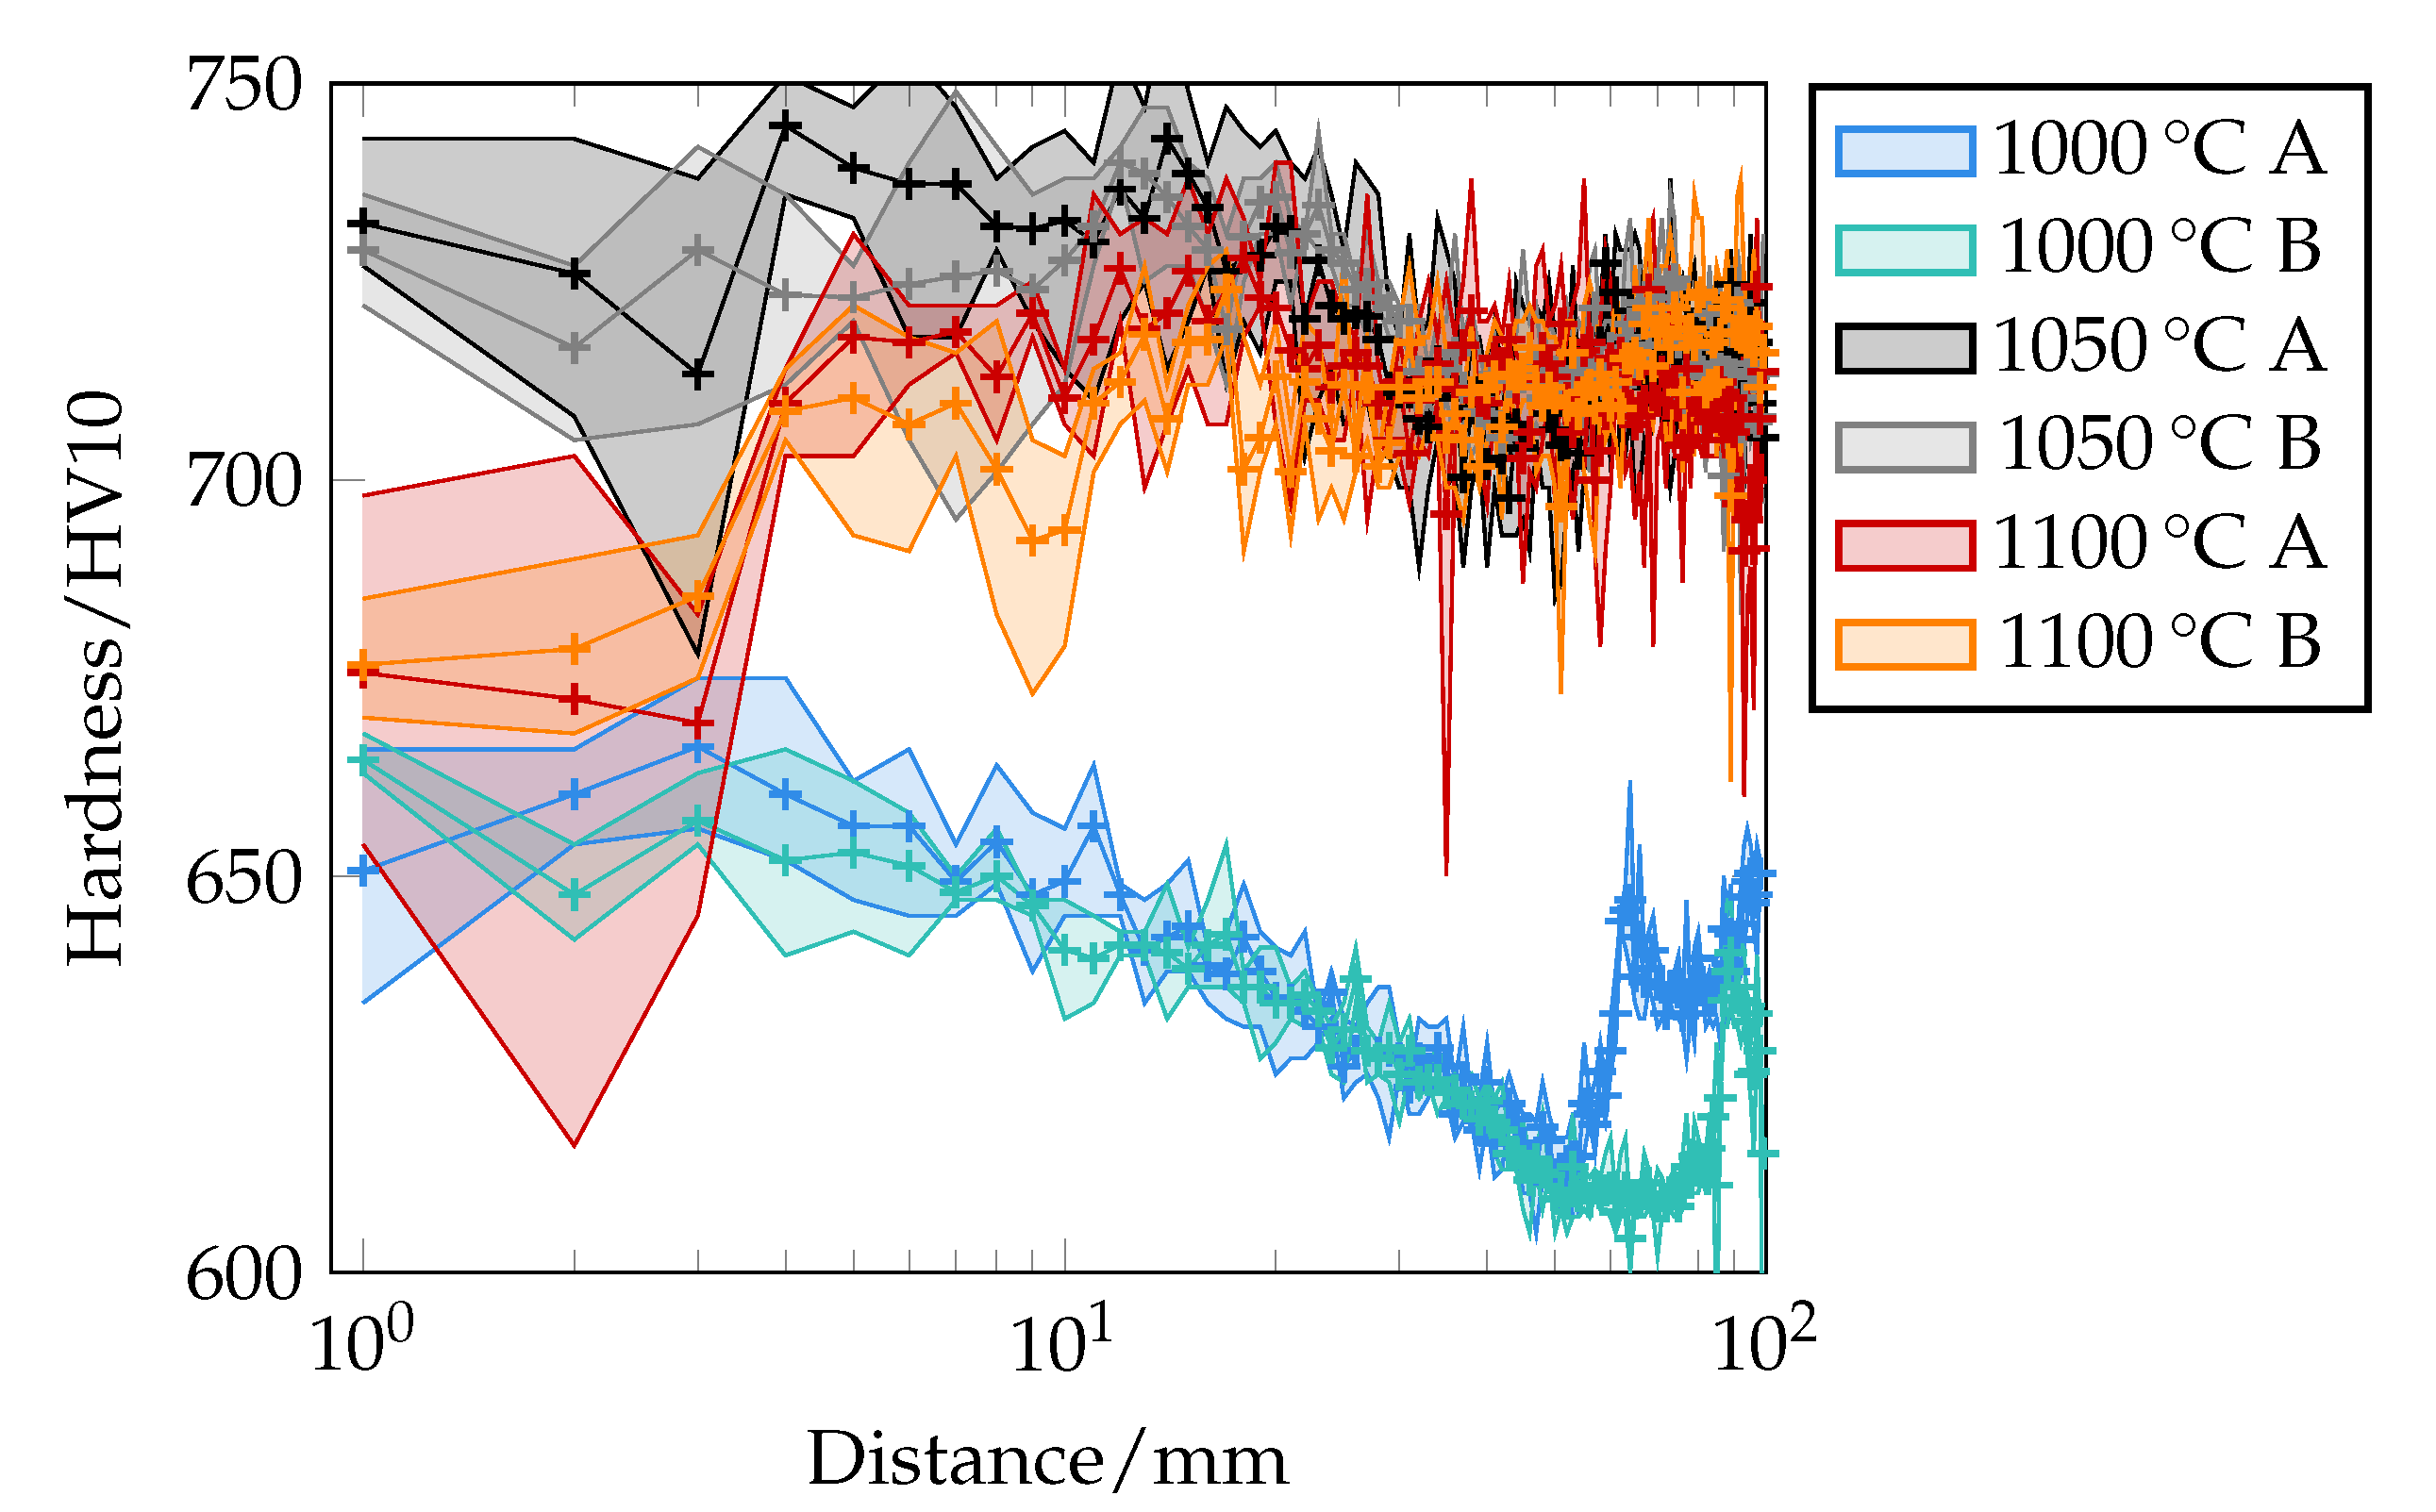
Figure 22.
Experimentally determined hardness profile as a function of the distance from the quenched end face of the Jominy end quench test in HV10. Measured every 1 mm indicated by marks (+). A and B indicate the respective test area of different specimens.
Figure 23.
Hardness/HV10 as a function of the cooling rate (logarithmic scale) and the austenitizing temperature.
Figure 24.
Experimentally determined pitting corrosion potential as a function of the distance from the quenched end face of the Jominy end quench test in mV. Measuring points indicated by marks (+): 1 mm, 2.5 mm, 5 mm, 10 mm, 20 mm, 50 mm, 80 mm.
Figure 25.
Pitting corrosion potential Ag/AgCl (3 mol KCl) as a function of the cooling rate (logarithmic scale) and the austenitizing temperature.
Figure 26.
Product of normalized hardness and pitting corrosion potential (equally weighted) as a function of the cooling rate (logarithmic scale) and the austenitizing temperature to determine an optimum process window with high corrosion resistance and hardness.
Table 1.
Chemical composition of the investigated steel X30Cr13 by spectrometric analysis (balance Fe).
| Elements | C | Cr | Si | Mo | Mn | P | S | Ni | V | Cu |
|---|
| Mass | | | | | | | | | | |
| fractions/% | 0.37 | 13.76 | 0.36 | 0.06 | 0.38 | 0.032 | 0.001 | 0.15 | 0.045 | 0.22 |
Table 2.
Austenitizing temperatures in °C. The holding time including heating was 50 min.
| Austenitizing Temperature/°C | 1000 | 1050 | 1100 |
Table 3.
2D Mesh parameters used in DEFORM™-HT.
| Number of Elements | Number of Nodes | Size Ratio | Shape of the Elements |
|---|
| 1308 | 1467 | 4 | Square |
Table 4.
Calculated composition of X30Cr13 at different temperatures using JMatPro®.
| Temperature/°C | 1000 | 1050 | 1100 |
|---|
| Mass fraction of elements in γ/% | | | |
| C in γ | 0.24 | 0.32 | 0.37 |
| Cr in γ | 12.69 | 13.39 | 13.76 |
| Mass fraction phases/% | | | |
| Austenite | 97.58 | 99.13 | 100 |
| M23C6 | 2.42 | 0.87 | 0 |
Table 5.
Martensite transformation temperatures as a function of the heat treatment temperatures calculated by JMatPro®. MS is the temperature at which the transformation of martensite started, and M50% is the temperature at which 50% of martensite has transformed.
| Temperature/°C | 1000 | 1050 | 1100 |
|---|
| MS/°C | 269 | 242 | 228 |
| M50/°C | 232 | 204 | 189 |
Table 6.
Determined grain size G according to the work in [
18] as a function of austenitizing temperatures in °C. The holding time including heating was 50 min.
| Austenitizing Temperature/°C | 1000 | 1050 | 1100 |
|---|
| Grain size G/- | 7 | 6 | 2.5 |
Table 7.
Mass fraction of chromium in measured by EDX Analysis using SEM. In addition to the chromium content, the content of silicon, sulfur, manganese, and iron was determined. The mass fractions of carbon were not considered in the quantification because the atomic number of carbon is only six. At 1100 °C and 1 mm, no chromium content of the carbides could be determined because no carbides were recognizable or they were too small. Therefore, a larger section is analyzed. This is assumed to be the matrix (mainly martensite with small fractions of retained austenite). Please note that the analyzed sections cover different areas/volumes, each with different fractions of carbides, compare
Figure 18 (pink frame).
| Temperature/°C | Distance/mm | Carbides | Matrix | Section |
|---|
| | | | (Martensite) | |
|---|
| Measuring | | | | | | | |
| fields | 1 | 2 | 3 | 1 | 2 | 1 | 2 |
| 1000 | 1 | 31.57 | | | 14.18 | 13.61 | | 14.94 |
| 1000 | 50 | 36.51 | 33.80 | 24.86 | 13.35 | 12.81 | 14.62 | 14.28 |
| 1100 | 1 | | | | | | 14.10 | 13.95 |
| 1100 | 50 | 21.99 | 35.93 | | 15.72 | 15.06 | | 16.72 |
Table 8.
Mass fractions of retained austenite and martensite phases of the Jominy end quench test specimens as a function of austenitizing temperature and distance from the quenched end face measured by XRD. Note that a quantification of the fractions of chromium carbides based on the XRD investigations was not possible due to their too low contents and densities. At 1050 °C and 50 mm distance to the quenched end face, as well as at 1000 °C, the retained austenite content was in the first measurement below the detection limit of 1%. The standard deviation of the phase fractions for the samples austenitised at 1100 °C results from the eight measurements.
| Temperature/°C | 1000 | 1050 | 1100 |
|---|
| Distance/mm | Mass fraction of retained austenite/% |
| 1 | <1–4 | 2–6 | |
| 50 | <1–2 | <1–3 | |
| Distance/mm | Mass fraction of martensite/% |
| 1 | 96–>99 | 94–98 | |
| 50 | 98–>99 | 97–>99 | |
Table 9.
Pitting corrosion potentials Ag/AgCl (3 mol KCl)/mV.
| Temperature/°C | 1000 | 1050 | 1100 |
|---|
| Distance/mm | Pitting corrosion potentials/mV |
| 1 | | | |
| 2.5 | | | |
| 5 | | | |
| 10 | | | |
| 20 | | | |
| 50 | | | |
| 80 | | | |
Table 10.
Recommended cooling rates and austenitizing temperatures to obtain high hardness and corrosion resistance.
| Property | | |
|---|
| Hardness/HV10 | 5 Ks−1 to 40 Ks−1 | 1050 °C |
| Pitting corrosion potentials Ag/AgCl (3 mol KCl)/mV | 5 Ks−1 to 40 Ks−1 | 1100 °C |


 ,
, 


