
Unified Modelling of Flow Stress and Microstructural Evolution of 300M Steel under Isothermal Tension


Abstract
:1. Introduction
2. Materials and Methods
2.1. Material
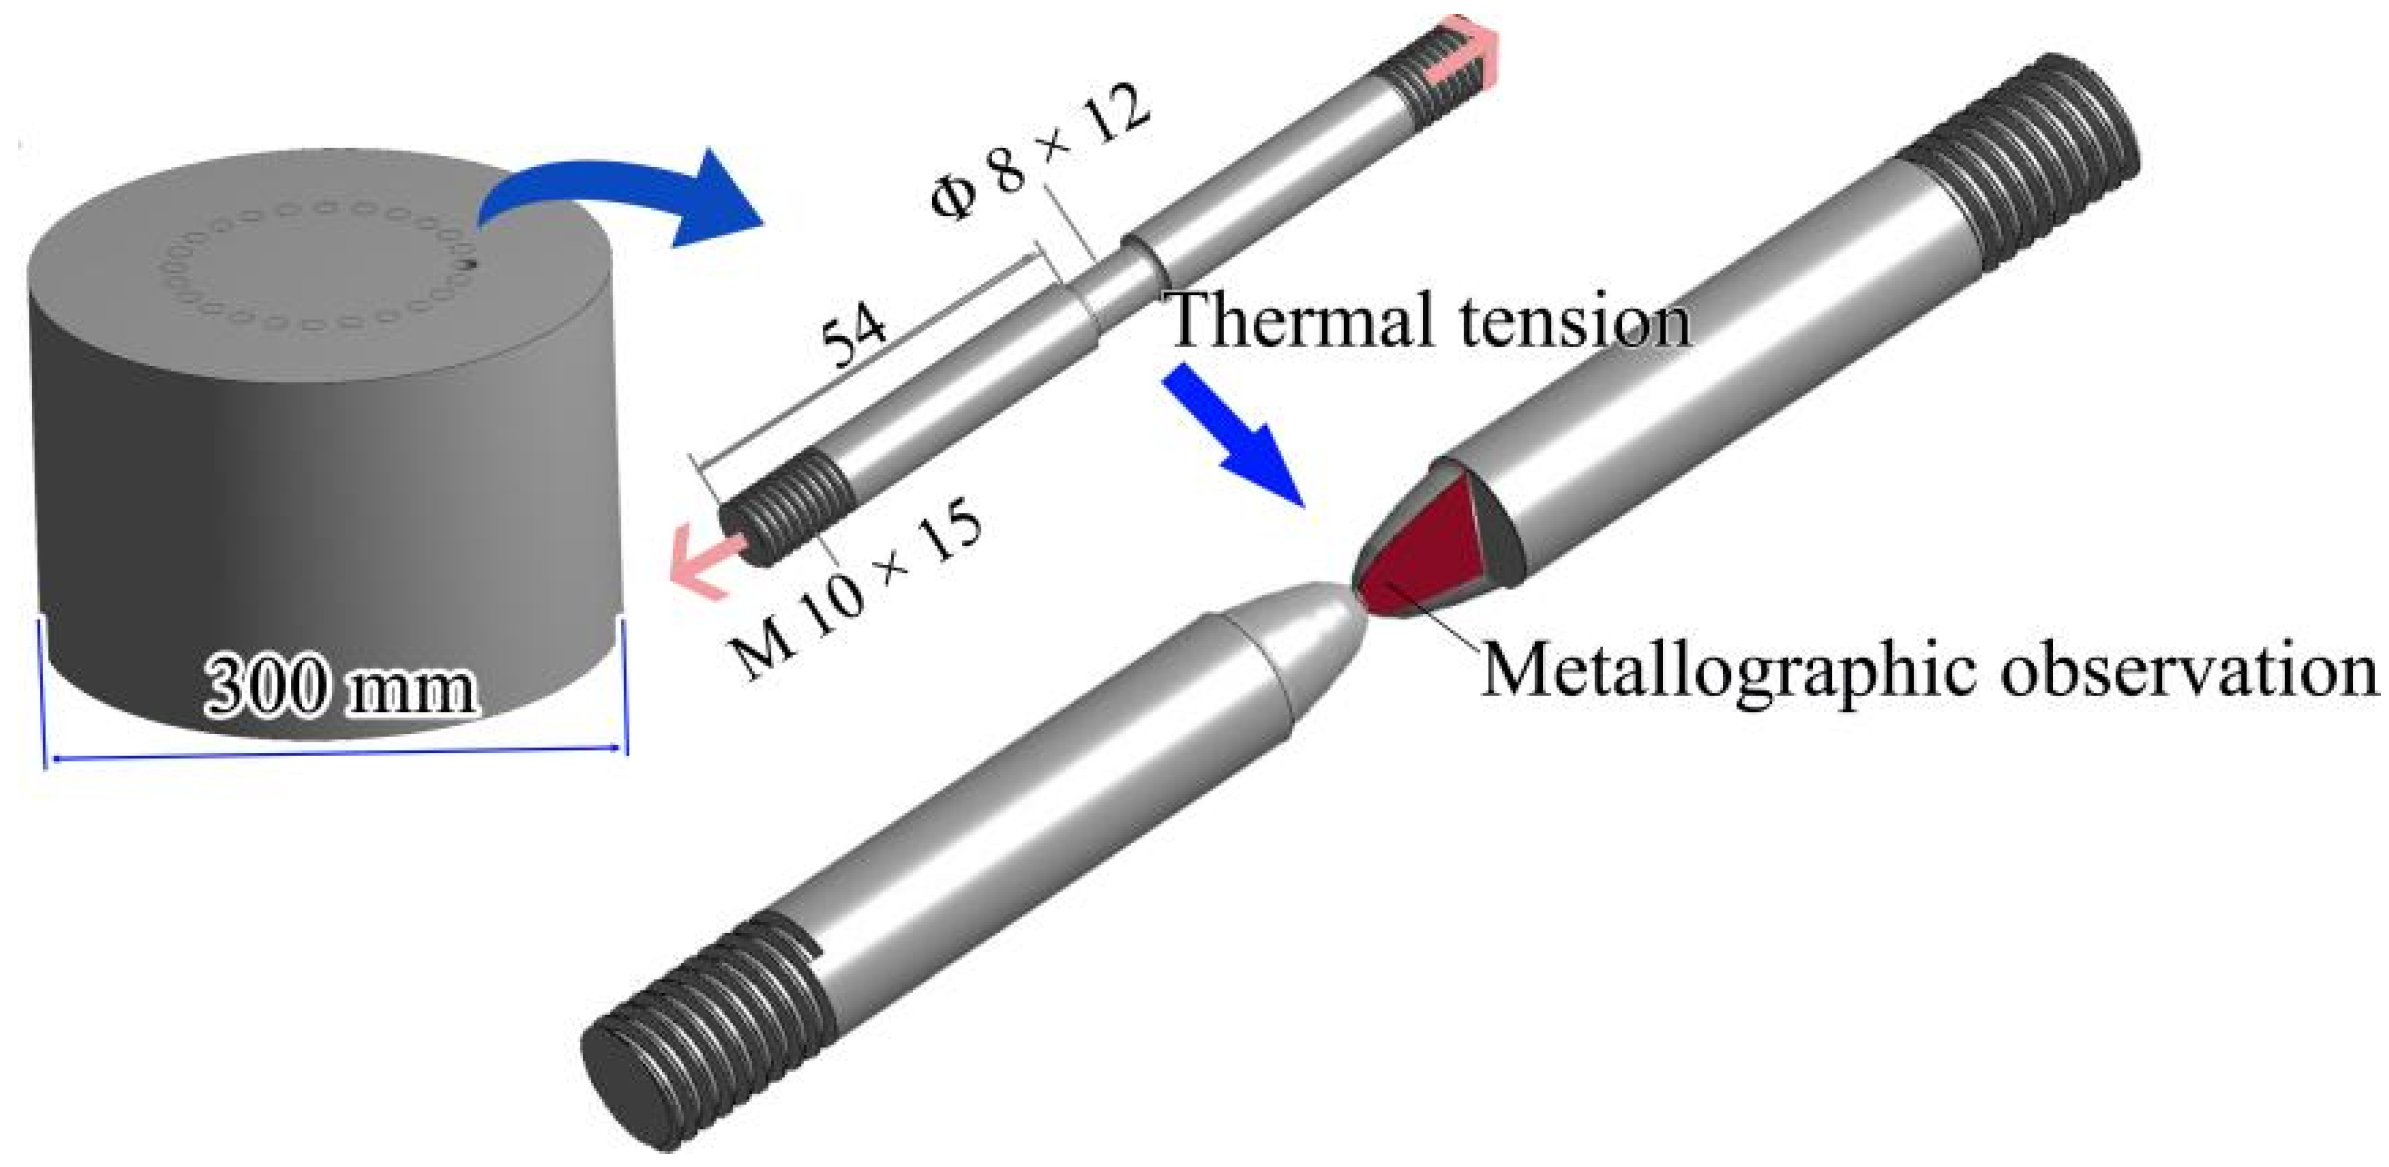
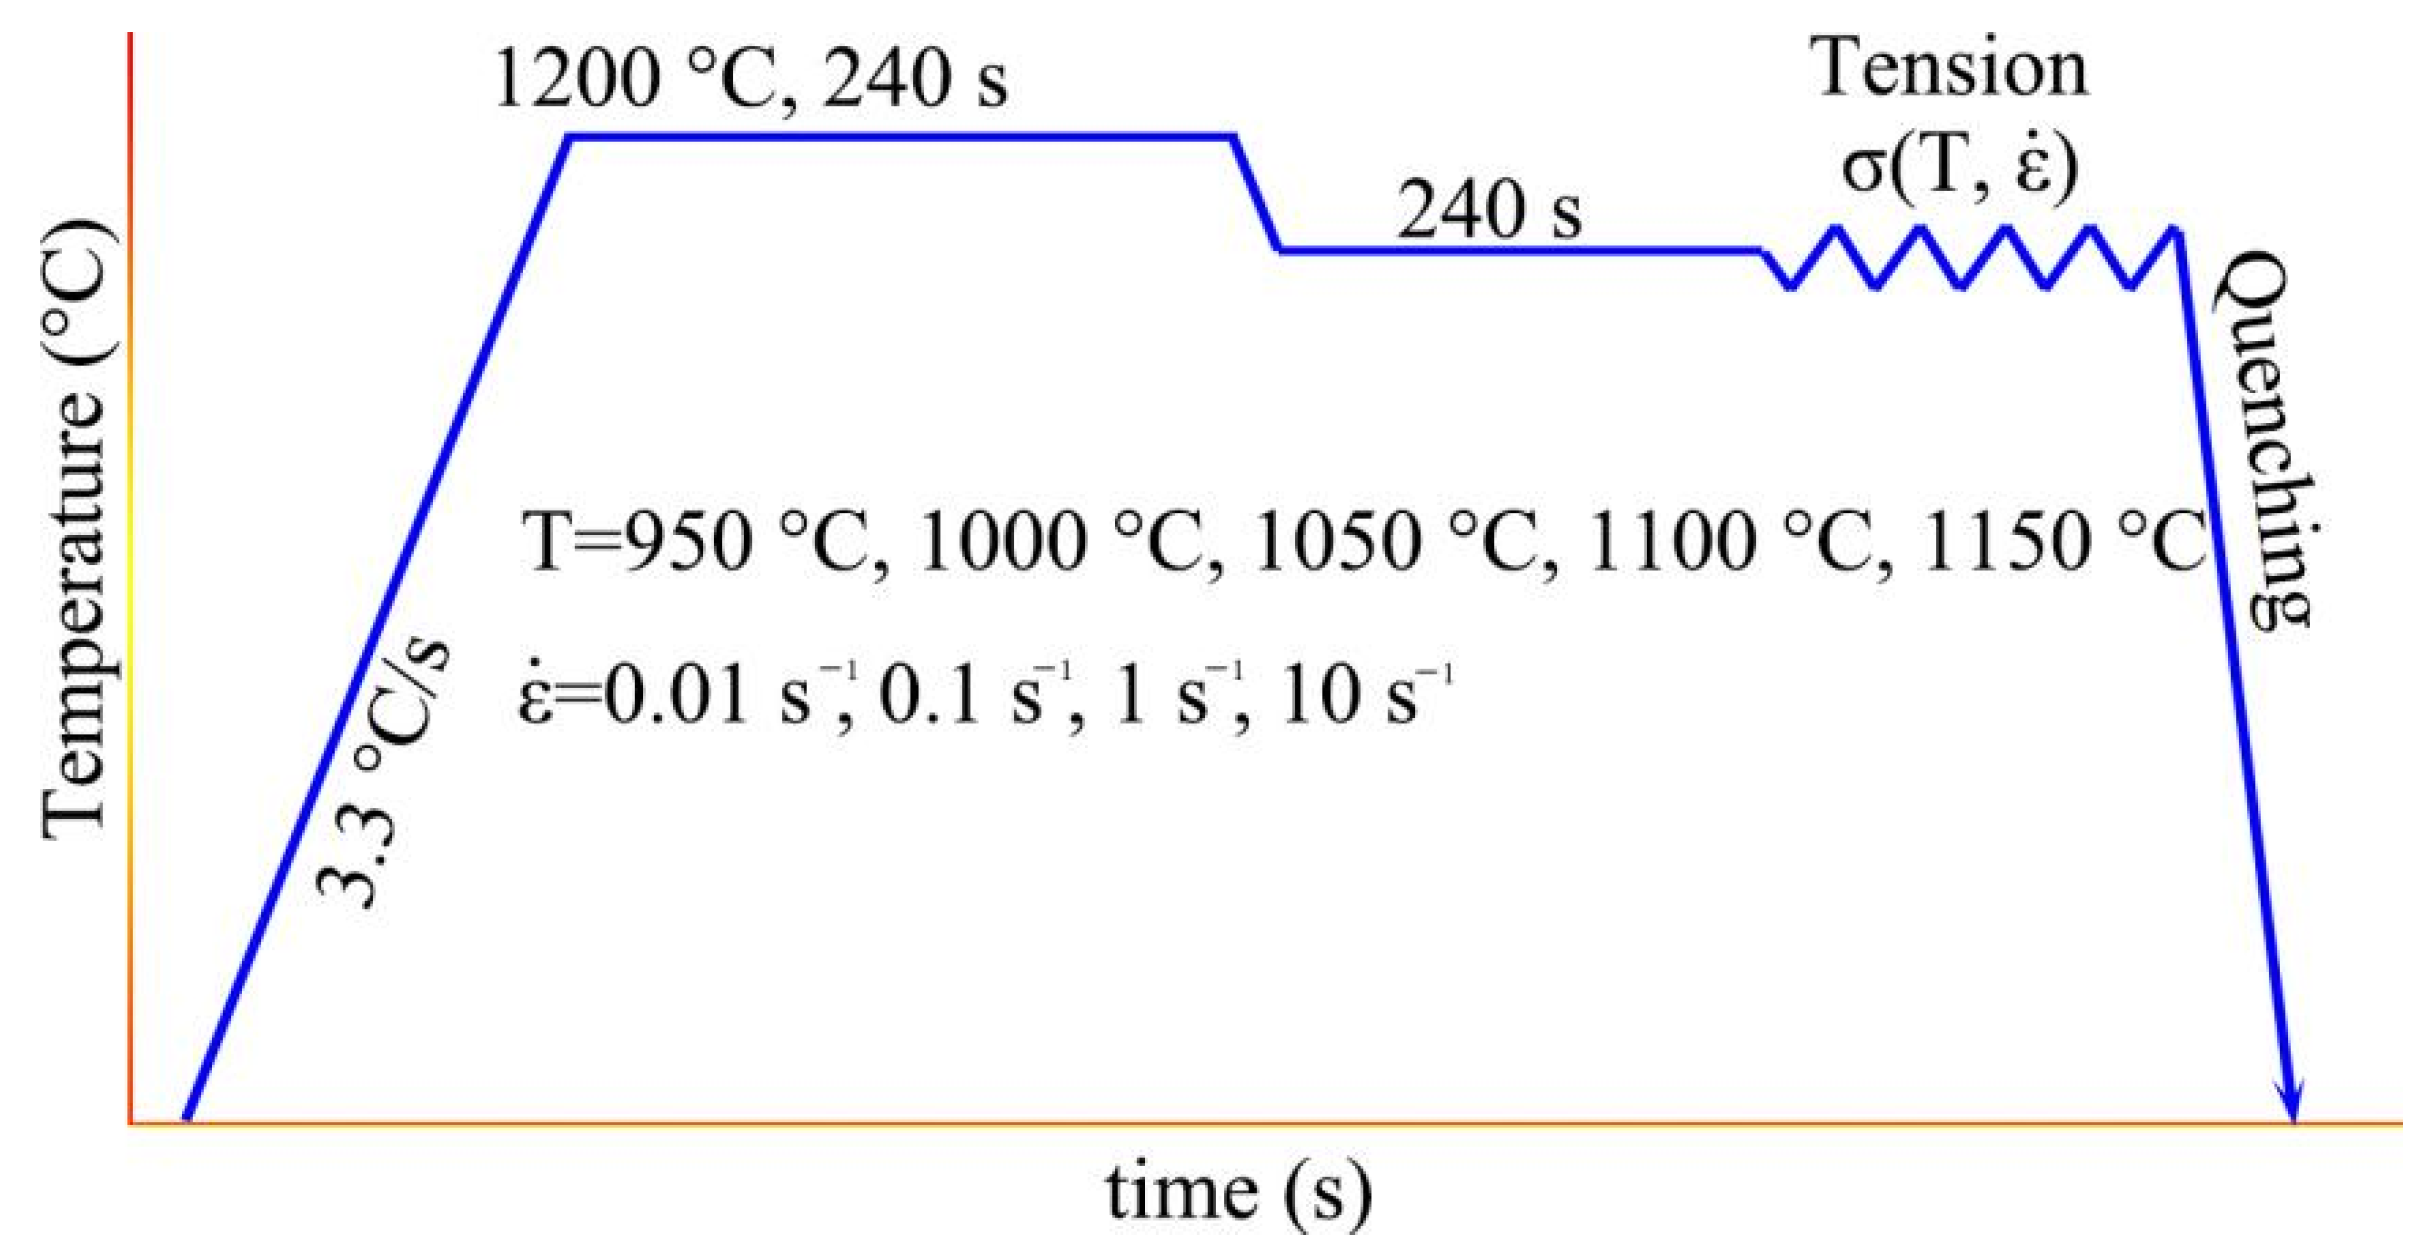
2.2. Thermal Tension Experiment
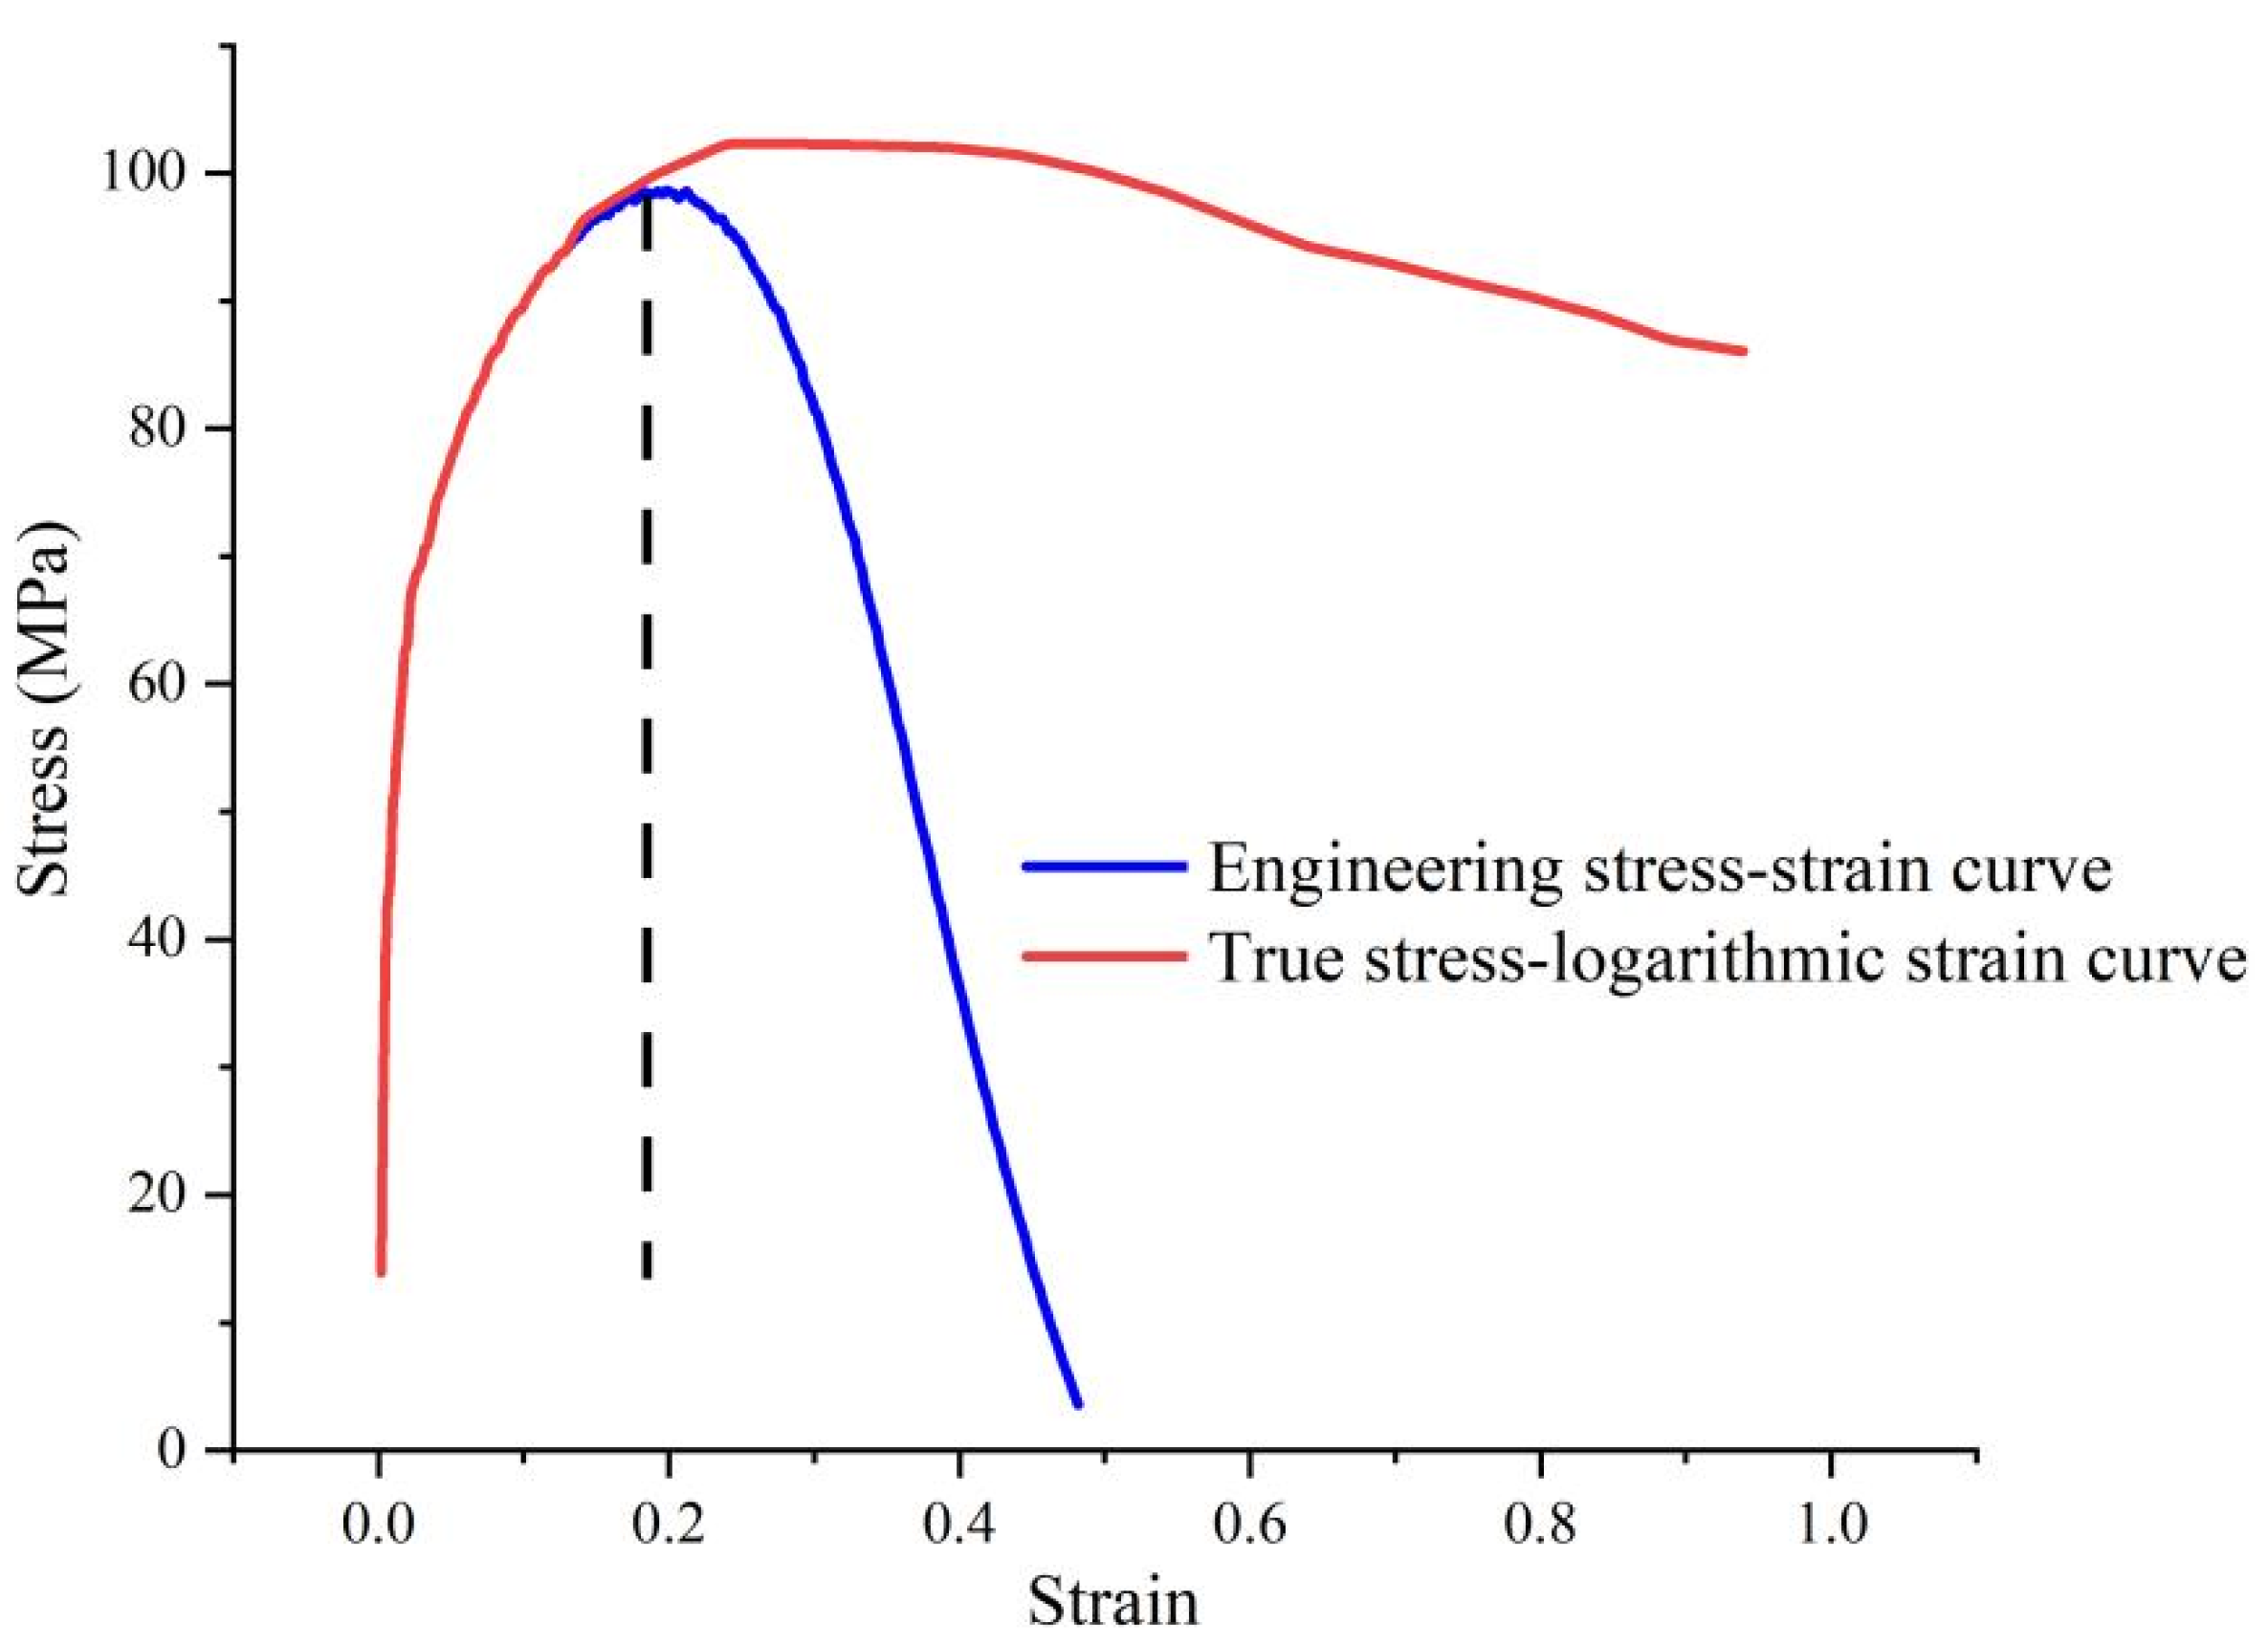
2.3. Stress and Strain Correction
2.4. Microstructure Observation
3. Results
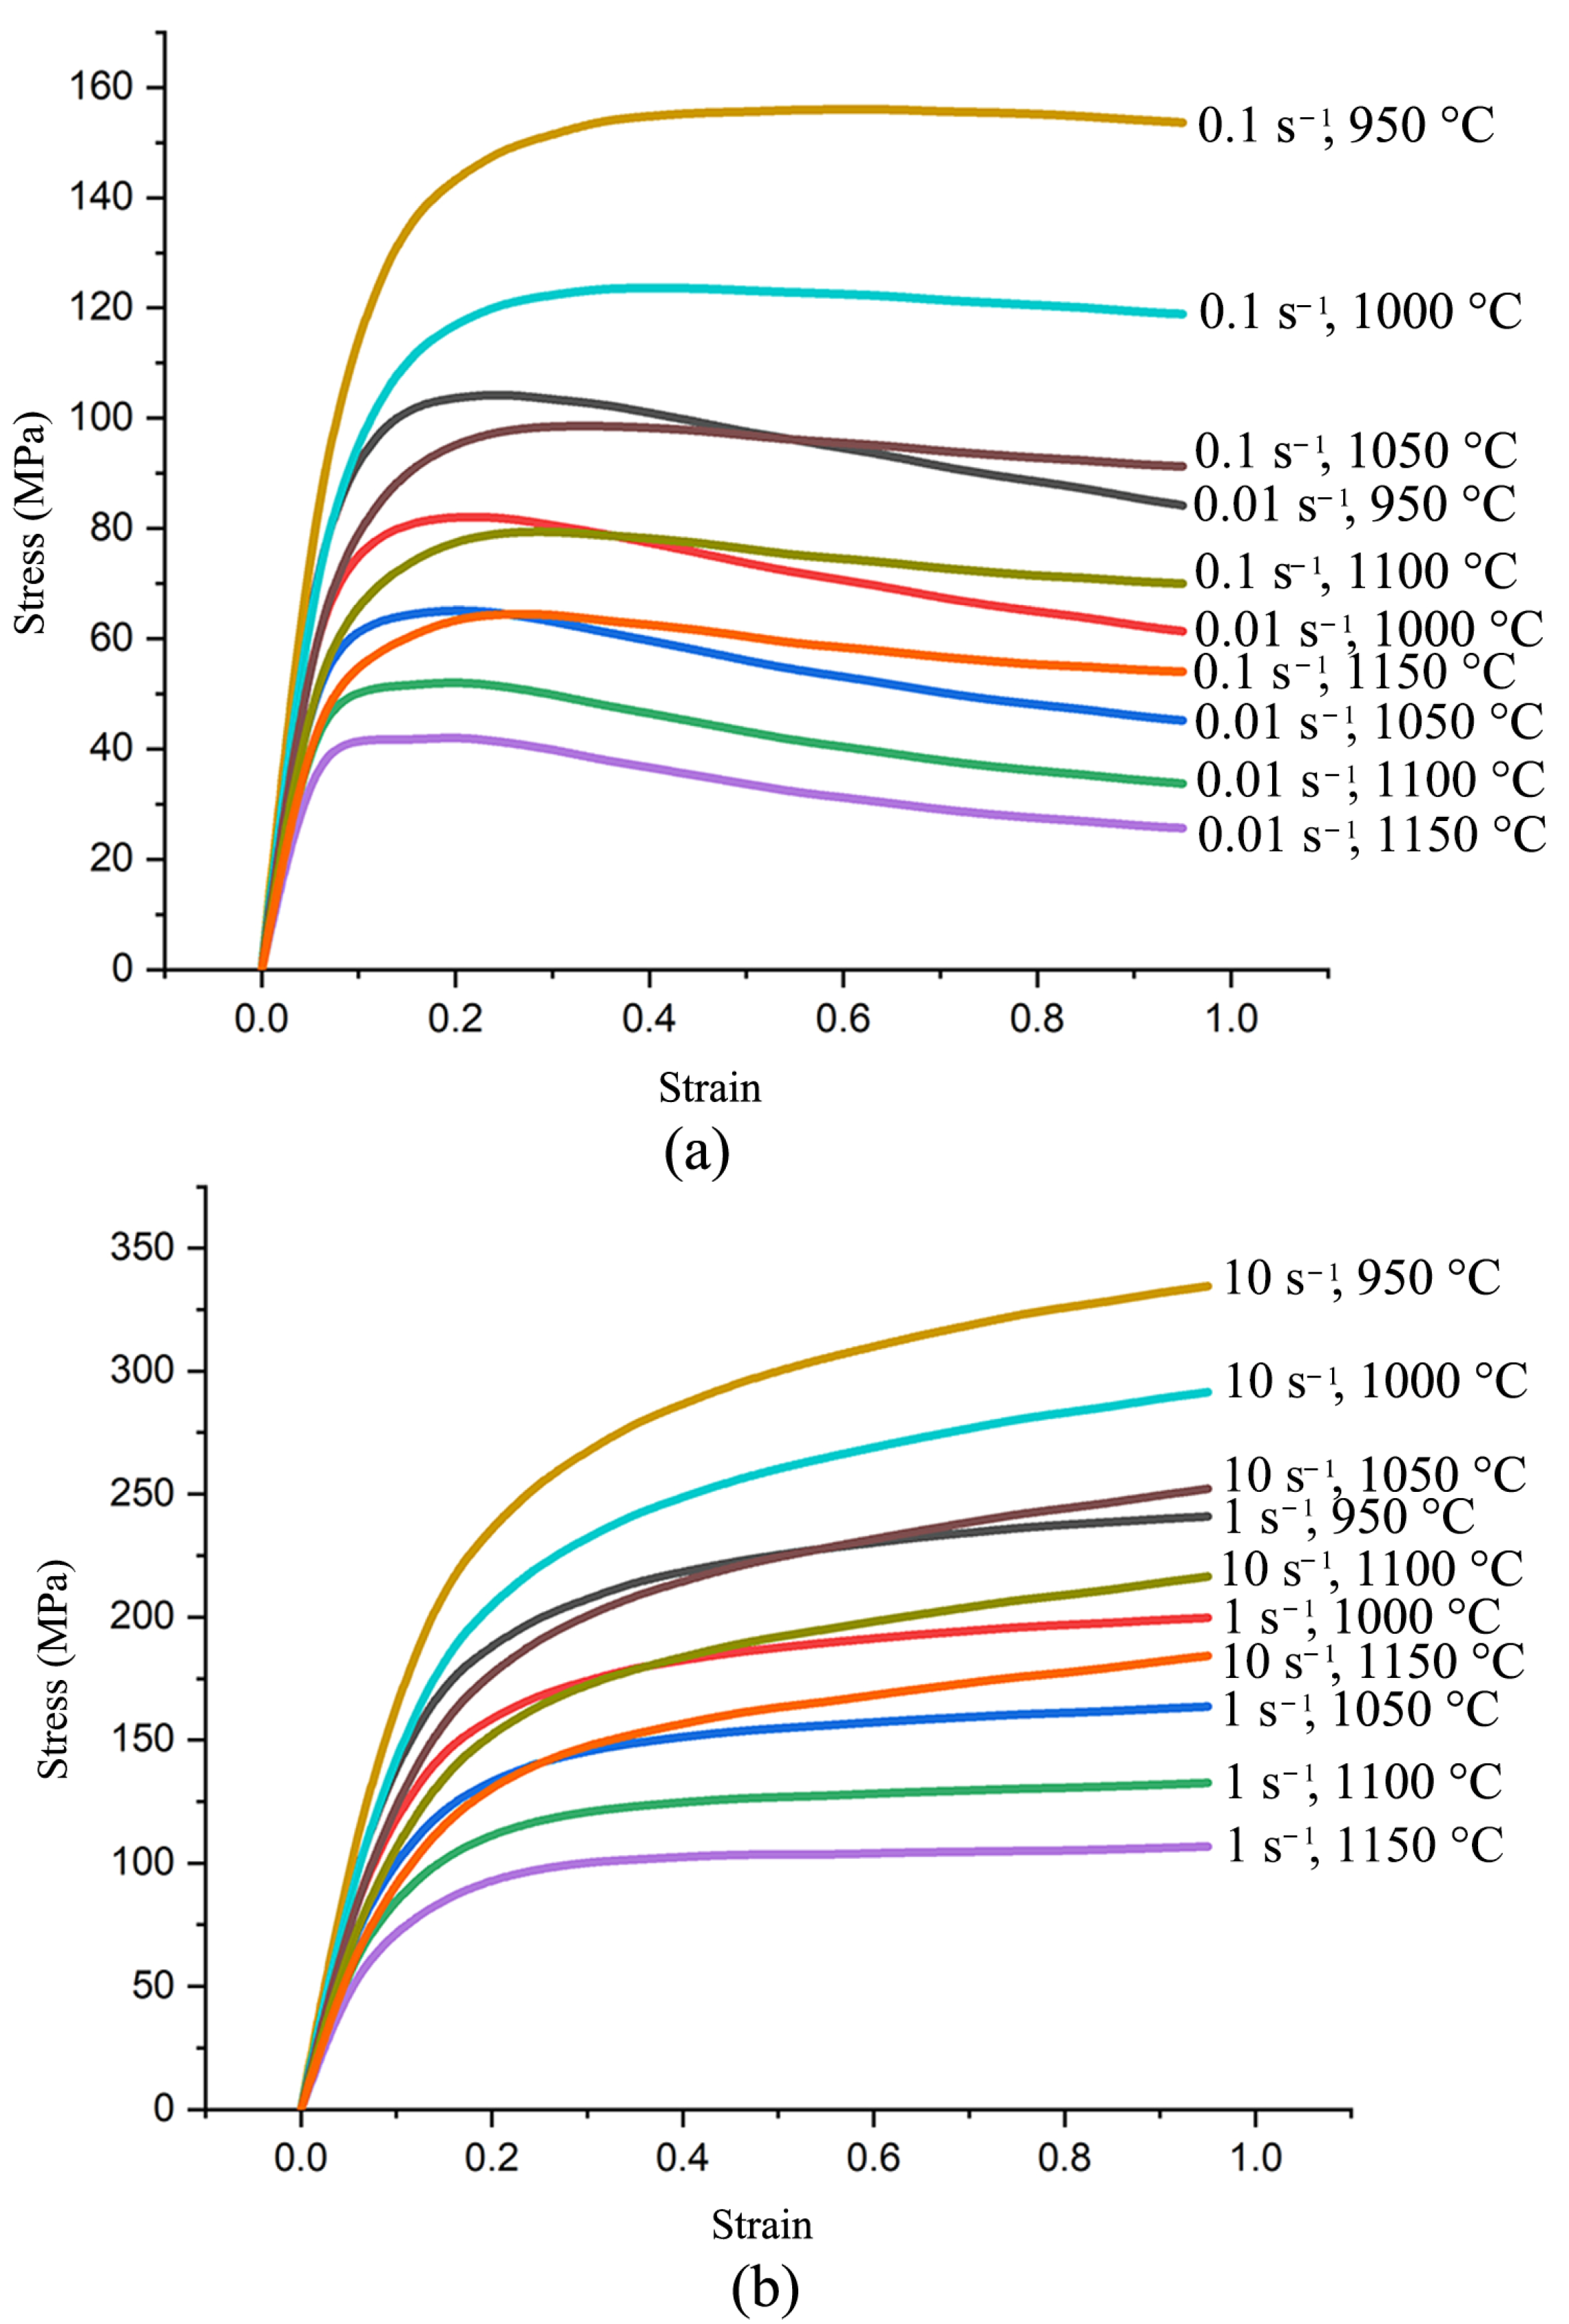
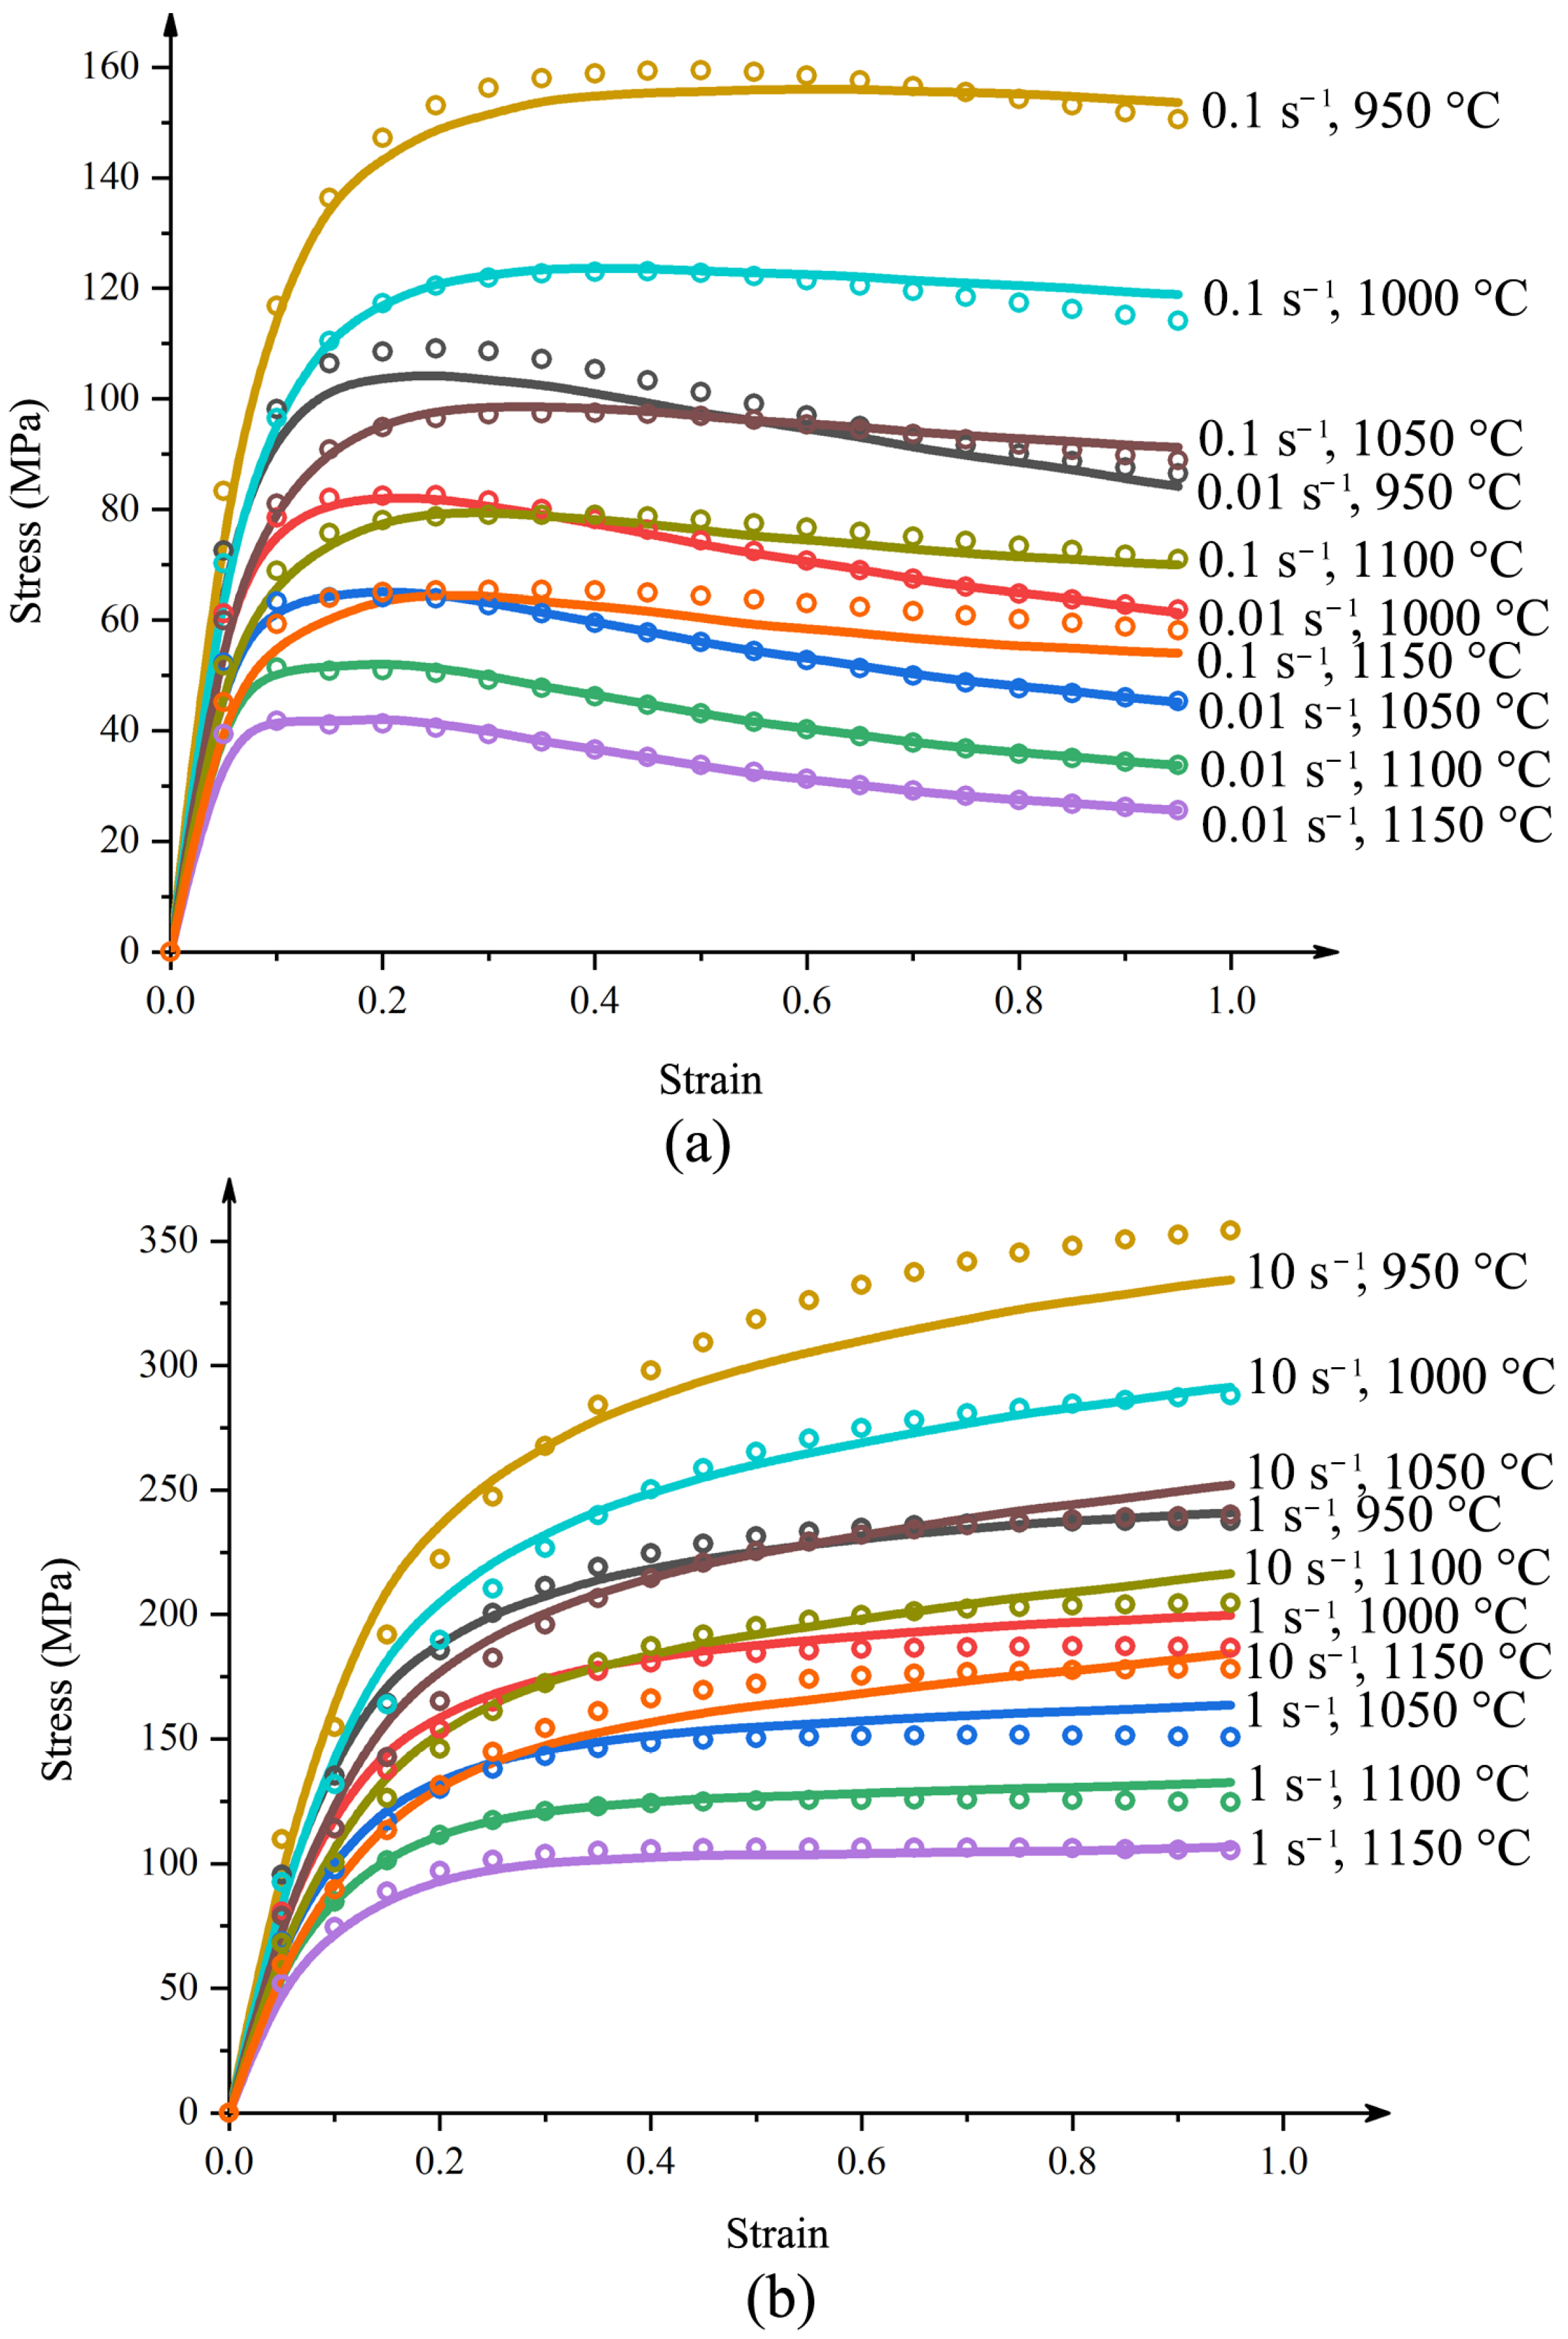
3.1. Flow Behavior
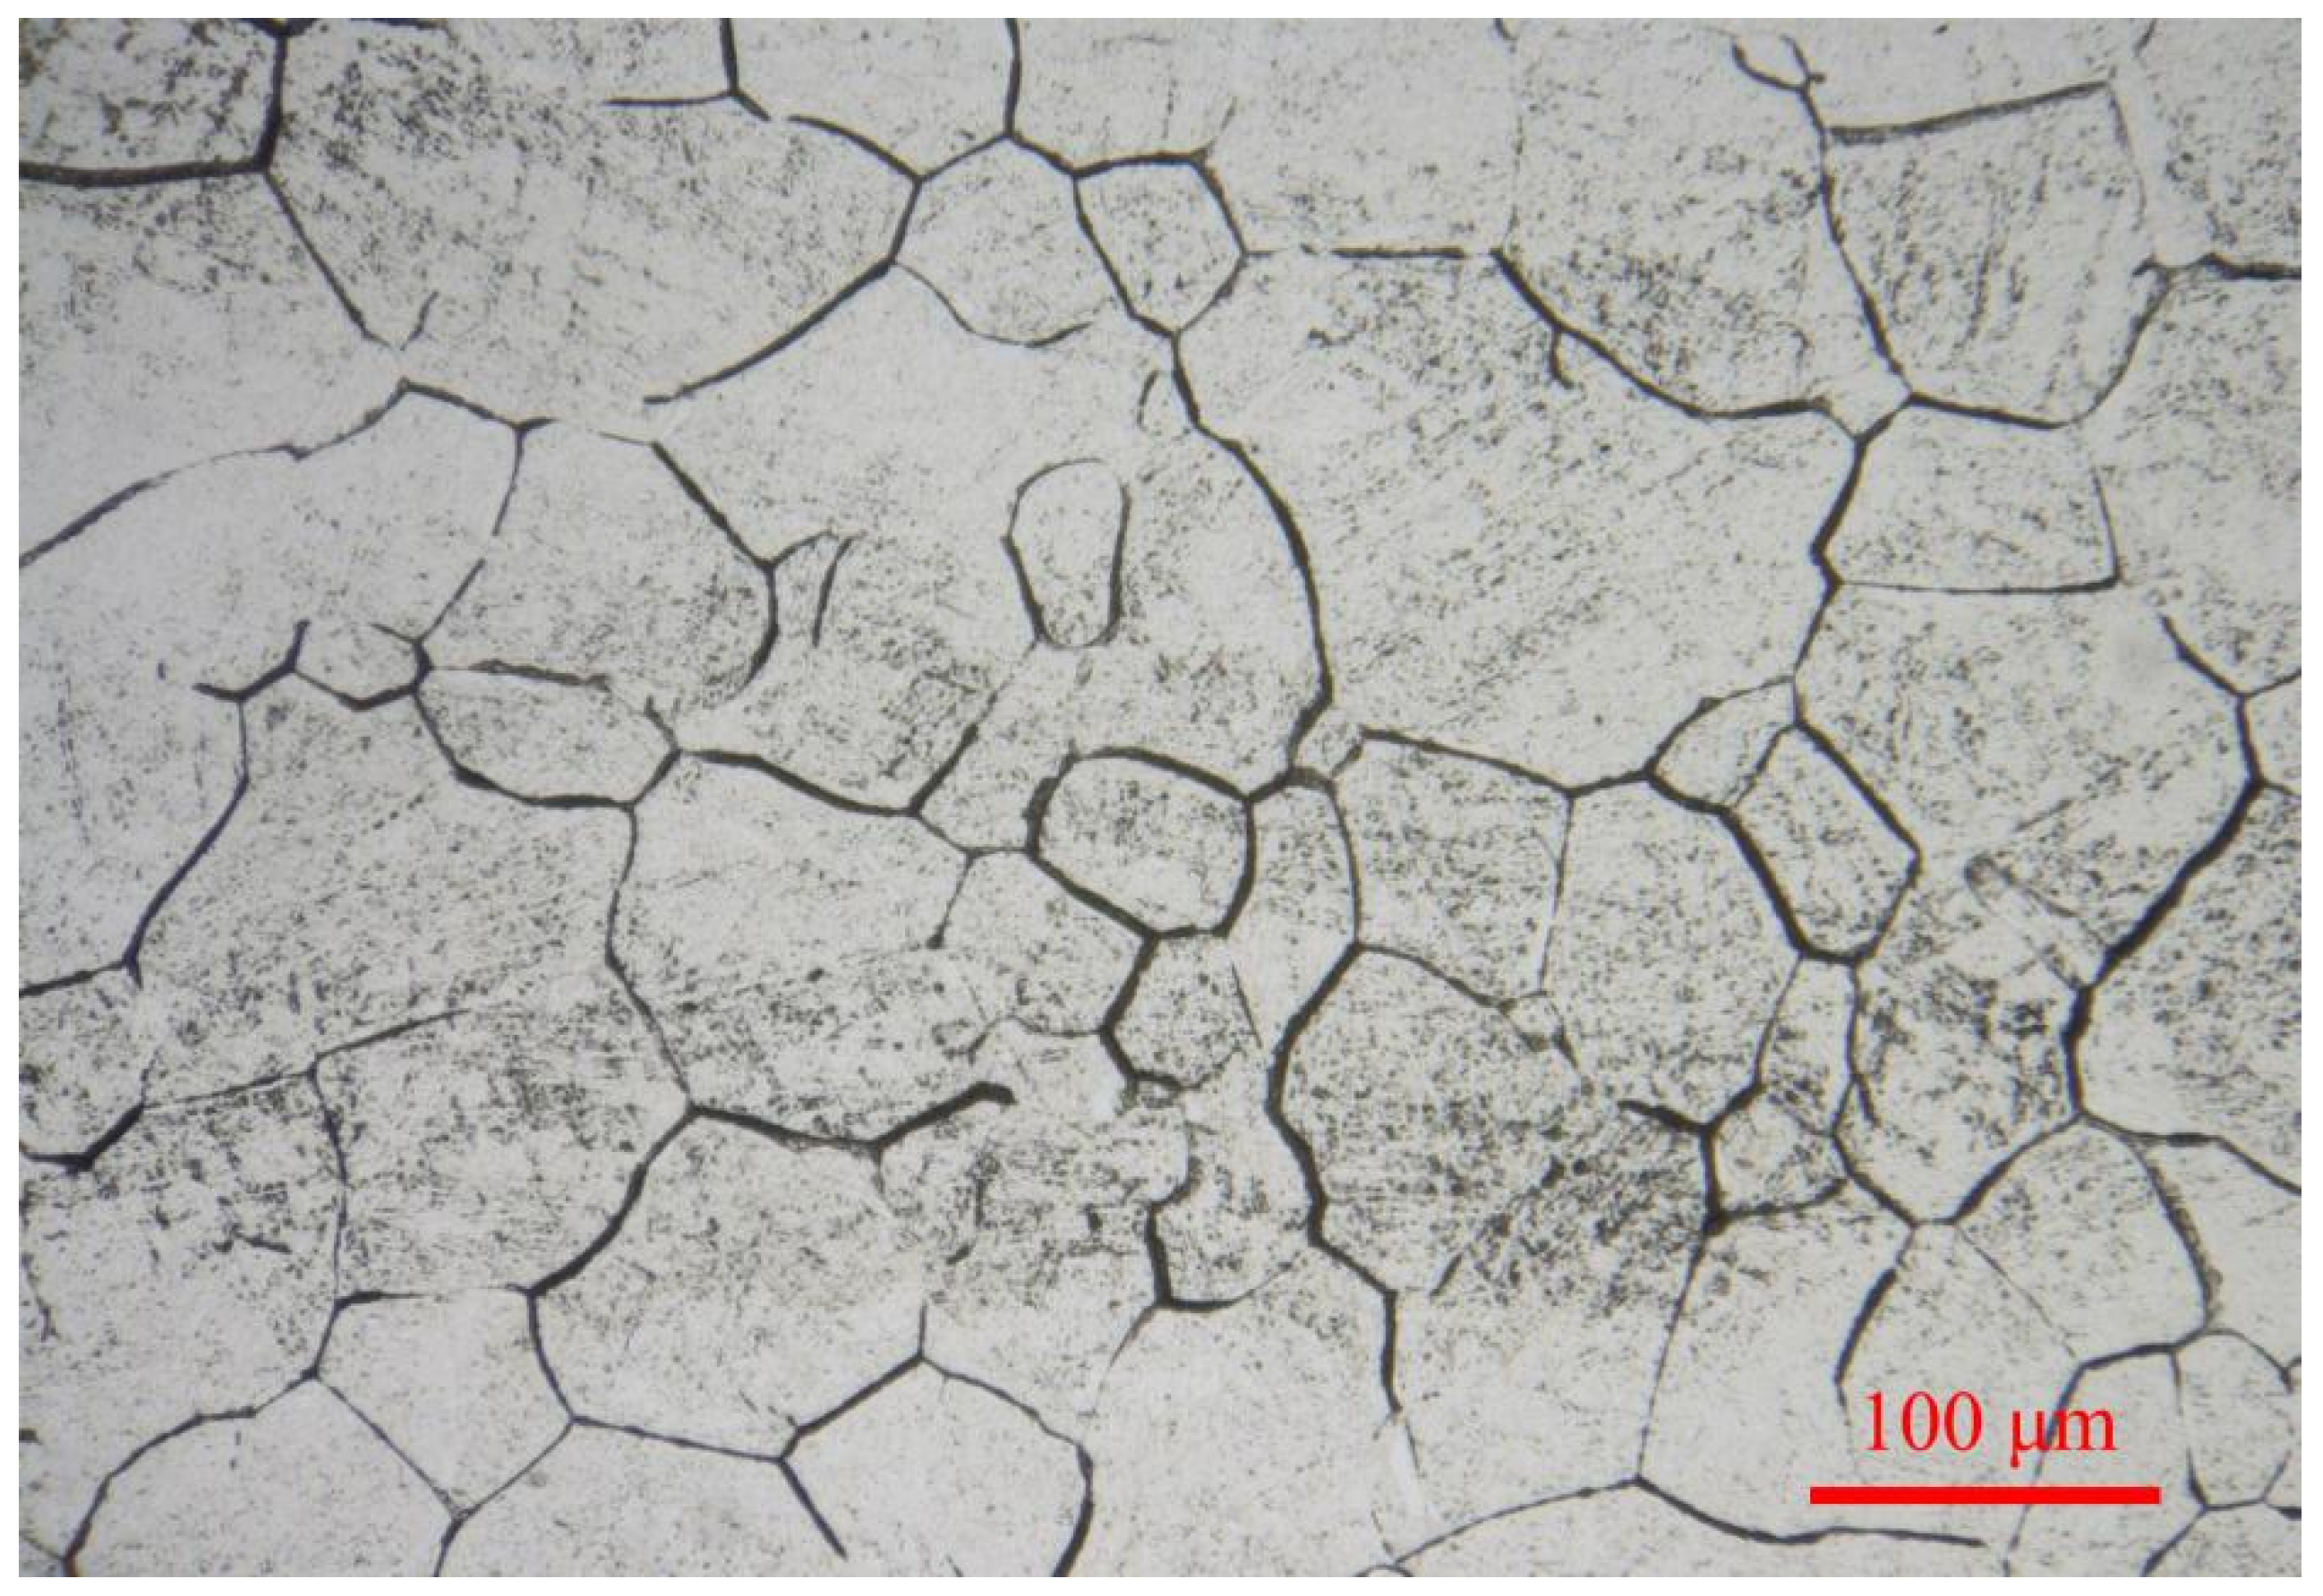
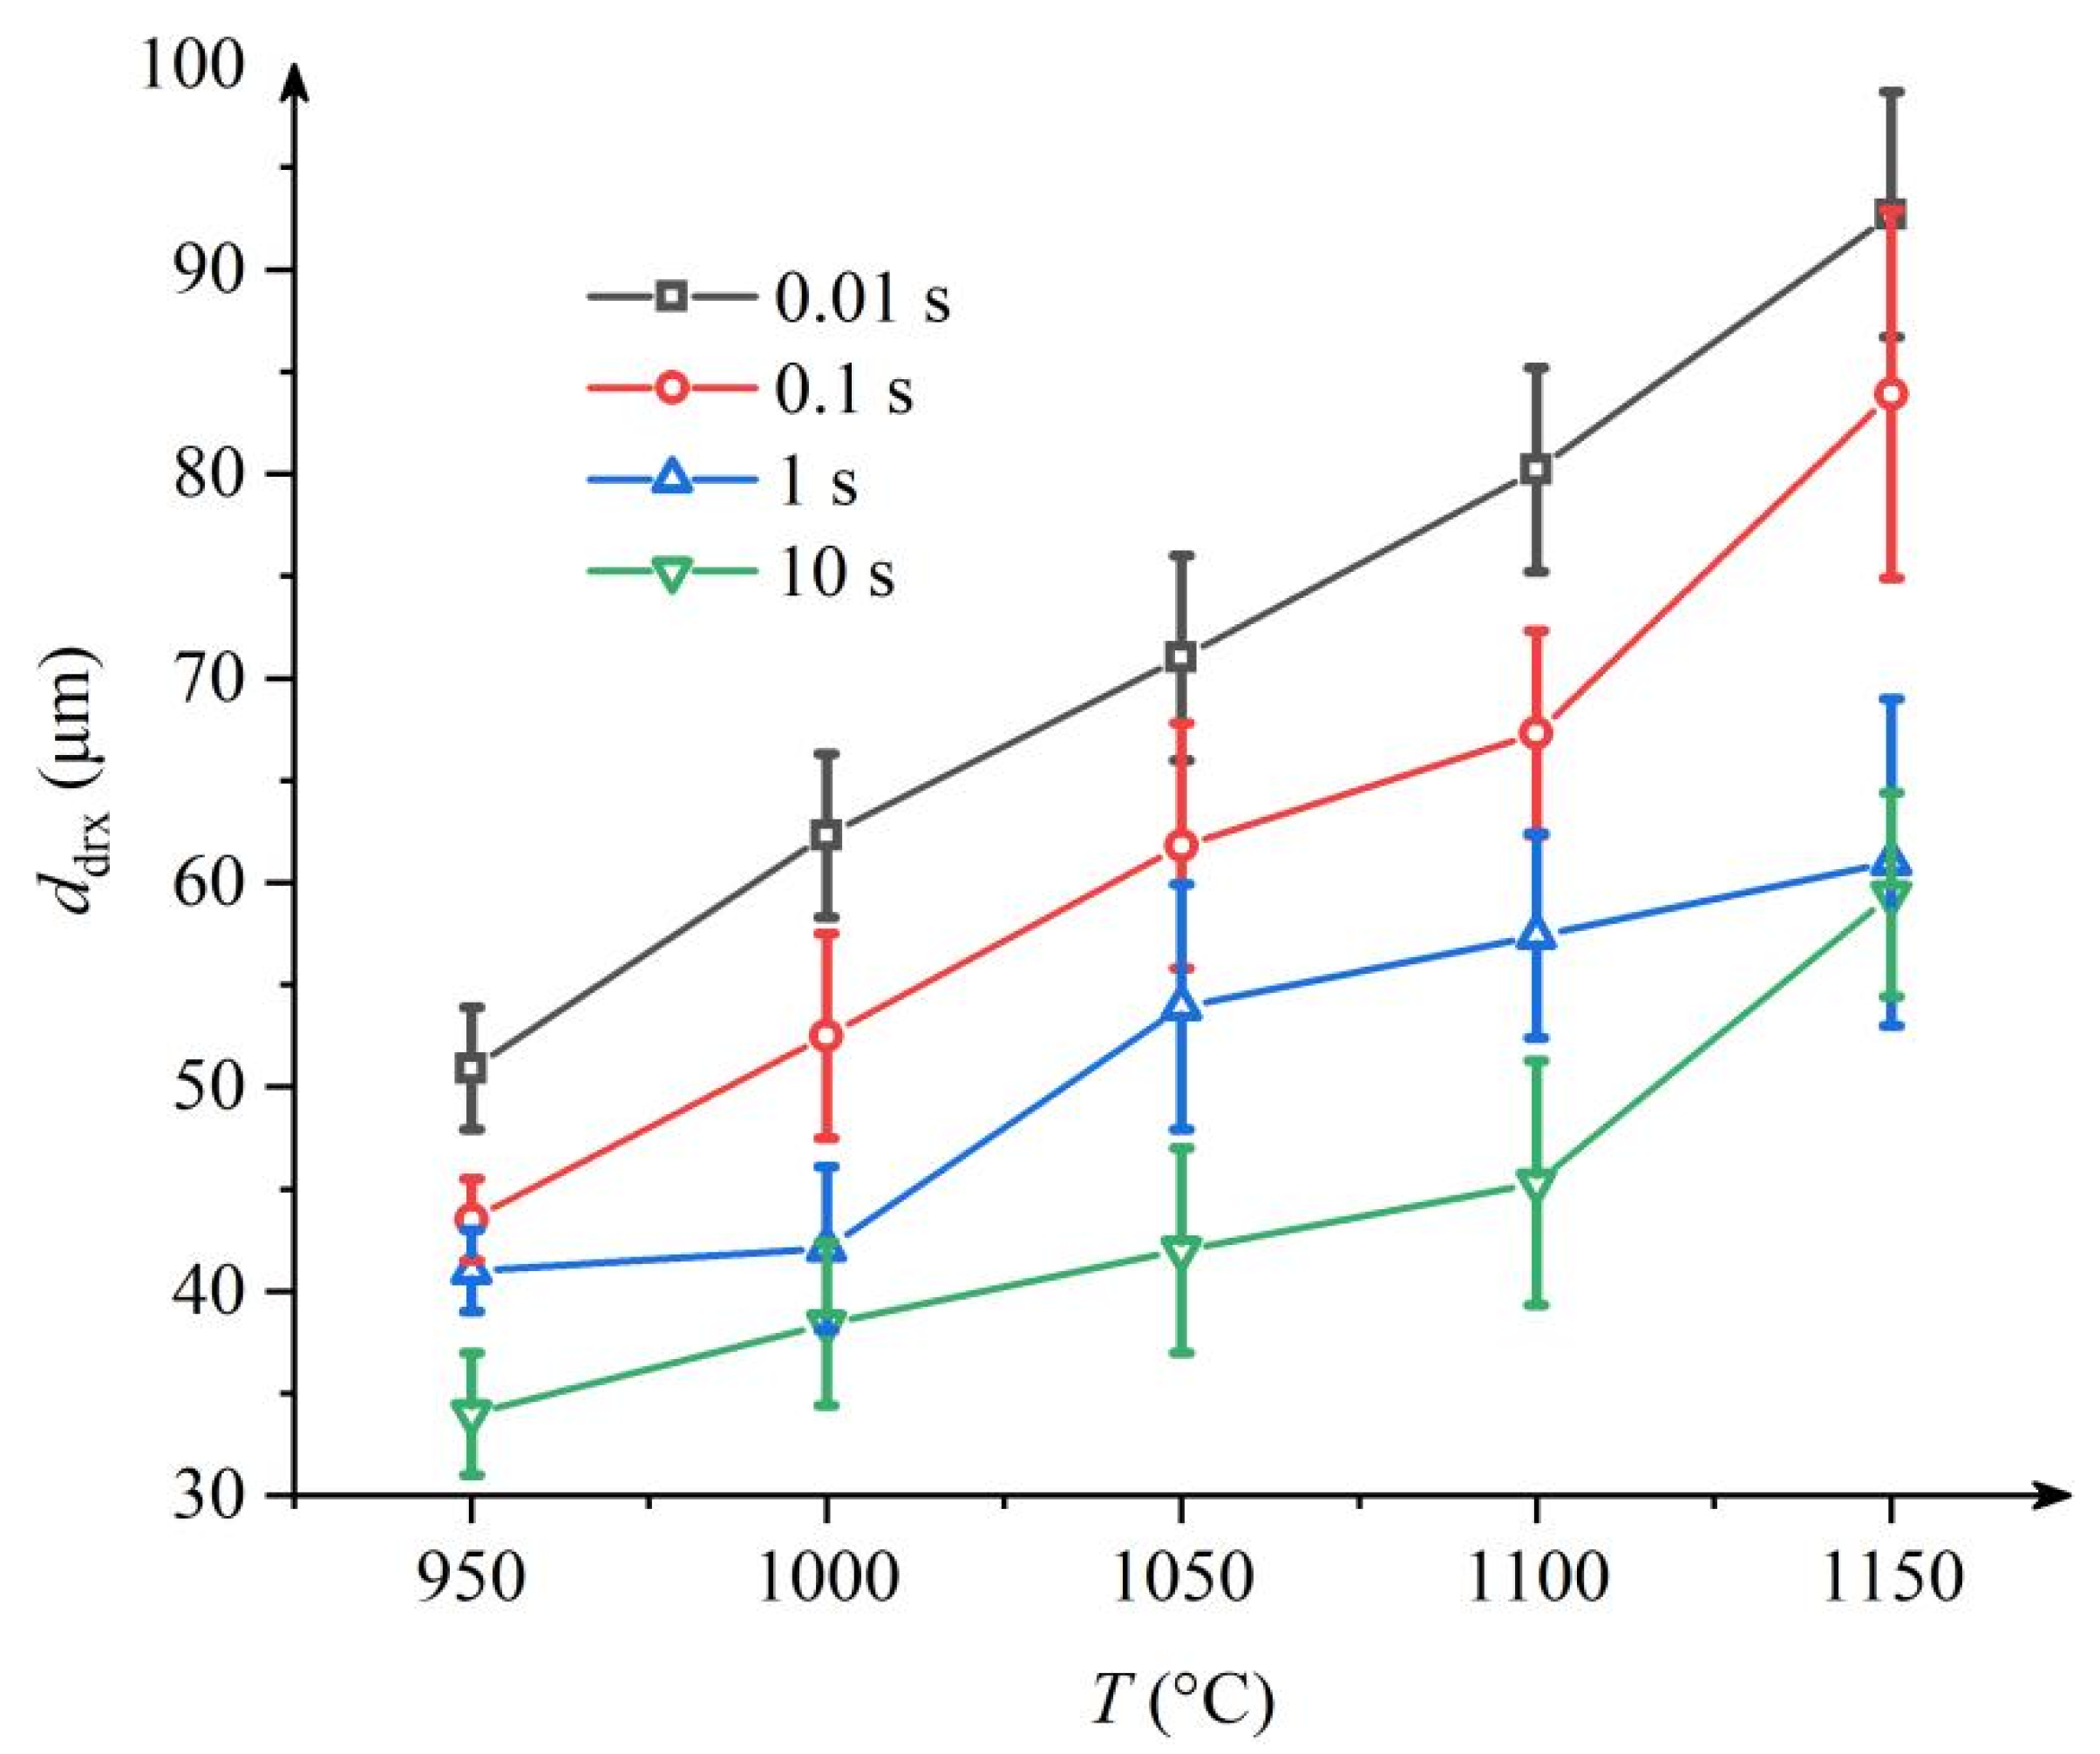
3.2. Microstructure Evolution
4. Discussion
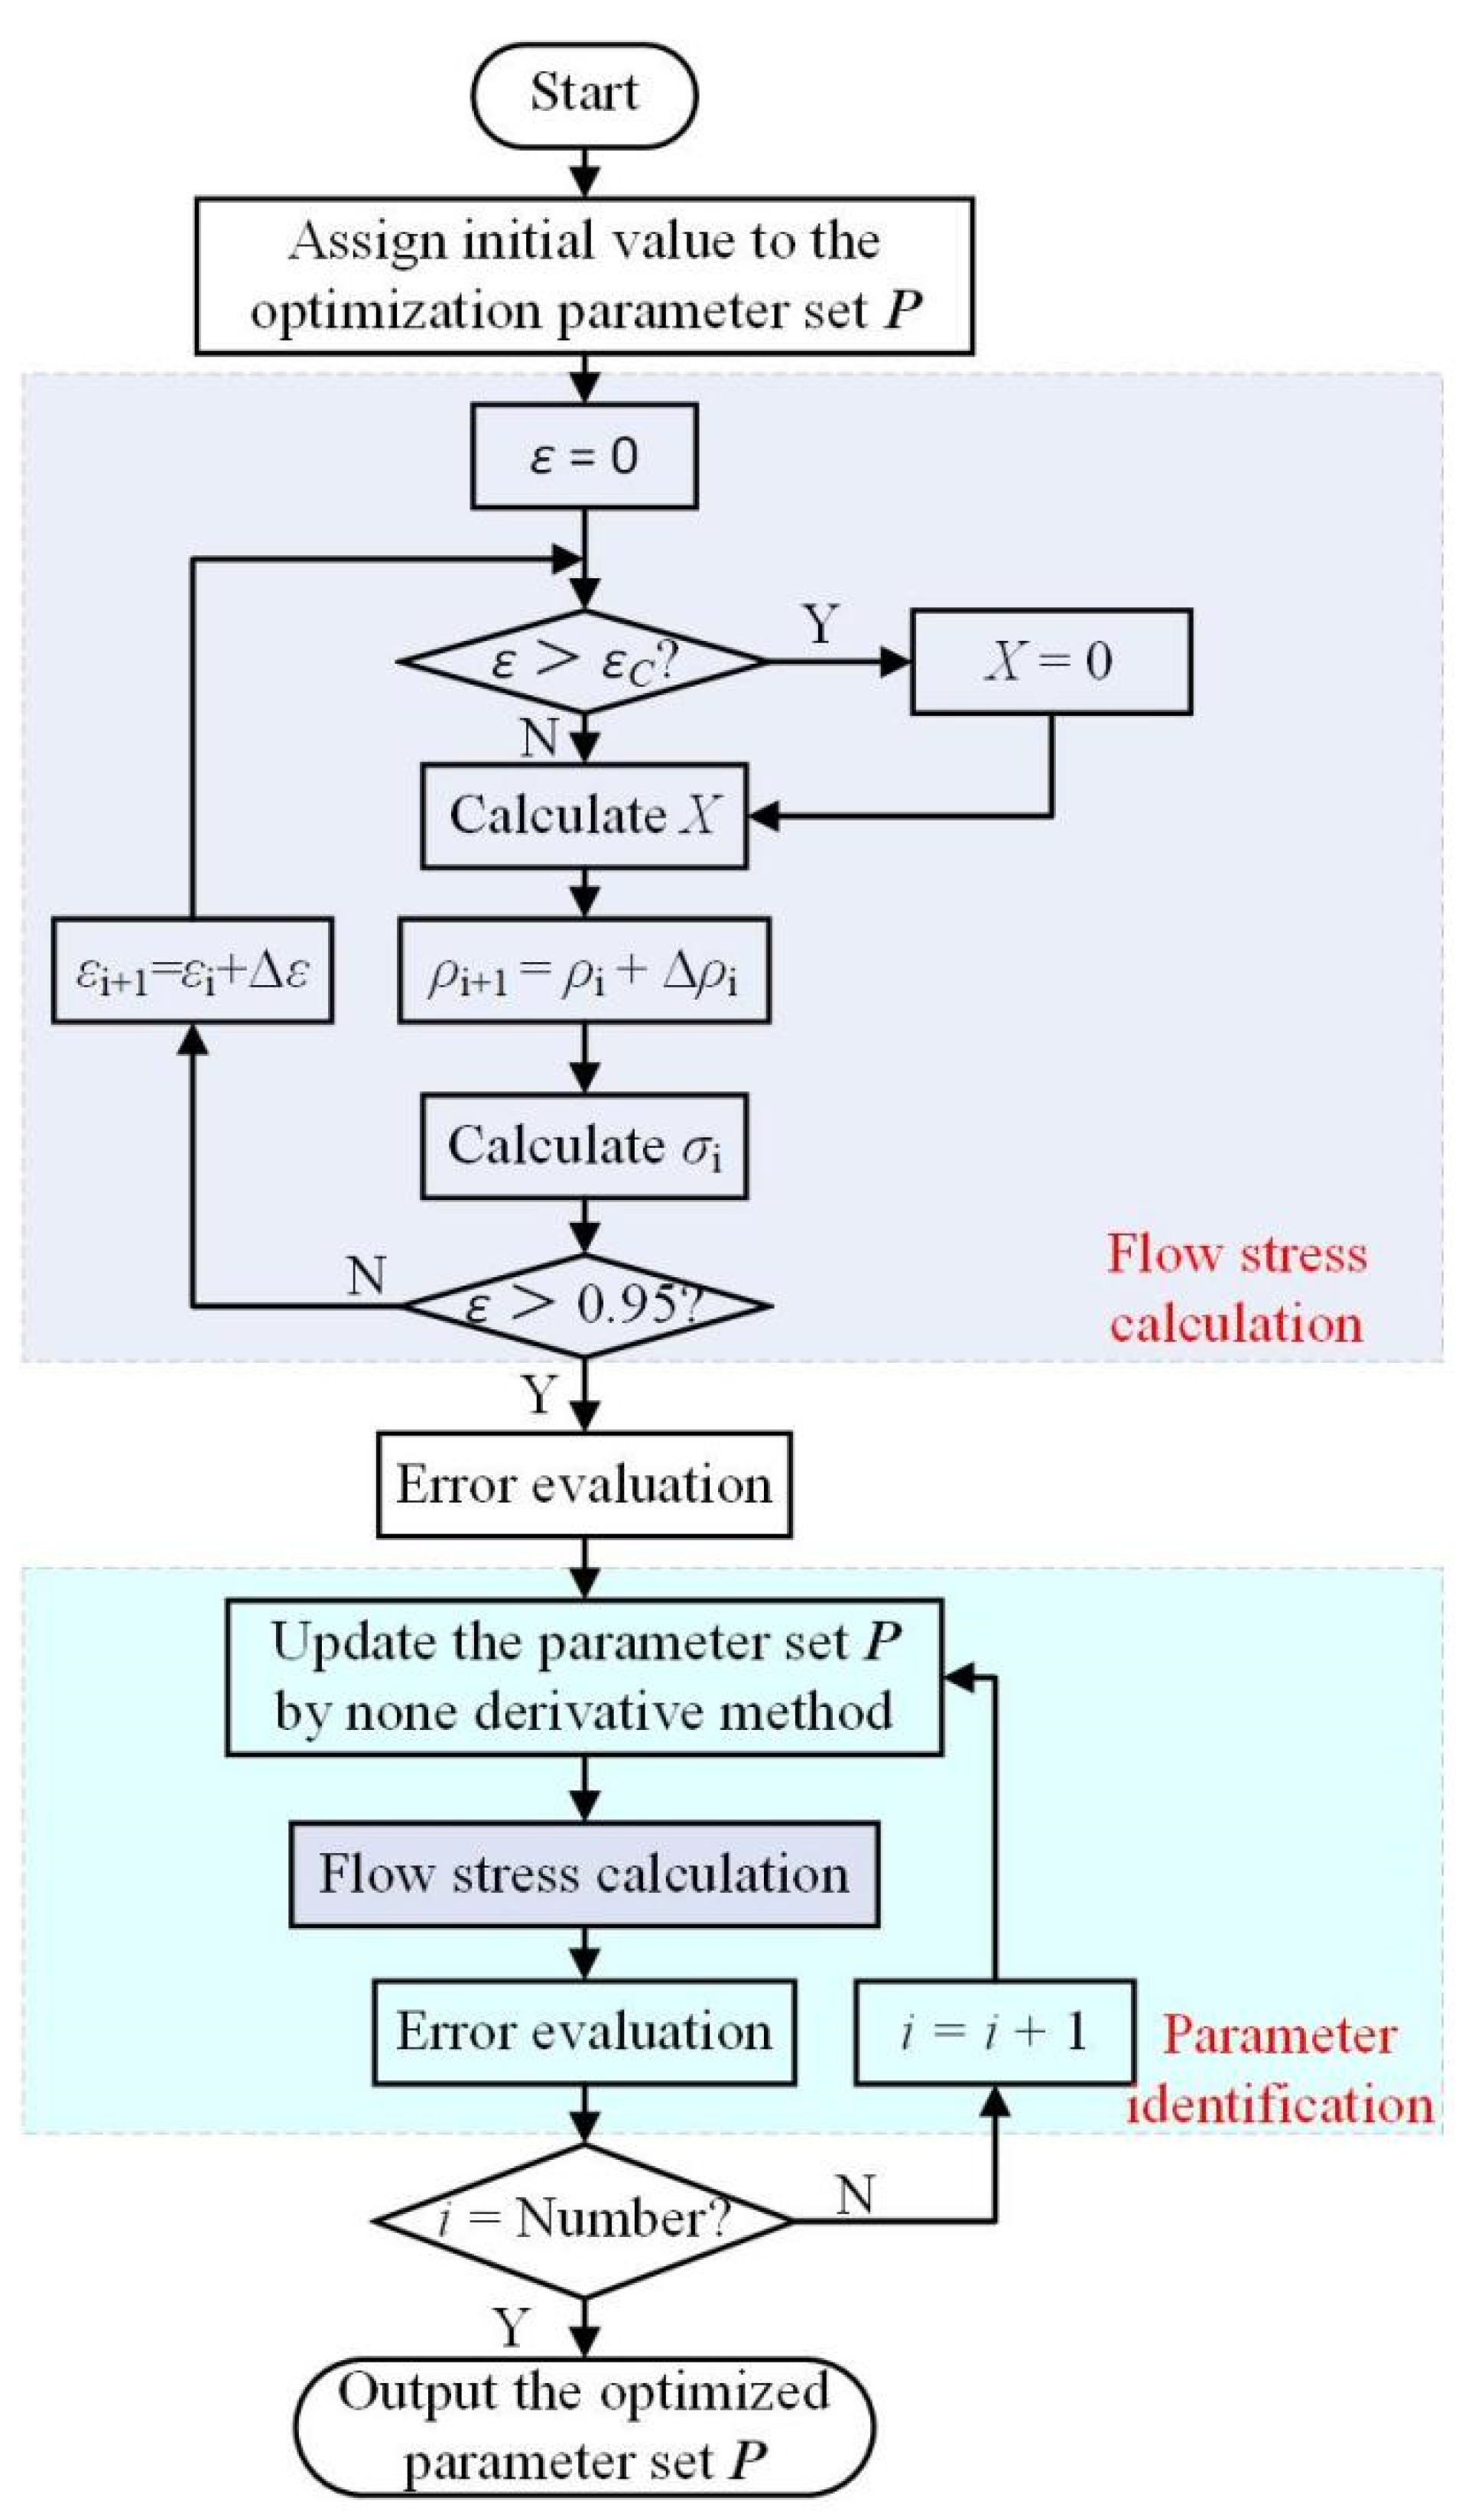
4.1. Proposed Constitutive Model
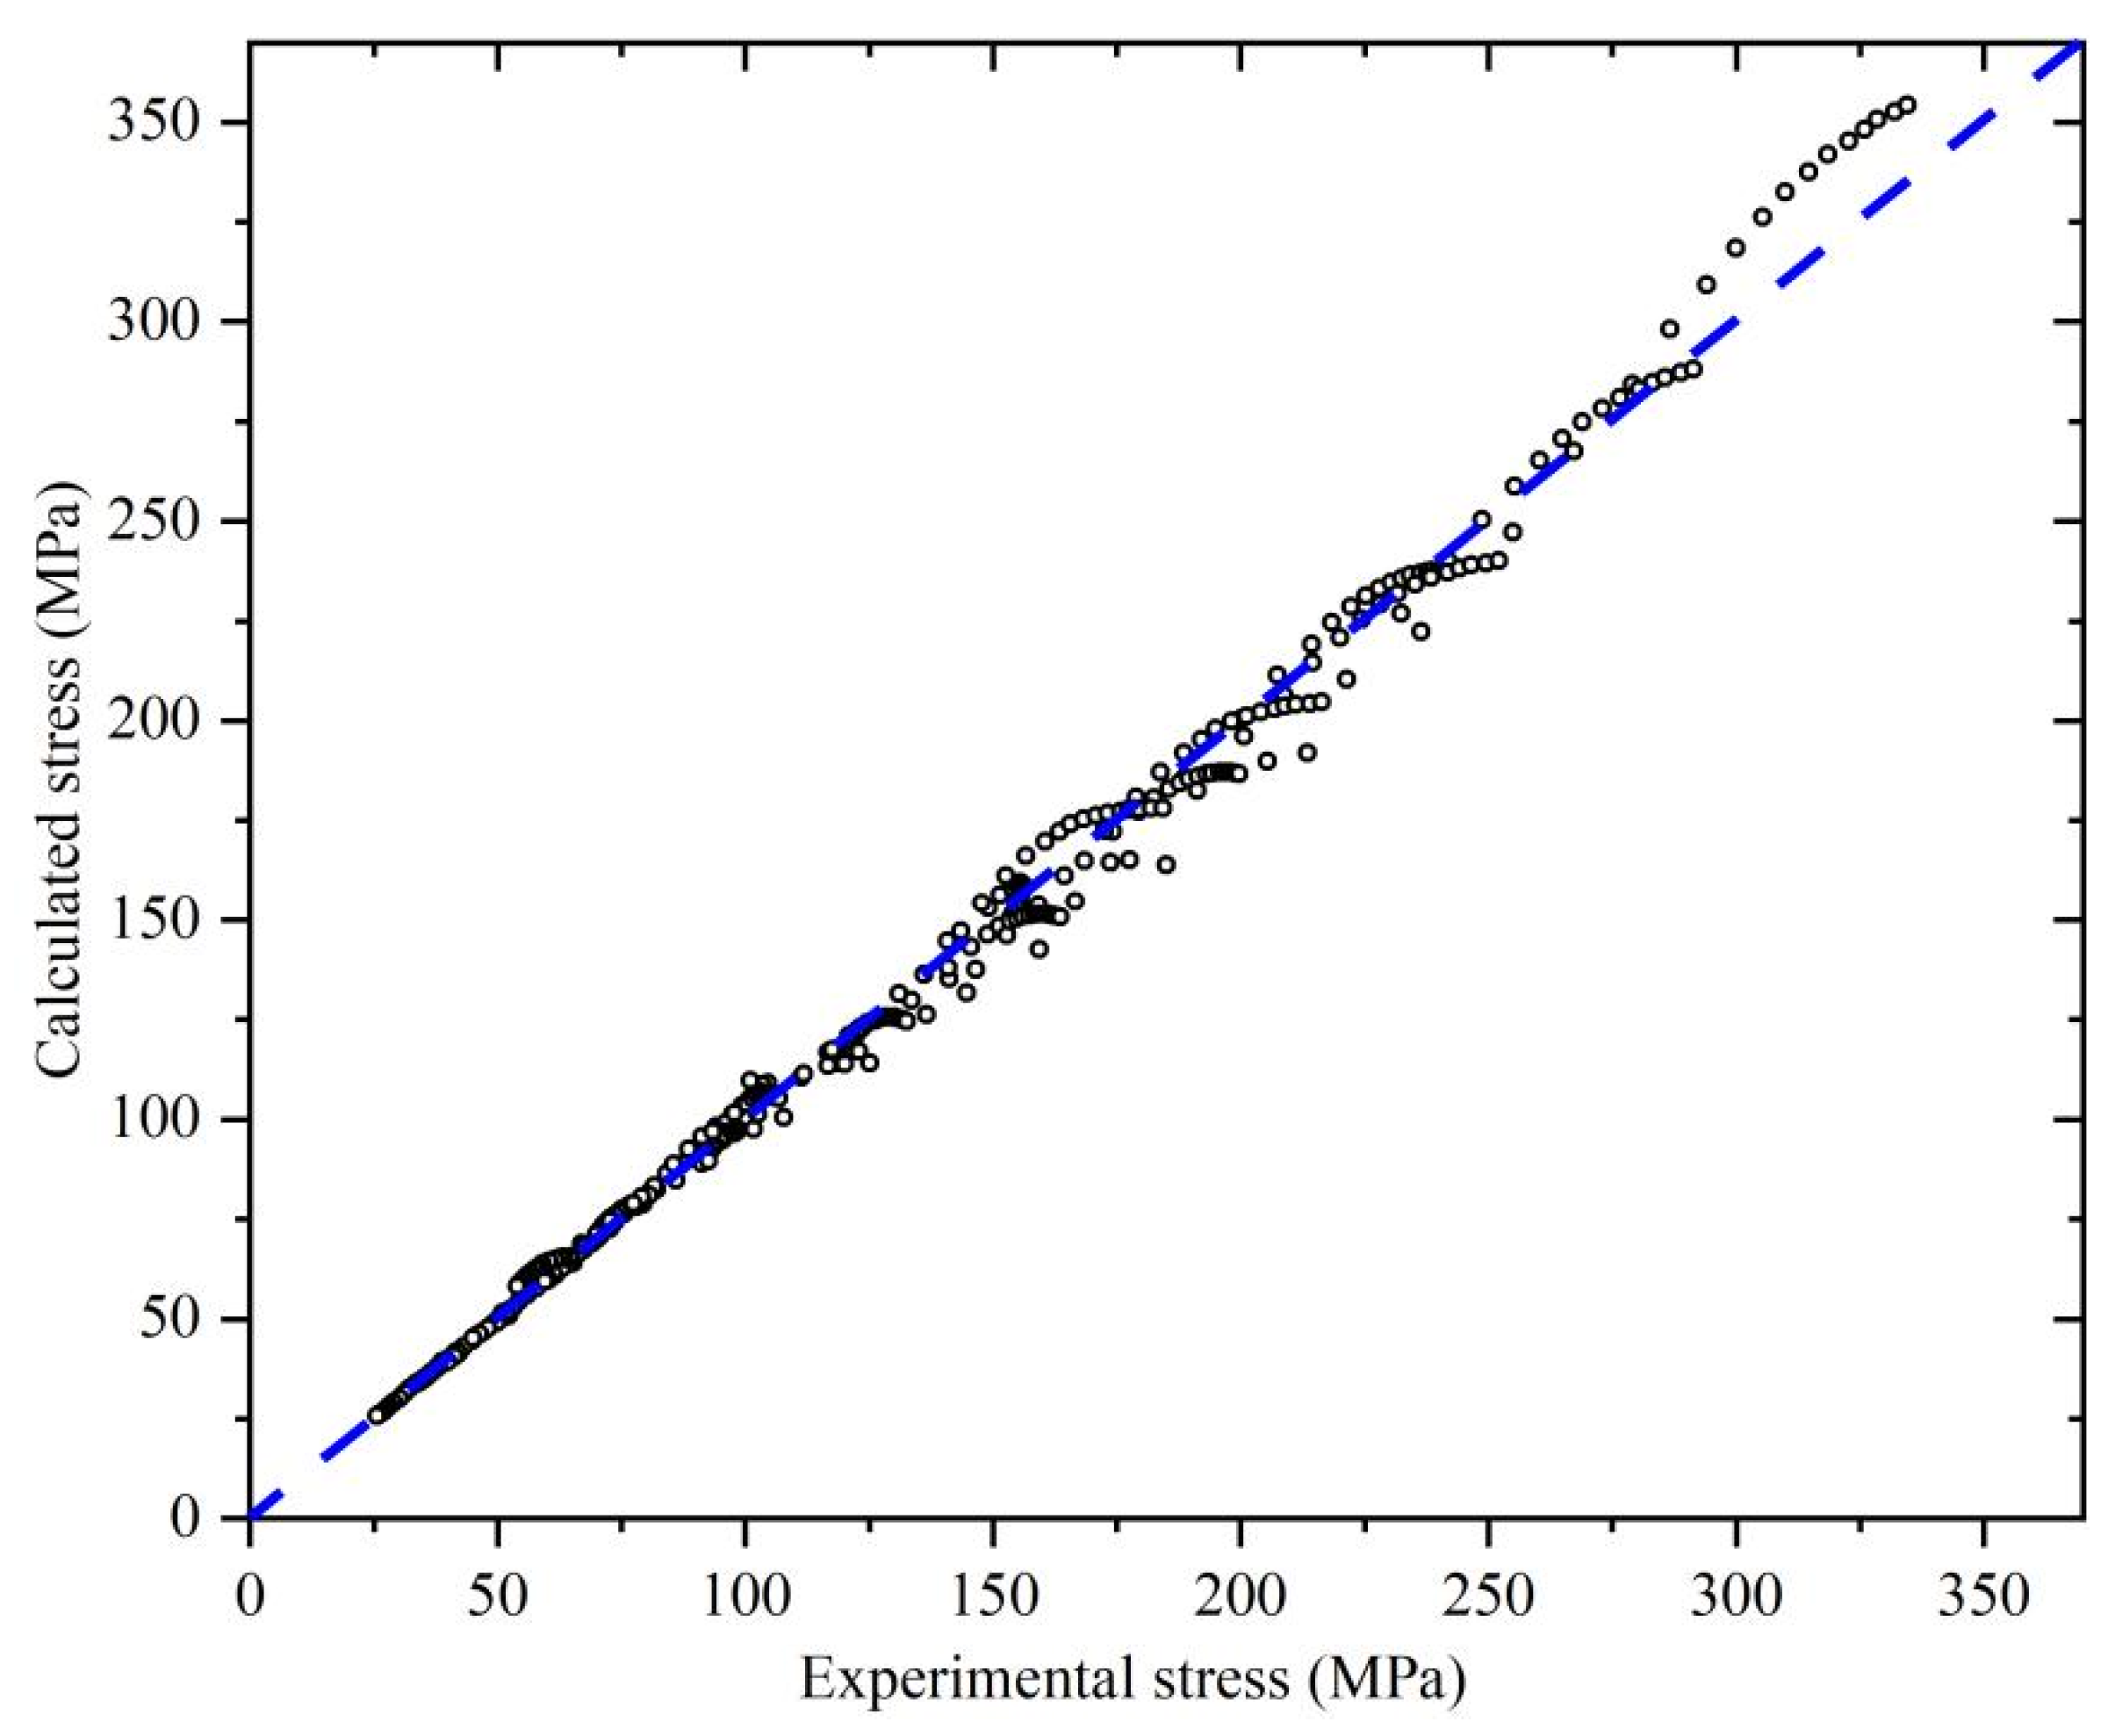
4.2. Application of the Model
4.3. Modelling of Recrystallized Grain Size
5. Conclusions
- (1)
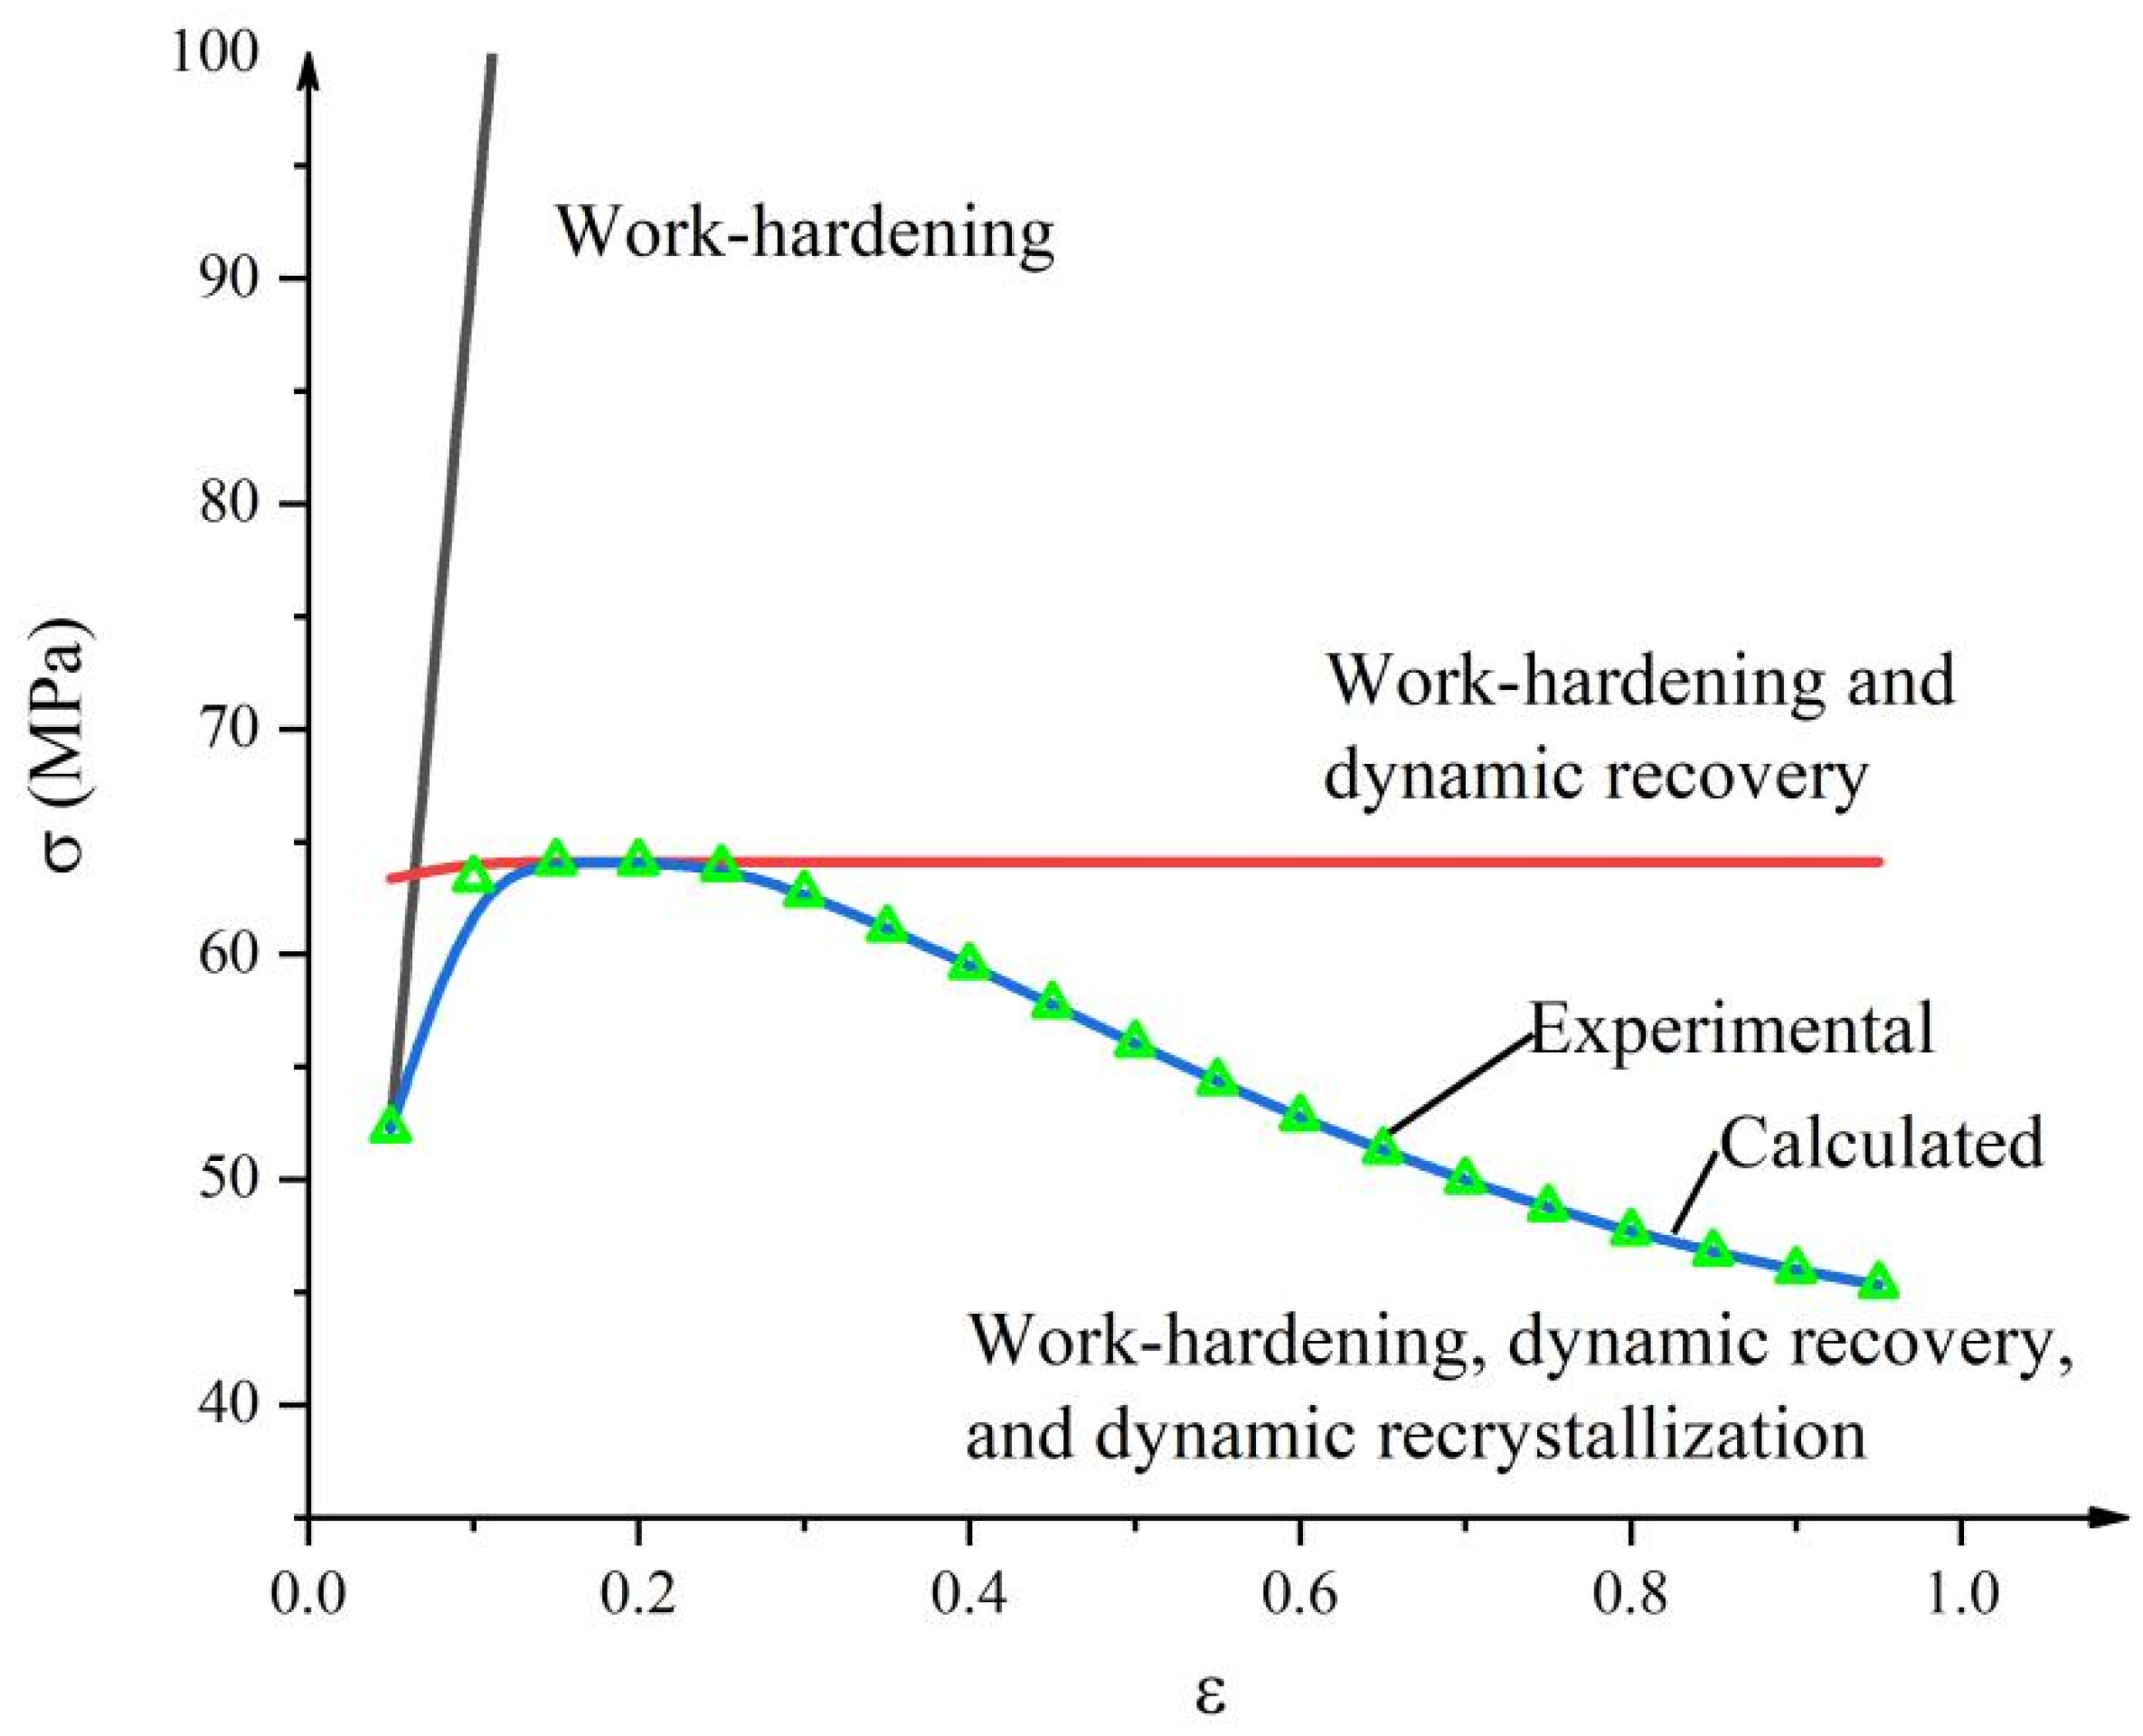
- Single-peaked stress-strain curves were obtained at a lower strain rate, while monotonous rising curves were obtained at a higher strain rate because of the competition of dislocation multiplication due to cross-slips and dislocation annihilation due to DRV and DRX.
- (2)
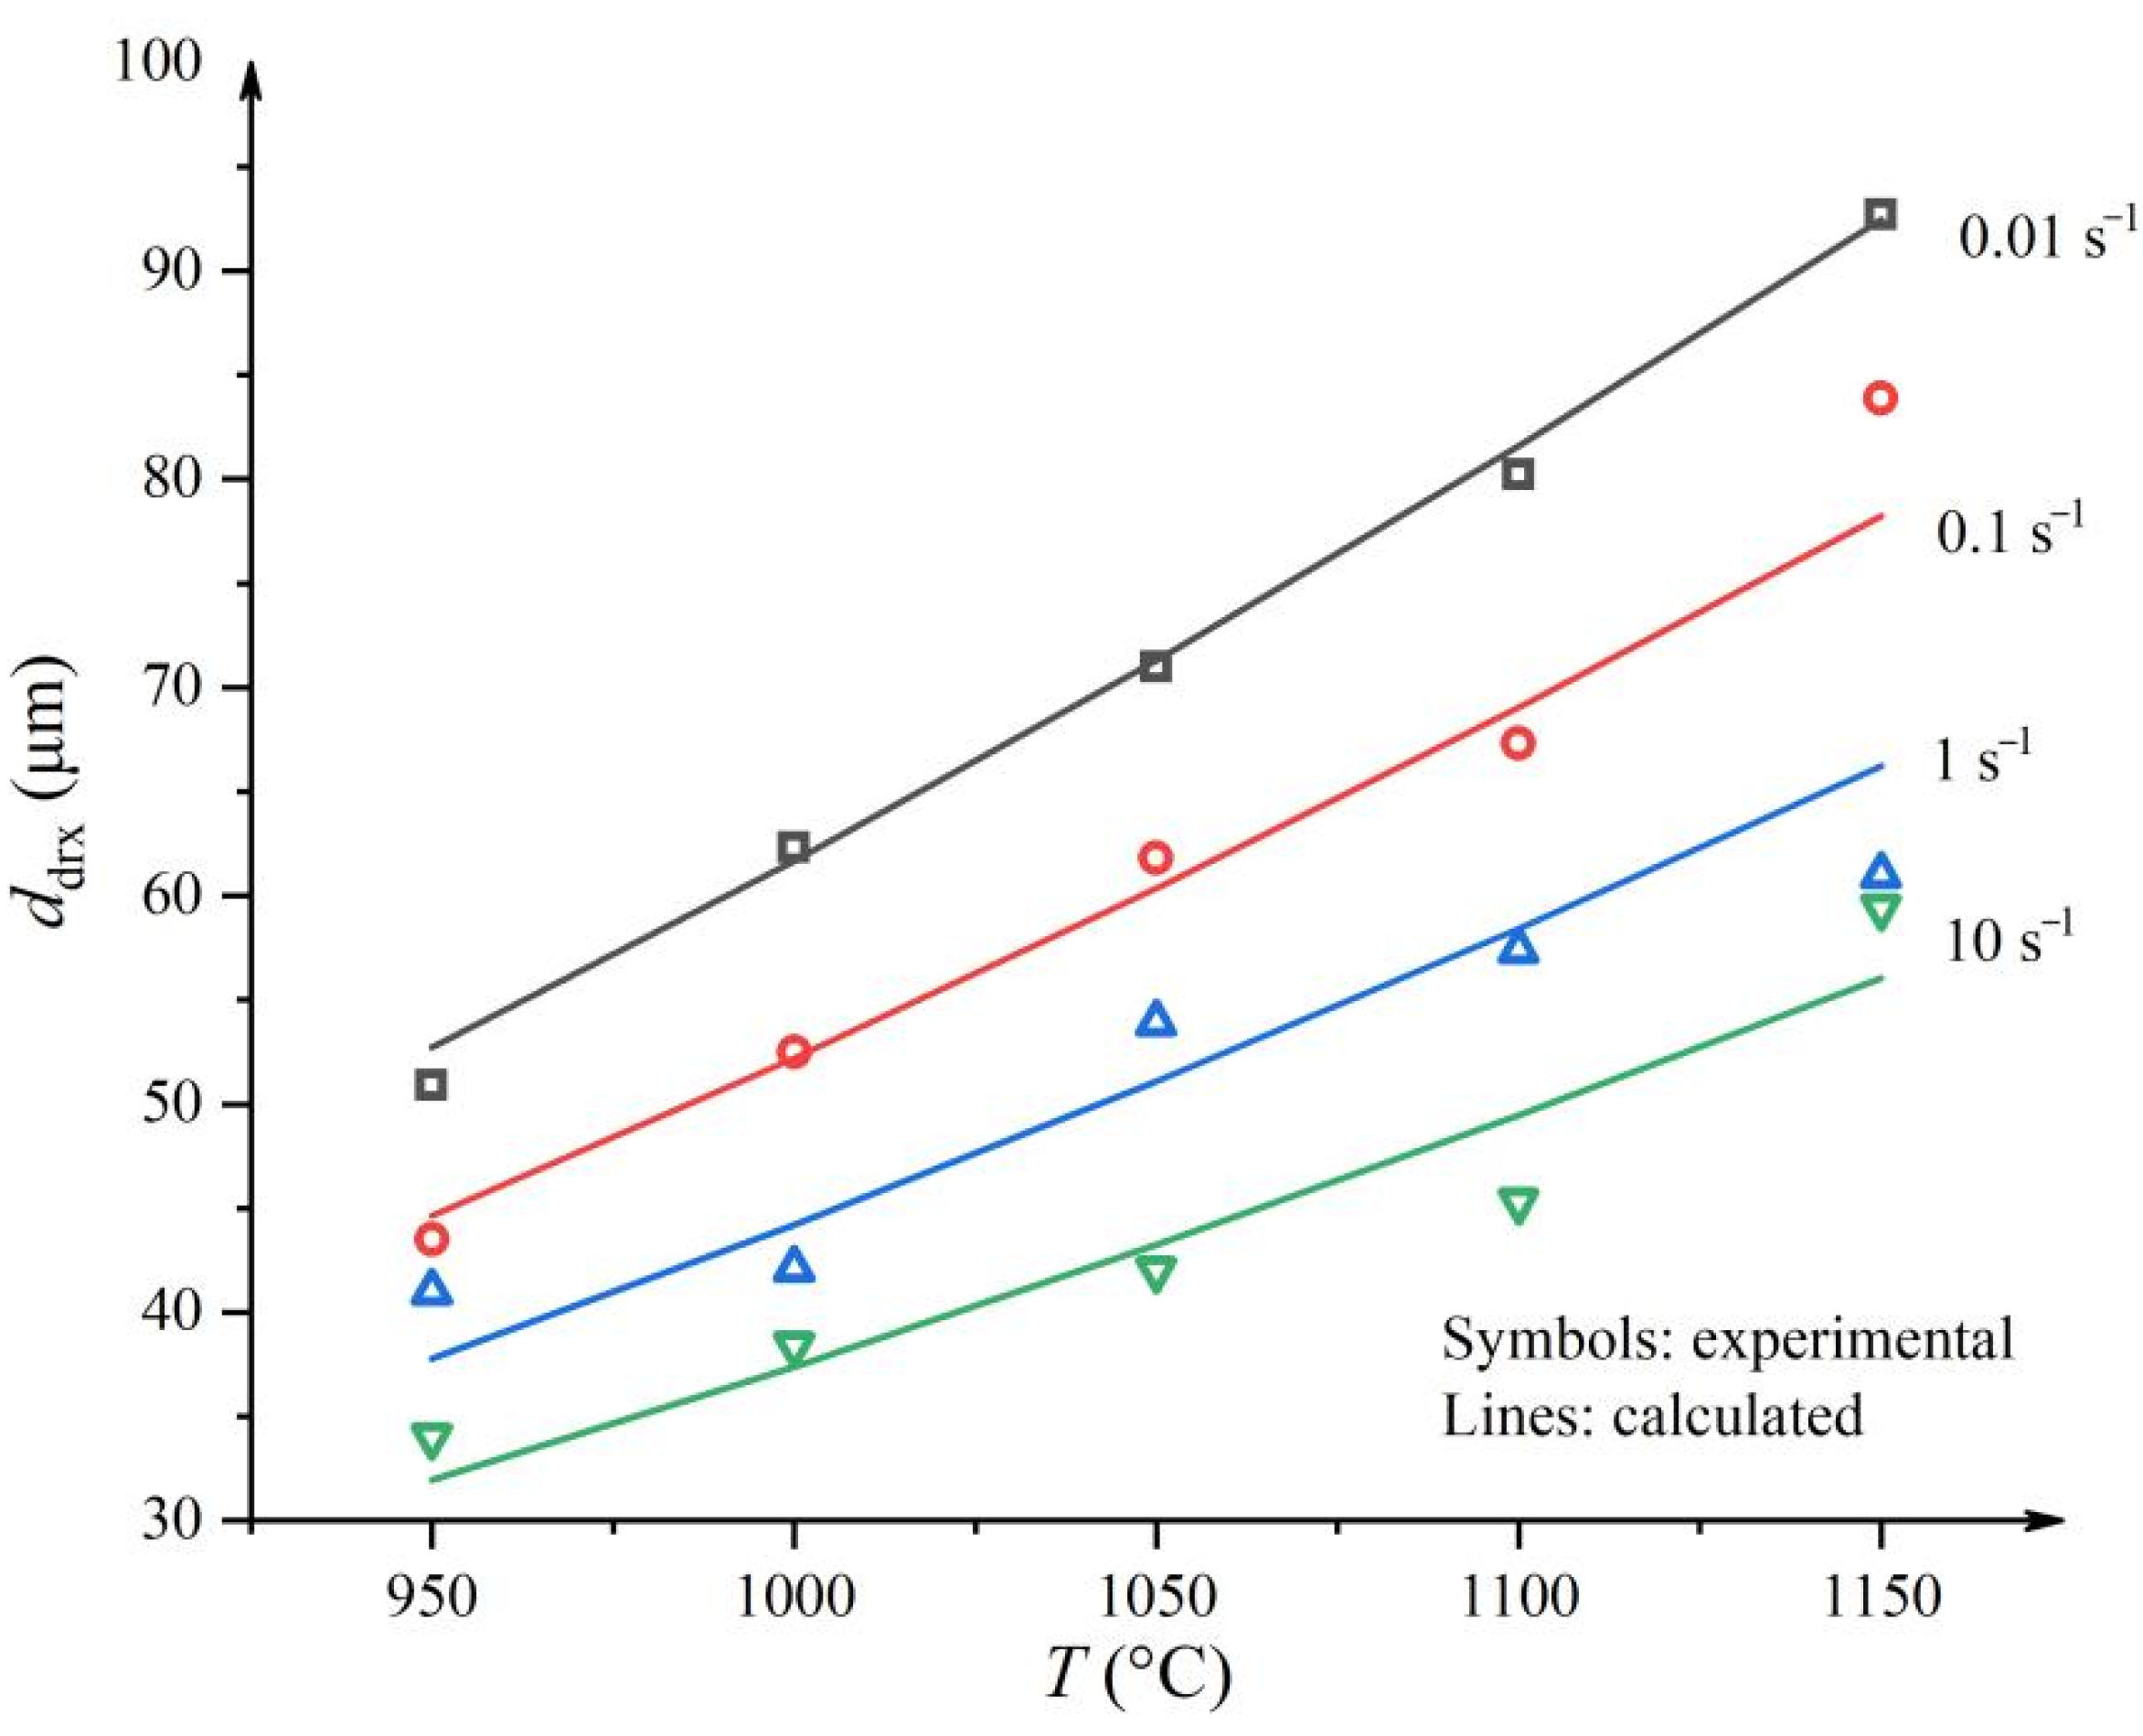
- Under a higher deformation temperature, the average size of DRX grains increased, and the volume fraction of DRX grain increased. Under a higher strain rate, the recrystallized grain did not grow sufficiently.
- (3)
- A dislocation based constitutive model incorporating microstructure evolution was proposed, and the proposed model was applied in thermal tension of 300M steel. Results showed that the proposed model was accurate. The average error of flow stress prediction was 2.43% (3.59 MPa). The proposed model was more precise compared with the modified Arrhenius model (6.23%, 6.81 MPa) and the Kocks–Mecking model (6.59%, 5.37 MPa).
- (4)
- The dynamic recrystallization kinetics model was determined:
Author Contributions
Funding
Institutional Review Board Statement
Informed Consent Statement
Data Availability Statement
Conflicts of Interest
References
- Li, C.-S.; He, S.; Ren, J.; Han, Y. The Flow Stress Behavior and Constitutive Model of Cr8Mo2SiV Tool Steel during Hot Deformation. Steel Res. Int. 2021, 92, 2000434. [Google Scholar] [CrossRef]
- Ahmadi, H.; Ashtiani, H.R.; Heidari, M. A comparative study of phenomenological, physically-based and artificial neural network models to predict the Hot flow behavior of API 5CT-L80 steel. Mater. Today Commun. 2020, 25, 101528. [Google Scholar] [CrossRef]
- Shokry, A.; Gowid, S.; Kharmanda, G.; Mahdi, E. Constitutive Models for the Prediction of the Hot Deformation Behavior of the 10%Cr Steel Alloy. Materials 2019, 12, 2873. [Google Scholar] [CrossRef] [Green Version]
- Niu, L.; Cao, M.; Liang, Z.; Han, B.; Zhang, Q. A modified Johnson-Cook model considering strain softening of A356 alloy. Mater. Sci. Eng. A 2020, 789, 139612. [Google Scholar] [CrossRef]
- Fu, Q.; Yuan, W.; Xiang, W. Constitutive Relationship for Hot Deformation of TB18 Titanium Alloy. Adv. Mater. Sci. Eng. 2020, 2020, 5716548. [Google Scholar] [CrossRef]
- Liu, X.; Zhu, L.; Zhang, Q. Analysis of TA2 hot deformation behavior and corrected TA2 constitutive model based on dynamic recrystallization. Mater. Res. Express 2018, 6, 046531. [Google Scholar] [CrossRef]
- Chen, X.; Zhang, J.; Du, Y.; Wang, G.; Huang, T. Dynamic Recrystallization Simulation for X12 Alloy Steel by CA Method Based on Modified L-J Dislocation Density Model. Metals 2019, 9, 1291. [Google Scholar] [CrossRef] [Green Version]
- Li, M.; Duan, Y.; Yao, D.; Guan, Y.; Yang, L. Constitutive Model and Flow Behavior of B1500HS High-Strength Steel during the Hot Deformation Process. Metals 2019, 10, 64. [Google Scholar] [CrossRef] [Green Version]
- Estrin, Y.; Mecking, H. A unified phenomenological description of work hardening and creep based on one-parameter models. Acta Met. 1984, 32, 57–70. [Google Scholar] [CrossRef]
- Zhang, J.-Y.; Jiang, P.; Zhu, Z.-L.; Chen, Q.; Zhou, J.; Meng, Y. Tensile properties and strain hardening mechanism of Cr-Mn-Si-Ni alloyed ultra-strength steel at different temperatures and strain rates. J. Alloys Compd. 2020, 842, 155856. [Google Scholar] [CrossRef]
- Yang, H.; Yao, P.; Liu, H. Study on austenite recrystallization softening behavior of GCr15 steel. IOP Conf. Ser. Mater. Sci. Eng. 2019, 493, 012034. [Google Scholar] [CrossRef]
- Xu, Y.; Zhao, Y.; Liu, J. A modified kinetics model and softening behavior for static recrystallization of 12Cr ultra-super-critical rotor steel. Mater. Res. Express 2020, 7, 056507. [Google Scholar] [CrossRef]
- Su, Z.; Li, N.; Sun, C.; Zhao, J.; Wang, C.; Qian, L. Strain rate-dependent hardening with dislocation-twin interaction of Fe–Mn–Al–C steel using crystal plasticity. Mater. Sci. Technol. 2019, 35, 1436–1447. [Google Scholar] [CrossRef]
- Yadav, S.D.; Vijayanand, V.D.; Nandgopal, M.; Reddy, G.V.P. On the tensile flow stress response of 304 HCu stainless steel employing a dislocation density based model and electron backscatter diffraction measurements. Philos. Mag. 2019, 100, 312–336. [Google Scholar] [CrossRef]
- Imran, M.; Szyndler, J.; Afzal, M.J.; Bambach, M. Dynamic recrystallization-dependent damage modeling during hot forming. Int. J. Damage Mech. 2019, 29, 335–363. [Google Scholar] [CrossRef]
- Mishra, S.; Yadava, M.; Kulkarni, K.N.; Gurao, N. A new phenomenological approach for modeling strain hardening behavior of face centered cubic materials. Acta Mater. 2019, 178, 99–113. [Google Scholar] [CrossRef]
- Zenasni, Z.; Haterbouch, M.; Atmani, Z.; Atlati, S.; Zenasni, M.; Nasri, K.; Oussouaddi, O. Physics-based plasticity model incorporating microstructure changes for severe plastic deformation. Comptes Rendus Mécanique 2019, 347, 601–614. [Google Scholar] [CrossRef]
- He, X.; Liu, L.; Zeng, T.; Yao, Y. Micromechanical modeling of work hardening for coupling microstructure evolution, dynamic recovery and recrystallization: Application to high entropy alloys. Int. J. Mech. Sci. 2020, 177, 105567. [Google Scholar] [CrossRef]
- Bong, H.J.; Lee, J.; Lee, M.G. Identification of mechanical responses of steel sheets under non-proportional loadings using dislocation-density based crystal plasticity model. Int. J. Mech. Sci. 2019, 155, 461–474. [Google Scholar] [CrossRef]
- Speich, G.R. Metals Handbook Vol. 1 Properties and Selection Irons and Steels, Ultrahigh-Strength Steels Section; ASM International: Materials Park, OH, USA, 2005; pp. 1118–1170. [Google Scholar]
- Liu, J.; Liu, Y.; Lin, H.; Li, M. The metadynamic recrystallization in the two-stage isothermal compression of 300M steel. Mater. Sci. Eng. A 2013, 565, 126–131. [Google Scholar] [CrossRef]
- Liu, Y.G.; Liu, J.; Li, M.; Lin, H. The study on kinetics of static recrystallization in the two-stage isothermal compression of 300M steel. Comput. Mater. Sci. 2014, 84, 115–121. [Google Scholar] [CrossRef]
- Luo, J.; Liu, Y.; Li, M.-Q. Three-dimensional Numerical Simulation and Experimental Analysis of Austenite Grain Growth Behavior in Hot Forging Processes of 300M Steel Large Components. J. Iron Steel Res. Int. 2016, 23, 1012–1019. [Google Scholar] [CrossRef]
- Zhao, M.; Huang, L.; Zeng, R.; Wen, D.; Su, H.; Li, J. In-situ observations and modeling of static recrystallization in 300 M steel. Mater. Sci. Eng. A 2019, 765, 138300. [Google Scholar] [CrossRef]
- Zhao, M.; Huang, L.; Zeng, R. In-situ observations and modeling of metadynamic recrystallization in 300M steel. Mater. Charact. 2020, 159, 109997. [Google Scholar] [CrossRef]
- Zeng, R.; Huang, L.; Li, J. Quantification of multiple softening processes occurring during multi-stage thermoforming of high-strength steel. Int. J. Plast. 2019, 120, 64–87. [Google Scholar] [CrossRef]
- Chen, R.; Zeng, J.; Yao, G.; Feng, F. Flow-Stress Model of 300M Steel for Multi-Pass Compression. Metals 2020, 10, 438. [Google Scholar] [CrossRef] [Green Version]
- Chen, R.; Zhang, S.; Liu, X.; Feng, F. A Flow Stress Model of 300M Steel for Isothermal Tension. Materials 2021, 14, 252. [Google Scholar] [CrossRef]
- Chen, R.; Zheng, Z.; Li, J.; Li, N.; Feng, F. In Situ Investigation of Grain Evolution of 300M Steel in Isothermal Holding Process. Materials 2018, 11, 1862. [Google Scholar] [CrossRef] [Green Version]
- Sakai, T.; Belyakov, A.; Kaibyshev, R.; Miura, H.; Jonas, J.J. Dynamic and post-dynamic recrystallization under hot, cold and severe plastic deformation conditions. Prog. Mater. Sci. 2014, 60, 130–207. [Google Scholar] [CrossRef] [Green Version]
- Liu, Y.-X.; Lin, Y.; Li, H.-B.; Wen, D.-X.; Chen, X.-M.; Chen, M.-S. Study of dynamic recrystallization in a Ni-based superalloy by experiments and cellular automaton model. Mater. Sci. Eng. A 2015, 626, 432–440. [Google Scholar] [CrossRef]
- Chen, R.; Guo, P.; Zheng, Z.; Li, J.; Feng, F. Dislocation Based Flow Stress Model of 300M Steel in Isothermal Compression Process. Materials 2018, 11, 972. [Google Scholar] [CrossRef] [PubMed] [Green Version]
- Laasraoui, A.; Jonas, J.J. Prediction of steel flow stresses at high temperatures and strain rates. Met. Mater. Trans. A 1991, 22, 1545–1558. [Google Scholar] [CrossRef]


| Variable | Value | Variable | Value | Variable | Value |
|---|---|---|---|---|---|
| 1.2285 | 1.3134 | ||||
| p | 1.4268 |
| T (°C) | ||||
|---|---|---|---|---|
| 0.01 | 0.1 | 1 | 10 | |
| 950 | 0.75 | 0.76 | 0.77 | 0.78 |
| 1000 | 0.77 | 0.78 | 0.79 | 0.81 |
| 1050 | 0.78 | 0.79 | 0.82 | 0.83 |
| 1100 | 0.81 | 0.82 | 0.83 | 0.85 |
| 1150 | 0.83 | 0.85 | 0.86 | 0.88 |
Publisher’s Note: MDPI stays neutral with regard to jurisdictional claims in published maps and institutional affiliations. |
© 2021 by the authors. Licensee MDPI, Basel, Switzerland. This article is an open access article distributed under the terms and conditions of the Creative Commons Attribution (CC BY) license (https://creativecommons.org/licenses/by/4.0/).
Share and Cite
Chen, R.; Zhang, S.; Wang, M.; Liu, X.; Feng, F. Unified Modelling of Flow Stress and Microstructural Evolution of 300M Steel under Isothermal Tension. Metals 2021, 11, 1086. https://doi.org/10.3390/met11071086
Chen R, Zhang S, Wang M, Liu X, Feng F. Unified Modelling of Flow Stress and Microstructural Evolution of 300M Steel under Isothermal Tension. Metals. 2021; 11(7):1086. https://doi.org/10.3390/met11071086
Chicago/Turabian StyleChen, Rongchuang, Shiyang Zhang, Min Wang, Xianlong Liu, and Fei Feng. 2021. "Unified Modelling of Flow Stress and Microstructural Evolution of 300M Steel under Isothermal Tension" Metals 11, no. 7: 1086. https://doi.org/10.3390/met11071086
APA StyleChen, R., Zhang, S., Wang, M., Liu, X., & Feng, F. (2021). Unified Modelling of Flow Stress and Microstructural Evolution of 300M Steel under Isothermal Tension. Metals, 11(7), 1086. https://doi.org/10.3390/met11071086