Article

In-Situ Hollow Sample Setup Design for Mechanical Characterisation of Gaseous Hydrogen Embrittlement of Pipeline Steels and Welds

1
Department of Materials Science & Engineering, Delft University of Technology, Mekelweg 2, 2628 CD Delft, The Netherlands
2
Intecsea, Wilhelmina van Pruisenweg 2, 2595 AN Den Haag, The Netherlands
3
Department of Maritime Transport & Technology, Delft University of Technology, Mekelweg 2, 2628 CD Delft, The Netherlands
*
Author to whom correspondence should be addressed.
Metals 2021, 11(8), 1242; https://doi.org/10.3390/met11081242
Submission received: 22 June 2021 / Revised: 26 July 2021 / Accepted: 30 July 2021 / Published: 5 August 2021

Abstract

:
This work discusses the design and demonstration of an in-situ test setup for testing pipeline steels in a high pressure gaseous hydrogen (H2) environment. A miniature hollow pipe-like tensile specimen was designed that acts as the gas containment volume during the test. Specific areas of the specimen can be forced to fracture by selective notching, as performed on the weldment. The volume of H2 used was minimised so the test can be performed safely without the need of specialised equipment. The setup is shown to be capable of characterising Hydrogen Embrittlement (HE) in steels through testing an X60 pipeline steel and its weldment. The percentage elongation (%El) of the base metal was found to be reduced by 40% when tested in 100 barg H2. Reduction of cross-sectional area (%RA) was found to decrease by 28% and 11% in the base metal and weld metal, respectively, when tested in 100 barg H2. Benchmark test were performed at 100 barg N2 pressure. SEM fractography further indicated a shift from normal ductile fracture mechanisms to a brittle transgranular (TG) quasi-cleavage (QC) type fracture that is characteristic of HE.

1. Introduction

Using hydrogen as an energy carrier is increasingly put forward as one of the most promising alternatives to fossil fuels. If renewable energy is used to generate hydrogen gas by the electrolysis of water, the hydrogen itself becomes a renewable, or clean, resource. The European Green Deal specifically mentions the development of clean hydrogen technologies and networks as a way of reaching net zero emission of greenhouse gases in 2050 [1]. An added benefit to the use of gaseous hydrogen is the ability to transport it through pipelines, which can also act as buffers, where it can be converted back into electricity when demand is high [2]. However, pipeline steels have been shown to be susceptible to Hydrogen Embrittlement (HE) [3,4]. This phenomenon describes the deterioration of mechanical properties of a material due to the interaction with hydrogen. It can result in premature fracture of steel parts at stresses and/or strains considerably lower than without the presence of hydrogen [5,6,7,8,9]. Extensive characterisation of HE behaviour is therefore essential before any steel can be used in a hydrogen environment. However, the atomic scale interaction between hydrogen and steels combined with a large dependency of HE on time and type of hydrogen environment complicate research significantly [4,10,11,12].
Historically, HE of pipeline steels is mostly caused by absorption of hydrogen into the steel as a result of a cathodic potential that is applied to a pipeline to inhibit corrosion, or because of the presence of H2S gas in the transported medium [13,14]. This environment is often modelled in a laboratory environment by using a sample as the cathode in an electrolytic cell and applying either a constant current or potential [15,16,17]. A constant potential or current forces reduction of H+ ions to H atoms on the surface that can diffuse into the steel. However, when pipelines will be used to transport gaseous hydrogen, a different charging environment is created. Gaseous hydrogen molecules will dissociate into atomic form at the steel surface, and an equilibrium will be created between the partial pressure of the gaseous hydrogen in the environment and the hydrogen concentration in the subsurface layers of the steel [18,19]. This equilibrium concentration then enables diffusion of hydrogen into the bulk of the steel. Zhao et al. show that these different ways of charging a steel with hydrogen can result in completely different absorbed hydrogen concentrations [12]. They measure a hydrogen concentration of 0.24 wppm for gaseous charging compared to 3.94 wppm for electrochemical charging. Electrochemical charging was furthermore shown to load a higher amount of hydrogen into so-called shallow traps [20], which have been linked to increased HE susceptibility [3,21]. Electrochemical hydrogen charging can therefore result in unrealistic embrittlement if used to model an application in gaseous hydrogen.
Several standardised test methods of evaluating HE suscpetibility exist, that test in-situ at slow strain rates [22,23,24]. ASTM G129 [23] describes a slow strain rate (SSR) test in-situ in an environment that causes Environmentally Assisted Cracking (EAC). ASTM G142 [22] describes a slow strain rate tensile (SSRT) test in-situ in a high pressure hydrogen gas environment. These standards require testing in an environment which contains hydrogen to allow for continuous hydrogen absorption throughout the test. This inhibits the loss of hydrogen during the test to ensure a sufficient concentration even at lower strain rates. Lower strain rates have also been shown to increase HE susceptibility since they allow for more diffusion of hydrogen towards critical areas like crack tips [11,25,26]. Several studies that test in-situ in gaseous hydrogen use autoclaves as a containment volume for the high pressure hydrogen gas [3,27,28,29]. The requirement of specialised equipment complicates these tests considerably, especially when full-scale testing is desired [30]. Testing inside a gaseous environment can be difficult, expensive and time consuming for organizations that lack such facilities. Using a hollow specimen can circumvent many of these issues by using the specimen itself as the gas containment volume. Chandler and Walter propose the idea of a hollow type specimen [31], which has been put into practice by several other researchers. Ogata uses a hollow sample setup to study several different types of steel [32,33,34,35]. By combining the setup with heating and cooling apparatus, he manages to characterise at a large range of temperatures. Chen and Spätig use a hollow sample as a containment volume for high temperature hydrogenated water [36]. Kogut and Pan’ko characterise the HE susceptibility of a weld metal by cracking a notched cylindrical specimen, welding the two halves back together over a part of the wall thickness and subjecting it to another test [37].
This work deals with the development of a simple and easily accessible in-situ tensile setup for assessing the HE susceptibility of metals under gaseous hydrogen loading. The design features a miniature pipe-like specimen geometry that minimises the required volume of hydrogen gas to below 0.1 L so that the test setup can be operated safely and easily without the requirement of special facilities [38]. Furthermore, the specimen geometry allows for separate evaluation of an existing weldment by selective notching. The setup was demonstrated by testing an X60 pipeline steel and its weldment in H2 pressures of up to 100 barg at ambient temperature. The microstructure-HE interaction using this methodology were previously discussed by Boot et al. [39]. This work is specifically targeted at discussing the development and demonstration of the test setup.

2. Materials and Methods

2.1. Materials

The material that was studied in this research was taken from a segment of a subsea pipeline consisting of API 5L X60 pipeline steel and a girth weld made from ESAB 70S-6 weldment steel. The weld was intentionally over-matched, meaning its strength is higher than that of the base metal. Although the pipe was not used for offshore gas transportation, the girth weld was made according to industrial standards. A weld macro is shown in Figure 1, which also shows measurements of the wall thickness of 15.4 mm and weld thickness of 6 mm. The thickness of the first and last weld passes were both measured to be under 2.5 mm, meaning that these were not included in the specimen geometry which is discussed later. The weld geometry is assumed to be identical over the entire pipe circumference as the girth weld was made automatically. Start and stop weld positions were excluded from testing.
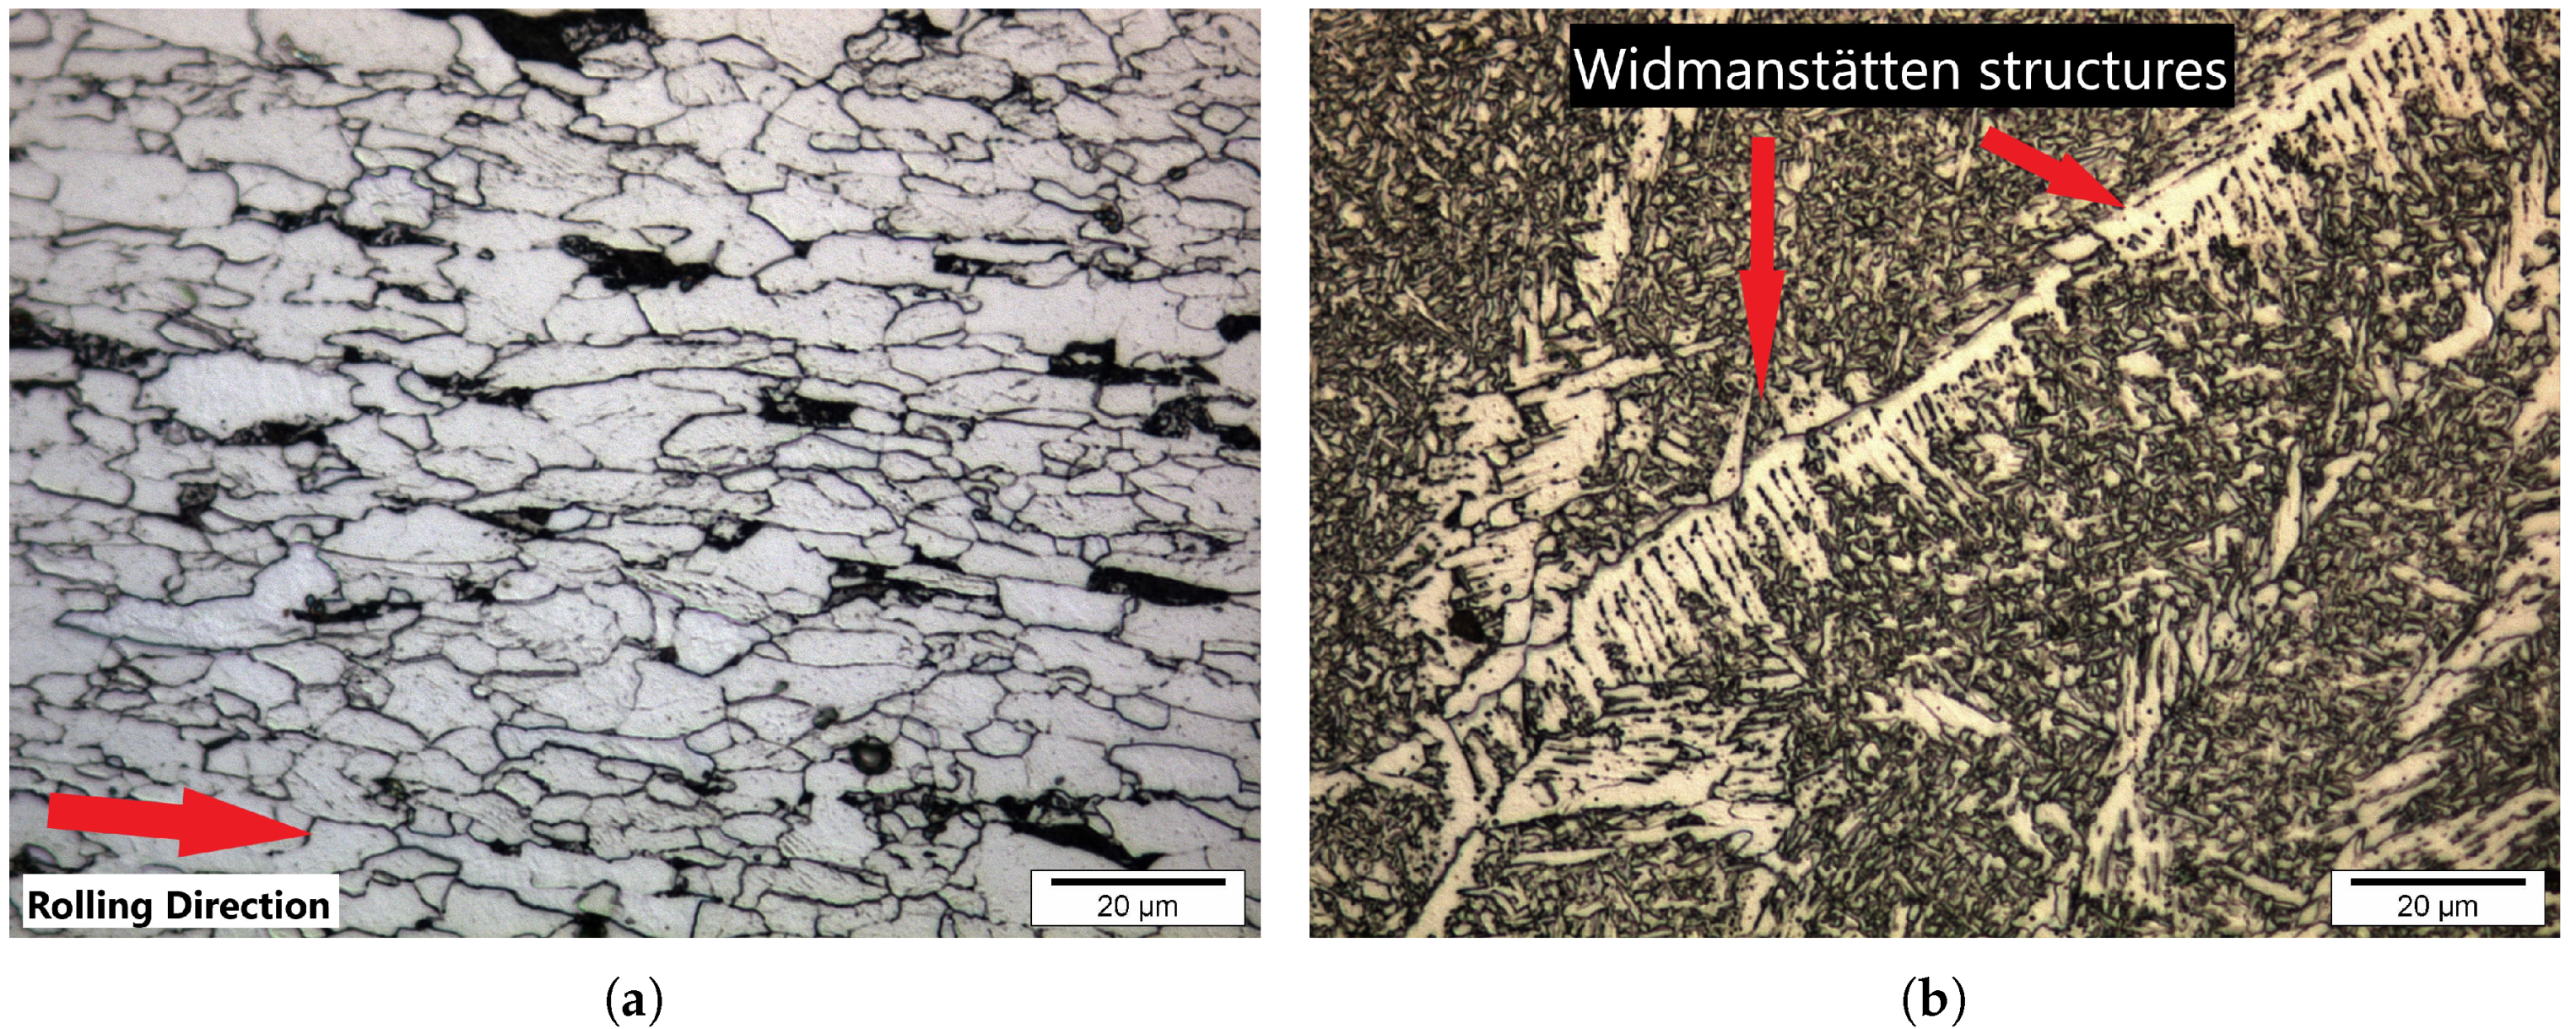
Figure 2 shows the microstructure of the base and weld metals (BM and WM). From Figure 2a, it can be seen that the BM consists predominantly of polygonal ferrite with a small fraction of pearlite grains which can be identified as the black areas. The WM consists of large prior austenite grain boundaries that can also be observed in Figure 1, which contain a more refined microstructure that is shown in Figure 2b. Widmanstätten ferrite structures grow from the prior austenite grain boundaries but eventually transition into a fine grained acicular ferrite phase that comprises most of the bulk of the WM. The acicular ferrite phase consists of small elongated particles that form a basket weave pattern. It should be noted that the high density of grain boundaries in the WM compared to the BM will likely change its behaviour in a hydrogen environment. The hardness of the BM and WM are HV1 200 ± 3.7 and HV1 248 ± 9.9, respectively. The compositions of both steels were measured using X-ray fluorescence (XRF) and LECO combustion analysis and are shown in Table 1.

2.2. In-Situ Gaseous H2 Setup Design and Testing

2.2.1. Setup Design

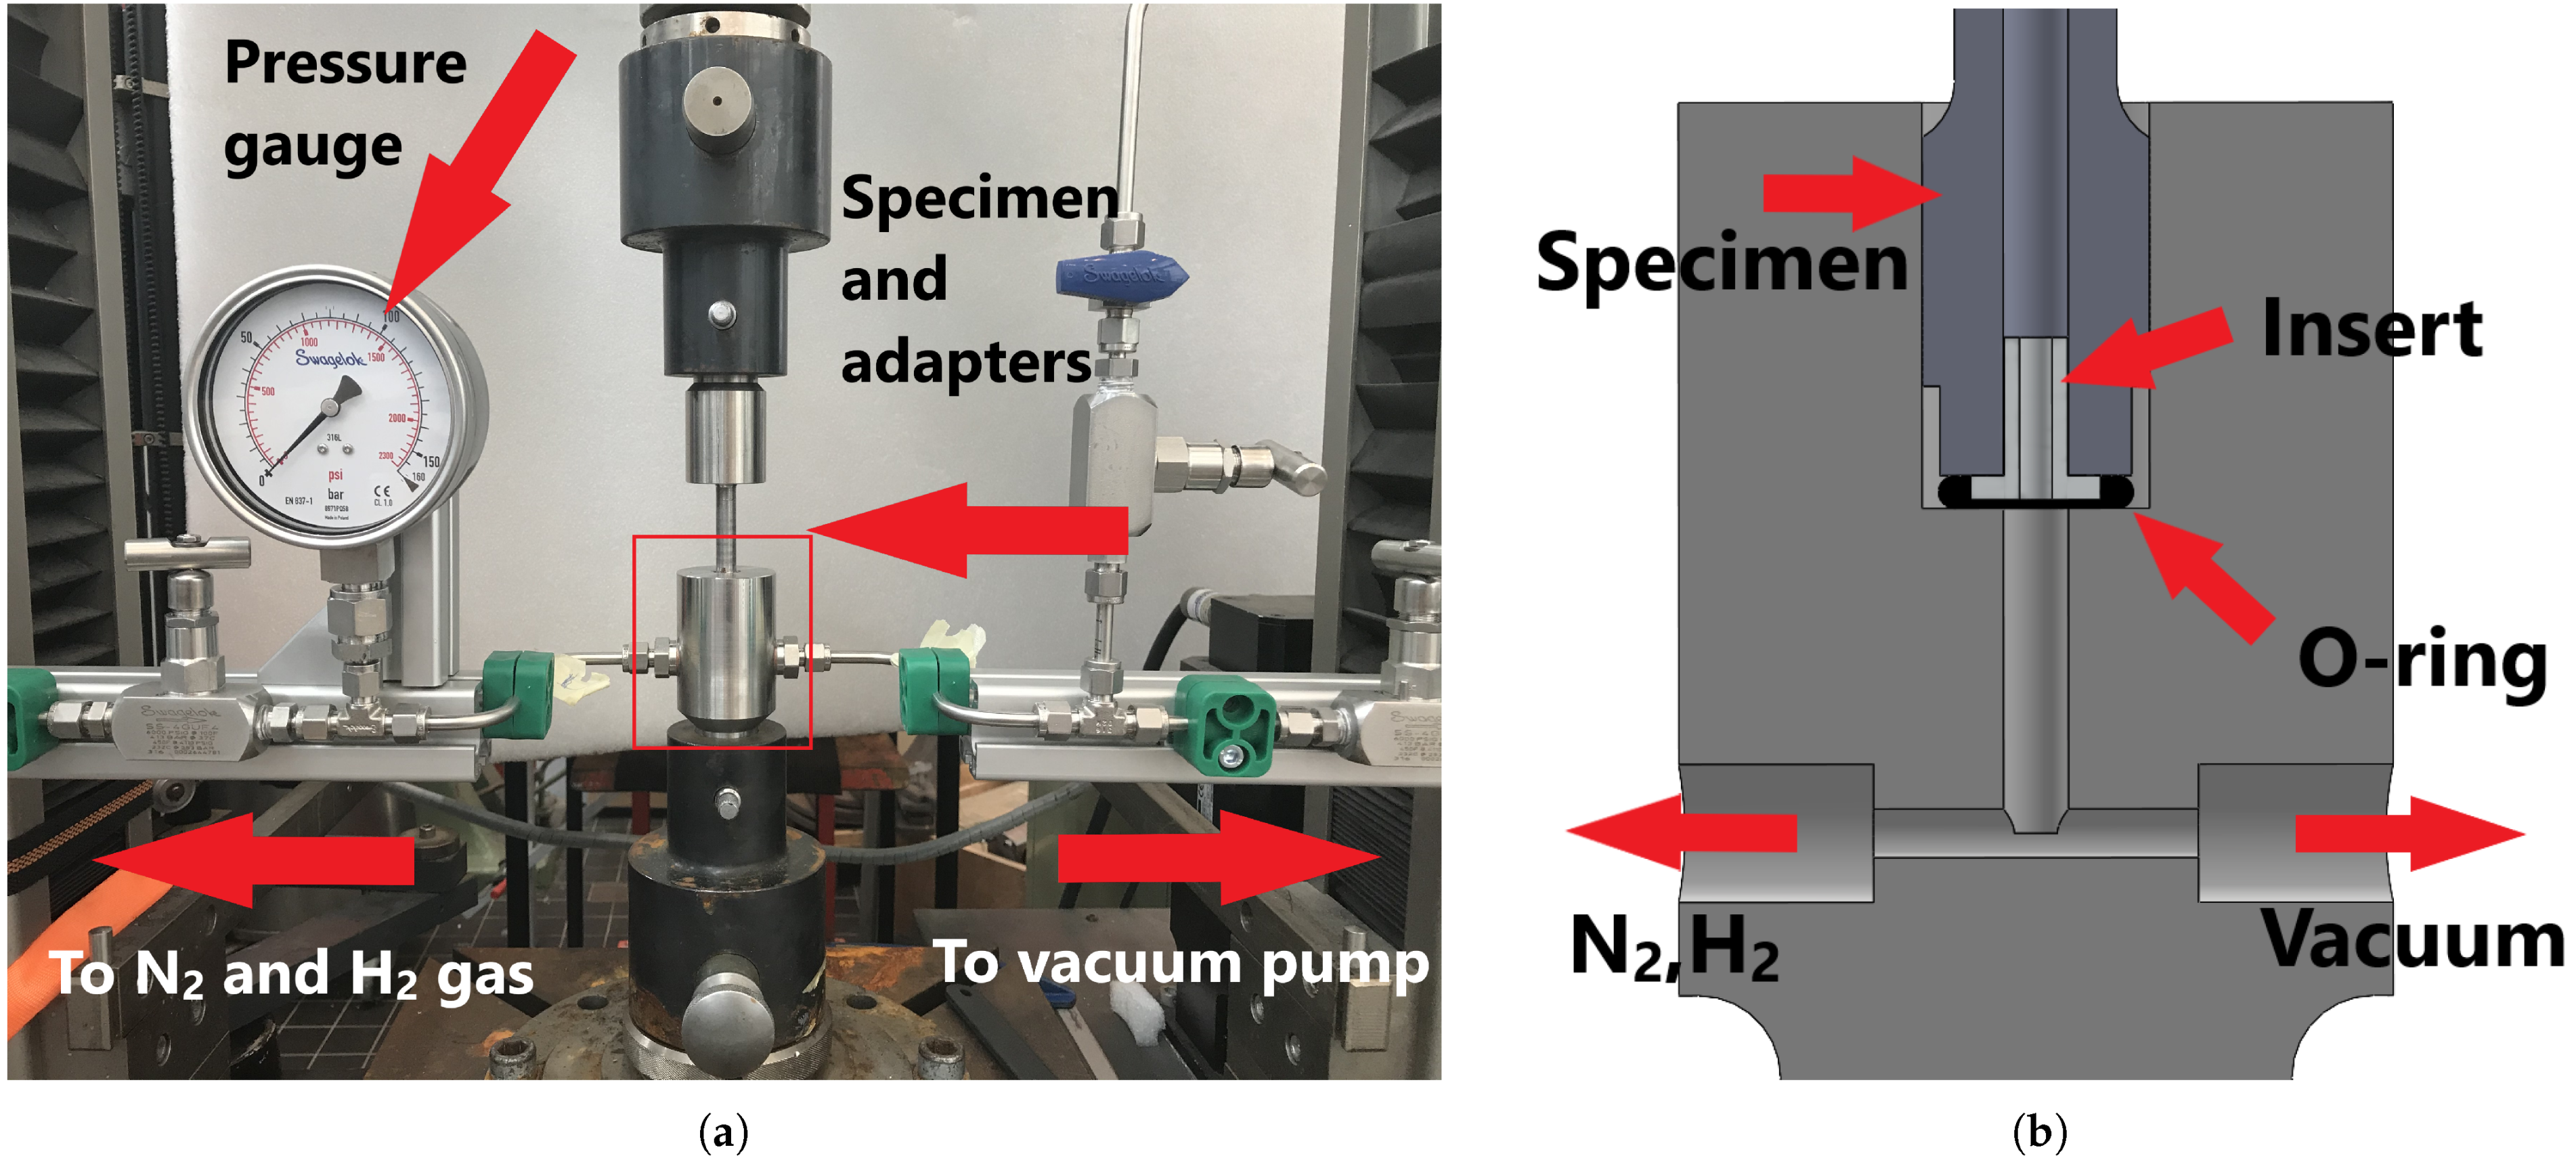
The setup designed in this work consists of a hollow specimen in combination with adapters that mount the specimen in an existing tensile tester, thus making it a simple, accessible test methodology. The loading frame used in this research was a Zwick Z100 electromechanical universal test machine equipped with a 100 kN load cell, combined with a Zwick digi-clip extensometer (gauge length 20 mm) and TestXpert II software. The specimen geometry is shown in Figure 3. The cylindrical specimen is machined from the pipe wall of the X60 pipeline steel such that the longitudinal direction of the specimen and the pipeline align. The hole into the specimen was reamed after drilling to create a smoother surface. Because of the orientation in which the samples were machined from the pipe wall, the girth weld region retains its orientation across the circumference of the specimen. If the specimen is considered as a miniature pipeline, the WM thus retains its original function as a girth weld. This results in equivalent loading directions of the weld between the test and actual operating conditions. A blind hole is machined through the specimen from one side, which is the containment volume for the hydrogen gas. The blind hole, the containment volume of the hydrogen gas, is dimensioned to prevent interference between the local stress fields around the edge of the hole and of the outer thread. Thus, failure outside of the gauge length is prevented. In the specimens that included a girth weld, a notch with a radius of 4 mm and a depth of 1 mm was machined to promote fracture in the weld region.
Notches create zones of high hydrostatic tensile stress, high stress triaxialities and strain localisation, which increase HE susceptibility locally and adversely affect fracture behaviour [25,40,41]. By using a blunt notch, a reduction in the cross-section is achieved that raises the stress in the WM to compensate for the higher strength levels than the BM without creating regions of excessive localisation of stress and strain that could significantly influence HE behaviour. The notch design is further discussed in Section 2.3.2. Two aluminium 7075-T6 adapters were designed to connect the specimen to the test setup. An overview of the setup is shown in Figure 4a with a close-up of the bottom adapter in Figure 4b. The specimen connects to the adapters through the threaded holes. The bottom adapter also connects the specimen to the tubing which supplies and evacuates gas inside the specimen. One side connects to N2 and H2 bottles and a pressure gauge, which are used to load the system up to the testing pressure. The other side connects to a release valve that can be used if a test is prematurely aborted and a vacuum pump that is used to evacuate the system of any gases. The connection between the specimen and the bottom adapter is sealed by an O-ring placed around an aluminium insert to ensure proper spacing. A segment of the entire system, including the specimen, can be closed off to create a constant volume of approximately 6 ml so that only a limited amount of gas is released upon fracture of the specimen. This volume is covered by the ‘sound engineering practice’ regulations stated by the EU’s Pressure Equipment Directive for up to 200 bar [38]. This means that the setup can be operated without requiring specialised facilities.

2.2.2. In-Situ H2 Test Procedure

In this research, the newly designed test setup was used to perform SSRT tests on the base and weld metal specimens. The tests consist of a constant cross-head displacement rate of 1.5 mm/h until fracture occurs, which equals a strain rate of approximately 10 5 /s for a smooth specimen. Fracture is defined as the point where the applied load drops by 20% from its maximum between two measurements, which were taken once per second. In case a test is performed in hydrogen gas, a pre-charging step is included in the test procedure. The system is twice flushed with nitrogen gas and evacuated in order to remove any impurities in the system. Then it is pressurised up to the test pressure, which is held for 10 min while the pressure is monitored. If the pressure does not drop, e.g., the volume is not leaking, the system is evacuated once more and filled with H2 up to the testing pressure. This pressure is maintained overnight to allow for sufficient hydrogen diffusion into the steel to reach near-equilibrium values. This is discussed further in Section 2.3.1.
Three groups of specimens were subjected to SSRT tests in this work. BM X60 samples without a notch, BM samples with a notch and specimens including the girth weld and a notch in the weld zone (WM samples). All groups were tested under 100 barg N2 pressure and 100 barg H2 pressure. The smooth (un-notched) BM samples were also tested under lab environment without applied pressure of any gas to evaluate the influence of the hoop stress created by the internal pressure. Notched BM specimens were compared to smooth BM specimens to evaluate the general influence of a blunt notch and to validate the expectation that a blunt notch does not substantially affect the tensile properties of the specimen. All WM specimens were notched to enforce fracture in the weld zone. These specimens were also tested at 30 and 70 barg H2 pressures in order to record the influence of varying pressures. This is summarised in Table 2. All combinations of specimen type and environment were tested at least threefold to verify repeatability.

2.3. Modelling Support

Two FEA models were made to support test setup development, in which the specimen gauge length was modelled using an axisymmetric mesh created in the Abaqus FEA software. To gain an understanding of the pre-charging duration necessary to reach near-equilibrium concentrations of hydrogen in the specimen, and to visualise the concentration gradient, the diffusion of hydrogen in the specimen was modelled. A deformation model was used to evaluate the severity of the stress triaxiality resulting from the notch geometry. Both models use the same mesh containing element sizes between 0.1 mm in the notch and 0.5 mm in the gauge section. The mesh was checked for convergence.

2.3.1. Modelling H Diffusion

The evolution of the hydrogen concentration from the inside surface of the specimen during the pre-charging step was modelled in a diffusion model using standard quadratic axisymmetric heat transfer nodes (DCAX8). The inside surface of the modelled specimen was held at a concentration of 1.722 × 10 11 mol/mm3, which is the expected sub-surface concentration at 293 K and 100 bar according to Sieverts’ law [18,19]. Diffusivities for the BM and WM were taken as 2.25 × 10 4 mm2/s [15] and 2.9 × 10 4 mm2/s [42], respectively. The concentration at the start of the calculation was set to 0 mol/mm3 throughout the model to reflect the state of the specimen before starting the pre-charging step, after it has just been flushed with nitrogen. At the outer surface, Sieverts’ law states the concentration should be 0 because no H2 is present in the environment. Therefore, the outer surface was given the boundary condition of 0 concentration throughout the simulation. An explicit dynamic analysis was performed that allows for monitoring of the hydrogen concentration at the notch root plane over time. The evolution of the concentration gradient through the wall thickness is shown in Figure 5. The equilibrium state of a steadily decreasing H concentration towards the outside surface is reached after approximately 6 h. It is important to note that this model only shows the concentration profile for a sample without any deformation. The presence of elastic and plastic deformations will change the local equilibrium concentration continuously throughout the test. The deformation model serves as an indication of the stresses that will be present.

2.3.2. Modelling Deformation and Stress Distribution in the Notch

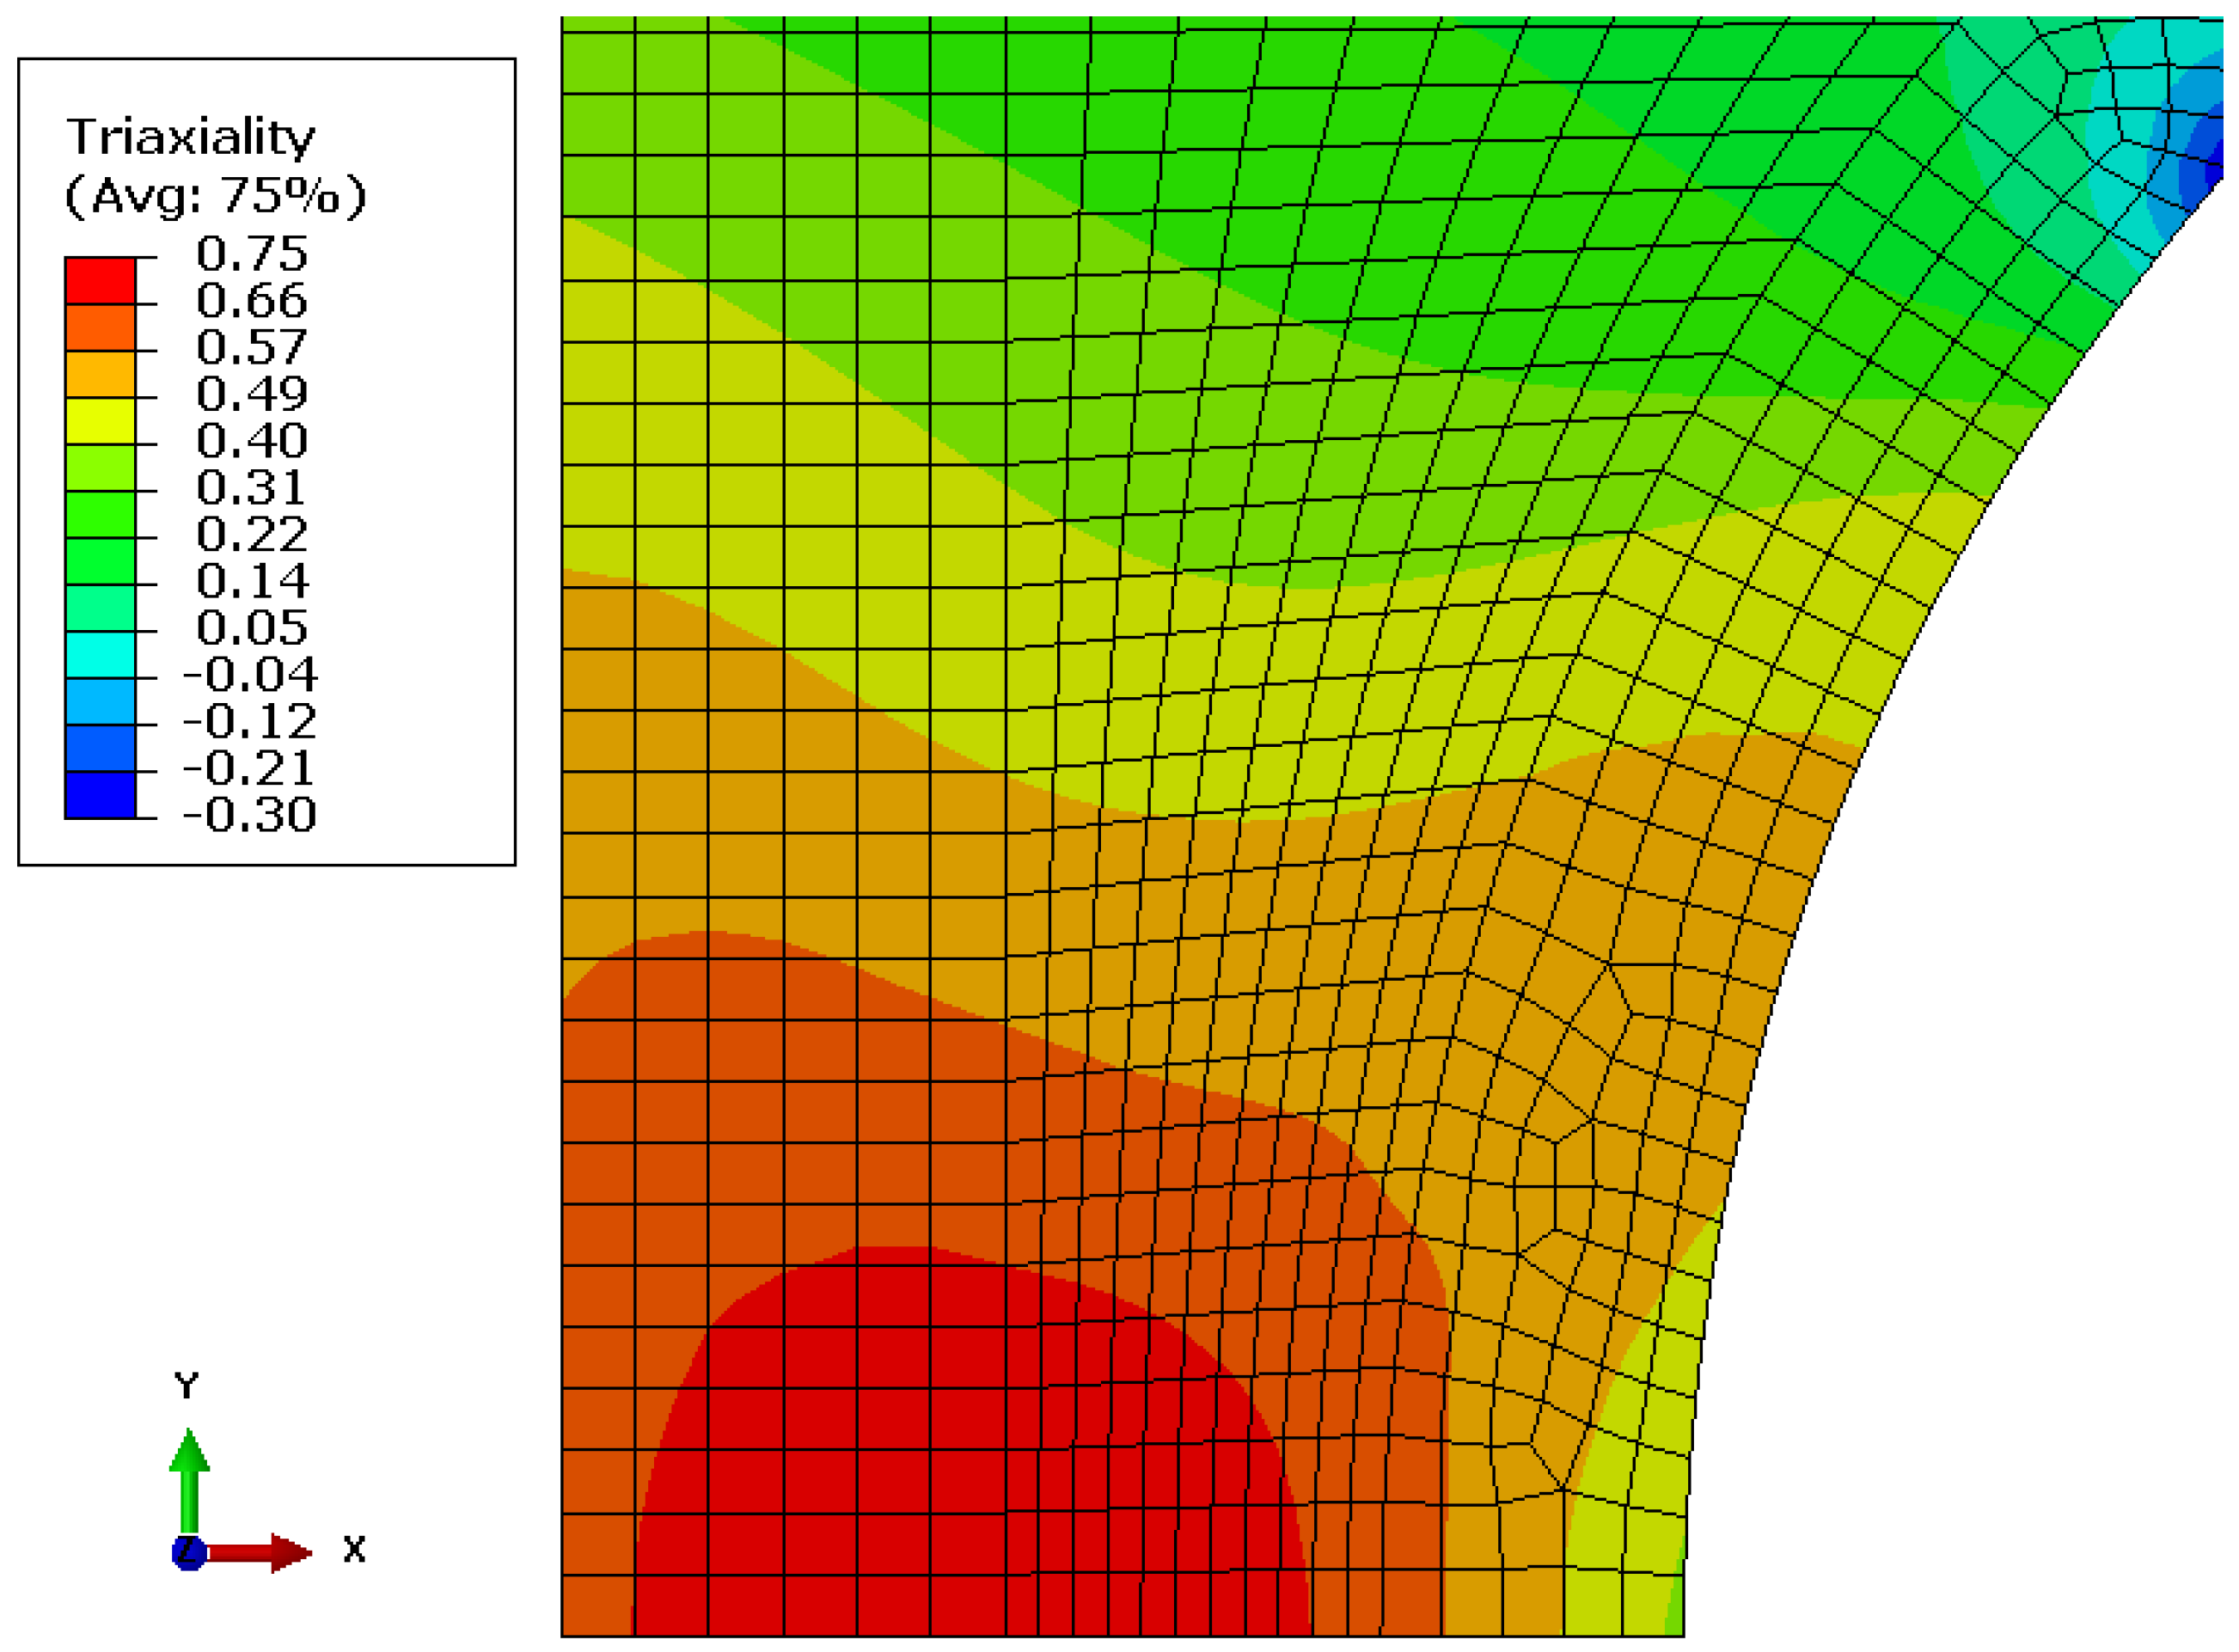
It is important to understand the stress triaxiality as a result of the notch since sharp notches with high triaxialities have been shown to exacerbate HE in steels. A deformation model using 8-node quadratic axisymmetric elements (CAX8) was created that models the extension of the gauge length during the test to monitor the stress development. True stress and strain data were derived from preliminary test results on smooth BM specimens and used as input for an elastoplastic isotropic hardening deformation model, making it accurate up to the onset of necking. An internal pressure of 10 MPa was exerted on the inside surface to model the hoop stress caused by the internal gas pressure. The SSRT test was simulated by displacing the edge of the model, which represent the end of the specimen’s gauge length, by small incremental steps. The model output matches well with experimental data from notched BM specimens. Mechanical properties for the WM were not found in literature nor obtained in this work, so it was therefore not modelled in the deformation model. The stress triaxiality, which is a dimensionless indicator of the relative severity of hydrostatic stress defined as η = σ H / σ Von Mises , was monitored at the onset of necking in the model, where σ H and σ Von Mises are the hydrostatic and Von Mises stresses, respectively. Stress triaxiality is only dependent on the notch geometry, and not on material properties, and will therefore not differ between the BM and WM, except for differences in neck shape, which are expected to be minimal. The stress triaxiality distribution in the notch around the onset of necking is shown in Figure 6. It reaches 0.75, which is typical for a blunt notch. At this level of triaxiality notch effects are not expected to significantly influence the HE behaviour of both metals. However, the location of maximum triaxiality differs from the location of maximum hydrogen concentration without an applied load. The absorbed H is therefore expected to diffuse further into the specimen, and in higher amounts, when the specimen starts deforming during the test.

2.4. Data Representation

Application of a blunt notch in the specimens creates a situation where plastic deformation is not uniform over the gauge length, nor entirely localised to the notch zone. This complicates interpretation of test data since no straightforward stress-strain relationship is present around a notch. Instead, the tensile curves in this paper are represented as stress versus elongation over the gauge length.
A digital extensometer was used in each test to monitor the elongation over a 20 mm section of the specimen Δ l Ext during the initial test stage. The extensometer was removed after the yield point, after which elongation over the entire gauge length was monitored through the cross-head displacement. Stress-strain relationships for smooth specimens can be easily calculated since deformation in these samples is uniform over the gauge length. The extensometer was placed over the notch area for notched specimens. Elongation of the remaining section of the gauge length that was not covered by the extensometer was obtained from stress-strain data of a representative smooth specimen Δ l Smooth . Since all specimens consist of BM outside the notch, extensometer data for each test yields the total gauge length elongation Δ l Gauge .
Δ l Gauge = Δ l Ext + Δ l Smooth
Fractured specimens were analysed using optical and electron microscopy. A Keyence VHX-5000 digital microscope was used to automatically determine the area of each fracture surface A f . This was compared to the original cross-sectional area of the fracture location A 0 to calculate the reduction in cross-sectional area %RA for each specimen.
% RA = ( A 0 A f ) / A 0 100 %
A reduction in cross-sectional area is the result of necking, which is limited by the reduced ductility caused by HE. Therefore the %RA value can be used as an HE indicator, where a lower %RA signifies more HE. The %RA values of specimens tested in an H2 environment were compared to those tested in either N2 or air and represented in an embrittlement index I.
I = ( % RA N 2 , Air % RA H 2 ) / % RA N 2 , Air 100 %
I therefore represents the percentage of ductility that was lost as a result of the hydrogen environment. The automatic determinations of A f allow for manual correction based on the image of the fracture surface. To check the accuracy and repeatability of the area measurements, one surface was observed 5 times, with separate manual corrections. The largest deviation in A f was found to be 0.38% of the mean value; therefore, this method is within the tolerance necessary for assessing the extent of HE. Scanning electron microscopy (SEM) fractography, performed on a JEOL JSM IT-100 machine, was utilised to identify fracture morphologies characteristic of HE.

3. Results and Discussion

3.1. HE in the Base Metal

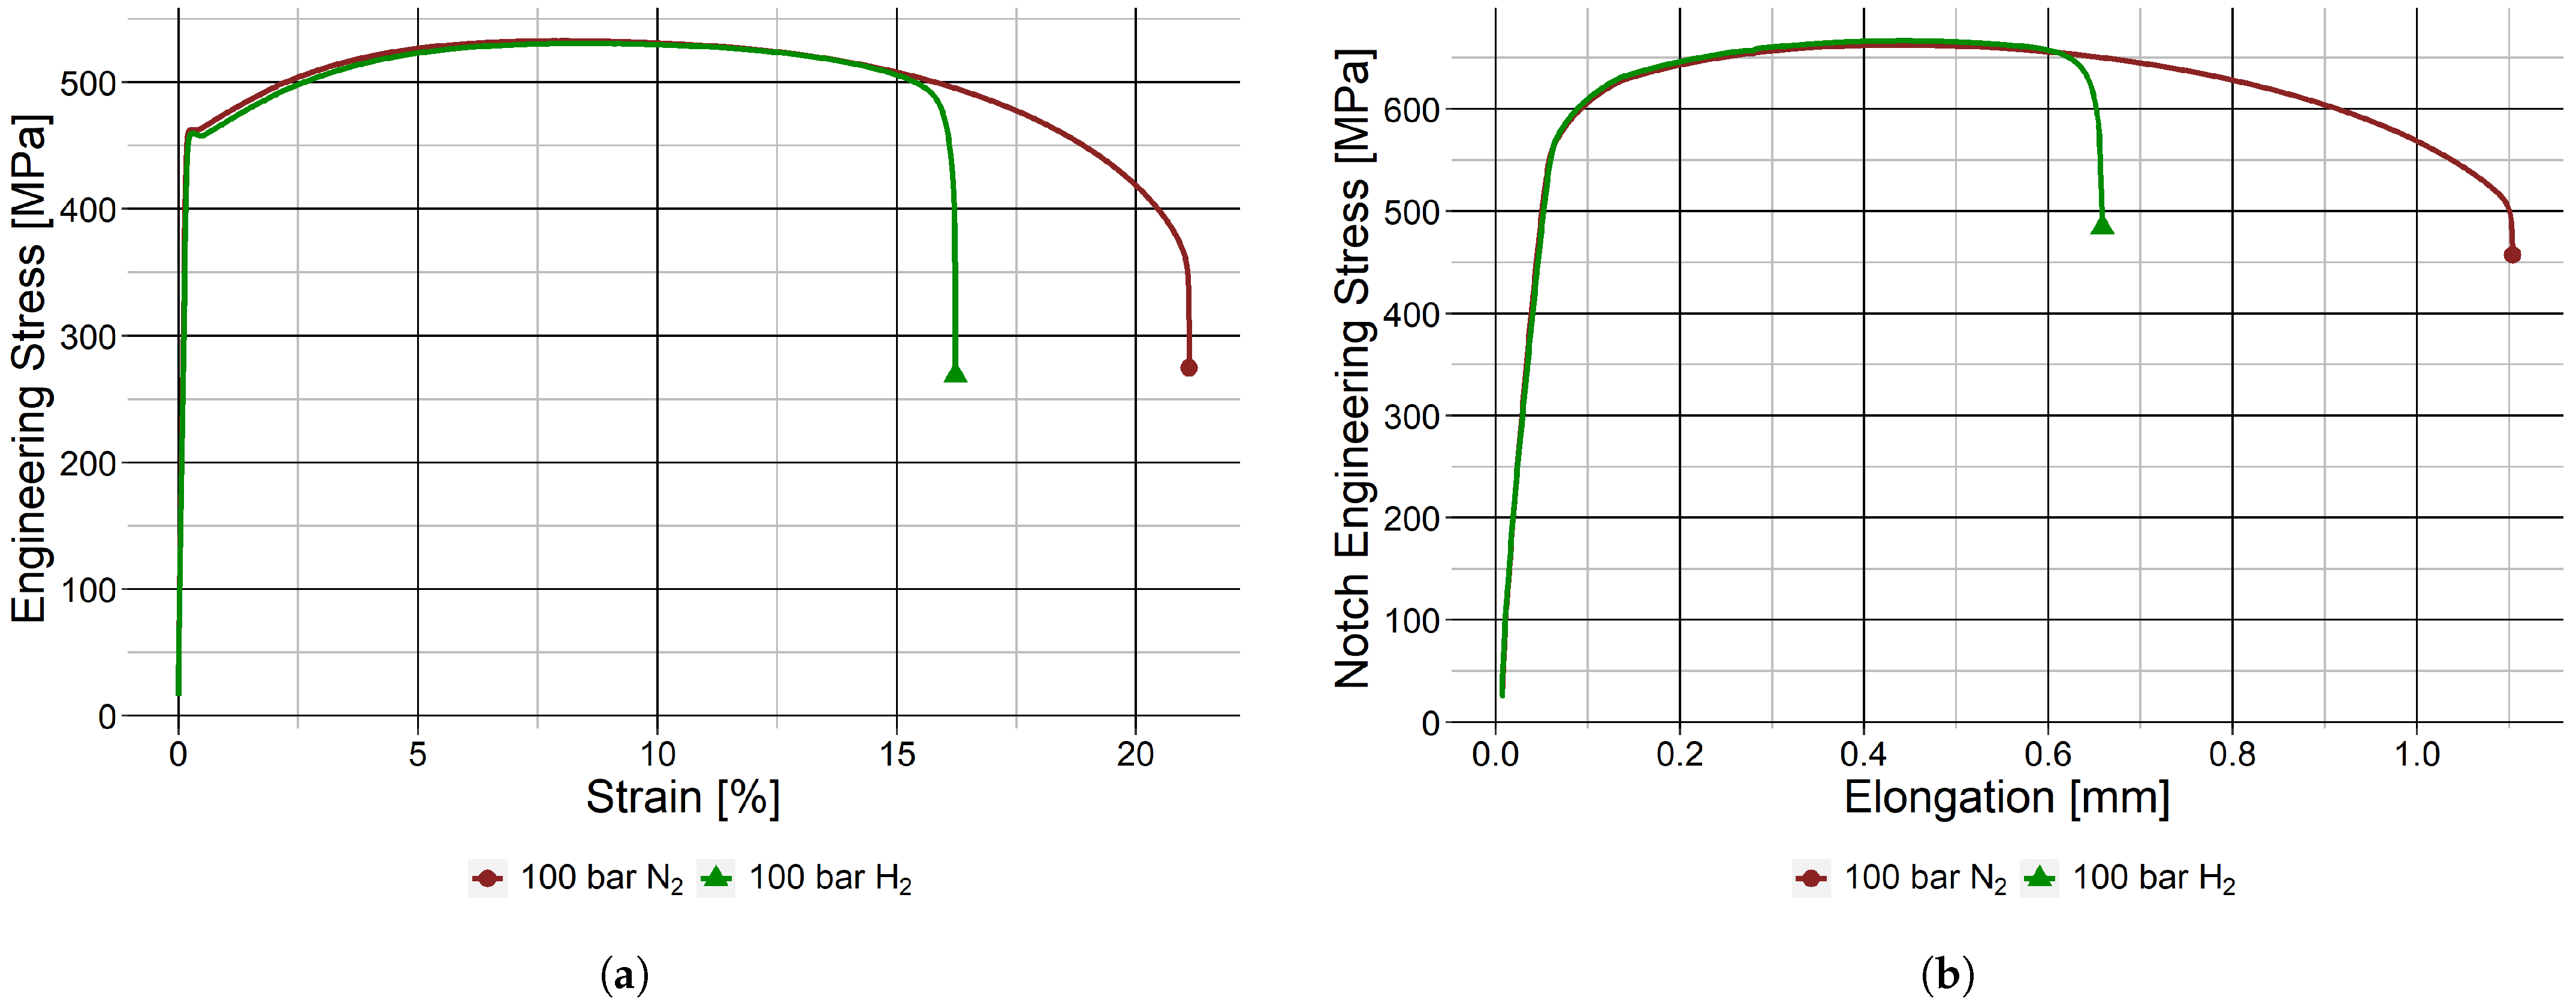
A significant loss of percentage elongation (%El) was found for the smooth BM samples tested in 100 barg H2 when compared to 100 barg N2, as can be seen in Figure 7a. A similar but more pronounced effect was observed in the notched BM samples, which is displayed in Figure 7b. The smooth samples show a reduction in %El of 25.4 ± 7.5% and an I of 27.9 ± 4.6% in a 100 barg H2 environment compared to 100 barg N2. The notched BM specimens show a decrease in elongation of 40.4 ± 13% and a reduction in %RA an I of 28 ± 4.7%. The pronounced decrease in elongation is an effect of the strain localisation in the notch, while the similar I values for both types of sample mean the triaxial stress state in the notch does not seem to influence the HE behaviour. For both specimen geometries, the behaviour of the tensile curve is unchanged before the onset of necking. This emphasises the importance of plastic deformation on HE, which increases hydrogen solubility because of an increased density of dislocations and voids [40,43,44]. The X60 BM is susceptible to HE at large plastic strains even though it is a tough and ductile steel. The %RA and I values for all sample sets are shown in Table 3.

3.2. HE in the Weld Metal

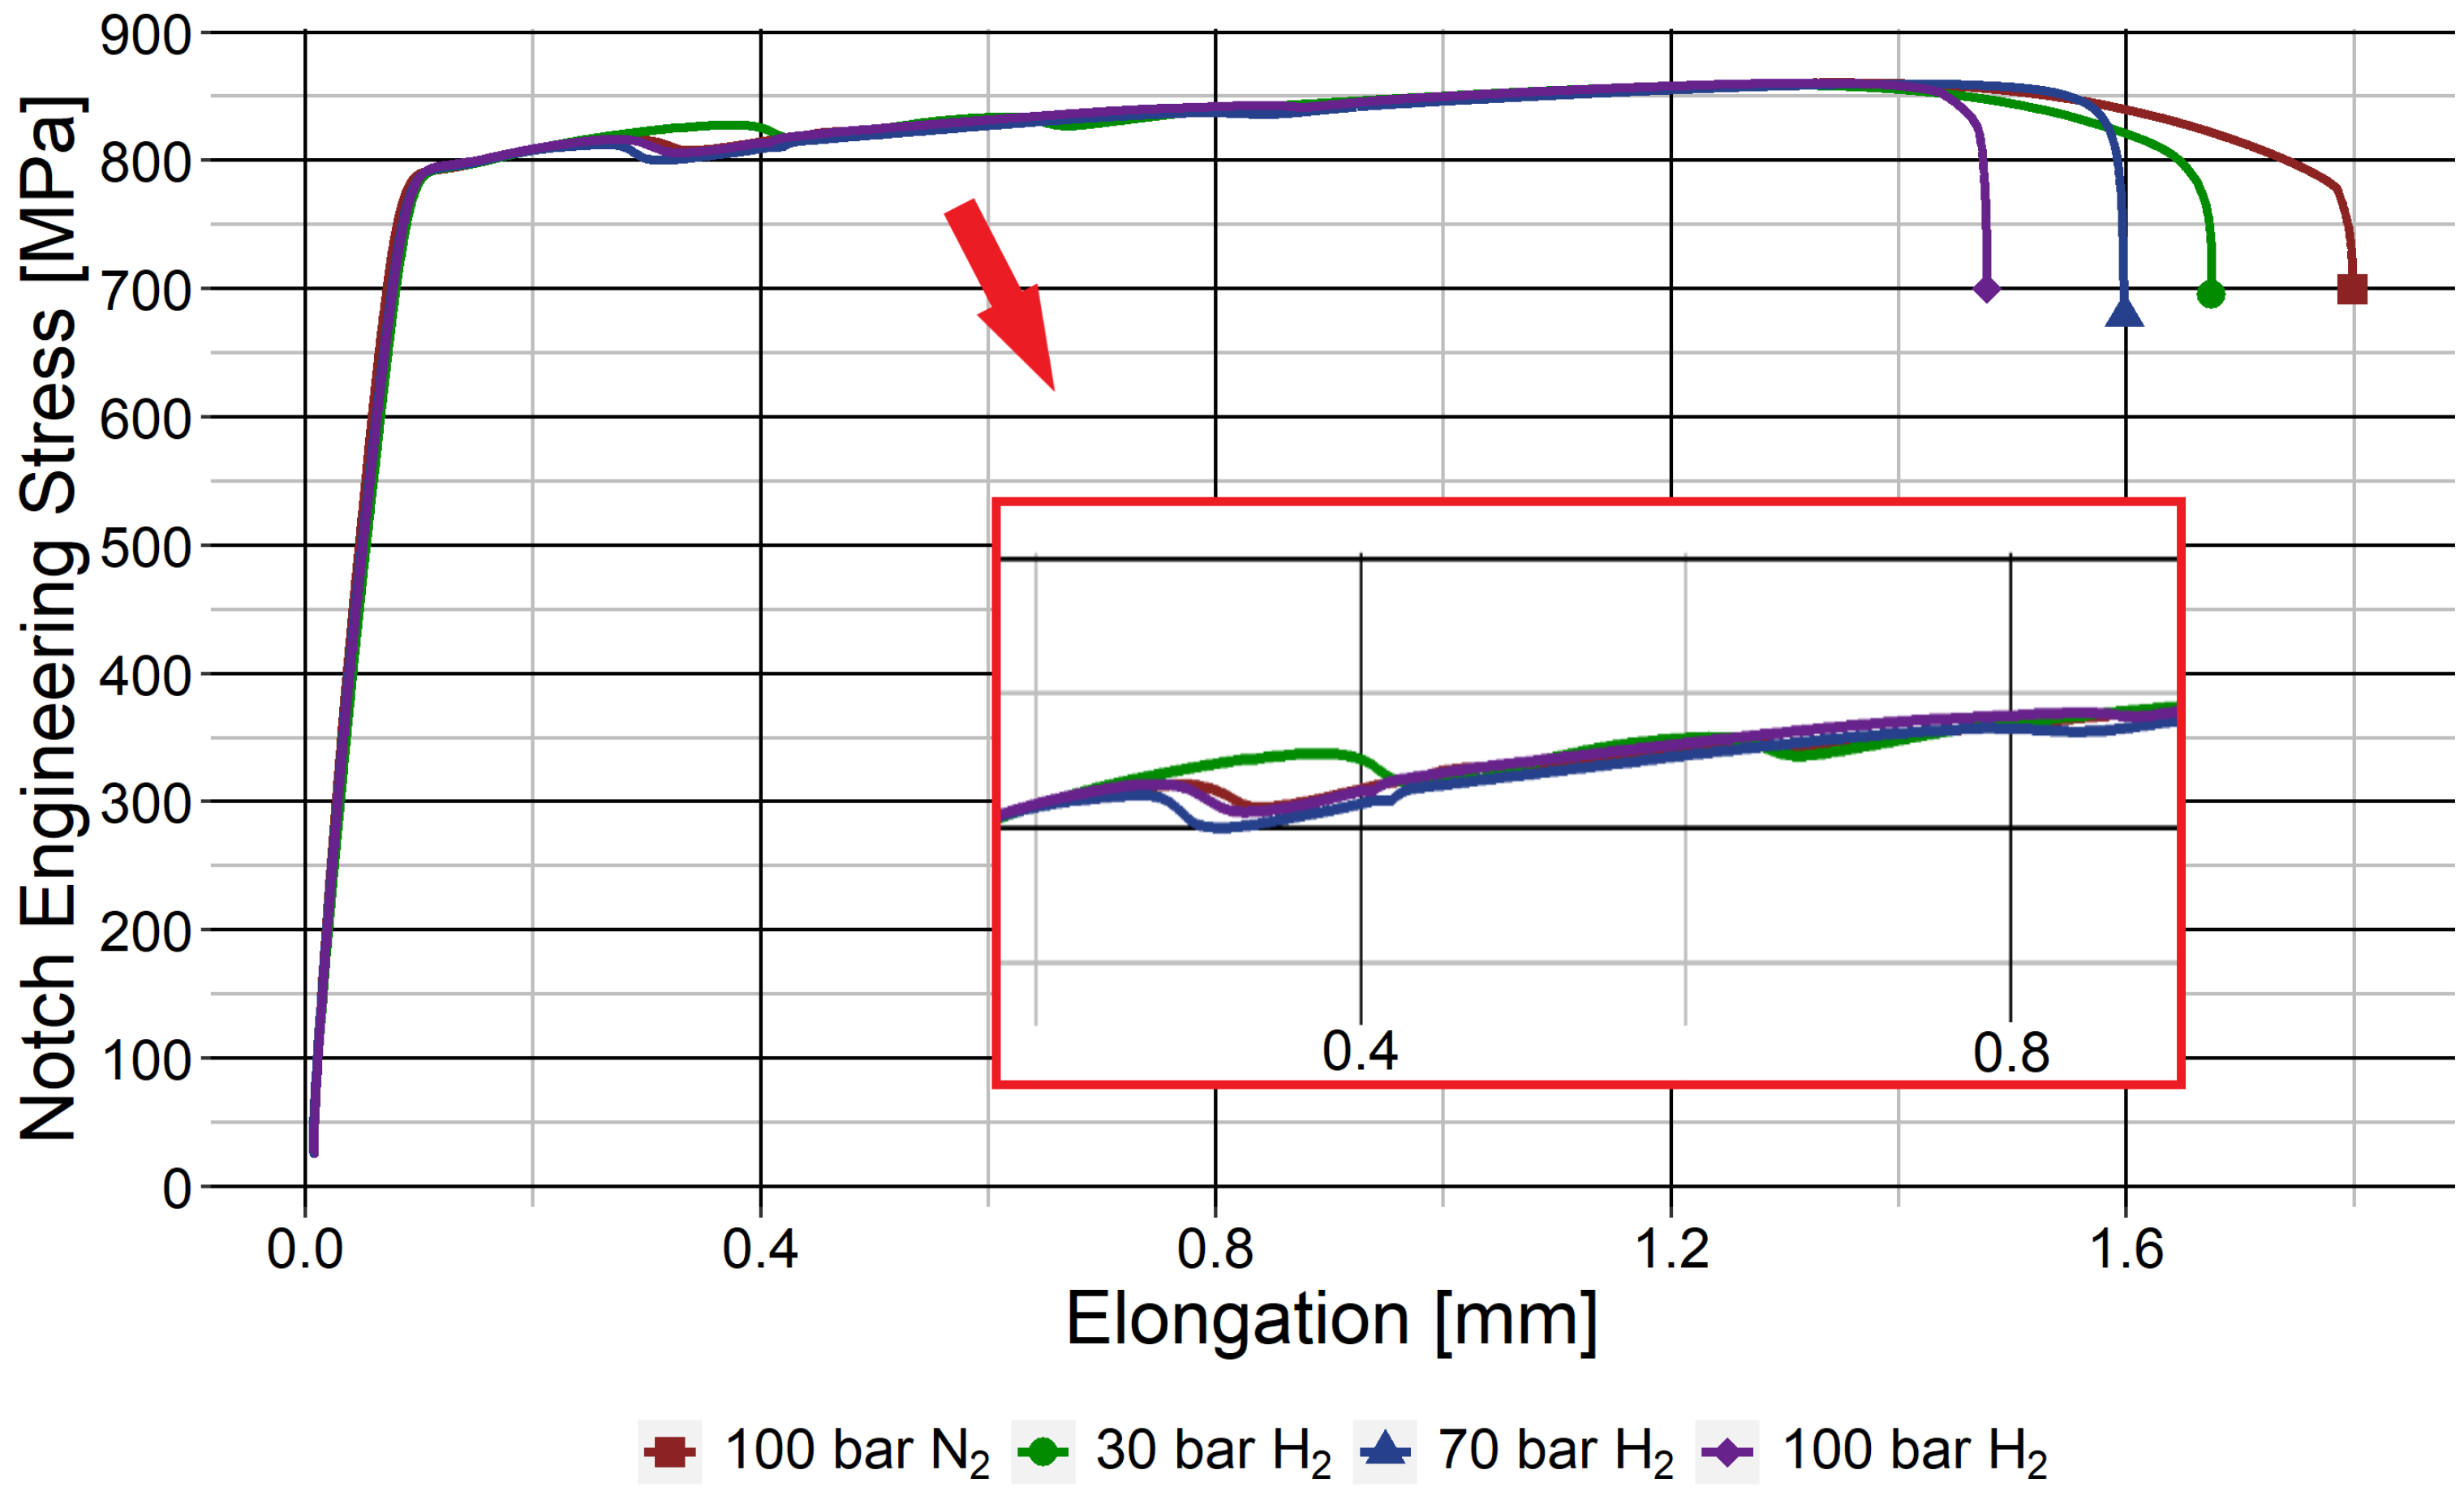
Figure 8 shows the SSRT results for the different subsets of notched WM samples. A reduction in elongation with increasing pressure is observed, but the contribution of the WM is not straightforward to obtain since deformation in these samples is not localised to the notch area. The regions of the WM specimens outside of the notch also deform plastically since the blunt notch does not fully compensate for the higher strength of the WM compared to that of the BM. This is represented in the tensile data by the emergence of secondary and ternary yield points at 0.4 and 0.8 mm of elongation, respectively, as shown in Figure 8. The yield points have been enlarged in the insert in Figure 8 and can be related to yielding of the Heat Affected Zone (HAZ) and WM, respectively. Because of the lack of strain localisation, reduction in elongation data for strictly the WM were not obtained. However, %RA data can be used to quantify the extent of HE of the WM instead. Weld samples at all hydrogen pressures show an I of approximately 11%. The data as listed in Table 3 suggests a trend of decreasing I with increasing H2 pressure, but the measurement error for results with large pressures is too large to make any conclusive statement about this.

3.3. Fractography

3.3.1. Base Metal Fractography

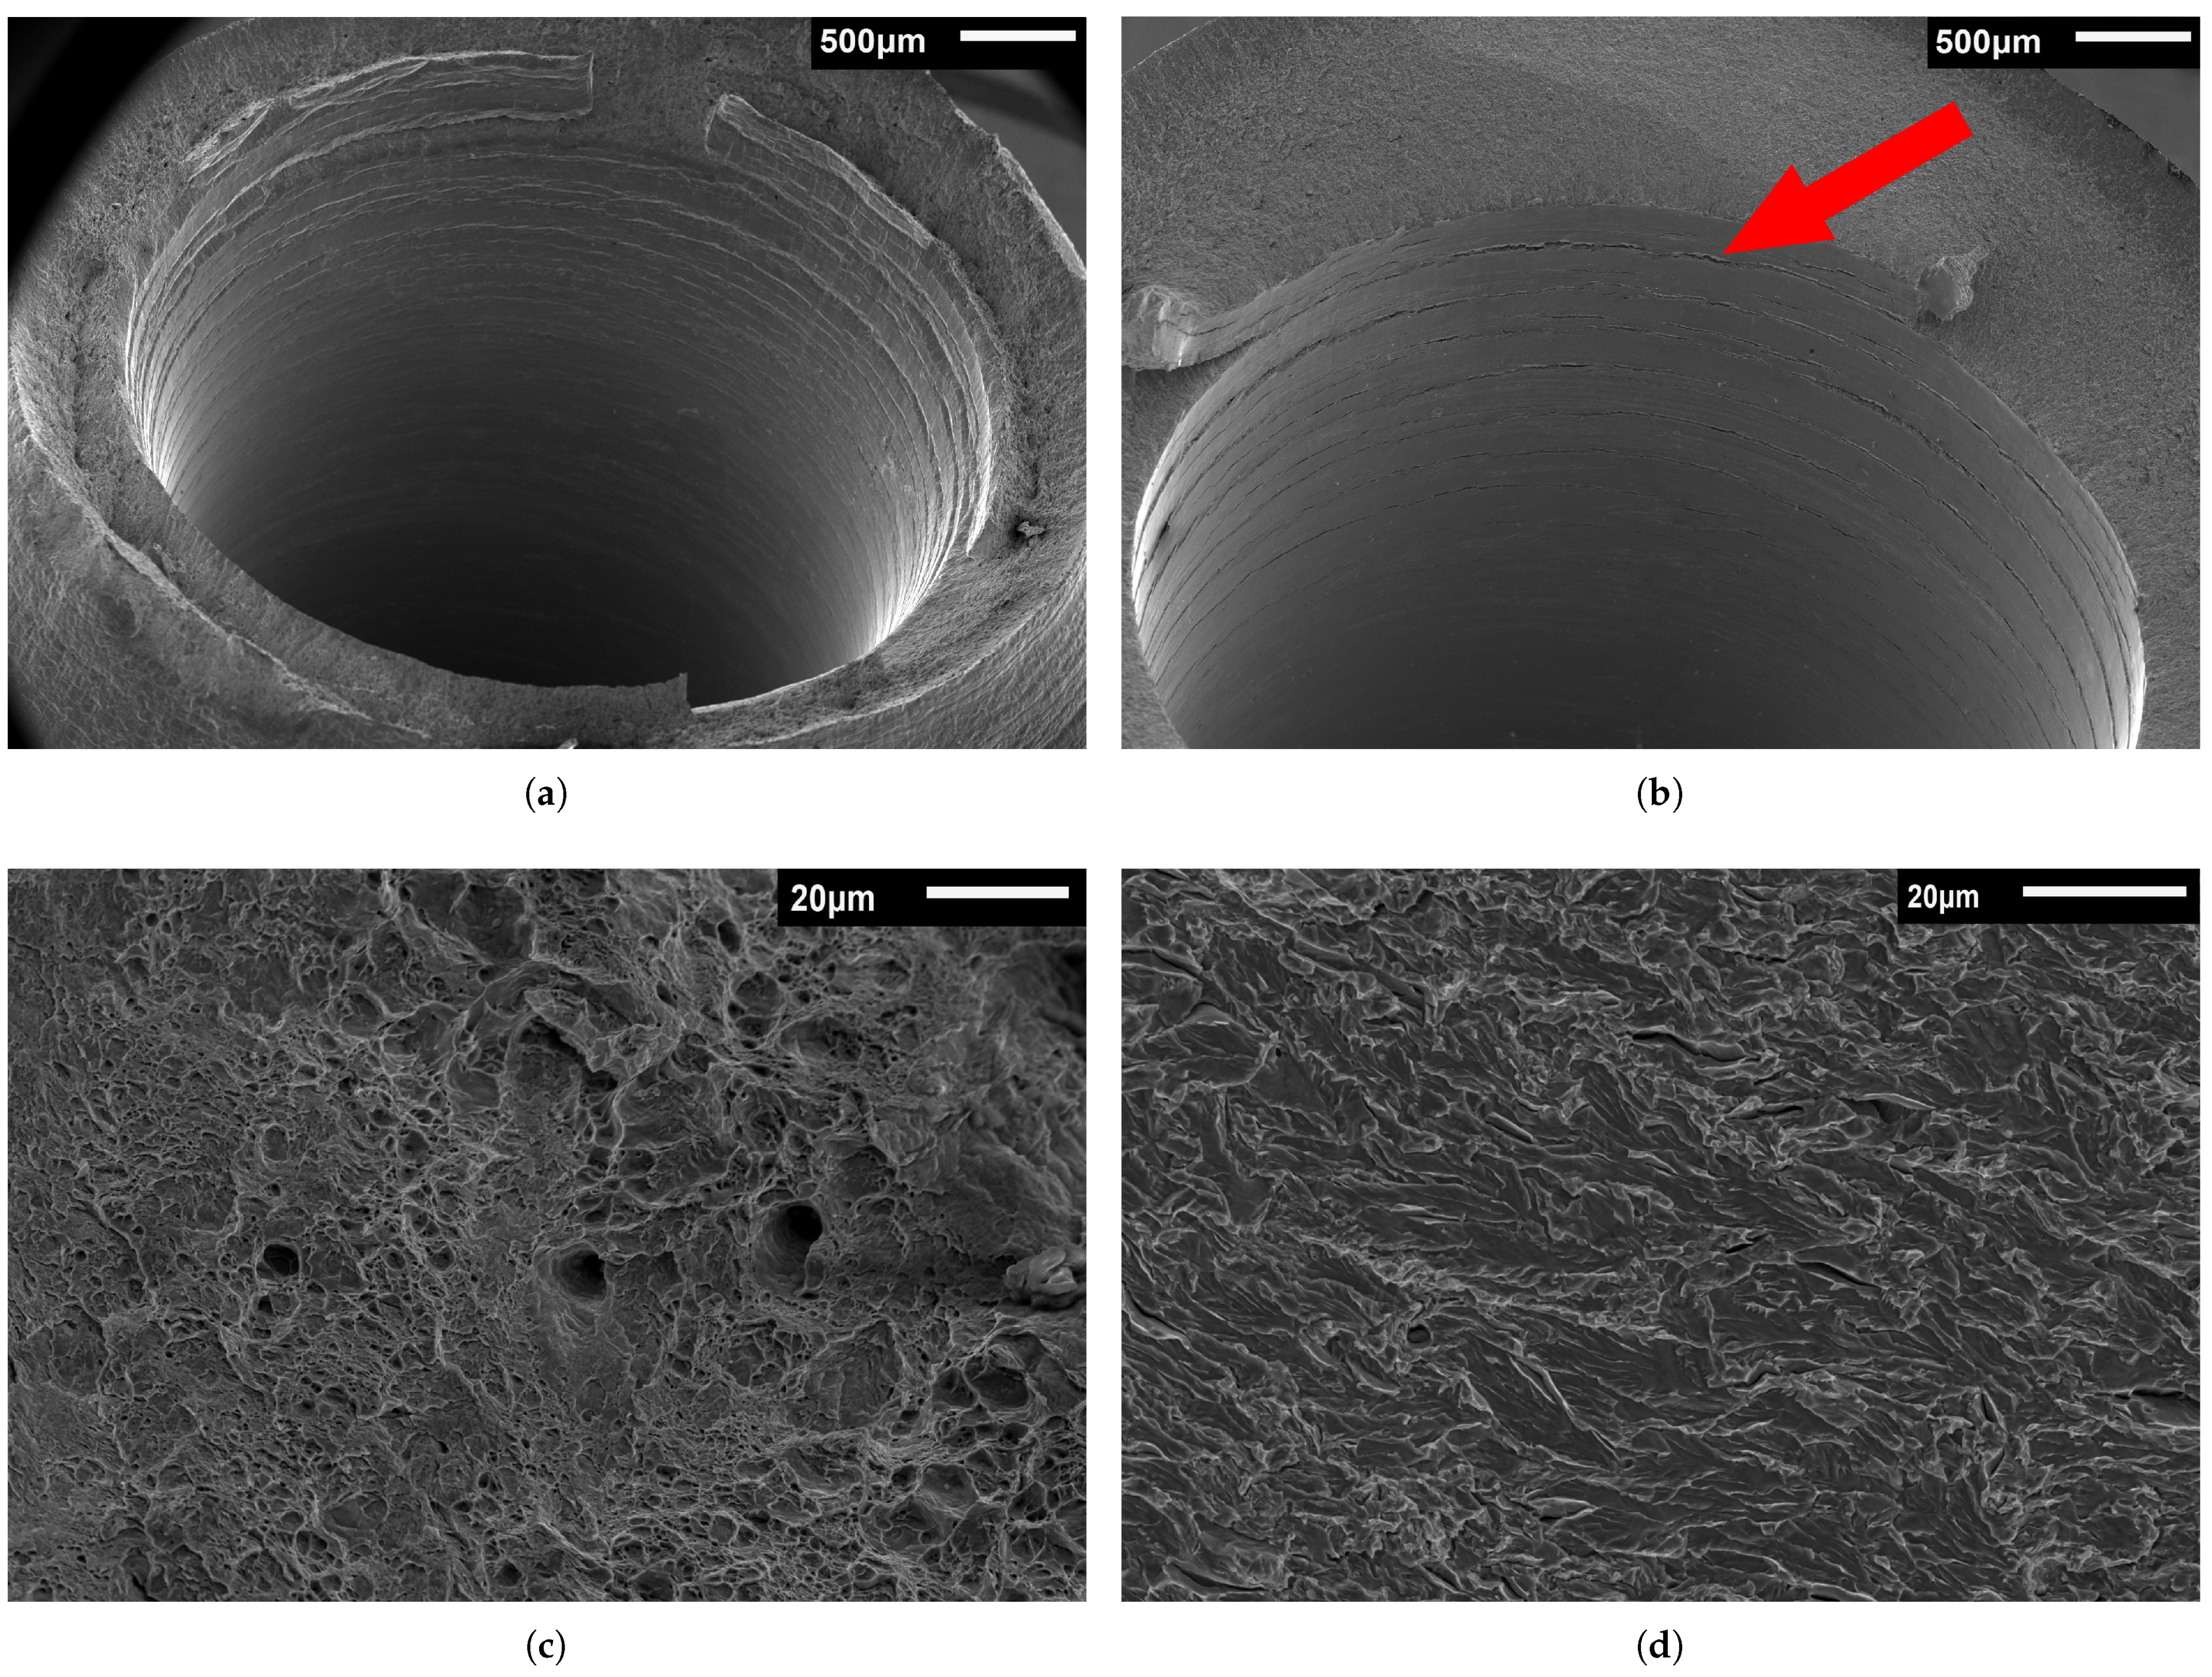
Fractographic observations in the SEM support the findings from mechanical testing. The fracture surfaces of the specimens tested in nitrogen and hydrogen look distinctly different on a macroscopic as well as microscopic level. Figure 9a,b show the macroscopic overview of fracture surfaces of notched BM samples tested in 100 barg N2 and H2, respectively. The specimen tested in nitrogen shows a cup-cone fracture morphology characteristic of ductile fracture. This changes to a flat and faceted fracture surface for the specimen tested in H2. The fracture surface area of the specimen tested in H2 is much larger than that of the N2 specimen. Larger magnification images of smooth BM specimens are shown in Figure 9c,d as an indication of the change in fracture appearance of specimens fracture in H2. Figure 9c was taken from a smooth BM sample tested without any gas, which shows ductile micro void coalescence (MVC) fracture which is characteristic for ductile steels. Figure 9d was taken from the surface of a smooth BM sample tested in 100 barg H2 gas. The fracture morphology of this surface corresponds to quasi-cleavage (QC) which is typical for fracture in hydrogen environments. This fracture micromechanism is characterised by flat cleavage-like facets that are much smaller than in conventional cleavage fracture and irregular ridges that appear on these facets. Secondary cracks on hydrogen fracture surfaces are also observed in this image as well as in the literature [45,46,47].
Fracture was observed to initiate from the inner surface of all specimens that were tested in a hydrogen environment, even though the highest stress concentration of the notch is present on the outside surface and the zone of highest stress triaxiality is present within the sample wall. Figure 9b shows that secondary cracks have formed on the inside surface parallel to the primary fracture surface. Secondary cracking on specimen surfaces that are in contact with hydrogen is frequently observed in the literature [4,47,48]. In this case, secondary cracks are suspected to have initiated from pre-existing machining defects from specimen manufacturing. Similar cracking can be observed in a study by Ogata [32] in which the inner surface was honed instead of reamed, which creates a smoother surface than present in this study. A high absorbed H concentration near the inside surface facilitates quick crack propagation from these machining defects. In the specimen tested in N2 in Figure 9a, it can be seen that the secondary cracks undergo necking to a certain extent and do not influence the final fracture behaviour. The cracks appear to be much sharper in the specimen tested in H2, where they have a smaller crack mouth opening and the primary fracture surface seems to have originated from them. Machining defects that were previously undiscovered might become significant defects when they come into contact with hydrogen gas. The specimen geometry as developed in this work complicates inspection of the inside surface because of the nature of the blind hole. Careful polishing of the surface that is in contact with the hydrogen environment is therefore advised in future work. An alternative to avoid this problem is to utilise specimens featuring sharper notches on the outside surface, or machined notches on the inside surface to enforce cracking a pre-defined location. However, because HE susceptibility is highly sensitive to notch effects, care should be taken when comparing test data between different specimen geometries.

3.3.2. Weld Metal Fractography

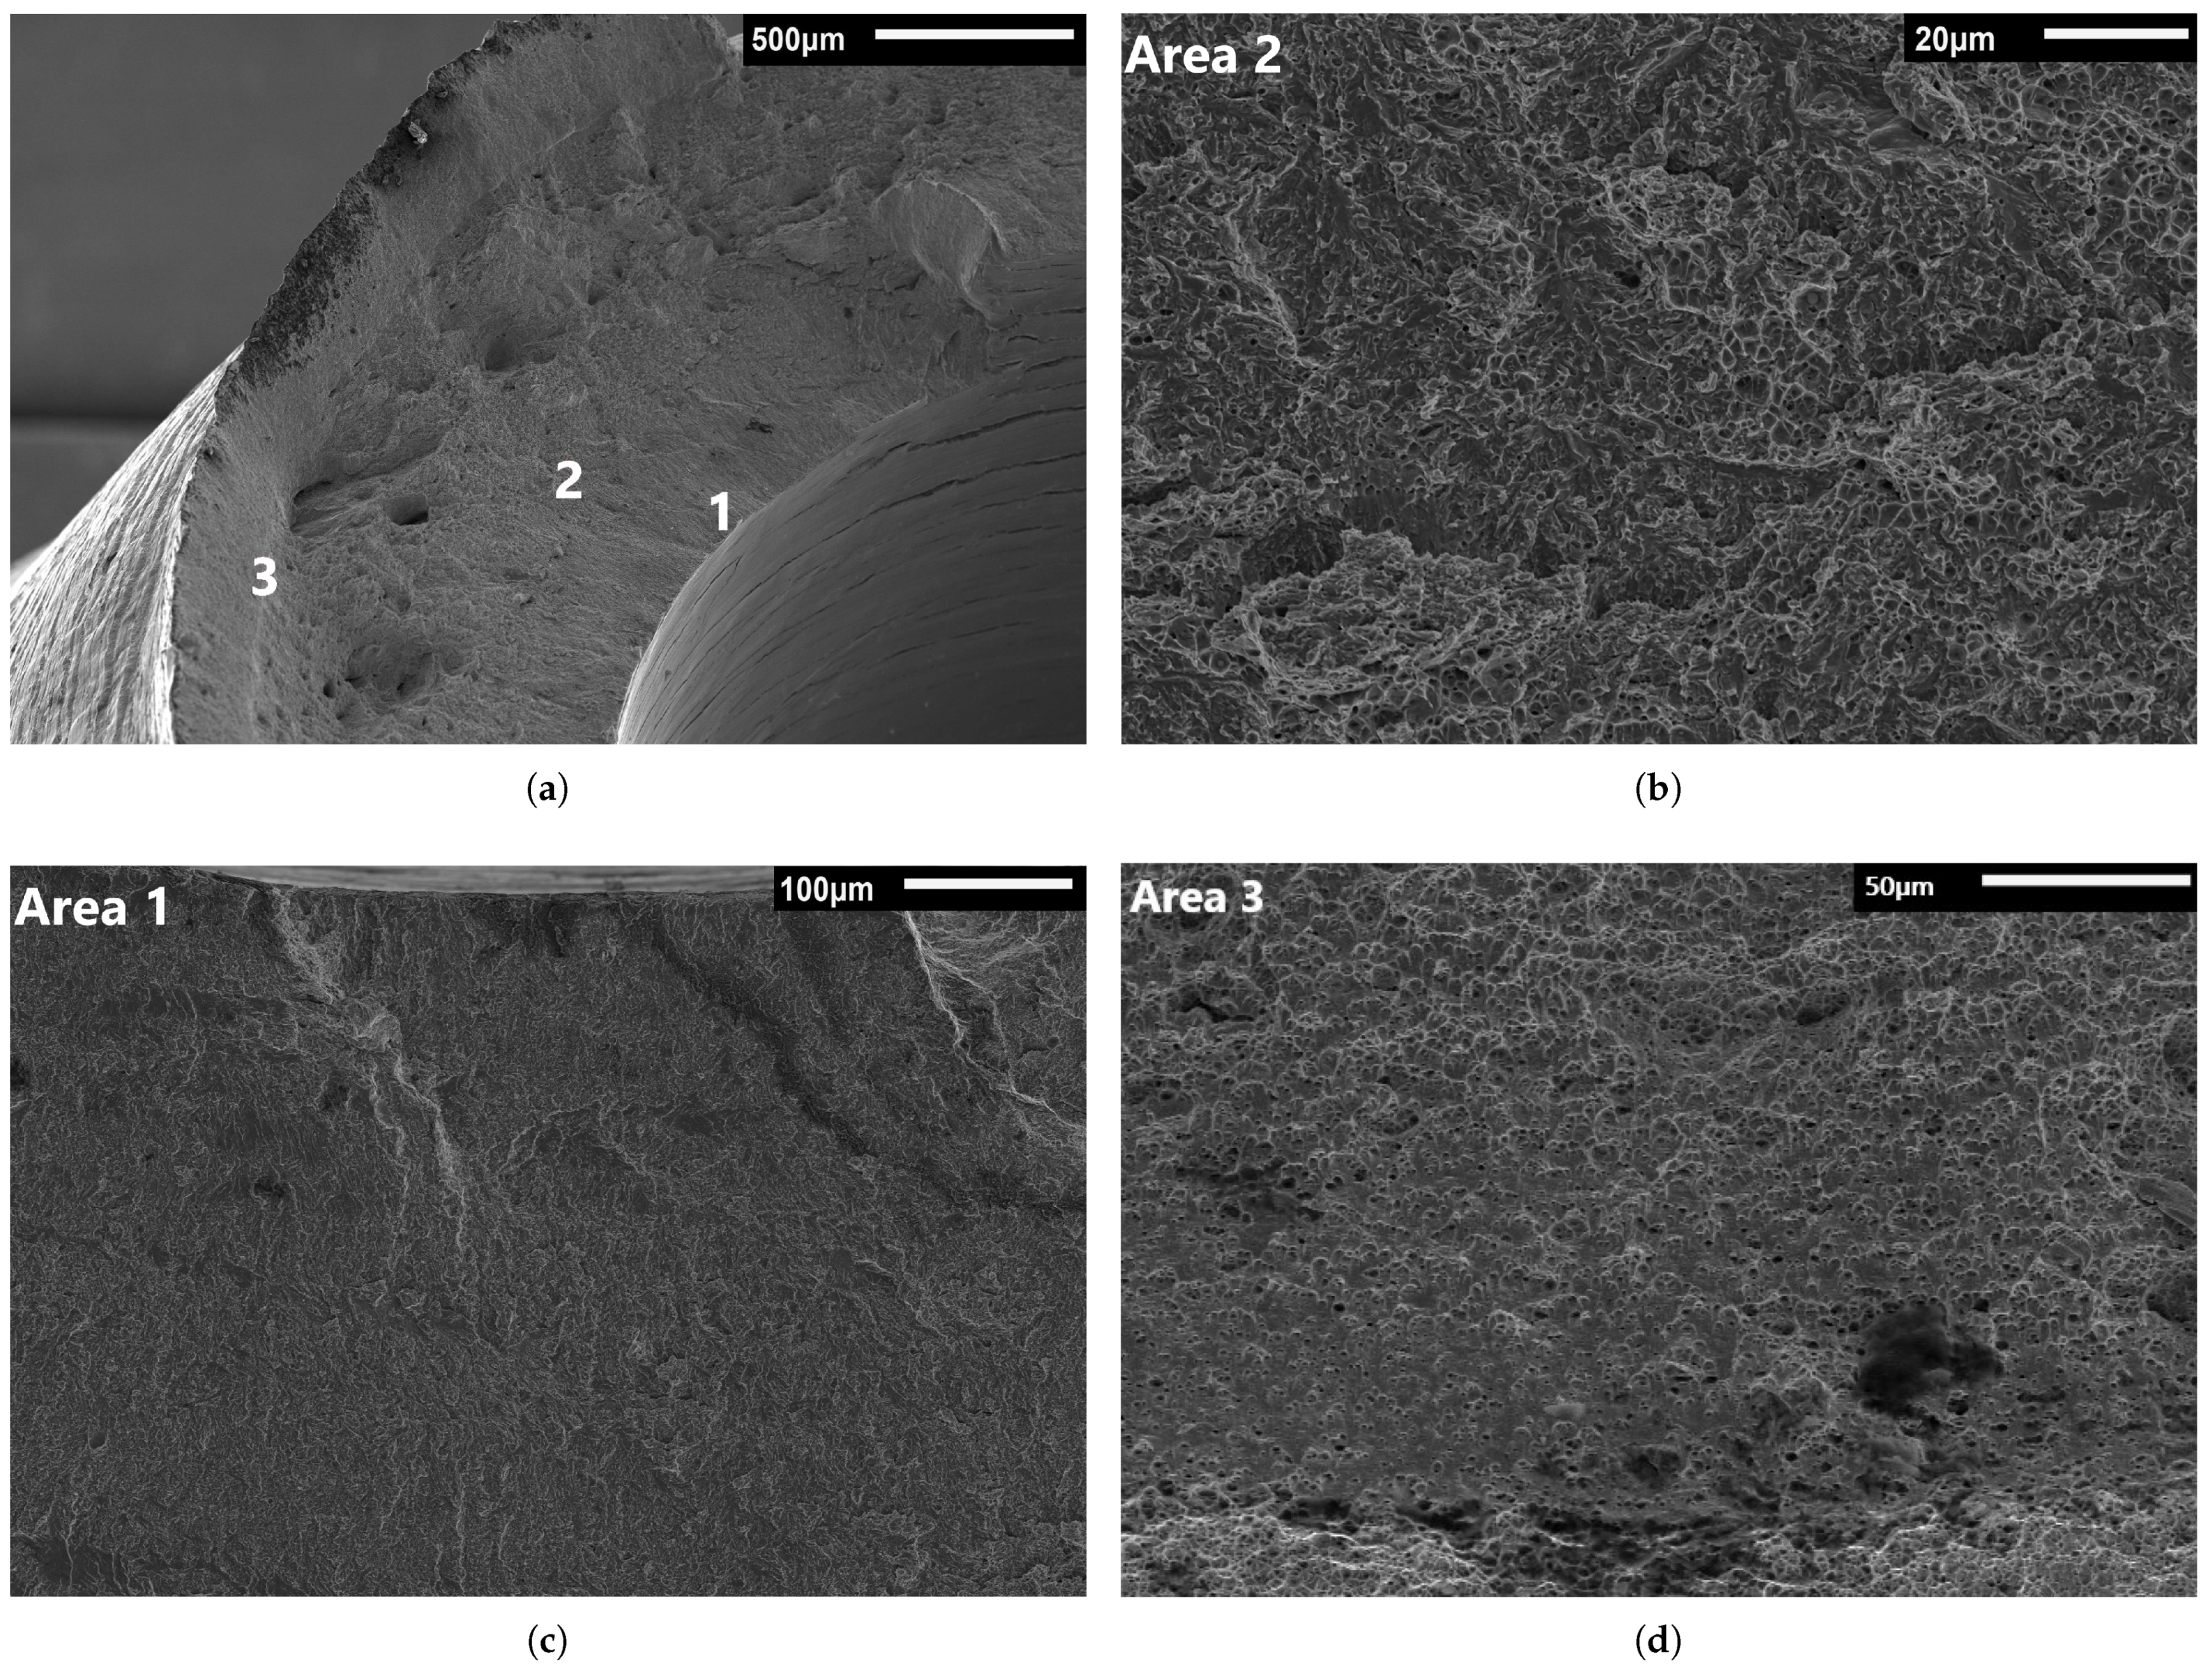
The macroscopic morphology of the WM samples changes in a similar way to the BM metal samples. Ductile cup-cone fracture changes to a flatter fracture surface in samples tested in a hydrogen rather than a nitrogen environment. The difference between the two metals is that the weld specimen fracture surfaces undergo a change from HE related QC fracture toward ductile shear failure during the fracture propagation process. This is shown in Figure 10a. The inside of the specimen fracture surface behaves like the BM samples, and these regions show the QC fracture mode. Near the outside, shear failure takes over and microvoids can be observed. Larger voids can also be observed, which might originate as lack of fusion defects in the weld before testing. Furthermore, a transition zone exists on the surfaces of all weld specimens in between the QC and MVC regions that has a morphology of mixed features such as shown in Figure 10b. The quasi-cleavage mode also contains voids in the weld specimens that originate from ductile failure mechanisms. The size of the QC fracture zone does not change significantly between specimens tested at different H2 pressures, which supports the similar findings for the %RA values at different test pressures.

3.4. Comparison between Base Metal and Weld Metal Susceptibility

The BM and WM behave differently in the hydrogen environment in which they were tested in this research. From the I values, it was observed that the WM is significantly less susceptible to HE in this environment than the BM, even though both were observed to fracture according to the same mechanisms in SEM fractography. The high resistance of an acicular ferrite microstructure to HE compared to a ferritic structure was previously noted by Park et al. who argued that the high toughness of the acicular ferrite phase impedes crack propagation [21]. The difference might also be explained by the difference in grain size and structure between the two metals. The WM has a significantly more refined microstructure and as such a much higher grain boundary density. Grain boundaries have been characterised in the literature as having a range of trap densities [49,50] which inhibit the diffusion of hydrogen towards crack tips. The crack will advance slowly at the beginning of fracture and increase in speed as the crack grows longer. A metal with a lower availability of diffusible hydrogen like the WM will therefore require slower crack growth to accumulate enough hydrogen at the crack tip to cause QC fracture. If the crack outgrows this required speed, the fracture mechanism will revert back to ductile fracture as was observed in Figure 10a.

4. Recommendations

One specific combination of specimen geometry and test type was used in this research to demonstrate the test setup. However, changes to the specimen geometry and test parameters can lead to other interesting results. The results in this work show that both metals are only susceptible to HE at high amounts of plastic strain, at a strain rate of approximately 10 5 /s. This range of plastic strain is usually not reached in gas pipelines, though lower strain rates may be possible. Two factors that were not addressed in this research are the importance of fatigue fracture in pipeline engineering, and the presence of sharper stress concentrations like weld defects that can be present in pipelines. Hydrogen has been shown to have a substantial detrimental effect on both crack initiation and growth in fatigue loading [51,52,53], which are especially relevant in used natural gas pipelines where other than weld defects, existing fatigue cracks can be present. The method used here, however, provides a good framework for assessing pipeline specimens under gaseous hydrogen loading. The notch geometry could be altered as a separate parameter to research the effect of notches on HE susceptibility of steels. Furthermore, sharp crack geometries in combination with cyclic loading tests could lead to interesting insights into fatigue behaviour of steels and weldments in a hydrogen environment.

5. Conclusions

This work focused on the development of a tensile test setup featuring hollow steel specimens loaded internally with pressurised gas. The test setup was utilised to characterise the hydrogen embrittlement (HE) behaviour of X60 pipeline steel and its girth weld. Several conclusions can be drawn from this research.
1.
The test setup is capable of loading steels with hydrogen by exposing them to a constant pressure of hydrogen gas for an extended duration. By releasing just 6 ml of pressurised gas upon fracture of the sample, steel specimens can be safely laboratory tested until failure.
2.
The test setup allows for characterisation of the HE susceptibility of specific regions of a material by selective notching, which was demonstrated here with the weld zone.
3.
Both API 5L X60 pipeline steel and its girth weld were found to be susceptible to HE at 100 barg of H2 pressure and plastic strains exceeding 15%. This was supported by fractographic analysis showing the emergence of the quasi-cleavage (QC) fracture mode which is characteristic for steels embrittled by hydrogen. The strength of all specimens remained unaffected.
4.
The WM was less susceptible to HE because of its refined microstructure and resulting high grain boundary density, showing an embrittlement index I of 11% compared to 28% for the BM. The extent of embrittlement in the WM was unaffected by a change in H2 pressure from 30 to 100 barg.

Author Contributions

Conceptualization, T.B., T.R., E.R., V.P. and C.L.W.; Investigation, T.B.; Supervision, V.P., C.L.W. and P.L.; Writing—original draft preparation, T.B.; Review and editing, V.P., C.L.W., E.R., T.R. All authors have read and agreed to the published version of the manuscript.

Funding

This research received no external funding.

Acknowledgments

The authors would like to thank Intecsea for making this research possible by sharing their relevant knowledge on pipeline design.

Conflicts of Interest

The authors declare no conflict of interest.

References

  1. European Commission. The European Green Deal; European Commission: Brussels, Belgium, 2019. [Google Scholar]
  2. Maroufmashat, A.; Fowler, M. Transition of future energy system infrastructure; through power-to-gas pathways. Energies 2017, 10, 1089. [Google Scholar] [CrossRef] [Green Version]
  3. Song, E.J.; Baek, S.W.; Nahm, S.H.; Baek, U.B. Notched-tensile properties under high-pressure gaseous hydrogen: Comparison of pipeline steel X70 and austenitic stainless type 304 L, 316 L steels. Int. J. Hydrog. Energy 2017, 42, 8075–8082. [Google Scholar] [CrossRef]
  4. Nanninga, N.; Levy, Y.; Drexler, E.; Condon, R.; Stevenson, A.; Slifka, A. Comparison of hydrogen embrittlement in three pipeline steels in high pressure gaseous hydrogen environments. Corros. Sci. 2012, 59, 1–9. [Google Scholar] [CrossRef]
  5. Briottet, L.; Batisse, R.; de Dinechin, G.; Langlois, P.; Thiers, L. Recommendations on X80 steel for the design of hydrogen gas transmission pipelines. Int. J. Hydrog. Energy 2012, 37, 9423–9430. [Google Scholar] [CrossRef]
  6. Depover, T.; Vercruysse, F.; Elmahdy, A.; Verleysen, P.; Verbeken, K. Evaluation of the hydrogen embrittlement susceptibility in DP steel under static and dynamic tensile conditions. Int. J. Impact Eng. 2019, 123, 118–125. [Google Scholar] [CrossRef]
  7. Djukic, M.B.; Sijacki Zeravcic, V.; Bakic, G.M.; Sedmak, A.; Rajicic, B. Hydrogen damage of steels: A case study and hydrogen embrittlement model. Eng. Fail. Anal. 2015, 58, 485–498. [Google Scholar] [CrossRef]
  8. Djukic, M.; Zeravcic, V.S.; Bakic, G.; Sedmak, A.; Rajicic, B. Hydrogen Embrittlement of Low Carbon Structural Steel. Procedia Mater. Sci. 2014, 3, 1167–1172. [Google Scholar] [CrossRef] [Green Version]
  9. Djukic, M.B.; Bakic, G.M.; Zeravcic, V.S.; Sedmak, A.; Rajicic, B. Hydrogen embrittlement of industrial components: Prediction, prevention, and models. Corrosion 2016, 72, 943–961. [Google Scholar] [CrossRef]
  10. Wang, M.; Akiyama, E.; Tsuzaki, K. Crosshead speed dependence of the notch tensile strength of a high strength steel in the presence of hydrogen. Scr. Mater. 2005, 53, 713–718. [Google Scholar] [CrossRef]
  11. Moro, I.; Briottet, L.; Lemoine, P.; Andrieu, E.; Blanc, C.; Odemer, G. Hydrogen embrittlement susceptibility of a high strength steel X80. Mater. Sci. Eng. A 2010, 527, 7252–7260. [Google Scholar] [CrossRef] [Green Version]
  12. Zhao, Y.; Seok, M.Y.; Choi, I.C.; Lee, Y.H.; Park, S.J.; Ramamurty, U.; Suh, J.Y.; Jang, J.I. The role of hydrogen in hardening/softening steel: Influence of the charging process. Scr. Mater. 2015, 107, 46–49. [Google Scholar] [CrossRef]
  13. Rahman, K.M.; Mohtadi-Bonab, M.A.; Ouellet, R.; Szpunar, J. A Comparative Study of the Role of Hydrogen on Degradation of the Mechanical Properties of API X60, X60SS, and X70 Pipeline Steels. Steel Res. Int. 2019, 90, 1900078. [Google Scholar] [CrossRef]
  14. Liang, P.; Li, X.; Du, C.; Chen, X. Stress corrosion cracking of X80 pipeline steel in simulated alkaline soil solution. Mater. Des. 2009, 30, 1712–1717. [Google Scholar] [CrossRef]
  15. Mohtadi-Bonab, M.; Szpunar, J.; Razavi-Tousi, S. A comparative study of hydrogen induced cracking behavior in API 5L X60 and X70 pipeline steels. Eng. Fail. Anal. 2013, 33, 163–175. [Google Scholar] [CrossRef]
  16. Huang, F.; Liu, J.; Deng, Z.J.; Cheng, J.H.; Lu, Z.H.; Li, X.G. Effect of microstructure and inclusions on hydrogen induced cracking susceptibility and hydrogen trapping efficiency of X120 pipeline steel. Mater. Sci. Eng. A 2010, 527, 6997–7001. [Google Scholar] [CrossRef]
  17. Mohtadi-Bonab, M.A.; Szpunar, J.A.; Collins, L.; Stankievech, R. Evaluation of hydrogen induced cracking behavior of API X70 pipeline steel at different heat treatments. Int. J. Hydrog. Energy 2014, 39, 6076–6088. [Google Scholar] [CrossRef]
  18. Sieverts, A. Die aufnahme von gasen durch metalle. Z. Met. 1929, 21, 37–46. [Google Scholar]
  19. Hirth, J.P. Effects of hydrogen on the properties of iron and steel. Metall. Trans. A 1980, 11, 861–890. [Google Scholar] [CrossRef]
  20. Pérez Escobar, D.; Wallaert, E.; Duprez, L.; Atrens, A.; Verbeken, K. Thermal desorption spectroscopy study of the interaction of hydrogen with TiC precipitates. Met. Mater. Int. 2013, 19, 741–748. [Google Scholar] [CrossRef]
  21. Park, G.T.; Koh, S.U.; Jung, H.G.; Kim, K.Y. Effect of microstructure on the hydrogen trapping efficiency and hydrogen induced cracking of linepipe steel. Corros. Sci. 2008, 50, 1865–1871. [Google Scholar] [CrossRef]
  22. ASTM. ASTM G142-98 Standard Test Method for Determination of Susceptibility of Metals to Embrittlement in Hydrogen Containing Environments at High Pressure, High Temperature, or Both; ASTM International: West Conshohocken, PA, USA, 2016; Volume 03.02, pp. 1–8. [Google Scholar]
  23. ASTM. ASTM G129-00 Standard Practice for Slow Strain Rate Testing to Evaluate the Susceptibility of Metallic Materials to Environmentally Assisted Cracking 1; ASTM International: West Conshohocken, PA, USA, 2013; Volume 03.02, pp. 1–7. [Google Scholar]
  24. ASTM. ASTM F1624-12 Standard Test Method for Measurement of Hydrogen Embrittlement Threshold in Steel by the Incremental Step Loading Technique; ASTM International: West Conshohocken, PA, USA, 2018; Volume 15.02, pp. 1–12. [Google Scholar]
  25. Wang, M.; Akiyama, E.; Tsuzaki, K. Effect of hydrogen on the fracture behavior of high strength steel during slow strain rate test. Corros. Sci. 2007, 49, 4081–4097. [Google Scholar] [CrossRef]
  26. Drexler, A.; Bergmann, C.; Manke, G.; Kokotin, V.; Mraczek, K.; Pohl, M.; Ecker, W. On the local evaluation of the hydrogen susceptibility of cold-formed and heat treated advanced high strength steel (AHSS) sheets. Mater. Sci. Eng. A 2021, 800, 140276. [Google Scholar] [CrossRef]
  27. Michler, T.; Naumann, J.; Sattler, E. Influence of high pressure gaseous hydrogen on S–N fatigue in two austenitic stainless steels. Int. J. Fatigue 2013, 51, 1–7. [Google Scholar] [CrossRef]
  28. Novak, P.; Yuan, R.; Somerday, B.; Sofronis, P.; Ritchie, R. A statistical, physical-based, micro-mechanical model of hydrogen-induced intergranular fracture in steel. J. Mech. Phys. Solids 2010, 58, 206–226. [Google Scholar] [CrossRef]
  29. Ronevich, J.A.; Somerday, B.P. Assessing gaseous hydrogen assisted fatigue crack growth susceptibility of pipeline steel weld fusion zones and heat affected zones. Mater. Perform. Charact. 2016, 5, 290–304. [Google Scholar] [CrossRef]
  30. Capelle, J.; Gilgert, J.; Dmytrakh, I.; Pluvinage, G. Sensitivity of pipelines with steel API X52 to hydrogen embrittlement. Int. J. Hydrog. Energy 2008, 33, 7630–7641. [Google Scholar] [CrossRef]
  31. Chandler, W.; Walter, R. Testing to determine the effect of high-pressure hydrogen environments on the mechanical properties of metals. In Hydrogen Embrittlement Testing; ASTM International: West Conshohocken, PA, USA, 1974; pp. 178–179. [Google Scholar]
  32. Ogata, T. Evaluation of hydrogen embrittlement by internal high-pressure hydrogen environment in specimen. J. Jpn. Inst. Met. 2008, 72, 125–131. [Google Scholar] [CrossRef] [Green Version]
  33. Ogata, T. Hydrogen environment embrittlement evaluation in fatigue properties of stainless steel SUS304L at cryogenic temperatures. In Proceedings of the AIP Conference Proceedings, Tucson, AZ, USA, 28 June–2 July 2009; American Institute of Physics: Danvers, MA, USA, 2010; Volume 1219, pp. 25–32. [Google Scholar]
  34. Ogata, T. Influence of high pressure hydrogen environment on tensile and fatigue properties of stainless steels at low temperatures. In Proceedings of the AIP Conference Proceedings, Spokane, WA, USA, 13–17 June 2011; American Institute of Physics: Danvers, MA, USA, 2012; Volume 1435, pp. 39–46. [Google Scholar]
  35. Ogata, T. Influence of 70 MPa Hydrogen Gas on SUS 630 From 77 K to 373 K by Simple Testing Method. In Proceedings of the Pressure Vessels and Piping Conference, Volume 6B: Materials and Fabrication, Prague, Czech Republic, 15–20 July; American Society of Mechanical Engineers: New York, NY, USA, 2018. [Google Scholar]
  36. Chen, W.; Spätig, P.; Seifert, H.P. Fatigue behavior of 316L austenitic stainless steel in air and LWR environment with and without mean stress. Matec Web Conf. 2018, 165, 03012. [Google Scholar] [CrossRef]
  37. Kogut, N.; Pan’ko, I. Use of a tubular sample for determination of the crack resistance of the material of pressure vessels and weld joints. Sov. Mater. Sci. 1984, 20, 55–59. [Google Scholar] [CrossRef]
  38. European Commission. Pressure Energy Directive. DIRECTIVE 2014/68/EU of the EUropean Parliament and of the Council of 15 May 2014 on the Harmonisation of the Laws of the Member States Relating to the Making Available on the Market of Pressure Equipment; European Commission: Brussels, Belgium, 2014. [Google Scholar]
  39. Boot, T.; Riemslag, T.; Reinton, E.; Liu, P.; Walters, C.L.; Popovich, V. Assessing the susceptibility of existing pipelines to Hydrogen Embrittlement. In Proceedings of the Minerals, Metals & Materials Society (eds) TMS 2021 150th Annual Meeting & Exhibition, Orlando, FL, USA, 15–18 March; Springer: Cham, Switzerland, 2021. [Google Scholar]
  40. Lufrano, J.; Sofronis, P. Enhanced hydrogen concentrations ahead of rounded notches and cracks—Competition between plastic strain and hydrostatic stress. Acta Mater. 1998, 46, 1519–1526. [Google Scholar] [CrossRef]
  41. Najam, H.; Koyama, M.; Bal, B.; Akiyama, E.; Tsuzaki, K. Strain rate and hydrogen effects on crack growth from a notch in a Fe-high-Mn steel containing 1.1 wt% solute carbon. Int. J. Hydrog. Energy 2020, 45, 1125–1139. [Google Scholar] [CrossRef]
  42. Panico, M.; Baker, D.; Nawathe, S.; Bahrami, A.; Fairchild, D. Effect of testing variables on fracture toughness in sour environment. Proc. Int. Offshore Polar Eng. Conf. 2015, 25, 134–139. [Google Scholar]
  43. Nagumo, M. Hydrogen related failure of steels—A new aspect. Mater. Sci. Technol. 2004, 20, 940–950. [Google Scholar] [CrossRef]
  44. McLellan, R.B.; Xu, Z.R. Hydrogen-induced vacancies in the iron lattice. Scr. Mater. 1997, 36. [Google Scholar] [CrossRef]
  45. Martin, M.L.; Fenske, J.A.; Liu, G.S.; Sofronis, P.; Robertson, I.M. On the formation and nature of quasi-cleavage fracture surfaces in hydrogen embrittled steels. Acta Mater. 2011, 59, 1601–1606. [Google Scholar] [CrossRef]
  46. Merson, E.D.; Myagkikh, P.N.; Poluyanov, V.A.; Merson, D.L.; Vinogradov, A. Quasi-cleavage hydrogen-assisted cracking path investigation by fractographic and side surface observations. Eng. Fract. Mech. 2019, 214, 177–193. [Google Scholar] [CrossRef]
  47. Liu, H.; Hamada, S.; Koyama, M.; Noguchi, H. Distinguishing geometric and metallurgic hydrogen-embrittlement susceptibilities in pre-cracked structures made of interstitial-free steel under monotonic tension. Theor. Appl. Fract. Mech. 2020, 108, 102574. [Google Scholar] [CrossRef]
  48. Liu, Q.; Zhou, Q.; Venezuela, J.; Zhang, M.; Atrens, A. Hydrogen influence on some advanced high-strength steels. Corros. Sci. 2017, 125, 114–138. [Google Scholar] [CrossRef]
  49. Maroef, I.; Olson, D.L.; Eberhart, M.; Edwards, G.R. Hydrogen trapping in ferritic steel weld metal. Int. Mater. Rev. 2002, 47, 191–223. [Google Scholar] [CrossRef]
  50. Rivera, P.C.; Ramunni, V.; Bruzzoni, P. Hydrogen trapping in an API 5L X60 steel. Corros. Sci. 2012, 54, 106–118. [Google Scholar] [CrossRef]
  51. Drexler, E.S.; Slifka, A.J.; Amaro, R.L.; Barbosa, N.; Lauria, D.S.; Hayden, L.E.; Stalheim, D.G. Fatigue crack growth rates of API X70 pipeline steel in a pressurized hydrogen gas environment. Fatigue Fract. Eng. Mater. Struct. 2014, 37, 517–525. [Google Scholar] [CrossRef]
  52. Briottet, L.; Moro, I.; Escot, M.; Furtado, J.; Bortot, P.; Tamponi, G.M.; Solin, J.; Odemer, G.; Blanc, C.; Andrieu, E. Fatigue crack initiation and growth in a CrMo steel under hydrogen pressure. Int. J. Hydrog. Energy 2015, 40, 17021–17030. [Google Scholar] [CrossRef] [Green Version]
  53. An, T.; Peng, H.; Bai, P.; Zheng, S.; Wen, X.; Zhang, L. Influence of hydrogen pressure on fatigue properties of X80 pipeline steel. Int. J. Hydrog. Energy 2017, 42, 15669–15678. [Google Scholar] [CrossRef]
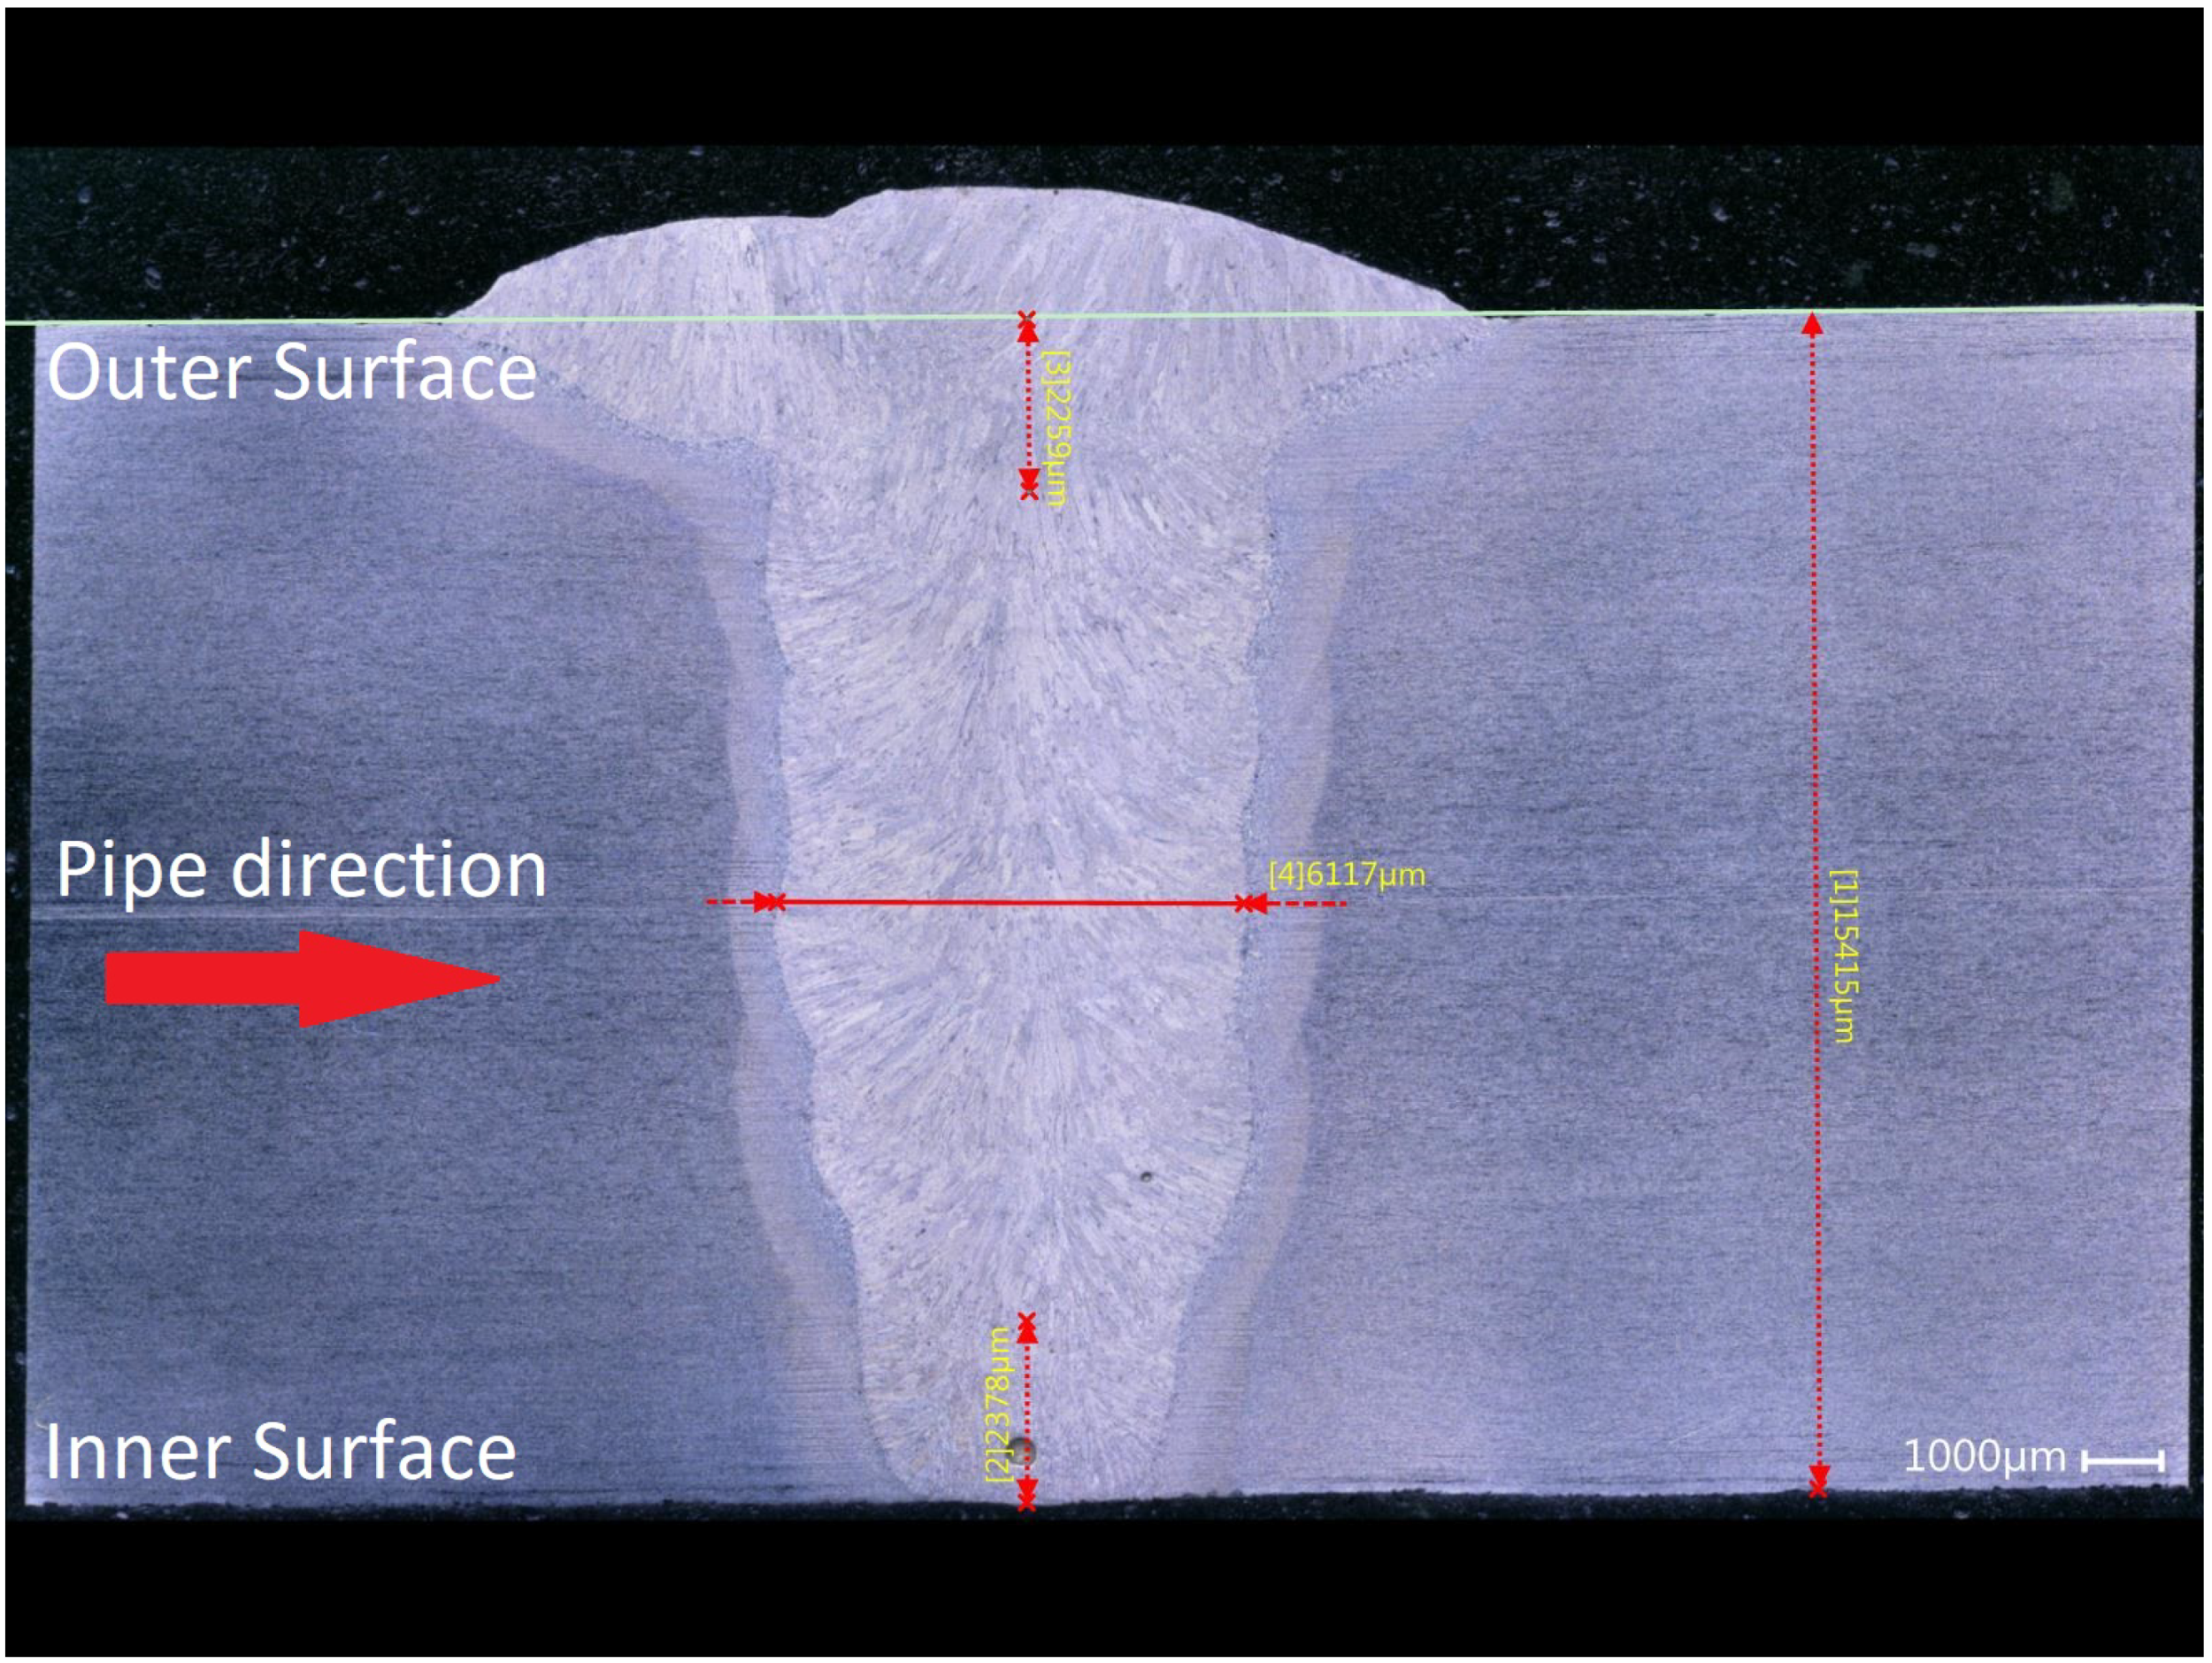
Figure 1. Weld macro overview of the girth weld including measurements of the wall thickness, weld thickness and thicknesses of the first and last weld passes.
Metals 11 01242 g001
Figure 2. (a) Microstructure of the base metal (BM) consisting of polygonal ferrite with small pearlite islands (black). (b) Microstructure the weld metal (WM) consisting mainly of acicular ferrite with Widmanstätten ferrite at the prior austenite grain boundaries as indicated.
Metals 11 01242 g002
Figure 3. Technical drawing of the sample geometry. Dimensions are given in mm.
Metals 11 01242 g003
Figure 4. (a) Overview of the specimen and adapters inside the tensile tester. (b) Cross-section of the area outlined in red in (a) displaying the connection between the specimen and the bottom adapter.
Metals 11 01242 g004
Figure 5. The evolution of the hydrogen concentration profile on the notch root plane with time. Equilibrium is reached after approximately 6 h.
Metals 11 01242 g005
Figure 6. An overview of the stress triaxiality distribution in the deformation model around the onset of necking.
Metals 11 01242 g006
Figure 7. (a) SSRT results from representative samples of smooth base metal samples. (b) Results from representative samples of notched base metal samples.
Metals 11 01242 g007
Figure 8. SSRT results from representative samples of each subset of notched weld metal specimens.
Metals 11 01242 g008
Figure 9. SEM Fractographic images of notched base metal samples. (a) Tested in 100 barg N2. (b) Tested in 100 barg H2. (c) Higher magnification image of smooth base metal samples tested without gas. (d) Higher magnification image of smooth base metal samples tested in 100 barg H2. Secondary cracks parallel to the fracture surface are present on the inside surface of the sample in (b), as indicated by the arrow.
Metals 11 01242 g009
Figure 10. SEM Fractographic images of a notched weld metal samples tested in 70 barg H2. (a) Showing the macroscopic fracture morphology. (b) A magnified image of the fracture surface at area 2 as indicated in (a) in the transition zone between quasi-cleavage and microvoid coalescence fracture. (c) An overview of an area equivalent to 1 of the inside wall showing pure quasi-cleavage fracture. (d) An overview of an area equivalent to 3 of the outside wall showing microvoid coalescence fracture.
Metals 11 01242 g010
Table 1. Composition of the base metal and weld metal. Bal is Fe.
ElementCMnSiCrNbAlPSBal
Base Metal0.061.660.260.060.040.04<0.01<0.0197.88
Weld Metal0.071.450.580.050.010.010.010.0197.81
Table 2. Summary of the different subgroups of base metal (BM) and weld metal (WM) specimens. Test pressures are gauge pressures.
GasSmooth BMNotched BMNotched WM
Air0 bargNot testedNot tested
N2100 barg100 barg100 barg
H2100 barg100 barg30, 70, 100 barg
Table 3. %RA and embrittlement index I values for all sample sets. Errors are standard deviation.
Test Matrix and Results
MaterialGeometryPressureGas%RAEmbrittlement Index I [%]
Base metalSmooth0 bargAir75.5 ± 0.60
100 bargN276.6 ± 0.9−1.5 ± 2.1
100 bargH255.2 ± 2.627.9 ± 4.6
Notched100 bargN272.1 ± 1.00
100 bargH252.0 ± 2.028.0 ± 4.7
Weld metalNotched100 bargN248.2 ± 1.50
30 bargH242.9 ± 0.611.0 ± 4.6
70 bargH243.0 ± 0.810.9 ± 5.1
100 bargH243.0 ± 1.810.8 ± 9.8
Publisher’s Note: MDPI stays neutral with regard to jurisdictional claims in published maps and institutional affiliations.