Abstract
Six different particle size distribution (Gates–Gaudin–Schuhmann (GGS), Rosin–Rammler (RR), Lognormal, Normal, Gamma, and Swebrec) models were compared under different metallurgical coke grinding conditions (ball size and grinding time). Adjusted R2, Akaike information criterion (AIC), and the root mean of square error (RMSE) were employed as comparison criteria. Swebrec and RR presented superior comparison criteria with the higher goodness-of-fit and the lower AIC and RMSE, containing the minimum variance values among data. The worst model fitting was GGS, with the poorest comparison criteria and a wider results variation. The undulation Swebrec parameter was ball size and grinding time-dependent, considering greater b values (b > 3) at longer grinding times. The RR α parameter does not exhibit a defined tendency related to grinding conditions, while the k parameter presents smaller values at longer grinding times. Both models depend on metallurgical coke grinding conditions and are hence an indication of the grinding behaviour. Finally, oversize and ultrafine particles are found with ball sizes of 4.0 cm according to grinding time. The ball size of 2.54 cm shows slight changes in particle median diameter over time, while 3.0 cm ball size requires more grinding time to reduce metallurgical coke particles.
1. Introduction
Metallurgical coke is a crucial raw material in the iron and steelmaking industry and is considered a critical raw material in the EU due to its high consumption volume and the strong EU import dependence [1,2,3]. Heat supplier, reducing agent, adequate permeability, and burden mechanical support are the features that render it a fundamental material for blast furnaces that perform metallurgical processes such as cast iron, ferroalloy, lead, and zinc production, and in kilns for lime and magnesium production [4,5]. According to particle size, metallurgical coke is used at different process stages. Coke ranging between 24–40 mm is the main form for blast furnaces; this so-called nut coke is added in ironmaking with ferrous and flux mineral layers from 6 to 24 mm, and coke breeze is considered the energy source for sintering or pelletising with particle size less than 6 mm [6].
Suitable coke selection enhances the steel production line, saves coke utilisation, minimises dust generation, reduces the significant amount of greenhouse gases discharged into the atmosphere, namely, CO2, SO2, and NOx, and optimises energy usage [7,8,9]. Chemical composition, mechanical strength, thermal resistance, and particle size are the most significant parameters for selecting metallurgical coke [6,10]. However, the coke particle size and shape play an essential role in blast furnace and sinter plants. Coke mean particle size determines the fluid flow resistance, the upward gases and downwards metal liquids passing efficiency, and the iron production rate. The coke bed formation and permeability are also strongly related to particle size and combustion behaviour in the sintering process.
Despite the abovementioned importance of coke particle size distribution (PSD), particle size control has not been studied enough. Many fine recycled particles from chipping in crushing processes or waste in the coke oven cause an overproduction of particulate matter and uncontrolled coke size distributions [11,12,13,14,15,16,17,18,19,20,21,22]. Poor coke without quality classification creates disturbances in the sinter plant and the blast furnace operation, producing excess dust, heat losses, inefficient reaction rates, and fluid flow obstruction. This situation has driven environmental regulation to propose eliminating or partially substituting metallurgical coke in sinter production [8,13]. Various studies [14,15,16,17,18,19,20,21,22,23] have evaluated the effect of defined ranges of coke particle size in steelmaking performance as a means of process optimisation. The thickness of combustion zone, flame front, chemical reactions kinetics, and iron-bearing phase formation (hematite, magnetite, and gangue) are broadly affected by coke PSD in sinter and blast furnace plants [15,16,17].
Modelling the metallurgical coke PSD allows quantitatively assessing the breakage behaviour. Several benefits in the iron and steel processes are obtained when the PSD is adequately characterised, with effective diameters (D50, D80) measured, and the effect of its variation on the processes is known. Many models have been developed to predict and describe the PSD of granulated materials. Perfect et al. [24] tested three distribution functions based on two parameters for different fertilisers. Lognormal, Rosin–Rammler and Gate–Gaudin–Schuhmann were fitted by nonlinear regression analysis. According to the goodness-of-fit of R2, they concluded the Rosin–Rammler is the more accurate model to describe material fertiliser. Botula et al. [25] evaluated ten PSD models in soils of the humid tropics. The findings demonstrated that the three and four-parameters Fredlund and three-parameter Weibull and four-parameter Anderson presented an excellent fitting correlation to soils. Bu et al. [26] characterised the coal grinding process (wet and dry ways) using PSD models, namely, GGS, Gaudin–Meloy, RR, modified RR, and Swebrec. They found that the RR and Swebrec showed outstanding fitting performance.
The current paper compares GGS, RR, Gamma, Normal, Lognormal, and Swebrec distributions at different metallurgical coke grinding conditions to select the best fitting models and represent the metallurgical coke PSD. Finally, the association of PSD model parameters with the grinding process was analysed for the best two models.
2. Materials and Methods
A metallurgical coke sample from Boyacá (Colombia) was used in the grinding process. The original sample was crushed in a roll mill (Denver Equipment Co., Denver, CO, USA) and sieved 100% under six mesh (3.35 mm). Product PSD is depicted in Figure 1, and the elemental and proximate analyses are shown in Table 1. A dataset of 144 PSD was collected from grinding under different dry conditions. Grinding tests were carried out in a laboratory steel ball mill with 0.20 m in diameter and 0.20 m long. Three ball sizes (2.54, 3.00, and 4.00 cm) and eight grinding times (0.5, 1, 2, 3, 4, 5, 6, and 10 min) were used to evaluate the product PSD. The operational mill conditions remained fixed: the fraction of critical speed (φc) was 0.75; the ball filling fraction (J) was 0.3; the fraction of powder bed (fc) and void filling (U) were 0.12 and 1, respectively.
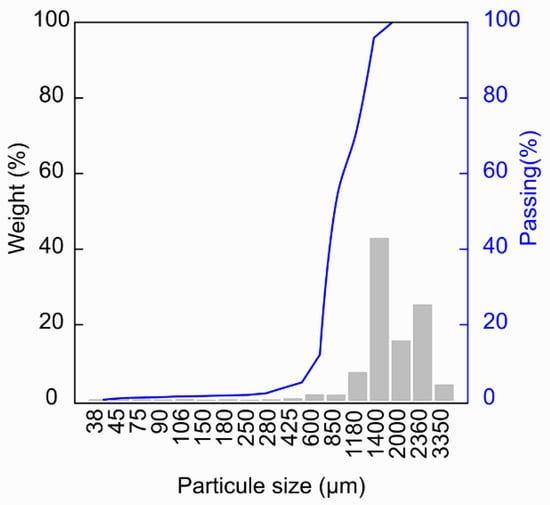
Figure 1.
Metallurgical coke PSD in the feed to the ball mill.

Table 1.
Metallurgical coke composition analysis (%).
The six PSD models assessed are shown in Table 2. Gate–Gaudin–Schuhmann [27] and Rosin–Rammler [28] models have been the most popular and oldest functions used to describe PSD in granular materials. GGS was developed in the metalliferous mining industry and is described with a size parameter (largest particle size) and a distribution parameter [27]. The RR model was defined to evaluate the coal fragmentation processes but has been broadly used in many industries. The RR size parameter corresponds to 63.21% cumulative undersize, and the shape parameter defines the spread of sizes [28]. Even though these are handy models, the fitting accuracy depends on the material nature and size ranges.
Table 2.
Particle size distribution models.
A short description of the most common powder PSD models is presented below. The Gamma distribution [29,30] presents two functional parameters related to the median and standard deviation. Yang et al. [29] compared the PSD prediction between Gamma and other models, obtaining the Gamma distribution as the best fit. Normal and Lognormal are also two-parameter models, using the mean diameter (logarithmic mean if Lognormal) and the standard deviation. According to Buchan [31], the Lognormal is more suitable in describing PSD in soils.
The three-parameter Weibull distribution is defined by fitting, size, and shape parameters. Esmaeelnejad et al. [32] compared different models to describe soil PSD, concluding that the Weibull model was the most accurate for all samples studied. Another three-parameter distribution is the Swebrec distribution, introduced by Ouchterlony [33] to predict PSD by rock blasting and crushing fragmentation. The parameters are the maximum size xmax, the size with 50% cumulative undersize x50 and the undulation parameter b. In the work of Osorio et al. [34], the Swebrec model was evaluated in the wet grinding process of quartz ore, obtaining an excellent fitting adjustment. Menéndez-Aguado et al. [35] presented the Swebrec distribution to fit sediment particle size distribution with a high correlation between experimental and model data.
In this study, the model comparison was carried out using three statistical indices. The adjusted R2 (Equation (1)) measures the discrepancy between predicted and observed data [36]. Akaike’s information criterion (Equation (2)) examines the model goodness-of-fit imposing penalties for additional fitting parameters [37]. Finally, the mean root of squared error (RMSE) presented in Equation 3 is the residual error, i.e., the information not contained in the model. The criteria selected are widely used in PSD model selection and in assessing model prediction [25,29,32,36]. The adjusted R2 is a traditional goodness-of-fit measurement, but it is mainly considered in linear models’ interpretation. Additionally, to assure the model selection, RMSE and AIC were used. These criteria are more appropriate to measure the goodness-of-fit in nonlinear models [28,38].
where RSS is the residual sum of squares, N is the number of PSD data points, P is the number of independent variables in a particle size distribution model, and TSS is the total sum of squares.
A custom Python script was employed in the fitting procedure, which is provided in the Supplementary Material. All models were compared with the experimental PSD data using the least-squares method to find the best fitting parameters, and the model presenting the best values of the three statistics were selected. The least-squares procedure was obtained considering a nonlinear optimisation method, and the residual sum of squares is calculated with the minimisation function established in Equation (4).
where Pi,measured and Pi,predicted represent experimental and model cumulative passing material, respectively. Box plots were employed as graphical representation to provide more insights into the different behaviour of PSD models. Finally, metallurgical coke’s more stable grinding conditions are defined using a colour map graph about the two best model parameters.
3. Results
3.1. Comparison of PSD Models’ Goodness-of-Fit
Figure 2 depicts the Box plots of statistical indices. The model with the better goodness-of-fit was obtained under descriptive statistics (see Table S1) considering the higher adjusted R2, the smaller RMSE and lower AIC. The adjusted R2 (Figure 2a and Figure S1) provides values greater than 0.95 in all models, excluding the GGS distribution, which produced adjustments less than 0.8. The Schuhmann distribution data are widely spread out from the mean with the larger standard deviation, as depicted in the Box plot. Lognormal and Normal models explain completely well the experimental PSD with adjustments varying between 0.95–0.99. However, the Lognormal model adjusted slightly better than Normal model due to the great fitting in 4.00 cm grinding media. Gamma, Rosin-Rammler, and Swebrec exhibit values close to 1.0 and relatively narrow dispersion data; therefore, they were considered the models with superior fitting performance, providing an excellent PSD prediction for the material.
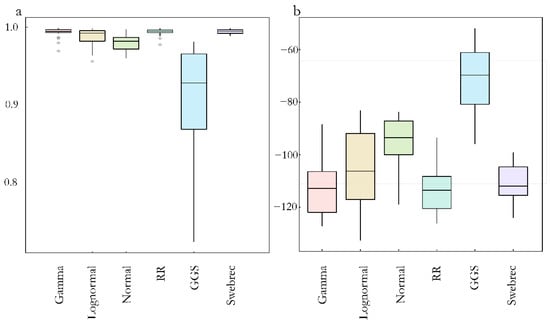
Figure 2.
Box plots to compare the particle size models: (a) Adjusted R2 and (b) Akaike’s information criterion.
Akaike’s information criteria (AIC) Box plot is shown in Figure 2b. It was used to compare the model quality fit and identify the better fitting model, for an increment in goodness-of-fit requires lower AIC values. The AIC results were consistent with R2 and RMSE estimations, achieving minimum values in Gamma, Rosin–Rammler, and Swebrec distributions. However, the Swebrec model presented the least standard deviation. Lognormal and GGS models depicted poor fits with large mean and standard deviation values about AIC estimator.
Figure 3 summarises the models’ criteria in a normalised bar chart. There are three bars (adjusted R2, AIC, and RMSE) for each distribution, representing the fitting results. GGS and Normal exhibit the larger RMSE values, while Lognormal function shows great AIC values. In addition, GGS presents the lowest adjusted R2 and larger AIC (the closer this criterion to one, the smaller its actual value). Gamma, RR and Swebrec distributions illustrate the better value points according to the three selected criteria, indicating the excellent correspondence between model prediction values and observed data. Though AIC penalised the model with additional parameters, the Swebrec model, which has three independent variables, is among the better-fitting functions.
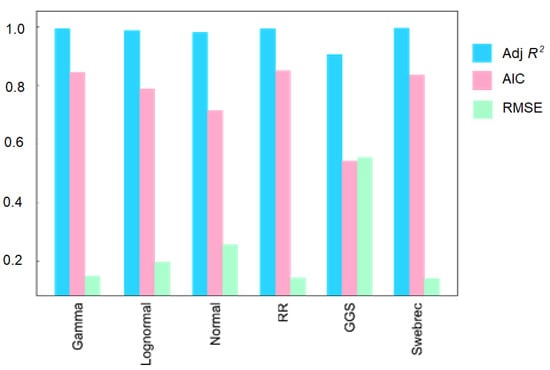
Figure 3.
Normalised bar chart of estimator’s values for each evaluated model.
3.2. Models’ Prediction Ability in Grinding Conditions
Figure 4 shows the PSD obtained (experimental and fitted) after different grinding times in the laboratory ball mill, with 3.00 cm in diameter grinding media balls. The same behaviour was observed in the case of 2.54 cm and 4.00 cm ball diameter (See Supplementary Material, Figures S2 and S3). The GGS model shows a more significant deviation under all the evaluated grinding conditions. After one minute’s grinding, the predicted value deviates from the experimental value. This model considers a linear relationship between cumulative fraction and the particle diameter in the log-log scale, where the slope is the α parameter, which does not describe the experimental metallurgical coke grinding product. Normal and Lognormal distributions exhibit, in general, high goodness-of-fit. However, as Normal PSD illustrates, the predicted results decrease at a longer grinding time and smaller grinding media diameter. The Lognormal shows excellent fitting at grinding times over 3 min with all ball sizes, especially with grinding media of 4.00 cm. The curve fitting performance of Gamma, RR, and Swebrec are highly recommended for metallurgical coke grinding products in all evaluated scenarios with an adjusted R2 range between 0.98–1.0. Model parameter prediction ability for the three abovementioned models were suited correctly with the ball size and grinding time values studied.
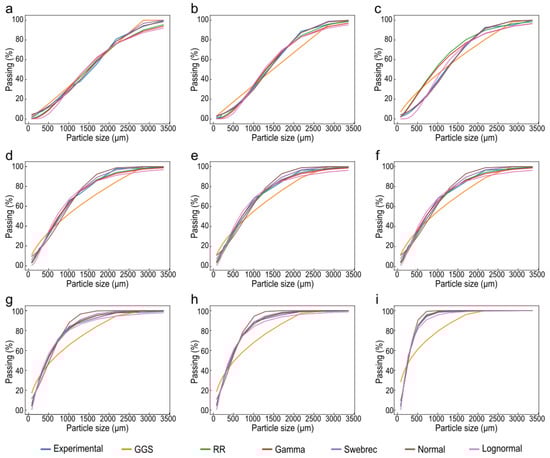
Figure 4.
Cumulative distribution functions with 3.0 cm ball size at different grinding times: (a) 0 min; (b) 0.5 min; (c) 1 min; (d) 2 min; (e) 3 min; (f) 4 min; (g) 5 min; (h) 6 min; (i) 10 min.
3.3. Distribution Parameters’ Assessment
In light of the above results, Swebrec and RR models were selected to assess the distribution parameters under different grinding conditions. Figure 5a depicts a rise in the undulation parameter b as grinding time increases. Comparing the b parameter variation with different grinding media is relatively stable until 3 min, after which superior b values (b > 3) are achieved for all ball sizes. Smaller undulation parameters are obtained with 2.54 cm ball diameter and the larger ones with 4.00 cm diameter. This situation can be associated with the ball energy delivery at grinding time under 3 min; the x50 (see Figure 5b) remains directly related to the ball size, with the x50 at 2.54 cm being smaller than the x50 at 4.00 cm. The undulation parameter can indicate a change in fracture behaviour, ranging from normal breakage at a shorter time and smaller grinding media, passing by chipping, and finally, achieving material pulverisation at a longer time and larger ball diameter.
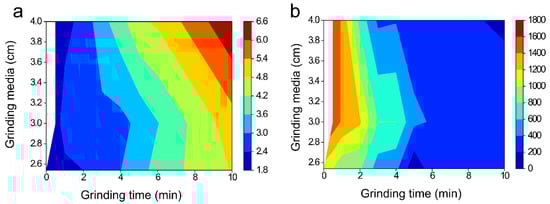
Figure 5.
Swebrec parameters’ variation under different grinding conditions: (a) b, undulation parameter and (b) x50 parameter.
The λ and k RR parameters are illustrated in Figure 6. The particular behaviour of the shape parameter λ (Figure 6a) between 0 to 8 min grinding time is evidenced. The smaller parameter value, linked with the larger fines quantity, is formed using the ball size range 2.54–3.00 cm. A widening is noticed at grinding times shorter than 2 min, with 3.00 and 4.00 cm ball sizes. Scale parameter k (Figure 6b) presents smaller values at longer grinding times. The value increases from 2.54 to 3.00 cm, decreasing afterwards to 4.00 cm ball size. Larger ball sizes (3.00 and 4.00 cm) lead to greater k values’ variation with the grinding time.
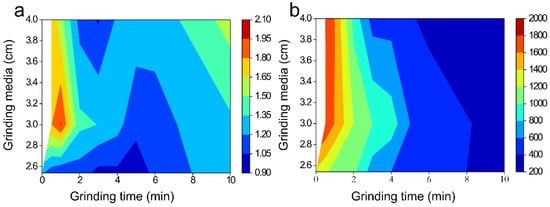
Figure 6.
RR parameters’ variation under different grinding conditions: (a) λ parameter and (b) k parameter.
Table 3 shows the x50 values measured and predicted by the Swebrec model under different grinding conditions. The median diameter decreases when increasing the grinding time in all cases (as expected, due to the comminution action). The variation is different for each ball diameter; higher grinding kinetics is observed in the case of 4.00 cm ball diameter at grinding times longer than 2 min.
Table 3.
Median diameter x50 according to Swebrec distribution, at different grinding times.
4. Discussion
Grinding conditions influence the product PSD, and the accuracy of the fitting distribution is highly dependent on the selected model. Statistical indexes used in this study, namely adjusted R2, AIC, and RMSE, have been widely used to the goodness-of-fit assessing of different PSD and have presented advantages in the models’ calibration by least-squares method [25,29,32,35].
Both RR and Swebrec functions show excellent fitting performance for all grinding conditions studied, whereas GGS indicated the poorest yield fitting. These results agree with previous research, which reported better fitting of RR and Swebrec to grinding products and an accurate description of PSD [26,34,39]. Menéndez-Aguado et al. [35] compared different distribution models to sediments and found that the Swebrec model had better performance than Normal, Lognormal, Weibull, and Gamma functions. The undulation Swebrec parameter related to grinding conditions showed dependence on the grinding time and the ball size but only after 4 min for the last mentioned condition. In the case of grinding times less than 4 min, the b parameter seems to be independent of grinding media. As the particle size decreases with the grinding process (Figure 4 and Figure 5), the undulation parameter value increases with high values when chipping action predominates in the fracture process, resulting in a fines overproduction.
Regarding RR parameters, the shape parameter λ (Figure 6a) shows more stability in the central region, which means that the distribution is highly affected by conditions at lower and greater times. Meanwhile, at grinding times of 3–8 min, λ remains between 0.9–1.2, indicating a more wide size interval and a lower slope in the PSD. The scale parameter k (Figure 6b) presents a sensible change in the stability at 4 min grinding time. At grinding time less than 4 min, 3.00 and 4.00 cm ball sizes produce a limited size range with the feature that as ball size increases, the larger fragments do not break, resulting in larger values of k and λ, and indicating an inefficient ball-particle interaction. This situation could indicate that when using 3.00 and 4.00 cm grinding media, the dominant fragmentation mechanism is the chipping abrasion instead of impact breakage.
Although GGS is a popular model used in many sectors, it does not present sound goodness-of-fit in metallurgical coke PSD grinding products under the considered conditions. The GGS predicts distribution with a linear relationship between cumulative weight and particle size in the log-log scale. However, the actual metallurgical coke grinding product shows higher percentage of fines than the model prediction. This result is aligned with previously reported results, which found that the RR gets better PSD fitting than the GGS model [24,40,41].
The Gamma distribution offers an excellent approximation to predict metallurgical coke PSD, but the statistical parameters were more lacking than in the Swebrec and RR models. As shown in Figure 2 and Figure 4, the Gamma function has some outliers in the adjusted R2 due to shorter grinding times.
Under the grinding test conditions, the production of fines accelerates with all grinding media tested after 3–4 min, producing a widening of the PSD. It has been established in previous studies that the grinding efficiency is related to ball size selection [42,43,44]. Over time, the metallurgical coke breakage in 4.0 cm balls presents significant variation with undergrinding for 0.5–1 min and overgrinding to grinding time from 3–10 min; 4.00 cm grinding media is perhaps too large, creating voids inside the ball charge and generating less normal forces into particles. These results are consistent with Austin et al. [45] and Khumalo et al. [46] results, which established that the larger ball size action is directed to larger particles whereas small grinding media action is preferent on finer particles. Additionally, Austin et al. [45] proposed that the impact force of collision involving large ball sizes gives larger quantities of fines and more catastrophic fracture behaviour. Ball sizes of 2.54 and 3.00 cm evidence small sudden changes in median diameters. However, lower ball size produces lesser x50 sizes, considering balls of 3.00 cm show more grinding to achieve a defined particle size than balls of 2.54 cm. The relationship between ball-particle size for breaking metallurgical coke improves with small ball sizes, possibly due to increased collision frequency.
The assessment of the coke grinding product comparing different particle size functions was carried out. The Swebrec distribution function presented outstanding fitting conditions in grinding products compared to traditional distributions. It is interesting to note that Swebrec parameters, such as GGS and RR models, are related to the fine particles’ produced quantities. Therefore, in agreement with other authors [26,34,35], Swebrec function’s employment could pose a good alternative to evaluate and control PSD in grinding processes and small particles. Additionally, the metallurgical coke particle range addressed in this study is considered a critical point in steelmaking, especially in sinter plants. The superior sinter properties have been obtained with 3.35 mm undersize [15,16,17]. As mentioned above, coke particle size influence the sinter porosity, microstructural phases and thermal properties of the sinter bed. The metallurgical coke PSD evaluation in the range between 3.35 mm to 0.212 mm is consistent with Umadevi et al. [15], which found that the use of this size range increases the calcium ferrite phase and decreases the number of the bigger pore size, thus decreasing coke quality and the coke strength index. On the other hand, Dabbagh et al. [16] evaluated the coke PSD effect on the maximum temperature of the sinter bed and the flame front velocity, finding that the particles ranging from 3.35 mm to 0.212 mm increase the heat production and favour the diffusive processes of the sinter bed.
5. Conclusions
Several PSD models were evaluated on metallurgical coke grinding products using adjusted R2, root means of square error (RMSE) and Akaike’s information criterion (AIC) as statistical indices. Variety of grinding media size and grinding time were employed to investigate the goodness-of-fit to PSD models based on different grinding conditions.
- The two better-fitting models, considering grinding media size and grinding time variations, were Swebrec and RR distribution models, presenting superior goodness-of fit-to all defined behaviour conditions.
- The Swebrec distribution undulation parameter b showed larger values to all ball sizes after grinding 4 min with high data at 4.00 cm ball size.
- The Rosin–Rammler λ parameter does not show a defined tendency with grinding conditions. However, with a 2.54 cm ball size, a less spread-out PSD is obtained, ranging λ values between 0.9–1.20. k parameter values are clearly defined with lesser sizes and greater ball size and grinding times.
- The Swebrec and RR models predicted well the metallurgical coke grinding product PSD. Regarding the Swebrec distribution function, it presented excellent fitting conditions in grinding products compared to traditional distributions.
- Oversized and ultrafine particles were found with 4.00 cm ball size depending on the grinding time. The 2.54 cm ball size results showed a slight variation of particle median diameter with time, while 3.00 cm ball size required more grinding time to reduce metallurgical coke particle size.
- The PSD model goodness-of-fit strongly depended on metallurgical coke grinding conditions.
Supplementary Materials
The following are available online at https://www.mdpi.com/article/10.3390/met11081288/s1, Figure S1: Box plot to compare the particle size models base on adjusted R2 criterion, excluding Gates Gaudin Schuhmann distribution, Figure S2: Cumulative distribution functions with 2.54 cm ball size, at different grinding times, Figure S3: Cumulative distribution functions with 4.0 cm ball size, at different grinding times, Table S1: Statistical descriptors for three criteria, Table S2: Custom script to determine fitting parameter by least square method.
Author Contributions
Conceptualisation, L.C.-A., J.M.M.-A. and A.O.-C.; methodology, L.C.-A., J.M.M.-A. and A.O.-C.; software, L.C.-A.; validation, L.C.-A., J.M.M.-A. and A.O.-C.; formal analysis, J.M.M.-A. and A.O.-C.; investigation, L.C.-A.; resources, A.O.-C.; writing—original draft preparation, L.C.-A., J.M.M.-A. and A.O.-C.; writing—review and editing, L.C.-A., J.M.M.-A. and A.O.-C.; visualisation, L.C.-A.; supervision, A.O.-C.; project administration, A.O.-C.; funding acquisition, A.O.-C. All authors have read and agreed to the published version of the manuscript.
Funding
This research received no external funding.
Institutional Review Board Statement
Not applicable.
Informed Consent Statement
Not applicable.
Data Availability Statement
Not applicable.
Acknowledgments
The authors are thankful to the Faculty of Engineering of the Universidad de Antioquia, to the Committee for Research Development, and CODI for economic support to conduct this work in the project framework: Study of alternatives for the improvement of specific rate of breakage through the intensification of the grinding process in ball mill PVR2018 21371.
Conflicts of Interest
The authors declare no conflict of interest.
References
- Xing, X.; Rogers, H.; Zhang, G.; Hockings, K.; Zulli, P.; Ostrovski, O. Changes in Pore Structure of Metallurgical Cokes under Blast Furnace Conditions. Energy Fuels 2015, 30, 161–170. [Google Scholar] [CrossRef]
- Babich, A.; Senk, D. Coke in the iron and steel industry. In New Trends in Coal Conversion; Woodhead Publishing: Sawston, UK, 2018; pp. 367–404. [Google Scholar] [CrossRef]
- European Commission. Study on the EU’s List of Critical Raw Materials. Available online: https://ec.europa.eu/commission/presscorner/detail/en/ip_20_1542 (accessed on 30 June 2021).
- Babich, A.; Senk, D.; Gudenau, H.W. Effect of coke reactivity and nut coke on blast furnace operation. Ironmak. Steelmak. 2009, 36, 222–229. [Google Scholar] [CrossRef]
- Huang, J.; Guo, R.; Tao, L.; Wang, Q.; Liu, Z. Effects of Stefan Flow on Metallurgical Coke Gasification with CO2. Energy Fuels 2020, 34, 2936–2944. [Google Scholar] [CrossRef]
- Cameron, I.; Sukhram, M.; Lefebvre, K.; Davenport, W. Blast Furnace Ironmaking: Analysis, Control, and Optimisation; Elsevier: Amsterdam, The Netherlands, 2019. [Google Scholar]
- Mousa, E.; Wang, C.; Riesbeck, J.; Larsson, M. Biomass applications in iron and steel industry: An overview of challenges and opportunities. Renew. Sustain. Energy Rev. 2016, 65, 1247–1266. [Google Scholar] [CrossRef]
- Jha, G.; Soren, S.; Mehta, K.D. Partial substitution of coke breeze with biomass and charcoal in metallurgical sintering. Fuel 2020, 278, 118350. [Google Scholar] [CrossRef]
- Fröhlichová, M.; Legemza, J.; Findorák, R.; Maslejová, A. Biomass as a Source of Energy in Iron Ore Agglomerate Production Process. Arch. Met. Mater. 2014, 59, 815–820. [Google Scholar] [CrossRef]
- Geerdes, M.; Chaigneau, R.; Kurunov, I.; Lingiardi, O.; Ricketts, J. Modern Blast Furnace Ironmaking: An Introduction; IOS Press: Amsterdam, The Netherlands, 2015. [Google Scholar]
- Shin, S.-M.; Jung, S.-M. Gasification Effect of Metallurgical Coke with CO2 and H2O on the Porosity and Macrostrength in the Temperature Range of 1100 to 1500 °C. Energy Fuels 2015, 29, 6849–6857. [Google Scholar] [CrossRef]
- Weitkamp, E.A.; Lipsky, E.M.; Pancras, P.J.; Ondov, J.M.; Polidori, A.; Turpin, B.J.; Robinson, A.L. Fine particle emission profile for a large coke production facility based on highly time-resolved fence line measurements. Atmos. Environ. 2005, 39, 6719–6733. [Google Scholar] [CrossRef]
- Al-Hamamre, Z.; Saidan, M.; Hararah, M.; Rawajfeh, K.; Alkhasawneh, H.E.; Al-Shannag, M. Wastes and biomass materials as sustainable-renewable energy resources for Jordan. Renew. Sustain. Energy Rev. 2017, 67, 295–314. [Google Scholar] [CrossRef]
- Mohamed, F.; El-Hussiny, N.; Shalabi, M. Granulation of coke breeze fine for using in the sintering process. Sci. Sinter. 2010, 42, 193–202. [Google Scholar] [CrossRef]
- Umadevi, T.; Deodhar, A.V.; Kumar, S.; Prasad, C.S.G.; Ranjan, M. Influence of coke breeze particle size on quality of sinter. Ironmak. Steelmak. 2008, 35, 567–574. [Google Scholar] [CrossRef]
- Dabbagh, A.; Moghadam, A.H.; Naderi, S.; Hamdi, M. A study on the effect of coke particle size on the thermal profile of the sinters produced in Esfahan Steel Company (ESCO). S. Afr. Inst. Min. Metall. 2013, 113, 941–945. [Google Scholar]
- Tobu, Y.; Nakano, M.; Nakagawa, T.; Nagasaka, T. Effect of Granule Structure on the Combustion Behavior of Coke Breeze for Iron Ore Sintering. ISIJ Int. 2013, 53, 1594–1598. [Google Scholar] [CrossRef]
- Maeda, T.; Kikuchi, R.; Ohno, K.-I.; Shimizu, M.; Kunitomo, K. Effect of Particle Size of Iron Ore and Coke on Granulation Property of Quasi-Particle. ISIJ Int. 2013, 53, 1503–1509. [Google Scholar] [CrossRef][Green Version]
- Niesler, M.; Stecko, J.; Blacha, L.; Oleksiak, B. Applications of fine grained coke breeze fractions in the process of iron ore sintering. Metalurgija 2014, 53, 37–39. [Google Scholar]
- Mingshun, Z.; Han, S.; Wang, L.; Jiang, X.; Xu, L.; Zhai, L.; Liu, J.; Zhang, H.; Qin, X.; Shen, F.; et al. Effect of Size Distribution of Coke Breeze on Sintering Performance. Steel Res. Int. 2015, 86, 1242–1251. [Google Scholar] [CrossRef]
- Chung, J.K.; Lee, S.M.; Shin, M.S. Effect of Coke Size on Reducing Agent Ratio (RAR) in Blast Furnace. ISIJ Int. 2018, 58, 2228–2235. [Google Scholar] [CrossRef]
- Xiong, L.; Peng, Z.; Gu, F.; Ye, L.; Wang, L.; Rao, M.; Zhang, Y.; Li, G.; Jiang, T. Combustion behavior of granulated coke breeze in iron ore sintering. Powder Technol. 2018, 340, 131–138. [Google Scholar] [CrossRef]
- Ma, H.; Pan, W.; Liu, L.; Zhang, Z.; Wang, C. Effects of Particle Size of Coke on Iron Ore Sintering Process. Metal. Sisak Zagreb 2019, 649–656. [Google Scholar] [CrossRef]
- Perfect, E.; Xu, Q.; Terry, D.L. Improved Parameterization of Fertilizer Particle Size Distribution. J. AOAC Int. 1998, 81, 935–942. [Google Scholar] [CrossRef]
- Botula, Y.-D.; Cornelis, W.M.; Baert, G.; Mafuka, P.; Van Ranst, E. Particle size distribution models for soils of the humid tropics. J. Soils Sediments 2013, 13, 686–698. [Google Scholar] [CrossRef]
- Bu, X.; Chen, Y.; Ma, G.; Sun, Y.; Ni, C.; Xie, G. Wet and dry grinding of coal in a laboratory-scale ball mill: Particle-size distributions. Powder Technol. 2019, 359, 305–313. [Google Scholar] [CrossRef]
- Schuhmann, R., Jr. Energy input and size distribution in comminution. Trans. SME/AIME 1960, 17, 22–25. [Google Scholar]
- Rosin, P.; Rammler, E. Laws governing the fineness of powdered coal. J. Inst. Fuel 1933, 7, 29–36. [Google Scholar] [CrossRef]
- Yang, X.; Lee, J.; Barker, D.E.; Wang, X.; Zhang, Y. Comparison of six particle size distribution models on the goodness-of-fit to particulate matter sampled from animal buildings. J. Air Waste Manag. Assoc. 2012, 62, 725–735. [Google Scholar] [CrossRef]
- Pinho, H.J.O.; Mateus, D.M.R.; Alves, S.S. Probability density functions for bubble size distribution in air–water systems in stirred tanks. Chem. Eng. Commun. 2018, 205, 1105–1118. [Google Scholar] [CrossRef]
- Buchan, G.D. Applicability of the Simple Lognormal Model to Particle-Size Distribution in Soils. Soil Sci. 1989, 147, 155–161. [Google Scholar] [CrossRef]
- Esmaeelnejad, L.; Siavashi, F.; Seyedmohammadi, J.; Shabanpour, M. The best mathematical models describing particle size distribution of soils. Model. Earth Syst. Environ. 2016, 2, 1–11. [Google Scholar] [CrossRef]
- Ouchterlony, F. The Swebrec© function: Linking fragmentation by blasting and crushing. Trans. Inst. Min. Metall. Sect. A Min. Technol. 2005, 114, 29–44. [Google Scholar] [CrossRef]
- Osório, A.; Menendez-Aguado, J.M.; Bustamante, O.; Restrepo, G. Fine grinding size distribution analysis using the Swrebec function. Powder Technol. 2014, 258, 206–208. [Google Scholar] [CrossRef]
- Menéndez-Aguado, J.M.M.; Carpio, E.P.; Sierra, C. Particle size distribution fitting of surface detrital sediment using the Swrebec function. J. Soils Sediments 2015, 15, 2004–2011. [Google Scholar] [CrossRef]
- Shangguan, W.; Dai, Y.; García-Gutiérrez, C.; Yuan, H. Particle-size distribution models for the conversion of Chinese data to FAO/USDA system. Sci. World J. 2014, 2014, 109310. [Google Scholar] [CrossRef]
- Akaike, H.; Parzen, E.; Tanabe, K.; Kitagawa, G. Information theory and an extension of the maximum likehood principle. Second. Int. Symp. Inf. Theory 1973, 3, 267–281. [Google Scholar]
- Spiess, A.-N.; Neumeyer, N. An evaluation of R2 as an inadequate measure for nonlinear models in pharmacological and biochemical research: A Monte Carlo approach. BMC Pharmacol. 2010, 10, 6. [Google Scholar] [CrossRef]
- Liu, S.; Wang, H.; Wang, H. Effect of grinding time on the particle size distribution characteristics of tuff powder. Medziagotyra 2021, 27, 205–209. [Google Scholar] [CrossRef]
- Harris, C.C. A Mull-Purpose Alyavdin-Rosin-Rammler-Weibull Chart. Powder Technol. 1971, 10027, 3–6. [Google Scholar] [CrossRef]
- Allaire, S.; Parent, L.-E. Size Guide Number and Rosin–Rammler Approaches to describe Particle Size Distribution of Granular Organic-based Fertilisers. Biosyst. Eng. 2003, 86, 503–509. [Google Scholar] [CrossRef]
- Austin, L.; Shoji, K.; Luckie, P. The effect of ball size on mill performance. Powder Technol. 1976, 14, 71–79. [Google Scholar] [CrossRef]
- Bwalya, M.; Moys, M.; Finnie, G.; Mulenga, F. Exploring ball size distribution in coal grinding mills. Powder Technol. 2014, 257, 68–73. [Google Scholar] [CrossRef]
- Bürger, R.; Bustamante, O.; Fulla, M.; Rivera, I. A population balance model of ball wear in grinding mills: An experimental case study. Miner. Eng. 2018, 128, 288–293. [Google Scholar] [CrossRef]
- Austin, L.G.; Klimpel, K.K.; Luckie, P.T. Process Engineering of Size Reduction: Ball Milling; Society of Mining of the American Institute of Mining, Metallurgical, and Petroleum Enginireers: Englewood, CO, USA, 1984. [Google Scholar]
- Khumalo, N.; Glasser, D.; Hildebrandt, D.; Hausberger, B.; Kauchali, S. The application of the attainable region analysis to comminution. Chem. Eng. Sci. 2006, 61, 5969–5980. [Google Scholar] [CrossRef]


Publisher’s Note: MDPI stays neutral with regard to jurisdictional claims in published maps and institutional affiliations. |
© 2021 by the authors. Licensee MDPI, Basel, Switzerland. This article is an open access article distributed under the terms and conditions of the Creative Commons Attribution (CC BY) license (https://creativecommons.org/licenses/by/4.0/).