Article

Texture Evolution with Different Rolling Parameters of Ferritic Rolled IF Steel

1
Collaborative Innovation Center of Steel Technology, University of Science and Technology Beijing, Beijing 100083, China
2
Central Research Institute, Baoshan Iron & Steel Co., Ltd., Shanghai 201900, China
3
Beijing Special Steel Engineering Technology Research Center for Transportation and Energy, University of Science and Technology Beijing, Beijing 100083, China
*
Authors to whom correspondence should be addressed.
Metals 2021, 11(9), 1341; https://doi.org/10.3390/met11091341
Submission received: 13 July 2021 / Revised: 19 August 2021 / Accepted: 20 August 2021 / Published: 25 August 2021

Abstract

:
Interstitial free (IF) steel is widely used in the automotive industry, due to its excellent deep drawing performance. In this study, in order to study the influence of different rolling processes on the texture evolution and deep drawing performance of IF steel, we conducted rolling experiments on IF steel with different temperatures, different reduction rates, and different lubrication conditions. The impact of texture on the deep drawing performance of the steel was also analyzed. The microscopic and macroscopic texture analyses were performed using electron backscatter diffraction (EBSD) and X-ray diffraction (XRD), respectively. Deep drawing performance was analyzed by measuring the r-value. The results showed that in non-lubricated rolling, the r-value increased with the decrease in the reduction rate, and the r-value increased with the increase in the deformation temperature. The maximum value of r is 0.85. But in the case of lubricated rolling, the r-value increased significantly from 0.74 to 1.47 compared to non-lubricated (keeping the reduction rate and the rolling temperature constant). The lubrication reduced the shear deformation of the steel surface, resulting in a γ texture on the surface. Texture uniformity along the thickness direction resulted in an increase in the r-value of the steel.

1. Introduction

Interstitial free (IF) steel has a carbon content lower than 0.01% and added niobium (Nb) and titanium (Ti) to fix the carbon (C) and nitrogen (N) content in the matrix, to achieve the interstitial free microstructure. This kind of interstitial free microstructure is essential to obtain an excellent deep drawing performance of the steel. IF steel is extensively used in the automotive industry owing to its deep drawing performance, which is dominated by many factors [1]. The most important factor is the intensity of γ (ND//<111>) texture. A strong γ texture is conducive to further improve the deep drawing performance of the steel [2,3,4,5].
Generally, the IF steel is hot-rolled in the austenitic region, then cold-rolled and annealed [6,7,8]. In recent years, many researchers have reported that IF steel forms α (RD//<110>) texture and γ (ND//<111>) texture if rolled in the ferrite region [9,10,11,12]. In the process of recrystallization and grain growth, a strong γ texture will be formed, which can replace the cold-rolled products. At the same time, ferrite rolling has many advantages. It can reduce the energy consumption as well as the generation of surface oxide scale, so the deep-drawn steel plates can be produced in a shorter duration and at a lower cost [13,14,15,16].
Many factors affect the evolution of the final γ texture intensity during ferritic rolling, including the chemical composition of the steel and different rolling process parameters, such as deformation temperature in ferrite region, reduction rate, and lubrication [17,18,19]. Among them, the shear deformation during the rolling process has a huge effect on the deep drawing performance of the steel plate if the process is conducted without proper lubrication. The shear deformation is caused by the friction between the roller and the steel plate surface (RD-TD surface), which produces a sharp Goss texture [20,21]. The Goss texture retains during the recrystallization and grain growth. The usage of proper lubrication in the rolling process effectively reduces the friction between the two surfaces, improves the surface quality, changes the surface texture, and promotes the formation of γ texture [22]. However, few scholars have studied the influence of different rolling processing (including reduction rate and deformation temperature) on texture and r-value under non-lubrication rolling.
Hence, in this paper, an attempt is made to determine the effects of reduction rate (88%, 78%, and 67%), temperature (700 °C, 750 °C, and 800 °C), and lubrication on the texture evolution of the ferritic rolled IF steels. The microscopic and macroscopic texture analyses are performed using electron backscatter diffraction (EBSD) and X-ray diffraction (XRD) studies, respectively. Deep drawing performance was analyzed by measuring the r-value. The correlation between the developed texture and the deep drawing performance of the steel is discussed in detail.

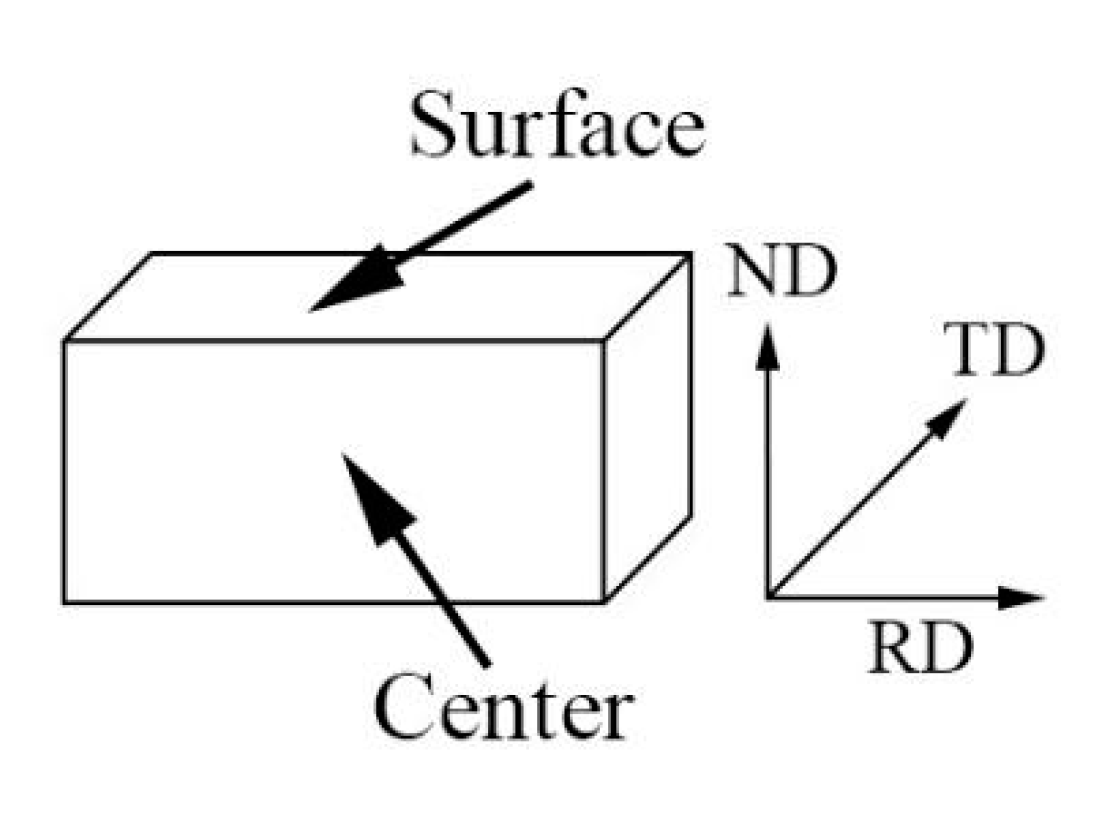
2. Materials and Methods

The IF steel ingot was homogenized for 2 h at 1200 °C, then roughly rolled at a temperature greater than 950 °C, and finally, air cooled in the ferrite region (800 °C, 750 °C, 700 °C) for finish rolling. The reduction rates of the finishing rolling region were 88%, 78%, and 67%. When lubricating the rolling, a spray can was used to spray the lubricating liquid evenly on the surface of the roll. The ingot was finally rolled to 3.5 mm, then air cooled to room temperature. The chemical composition (in weight alloying elements) of the IF steel is given in Table 1. Different nomenclatures are used to represent the processing parameters of different samples, e.g., the sample 800 °C—88% represents ferritic rolling at 800 °C, with an 88% of reduction rate. The sample 700 °C—78%—1 represents ferritic rolling at 700 °C, with a 78% of reduction rate. The Suffix 1 indicates that the sample was lubricated rolling.
The plastic strain radio (r-value) of the samples under different rolling processing was determined. The gauge length of the parallel section of the stretch specimen was 50 mm, then stretched to a 15% strain at a constant strain rate of 5 mm/min. Since the r-value determination was done under 15% strain, the tensile sample was annealed at 750 °C for 3 h.
The microscopic and macroscopic texture analyses of the samples were performed using EBSD and XRD, respectively. Each sample with a dimension of 10 mm × 8 mm × 3.5 mm was used, and the corresponding rolling direction (RD), transverse direction (TD), and normal direction (ND) are shown in Figure 1. The ND-RD and TD-RD surfaces of the sample were mechanically polished and then electropolished with 10% perchloric acid/alcohol solution before EBSD and XRD analyses. The step size of the EBSD test was set to 0.2–2 µm. The EBSD data were further analyzed using AZtecCrystal 2.0 software (Oxford Instruments, Oxford, UK) to obtain an inverse pole figure (IPF) and orientation distribution function ODF. XRD was conducted using molybdenum (Mo-Kα) radiation to observe the macro-texture. The {110}, {200}, and {211} pole figures were used in calculating the ODF. According to the typical texture developed in IF steel during rolling, φ2 = 45° ODF section was used in this paper. The ideal orientations of texture components in φ2 = 45° ODF section are shown in Figure 2.

3. Results

3.1. Deep Drawing Properties under Different Rolling Parameters

The deep drawing properties of the IF steel under different rolling conditions are shown in Table 2. The r-value of the sample is defined as the plastic strain ratio of width to thickness under uniaxial tension, and a high r-value indicates good deep drawing property. Equation (1) and Equation (2) were used to calculate the r and Δr values, where r0, r45, and r90 are the r-values corresponding to 0°, 45°, and 90° of the steel plate, respectively, (0° is parallel to RD).
r = ( r 0   +   2 r 45 + r 90 ) / 4
Δ r = ( r 0   -   2 r 45 + r 90 ) / 2
It can be seen that without lubrication, the r-value increased with the decrease in the reduction rate, and the r-value varied from 0.69 to 0.85. The r-value decreased with the decrease in the deformation temperature, and the r-value varied 0.83 to 0.71. With lubricant, the r-value increased by 0.7 (1.47) when compared to the values obtained from non-lubricated rolling. The steel plate showed a better deep drawing performance with lubrication.

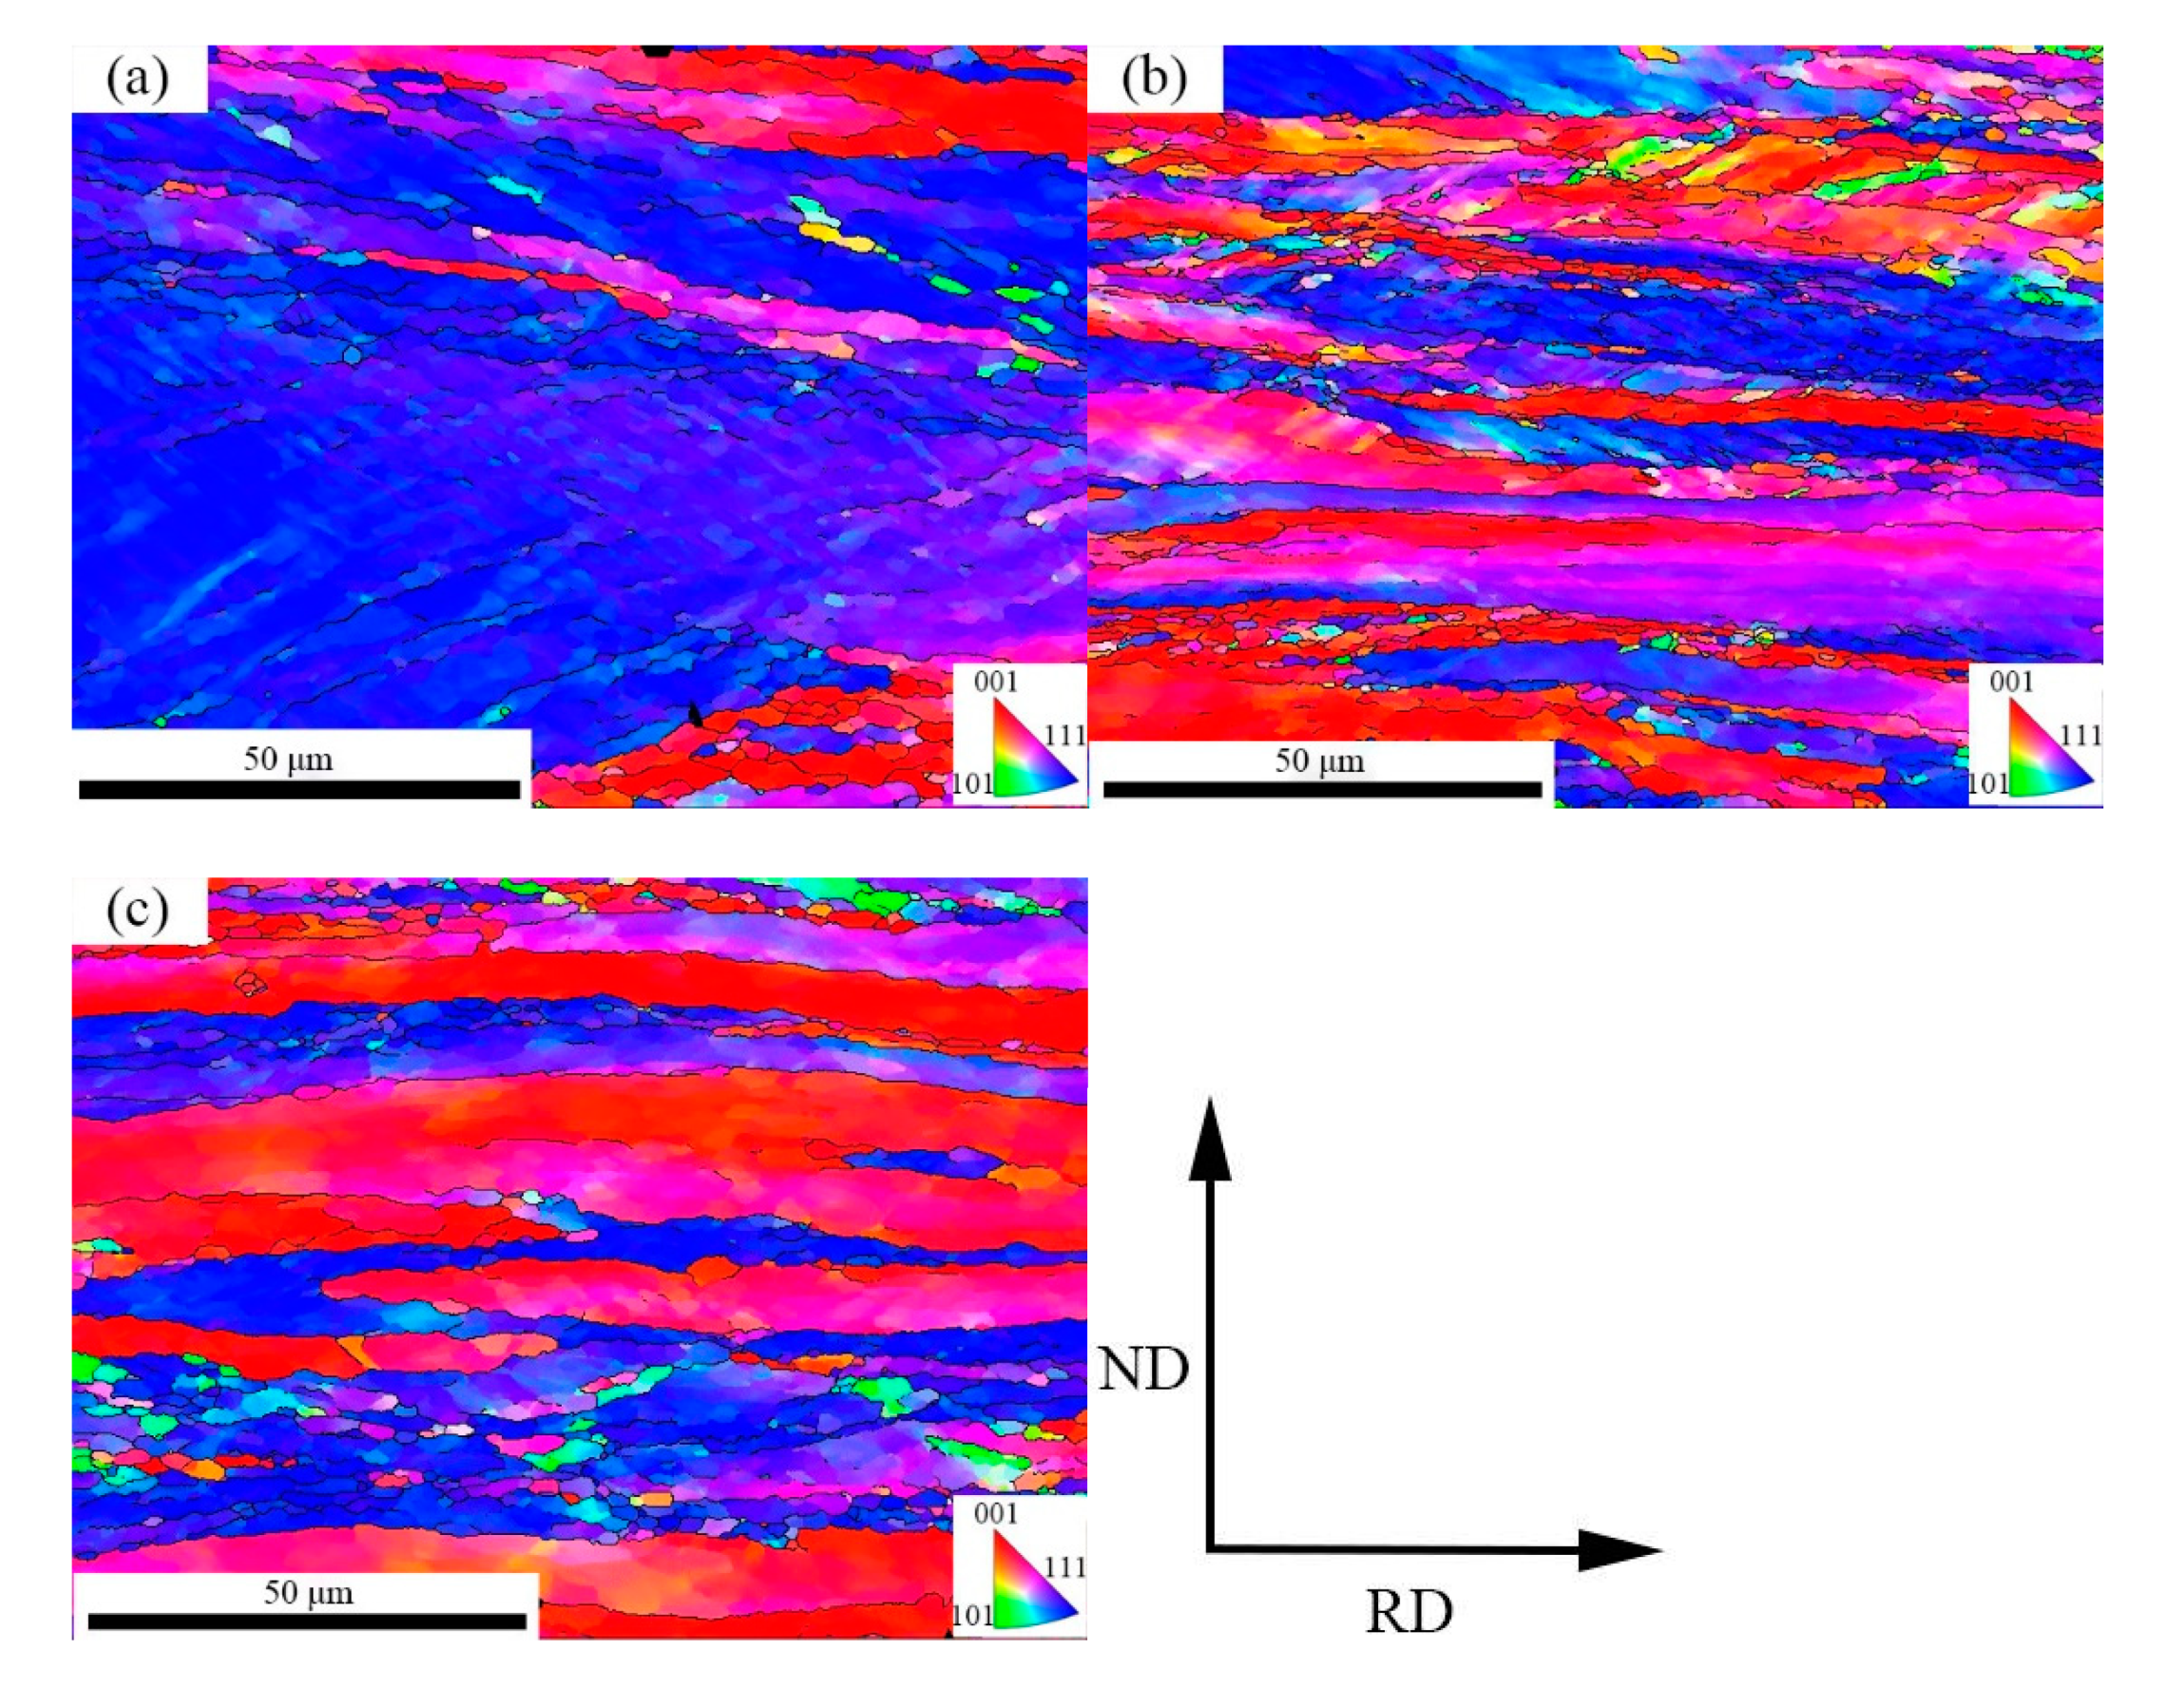
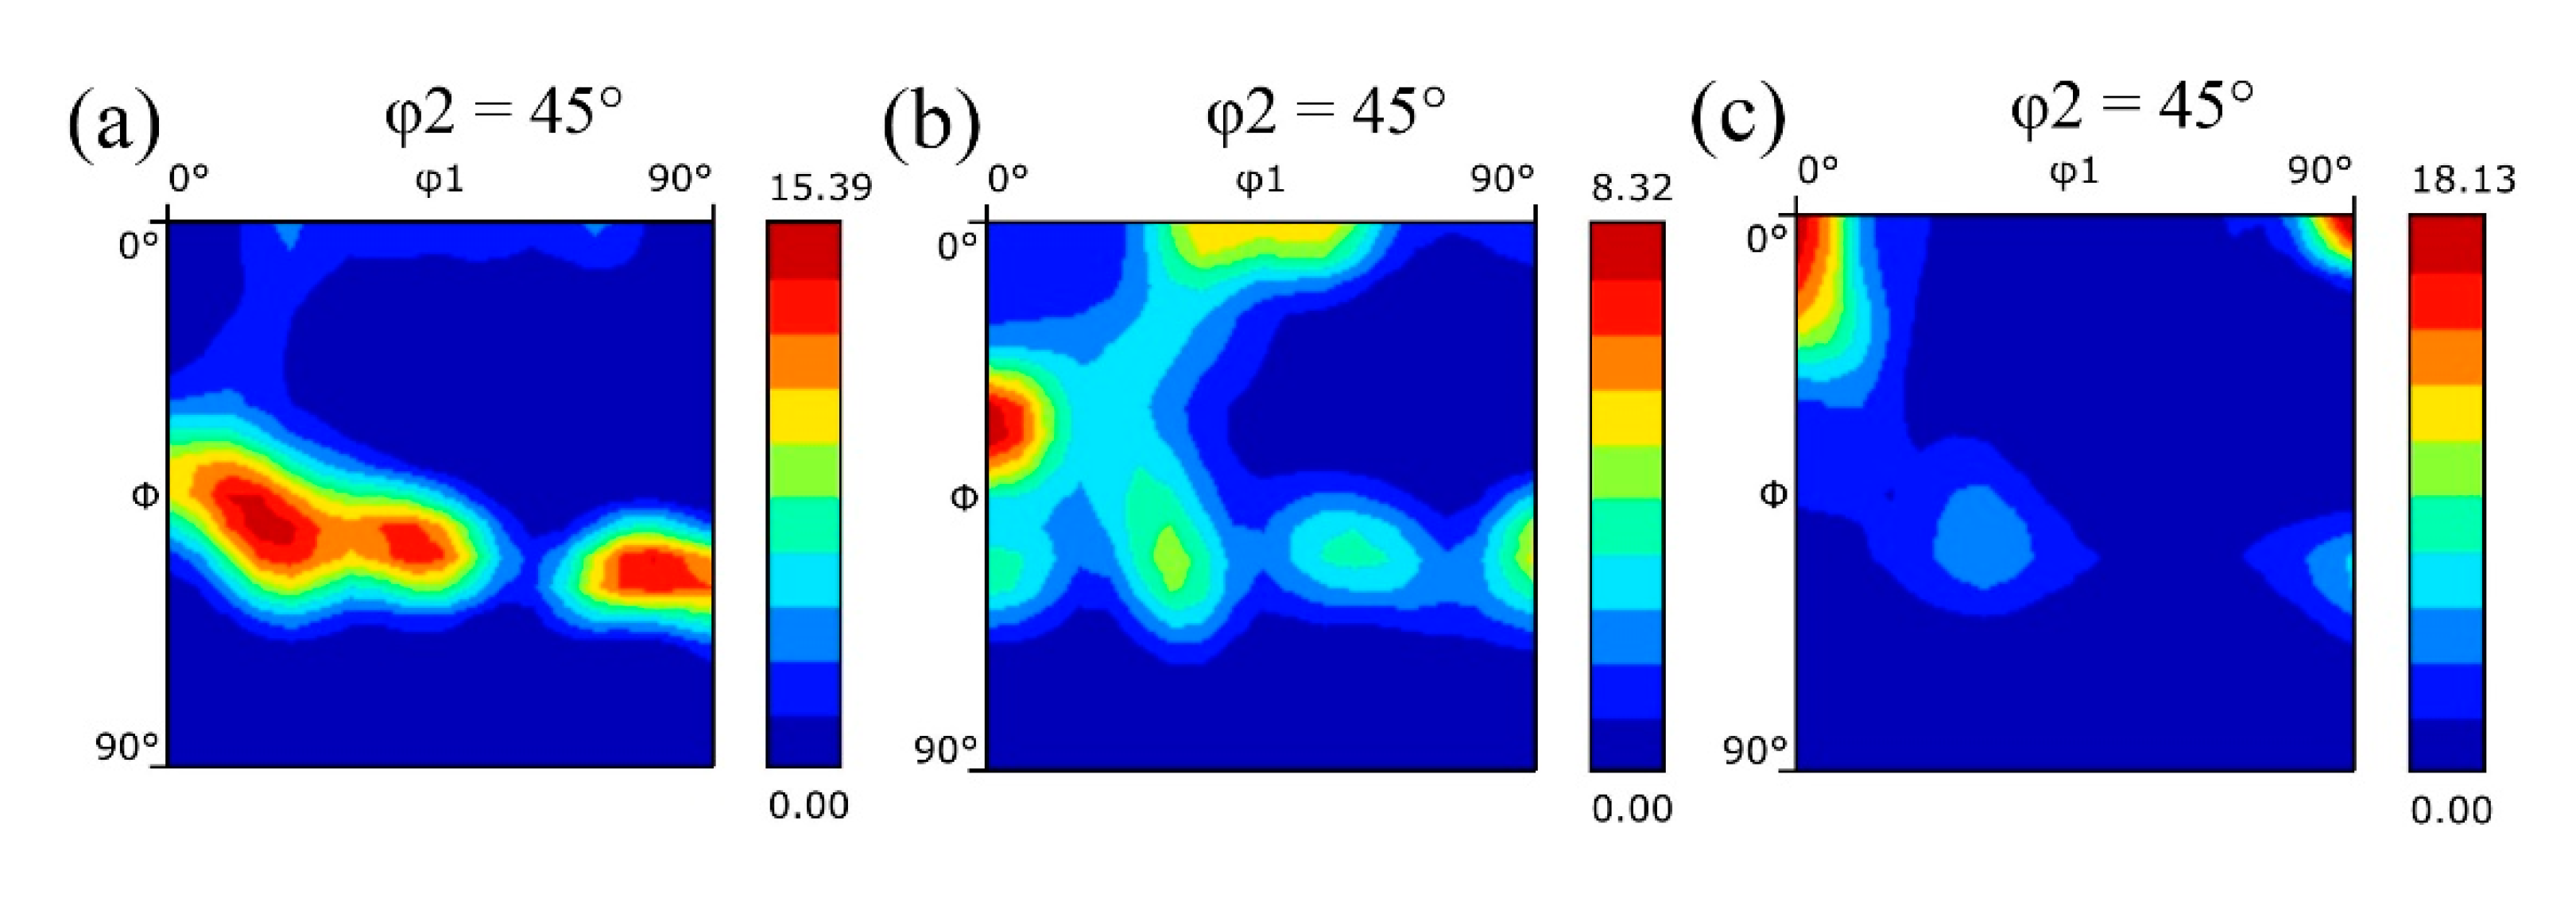
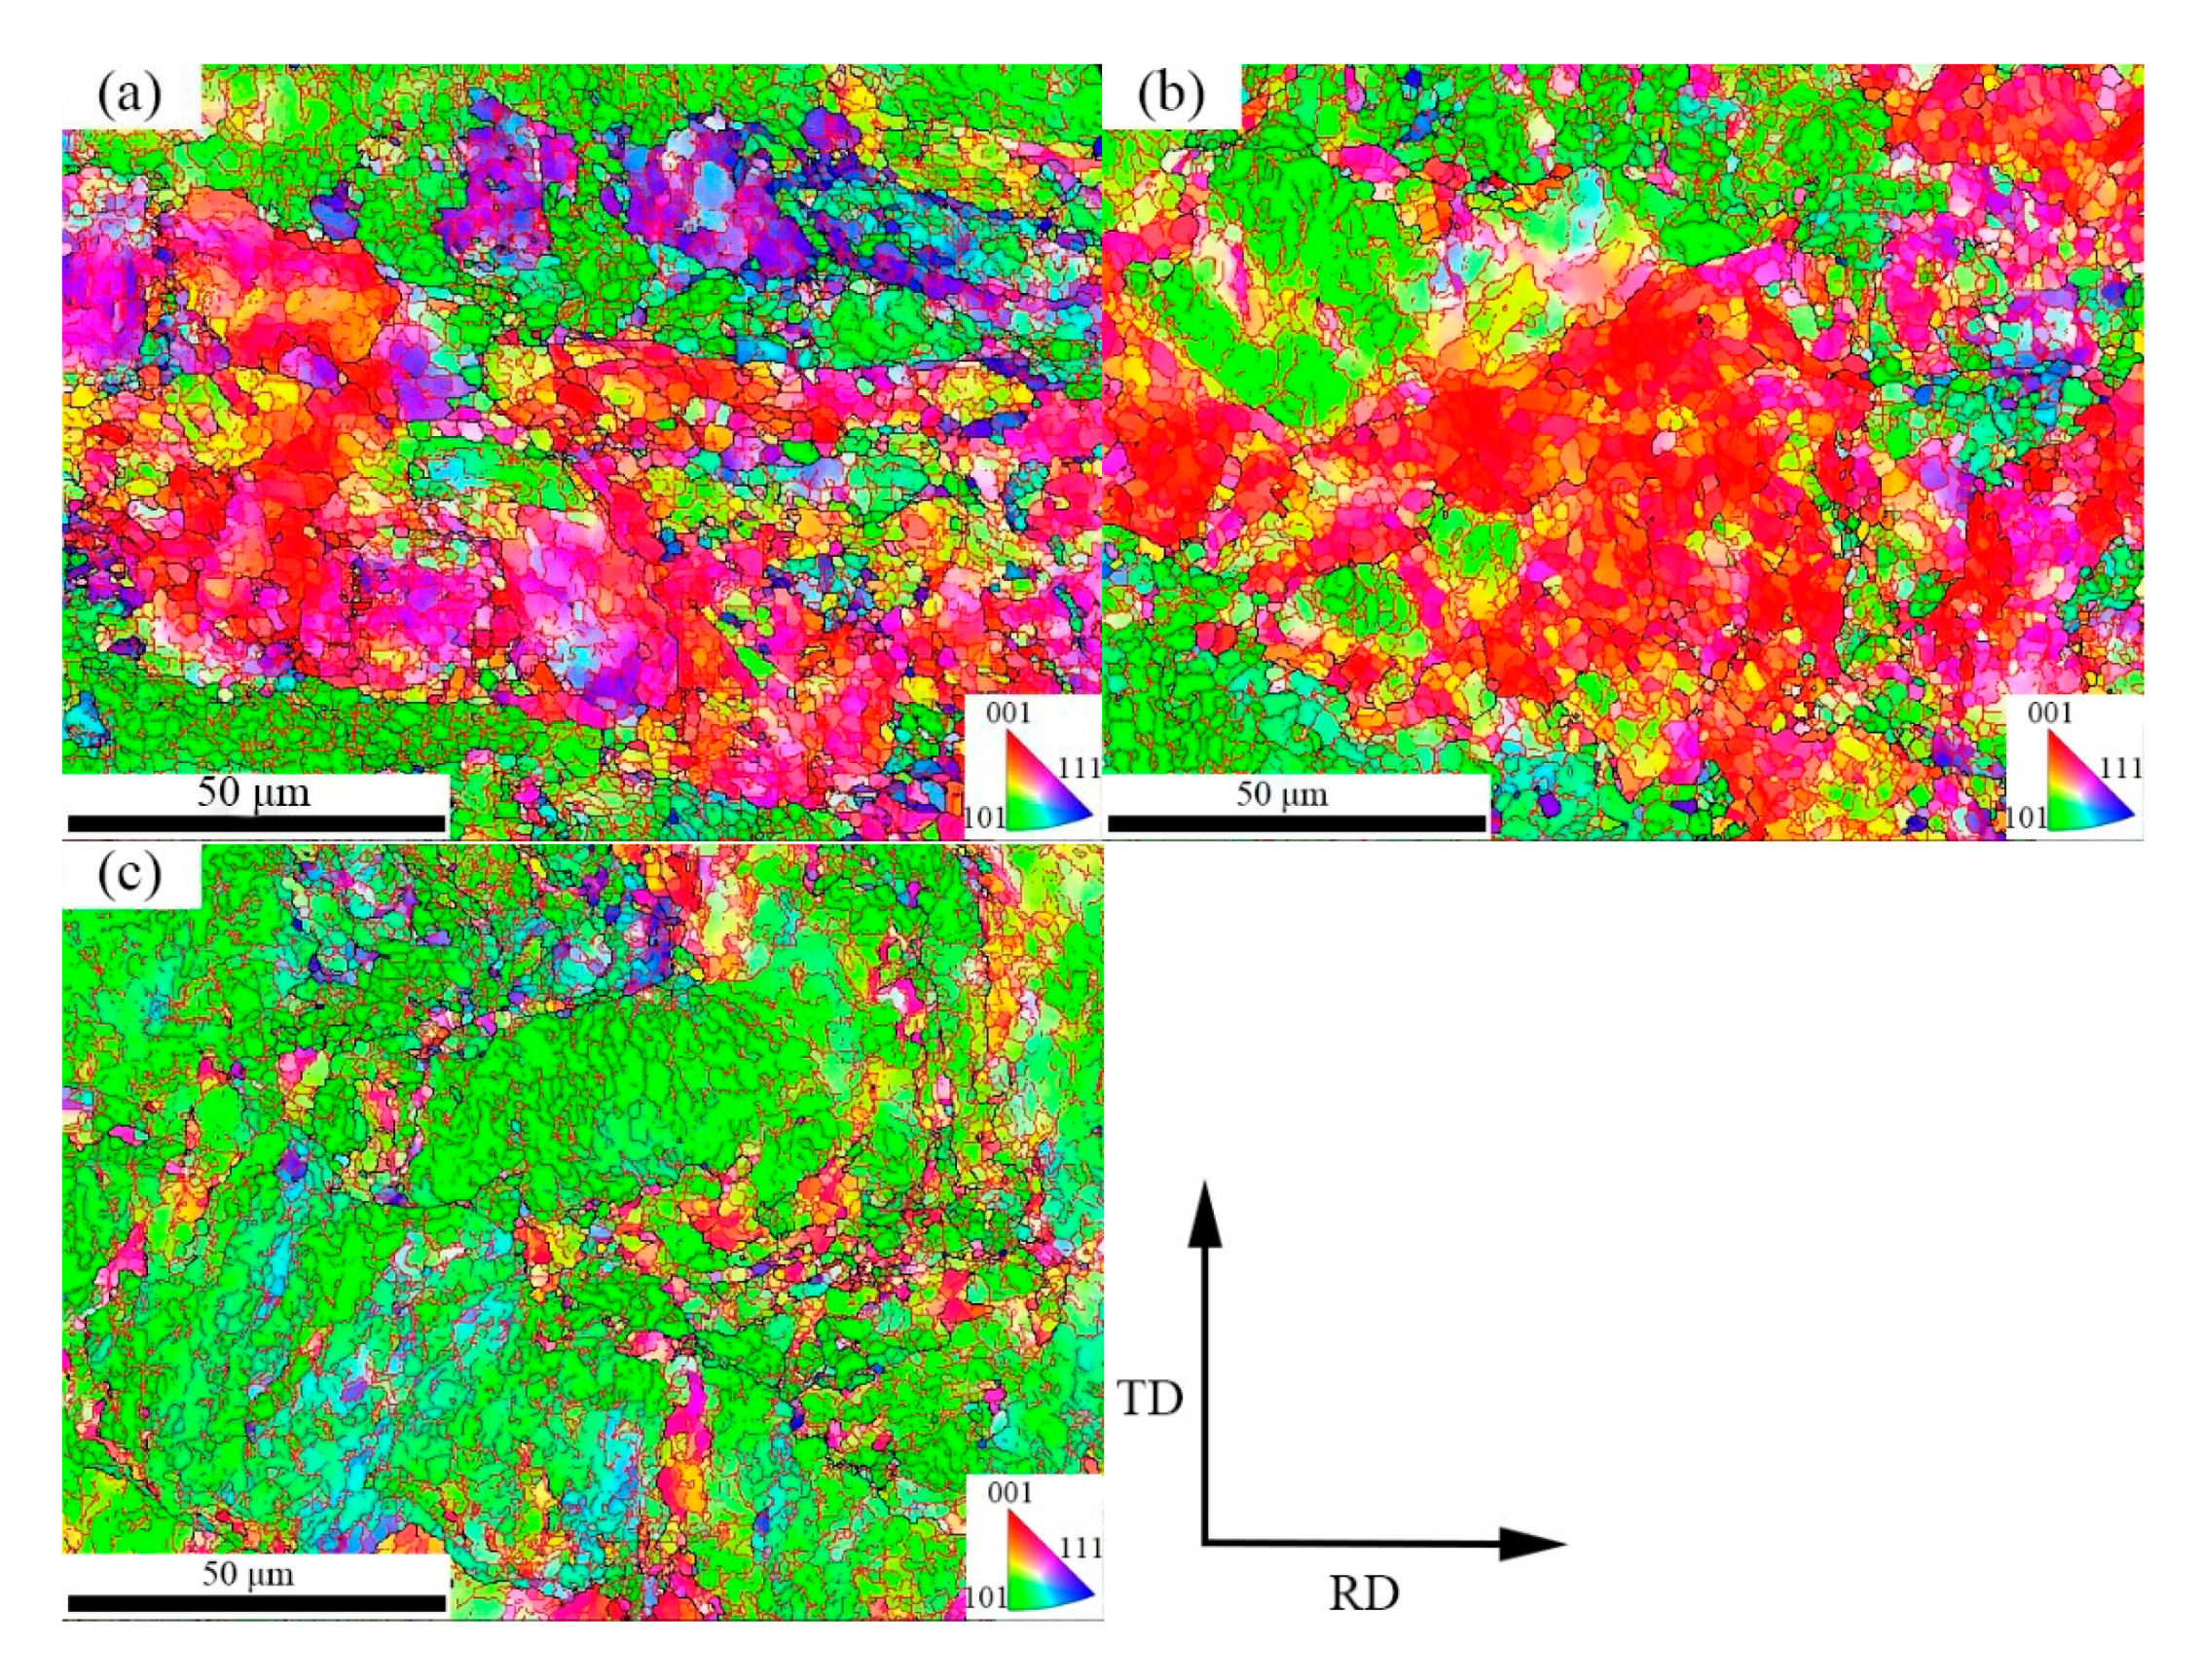
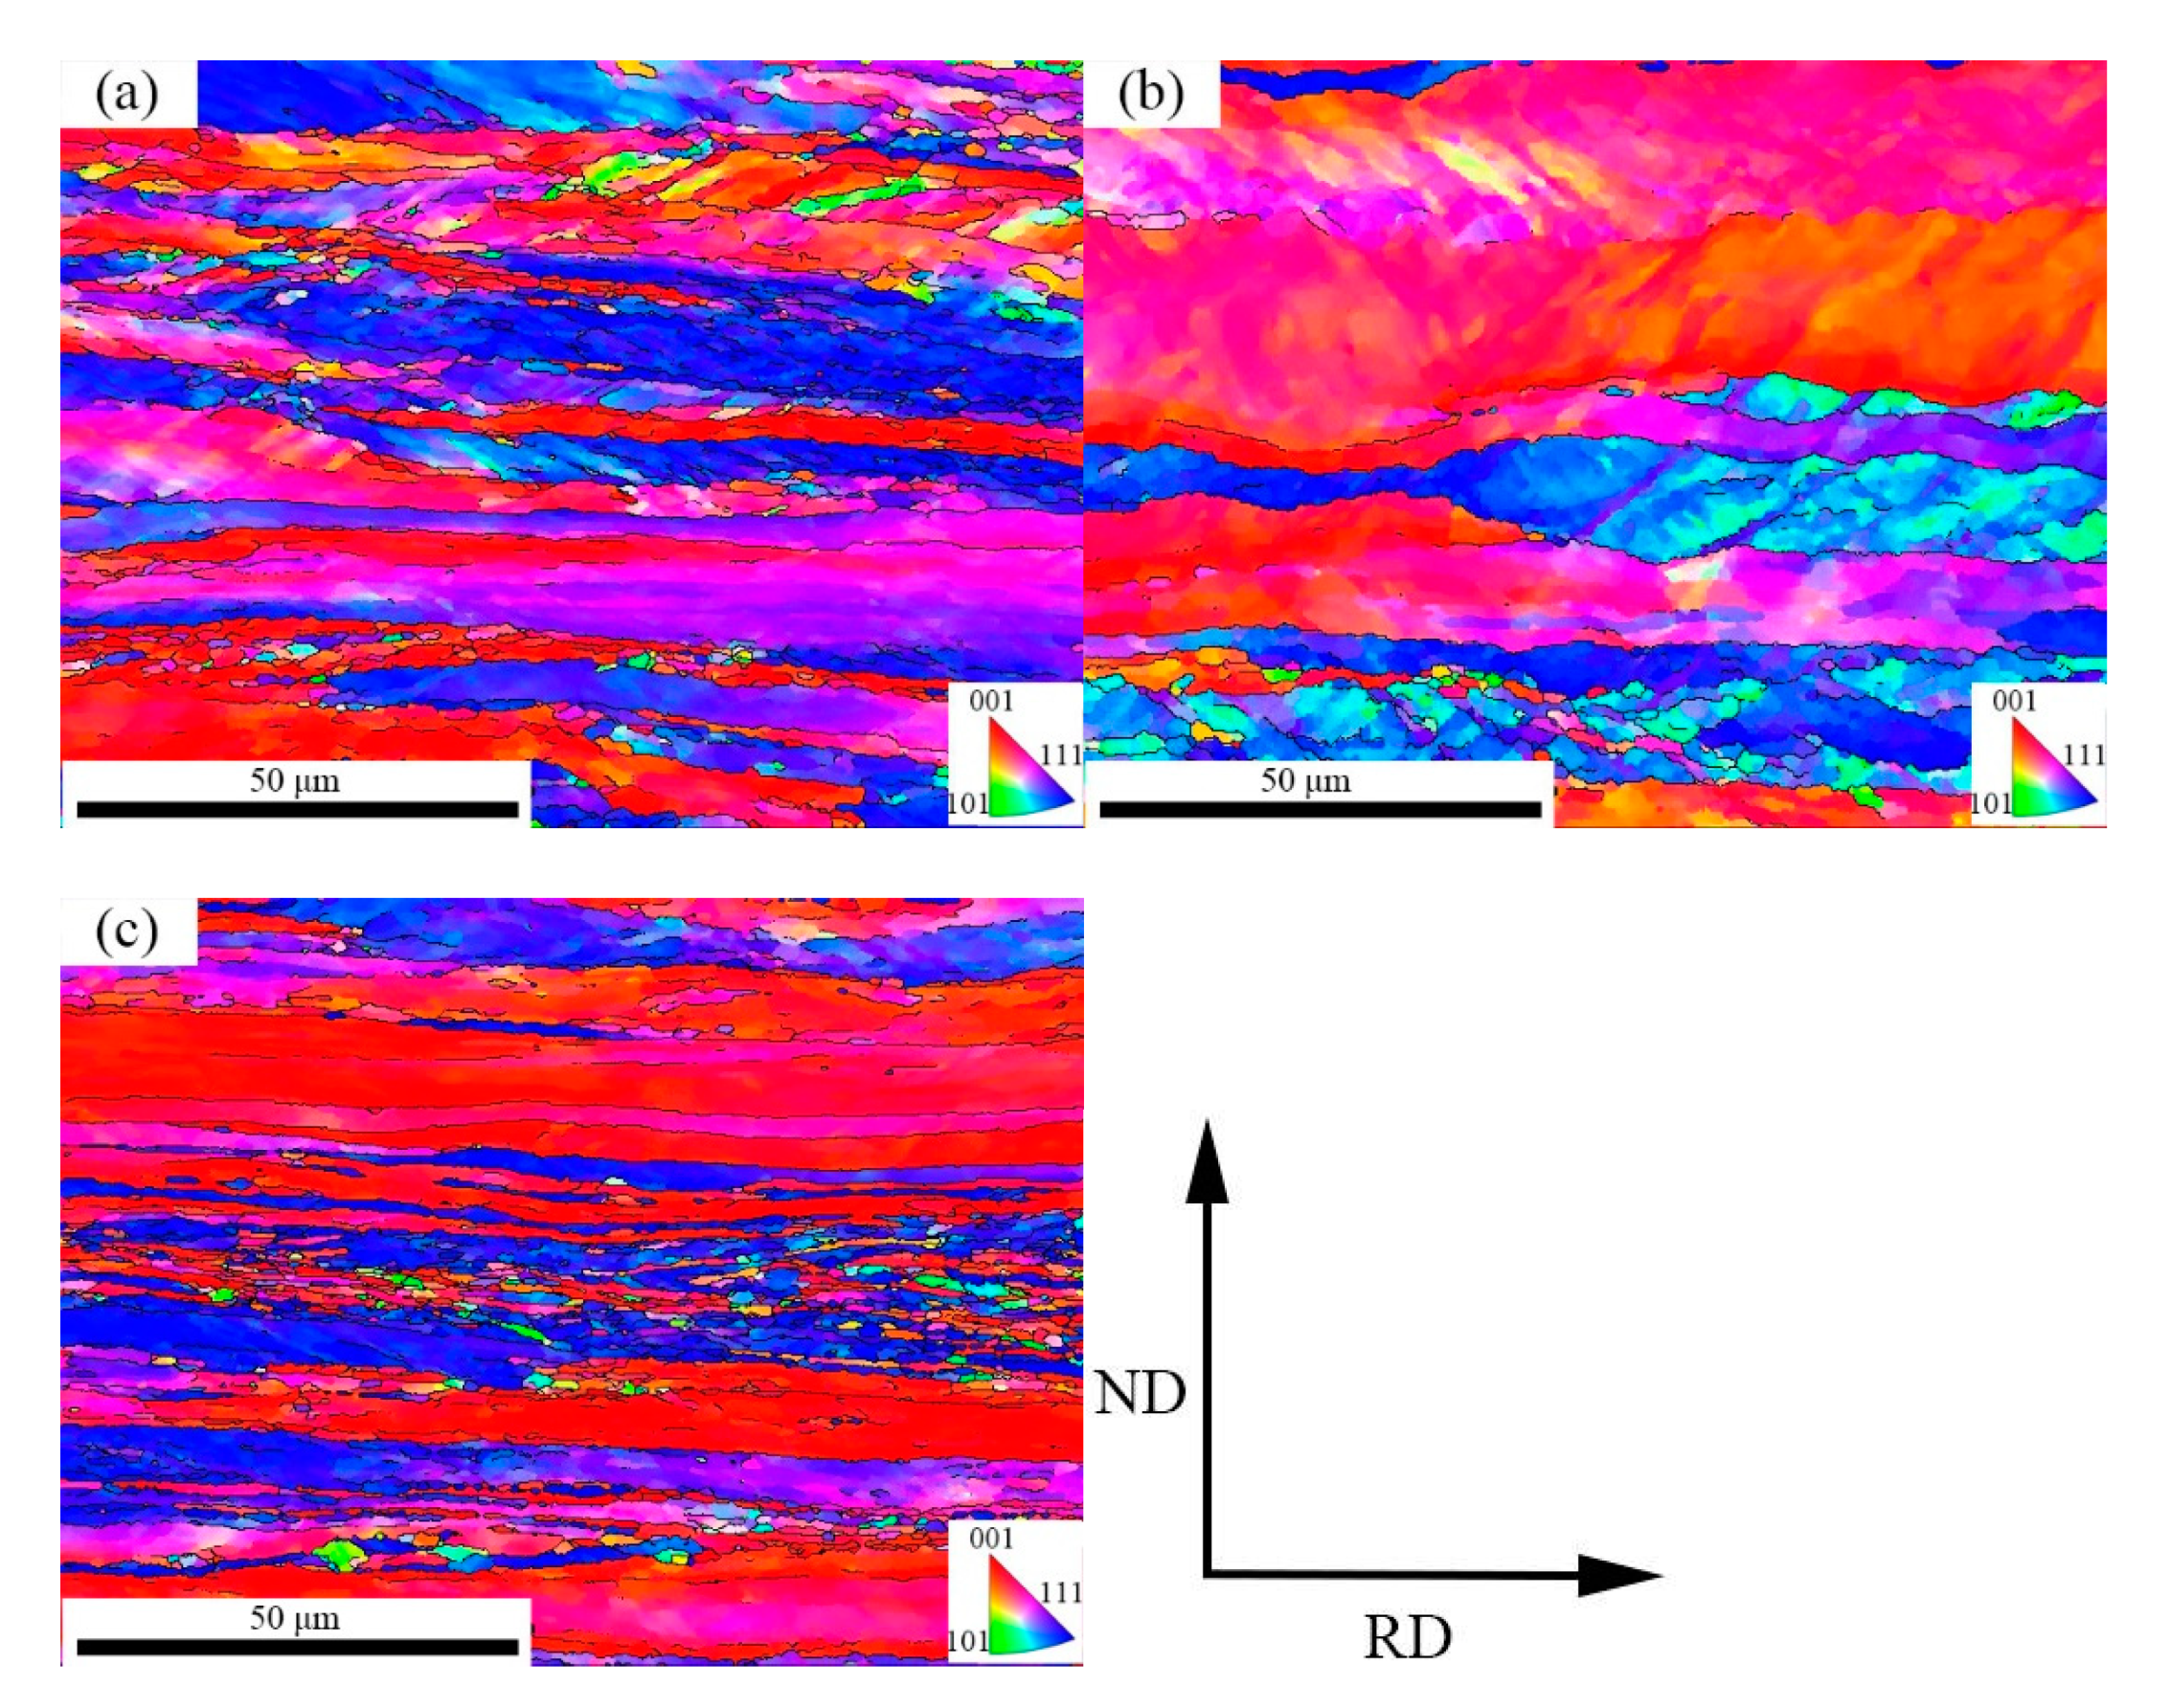
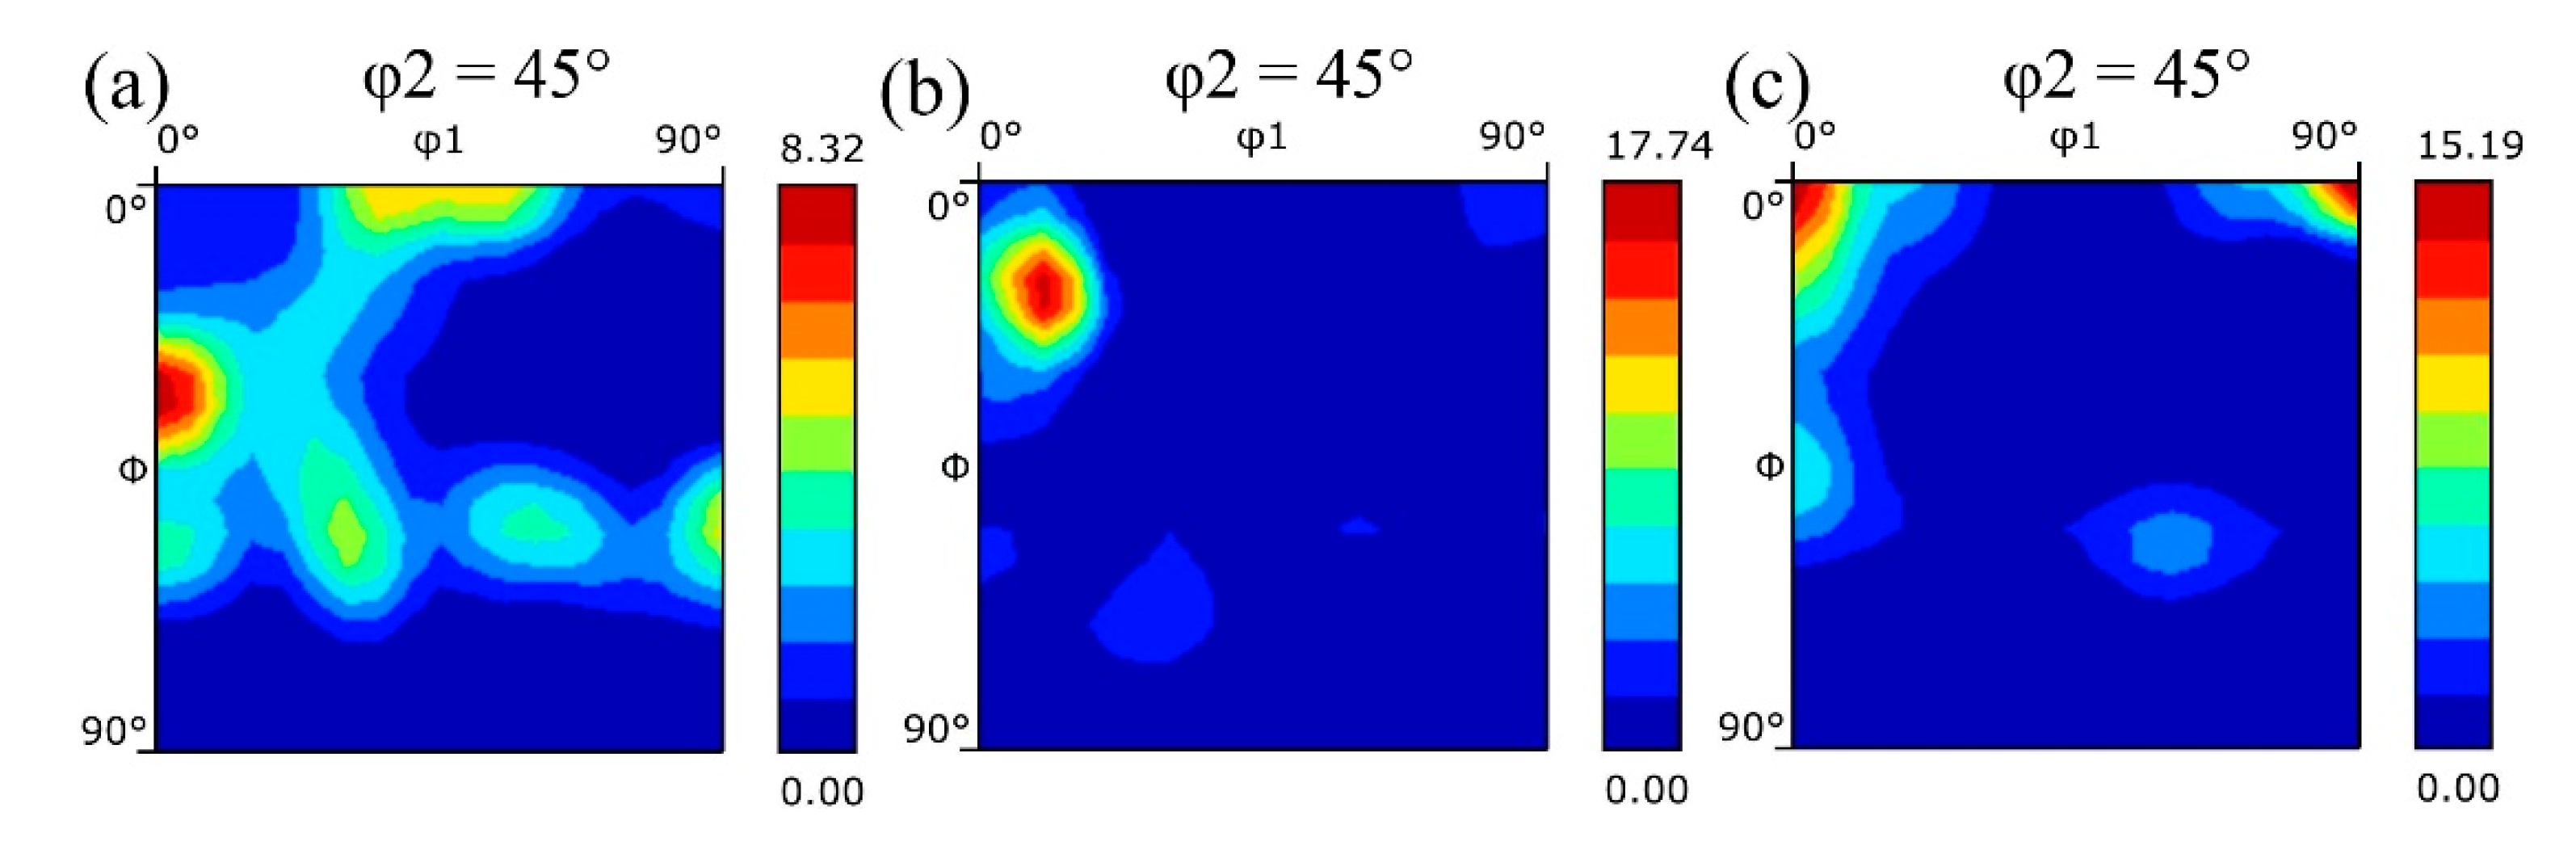
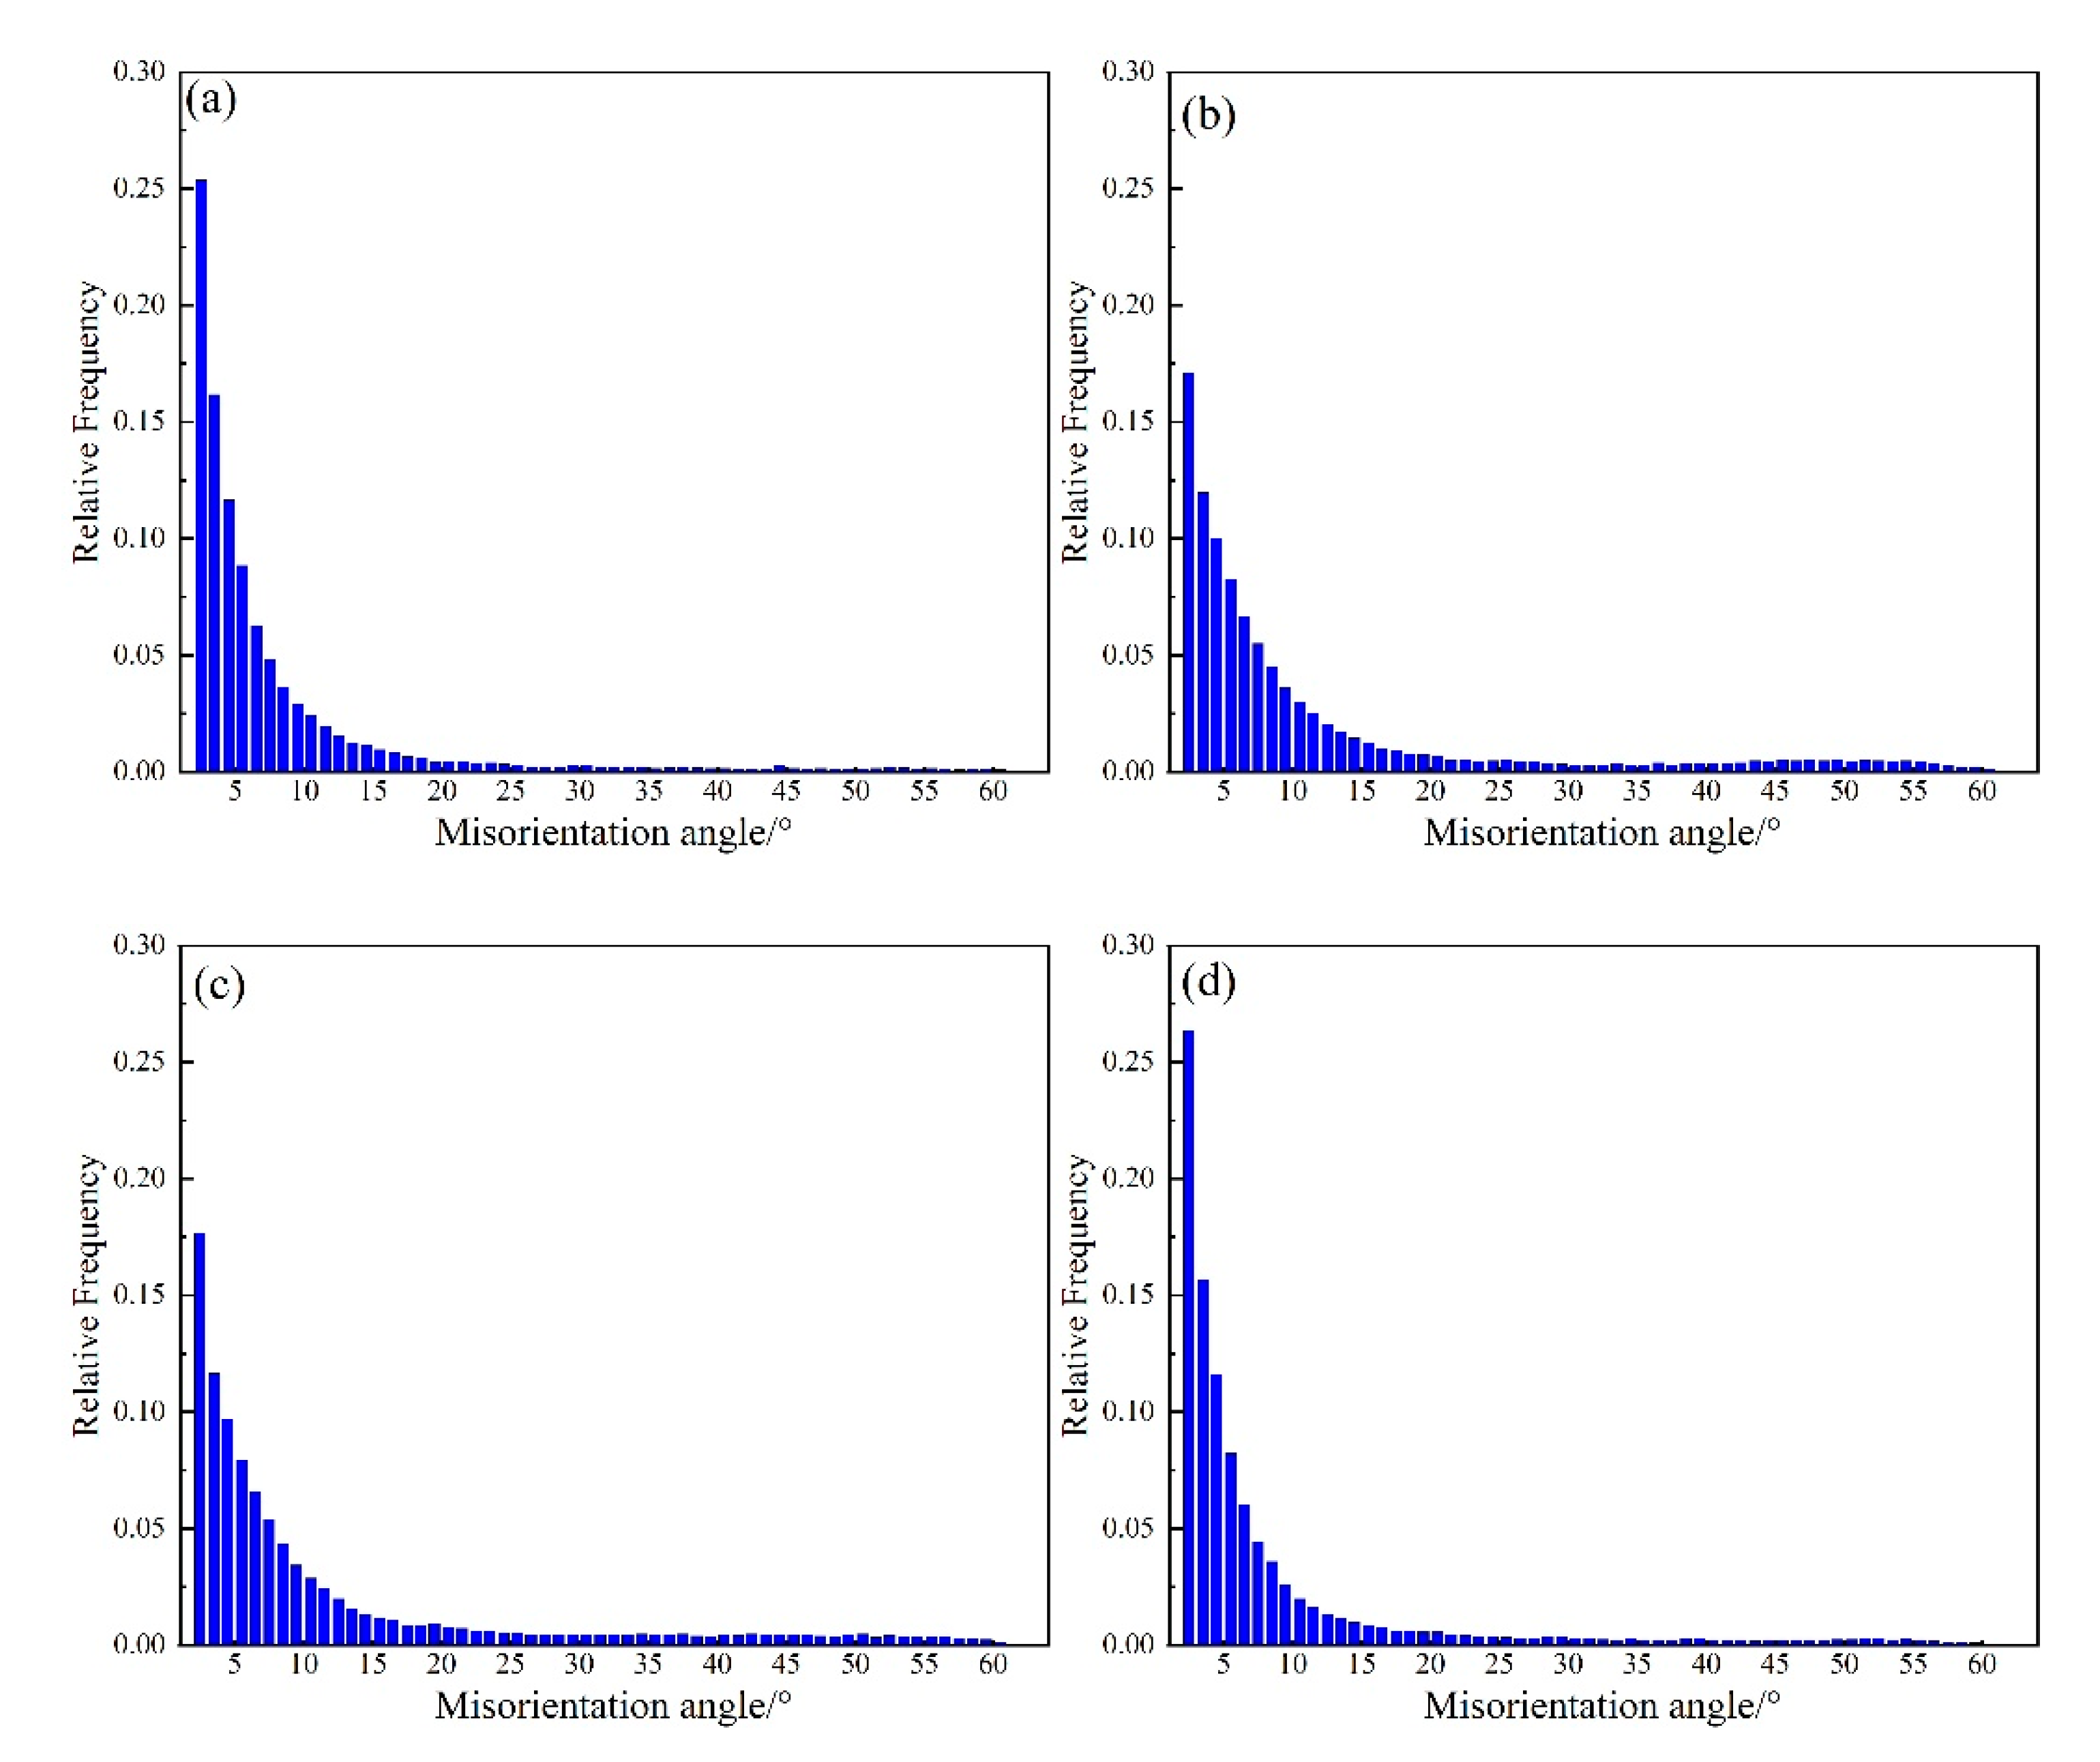
3.2. Evolution of Texture with Different Reduction Rates

The RD-TD surface ND inverse pole figure (IPF) orientation maps of IF steel under different reduction rates were characterized by EBSD, as shown Figure 3. The green orientation represents {110}<001> orientation, and the red orientation represents {112}<111> orientation. Figure 4 shows micro-textures of the samples under different reduction rates. RD-TD surface texture formed a strong Goss texture. The intensity of the Goss texture increases as the reduction rate increases. Under the reduction rate of 88%, the unique type of texture is Goss texture, as shown Figure 4a. However, there is also another texture located on ε fiber when reduction rate is 78% and 67%, as shown Figure 4b,c.
The macro-texture evolution in samples (rolled with different reduction rates) was characterized using XRD, as shown Figure 5. All samples display a strong texture with a peak near {110}<001> orientation (Goss texture). The strength of {110}<001> orientation decreases as the reduction rate decreases. The maximum strength is around 7.32 with an 88% reduction rate. The change in trend of macro-texture intensity is consistent with the change in trend of micro-texture intensity.
The RD-ND center ND IPF orientation maps of samples processed under different reduction rates were characterized using EBSD (Figure 6). The types of texture that evolved on the surface and on the center are different. The surface texture is typically a Goss texture. However, the center texture consists of α fiber texture (red orientation) and γ fiber texture (blue orientation). The strength of α texture increases with a decrease in the reduction rate, and the strength of γ texture decreases with a decrease in the reduction rate, as shown Figure 7. The α texture and γ texture are typical textures produced by the compression deformation of the ferrite region. From Figure 7, it can be found that {001}<110> will change to {112}<110> and {111}<110> orientation with increases in the reduction rate.

3.3. Evolution of Texture with Different Deformation Temperature

The RD-TD surface ND inverse pole figure (IPF) orientation maps of IF steel under different deformation temperatures were characterized by EBSD, as shown Figure 8. The main orientation focuses on Goss texture (green orientation) and ε fiber texture (red orientation). From Figure 9, it can be found that the intensity of Goss texture increases with the decrease in the deformation temperature. With decreases in deformation temperature, the texture gradually trends to a single Goss texture at a higher deformation temperature. In addition to the Goss texture, a strong Copper texture with {112}<111> orientation, which locates ε texture, is also formed.
Figure 10 shows the φ2 = 45° ODF figures of the samples without lubrication under different deformation temperature. For all of the samples, a strong {110} texture as well as strong {101}<001> component was formed at the surface. The highest intensity of Goss texture that appears in the deformation temperature is 700 °C. In addition to the Goss texture, there is a Copper texture with {112}<111> orientation that appears. The intensity of the Copper texture increases as the deformation temperature decreases.
Figure 11 shows the center IPF figure under a different deformation temperature. The microstructure is composed of deformed bands elongated along the rolling direction. It is obviously different from the texture of the RD-TD surface. The texture type of the center is mainly α fiber and γ fiber. From Figure 12, γ texture gradually disappears with the deformation temperature decrease. In the deformed grain with α texture, the main component is {112}<110> when the deformation temperature is 800 °C, and the main component is {001}<110> when the deformation temperature is 700 °C. With the deformation temperature decrease, the deformed grains are more likely to form {001}<110> orientation.

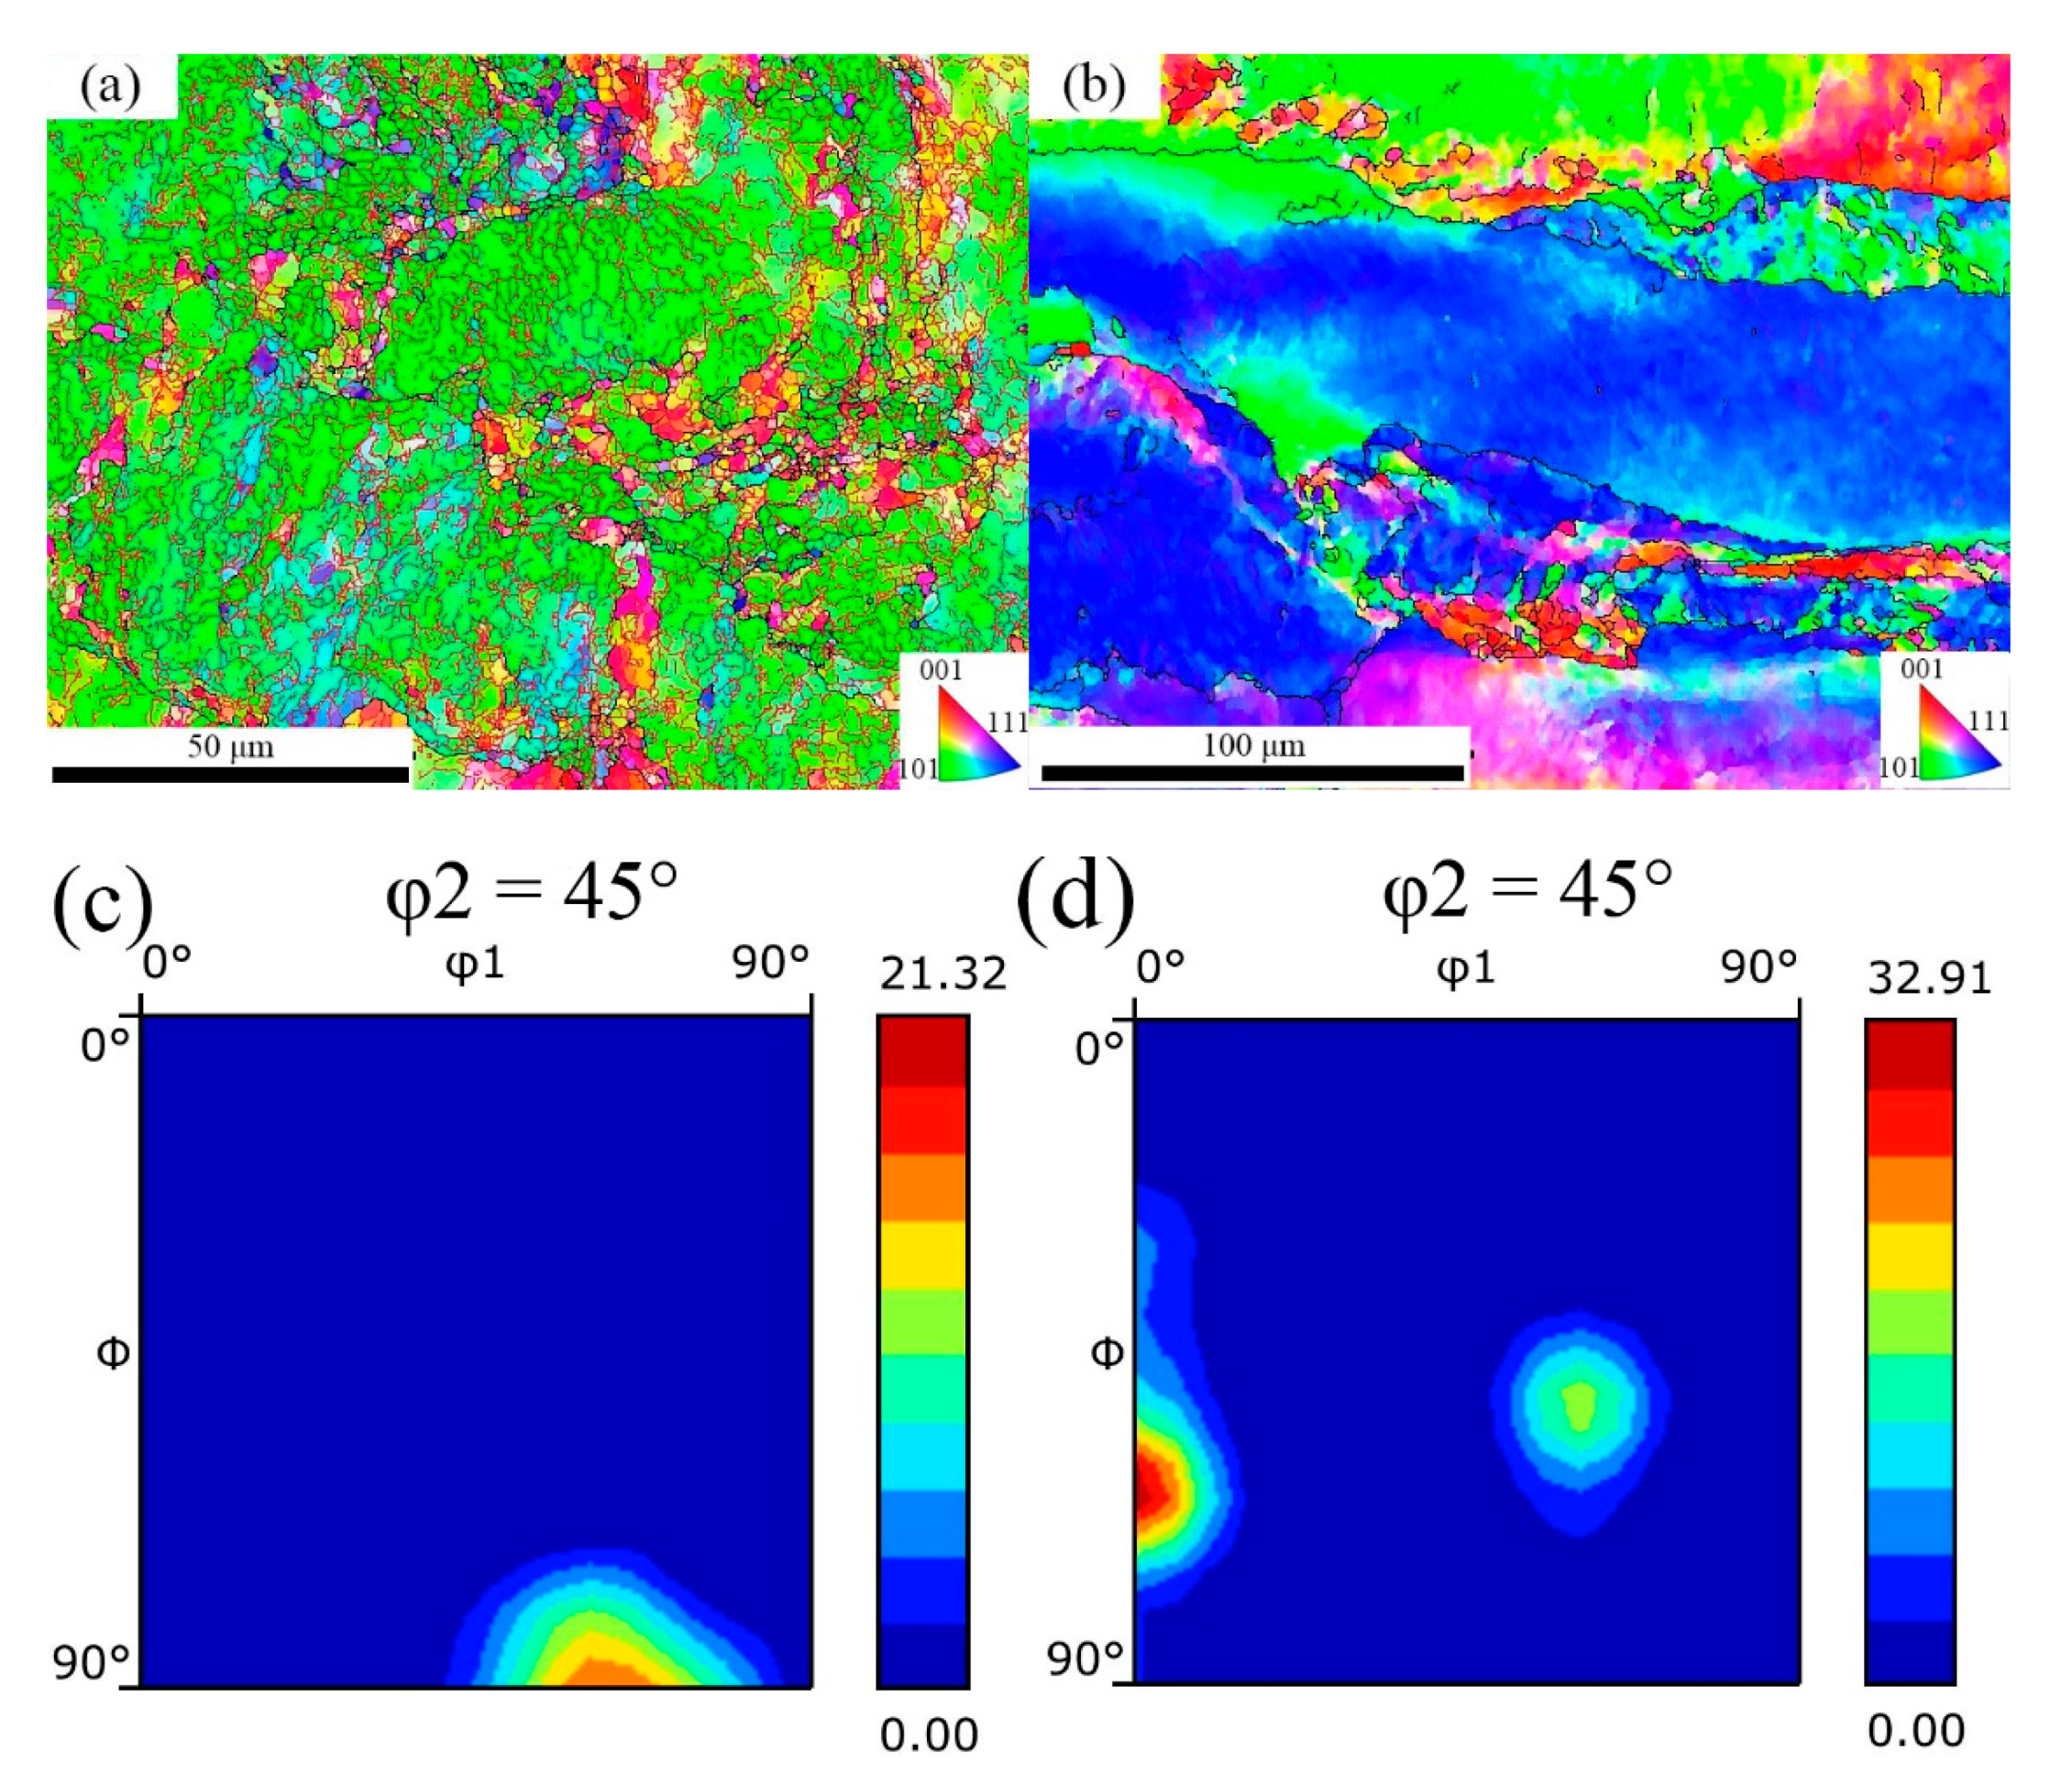
3.4. Influence of Lubrication on the Texture

The RD-TD surface ND IPF maps of IF steel samples rolled without lubrication and with lubrication are shown in Figure 13a,b. The surface texture without lubrication mainly consists of {110}<001> orientation. On the other hand, the surface texture with lubrication consists of {111}<110> and {203}< 3 42 ¯ > orientation, as shown in Figure 13c,d, represented by the blue color and green color in Figure 13b. During lubrication rolling, the surface has an obvious structure drawn along the rolling direction, indicating that the surface has undergone compression deformation. The usage of lubrication changes the texture from Goss texture to γ texture.
Figure 14 displays the φ2 = 45° section orientation distribution functions (ODFs) for the samples with different lubrication conditions in RD-TD surface. The sample without lubrication rolling presents a strong Goss fiber texture (see Figure 14a). However, the sample with lubrication rolling presents γ and α fiber textures (see Figure 14b). The γ fiber texture focuses on {111}<110> and {554}<225> orientation. The surface texture in the sample with lubrication is significantly different from the one without lubrication.

4. Discussion

The deep drawing performance of a steel plate usually refers to its ability to resist thickness reduction, and the r-value is used to indicate its deep drawing performance. The r-value is closely related to the grain orientation in the steel sheet. Table 3 shows the relationship between each texture component and r-value [23]. Δr is the plastic strain anisotropy index of the plate surface. The larger the Δr, the more serious the plastic strain anisotropy of the plate surface, which makes the sample more prone to ears, resulting in poor formability. From Table 3, it is observed that {111}<110> and {111}<112> textures are beneficial to increase the r-value, without increasing the Δr value. These compositions belong to the γ texture, as shown in Figure 2. Therefore, obtaining a strong γ texture may significantly improve the deep drawing performance of the steel plate. The samples rolled with lubrication have a higher r-value compared to the samples rolled without lubrication. The main reason is that the samples rolled with lubrication have a strong {111}<112> and {111}<110> texture. the samples rolled without lubrication have a strong {110}<001> texture. The γ texture is a stable orientation of BCC structure during compression. The {110}<001> texture is formed due to shear deformation. In order to obtain a high r-value, shear deformation should be avoided as much as possible during the rolling process.
Under the non-lubricated condition, the Goss texture of the RD-TD surface is produced mainly due to the shear deformation caused by friction, and the intensity of the Goss texture increases with the increase in the reduction rate. The increase in the reduction rate also increases the rolling force (at the same deformation temperature), and the decrease in the deformation temperature also increases the rolling force (at the same reduction rate). The higher rolling force leads to higher friction between the roll and the surface, which causes severe shear deformation of the surface and produces a stronger Goss texture [13]. The degree of shear deformation is proportional to the friction. The result is that a high reduction rate (88%) and low deformation temperature (700 °C) will cause more severe shear deformation. This further increases the intensity of the Goss texture and deteriorates the r-value.
The distribution of misorientation angles along the grain boundaries of the samples rolled with different parameters was measured by EBSD (Figure 15). In this paper, angles greater than 2° and less than 15° were considered as low angle grain boundaries (LAGBs). The fractions of LAGBs are 88.1%, 78.5%, 77%, and 85.8%, and are shown in Figure 15a–d, respectively. The fractions of LAGBs decrease as the reduction rate decreases, which means that the degree of surface deformation decreases gradually with a decrease in the reduction rate. The content of LAGBs increased by 7.3% at 700 °C compared to 800 °C (at a constant reduction rate). This is attributed to the higher rolling force caused by a lower deformation temperature, which may increase the amount of LAGBs. On the other hand, the increase in the reduction rate may also increase the shear deformation of the grains along the thickness direction, which may result in a smaller area of compressive deformation (in the thickness direction), leading to a reduction in the proportion of γ texture. Hence, a decrease in the value of r is observed as the reduction rate increases.
Since the r-value was measured on the annealed samples, the texture of the sample after 3h annealing at 750 °C will be discussed, and the ND IPF maps are shown in Figure 16. Equiaxed grain formation after recrystallization and growth is observed after the annealing of the samples. The RD-TD surface ND IPF maps of the samples are shown in Figure 16a,b. The texture type after annealing is the same as the deformed state, which ascertains that annealing does change the type of texture. The RD-TD center ND IPF maps of the samples are shown in Figure 16c,d. It is seen that the texture in the center is completely different from the surface texture, and a relatively strong γ texture is observed in the center. The amount of the γ texture (blue) is higher than that of the α texture (red). However, the earlier results (Figure 6 and Figure 7) showed a higher content of α texture than the γ texture. Hence, the results obtained after annealing (Figure 16c,d) indicate that during the annealing process, the α texture disappears, and the γ texture increases. The main reason is that the deformation energy stored in the two textures is different. The deformation energy stored in the γ texture is higher than the α texture [24]. As a result, the γ texture preferentially nucleates and recrystallizes, and further grows due to the size advantage (during the growth stage). This is beneficial for the deep drawing performance of the steel plate.
In the lubricated rolling process, the texture type of the surface forms a strong γ texture (Goss texture disappeared), as shown in Figure 13b. This is because with lubrication, the shear deformation of the surface becomes weaker, and the compression deformation is increased, leading to a transformation from the Goss texture to the γ texture. Texture intensity along the γ fiber of the surface and center of samples rolled with lubrication was measured using the EBSD data and is illustrated in Figure 17. These results indicate the formation of {111}<112> texture on the surface with lubrication, and a further enhancement of the {111}<112> texture in the center of the samples. The usage of lubrication significantly improves the texture along the thickness and reduces the shear strain on the surface. Earlier reports also suggest that the usage of lubrication may reduce the amount of shear band by 32.3% more than the non-lubricated one [22], which may significantly improve the deep drawing performance of the steel plate. If the non-lubricated surface is removed by 1/4th of thickness, the r-value can be increased by 0.3 [25].

5. Conclusions

In this paper, the effect of reduction rate, deformation temperature, and lubrication on texture were studied. Three different deformation temperature and reduction rates were set in the experiment. At the same time, a sample using lubricated rolling was set up. The main conclusions are as follows:
  • Under the condition of non-lubricated rolling, the r-value of the steel plate increased with the decrease in the reduction rate. However, the r-value was lower comparatively (maximum 0.85). However, in lubricated rolling, the r-value of the steel plate increased from 0.74 to 1.47 under the same deformation condition.
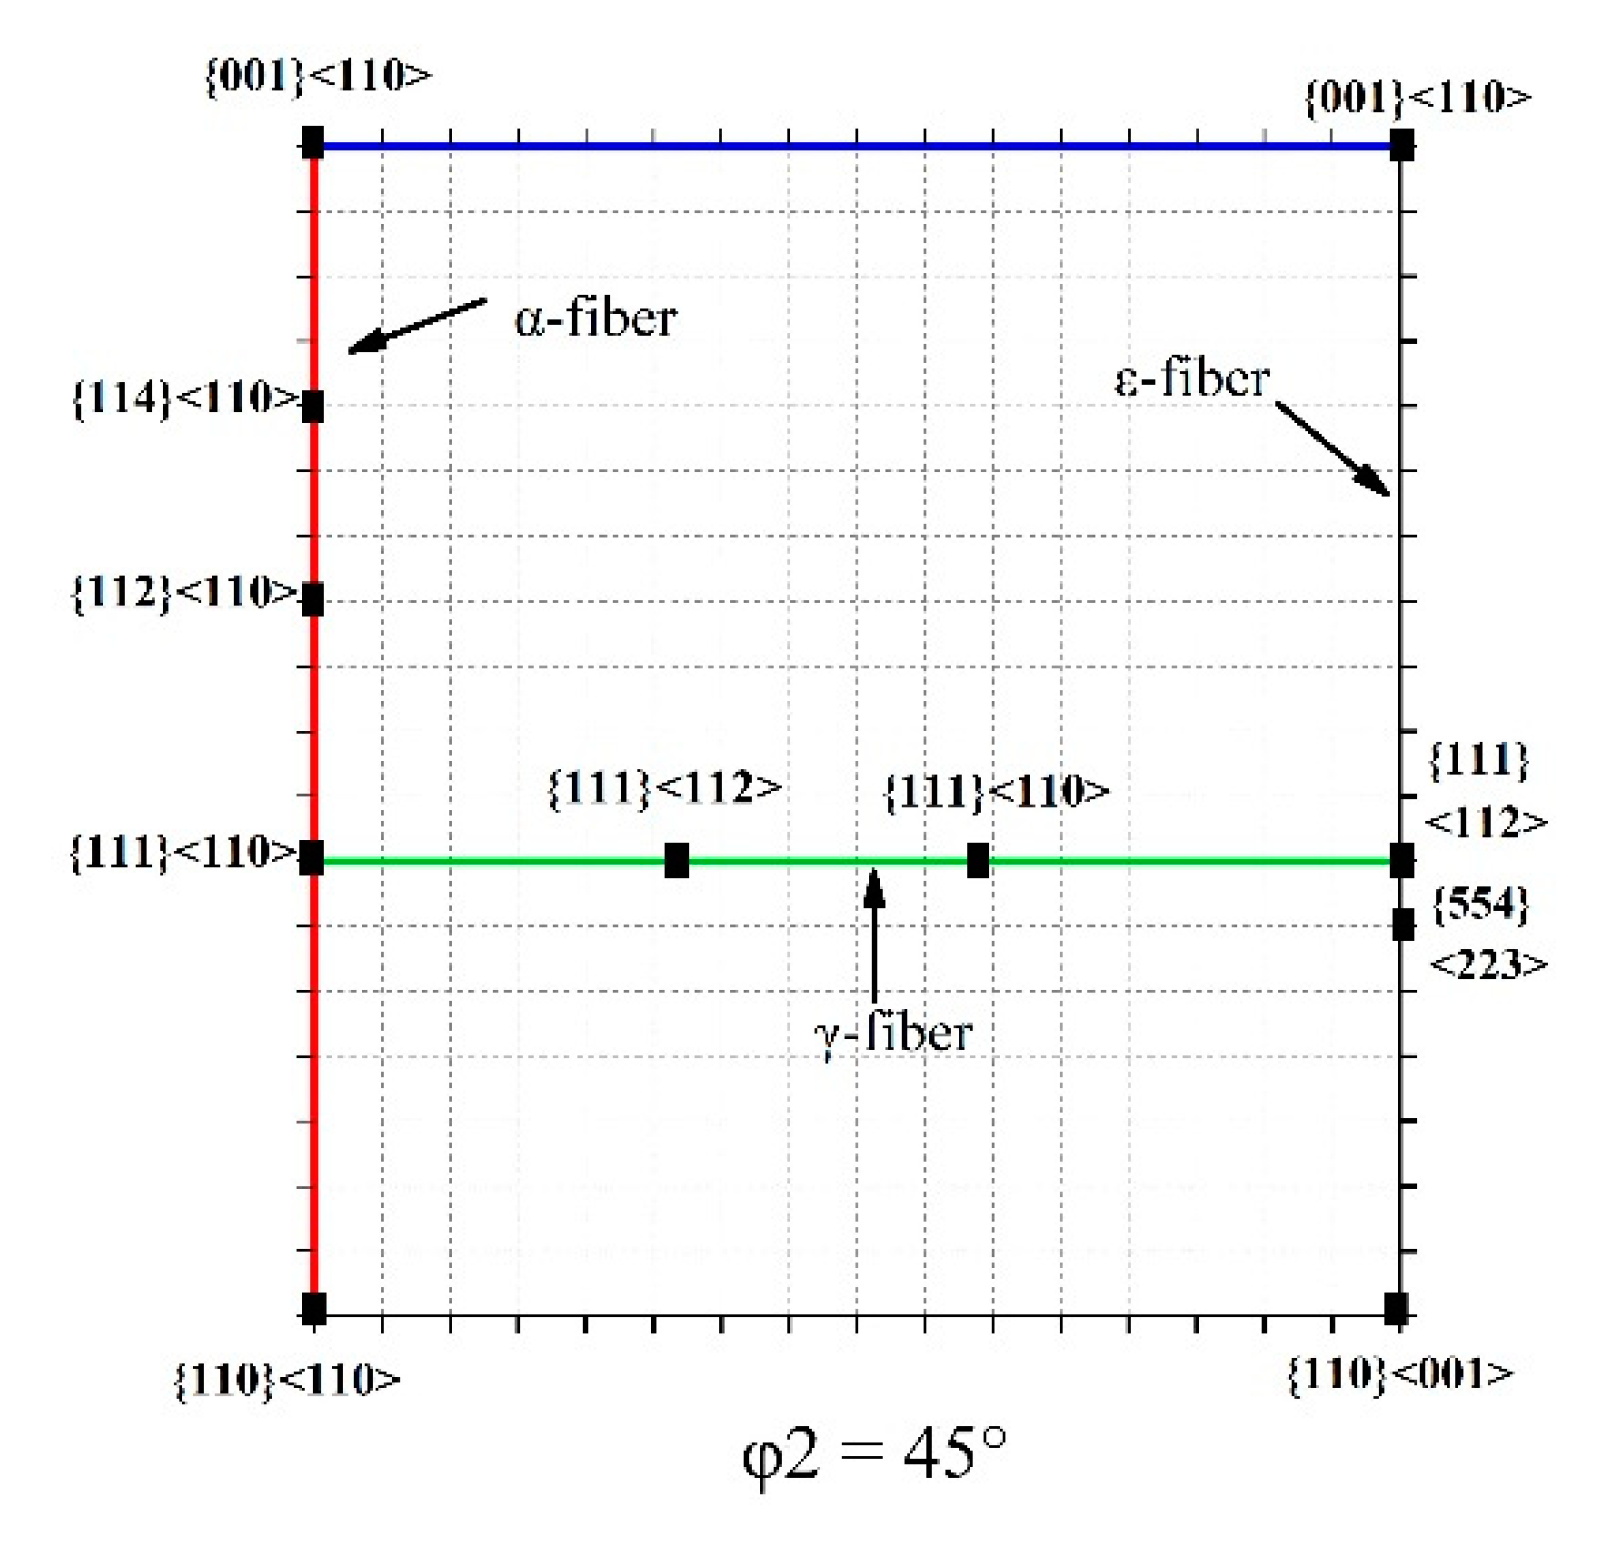
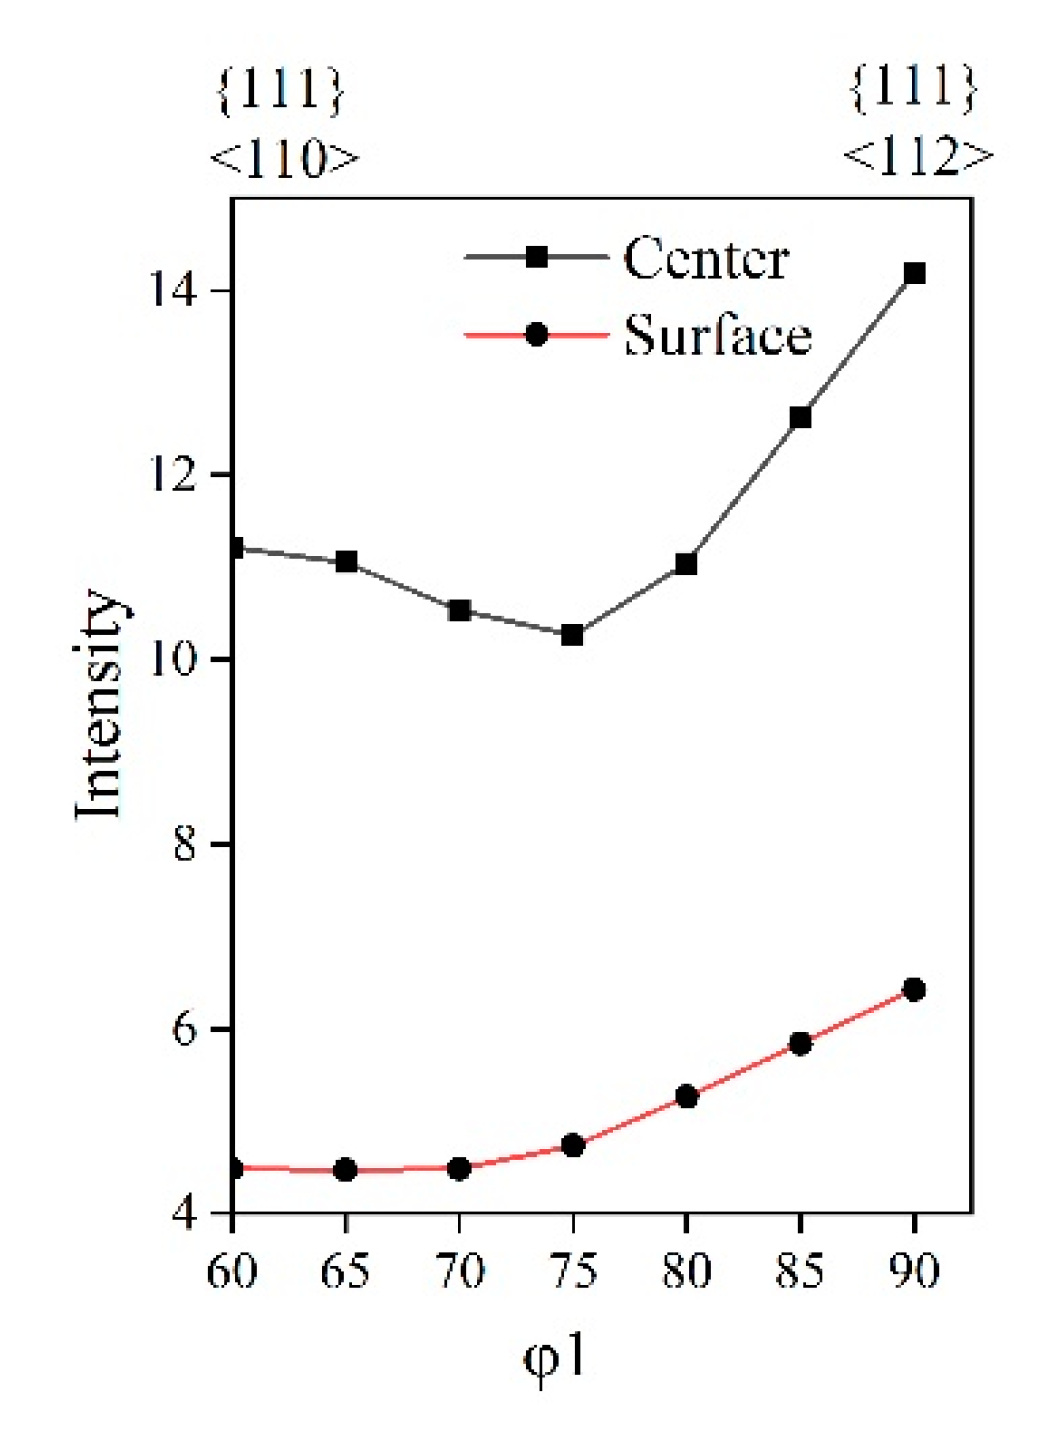
  • Under the non-lubricated rolling condition, due to the friction generated shear deformation of the steel surface, the Goss texture was produced, and its strength decreased with the decrease in the reduction rate, and increased with the decrease in the deformation temperature. The center of the steel plate showed a γ texture of moderate strength under non-lubrication. The lubricated rolling reduced the shear deformation of the steel surface, forming a weak γ texture on the surface and a strong γ texture at the center, which improved the uniformity of the texture along the thickness. Hence, it was found that lubrication affects the texture formation, and, in turn, affects the r-value or the deep drawing performance of the IF steel.

Author Contributions

Conceptualization and methodology, L.L., H.W. and X.M.; investigation, L.L. and Y.F.; data curation, L.L. and Y.F.; writing—reviewing and editing, L.L. and H.W.; project administration, Z.C., S.W., H.W. and Y.L. All authors have read and agreed to the published version of the manuscript.

Funding

This work was funded by Guangxi Science and Technology Major Project (Grant No. AA18242012-1) and Beijing Municipal Education Commission Project (Grant No. BLMMPMT-2020-0001).

Institutional Review Board Statement

Not applicable.

Informed Consent Statement

Not applicable.

Data Availability Statement

Data are contained within the article.

Acknowledgments

The authors gratefully acknowledge the financial support of Guangxi Science and Technology Major Project (Grant No. AA18242012-1) and Beijing Municipal Education Commission Project (Grant No. BLMMPMT-2020-0001).

Conflicts of Interest

The authors declare no conflict interest.

References

  1. Máthis, K.; Krajňák, T.; Kužel, R.; Gubicza, J. Structure and mechanical behaviour of interstitial-free steel processed by equal-channel angular pressing. J. Alloys Compd. 2011, 509, 3522–3525. [Google Scholar] [CrossRef]
  2. Ghosh, P.; Bhattacharya, B.; Ray, R.K. Comparative study of precipitation behavior and texture formation in continuously annealed Ti and Ti+Nb added interstitial-free high-strength steels. Scr. Mater. 2008, 58, 939–942. [Google Scholar] [CrossRef]
  3. Jamaati, R. Annealing texture of nanostructured IF steel. Mater. Charact. 2015, 106, 411–419. [Google Scholar] [CrossRef]
  4. Kamikawa, N.; Sakai, T.; Tsuji, N. Effect of redundant shear strain on microstructure and texture evolution during accumulative roll-bonding in ultralow carbon IF steel. Acta Mater. 2007, 55, 5873–5888. [Google Scholar] [CrossRef]
  5. Gazder, A.A.; Sánchez-Araiza, M.; Jonas, J.J.; Pereloma, E.V. Evolution of recrystallization texture in a 0.78 wt.% Cr extra-low-carbon steel after warm and cold rolling. Acta Mater. 2011, 59, 4847–4865. [Google Scholar] [CrossRef]
  6. Eloot, K.; Okuda, K.; Sakata, K.; Obara, T. Texture Evolution during Cold Rolling and Recrystallisation of IF Steel with a Strong {111} Hot Band Texture. ISIJ Int. 1998, 38, 602–609. [Google Scholar] [CrossRef]
  7. Li, B.L.; Godfrey, A.; Meng, Q.C.; Liu, Q.; Hansen, N. Microstructural evolution of IF-steel during cold rolling. Acta Mater. 2004, 52, 1069–1081. [Google Scholar] [CrossRef]
  8. Deeparekha, N.; Gupta, A.; Demiral, M.; Khatirkar, R.K. Cold rolling of an interstitial free (IF) steel—Experiments and simulations. Mech Mater. 2020, 148, 103420. [Google Scholar] [CrossRef]
  9. Barnett, M.R. Role of In-grain Shear Bands in the Nucleation of //ND Recrystallization Textures in Warm Rolled Steel. ISIJ Int. 1998, 38, 78–85. [Google Scholar] [CrossRef] [Green Version]
  10. Barnett, M.R.; Jonas, J.J. Influence of Ferrite Rolling Temperature on Grain Size and Texture in Annealed Low C and IF Steels. ISIJ Int. 1997, 37, 706–714. [Google Scholar] [CrossRef]
  11. Huang, A.K.; Wang, Z.G.; Liu, X.; Yuan, Q.Q.; Ye, J.Y.; Zhang, Y.H. Dynamic strain aging and serrated flow behavior of Cr-Ti-B low carbon steel during warm deformation. Mater. Charact. 2021, 172, 110828. [Google Scholar] [CrossRef]
  12. Wang, Z.D.; Guo, Y.H.; Sun, D.Q.; Liu, X.H.; Wang, G.D. Texture comparison of an ordinary IF steel and a high-strength IF steel under ferritic rolling and high-temperature coiling. Mater. Charact. 2006, 57, 402–407. [Google Scholar] [CrossRef]
  13. Um, K.K.; Jeong, H.T.; An, J.K.; Lee, D.N.; Kim, G.; Kwon, O. Effect of Initial Sheet Thickness on Shear Deformation in Ferritic Rolling of IF-Steel Sheets. ISIJ Int. 2000, 40, 58–64. [Google Scholar] [CrossRef] [Green Version]
  14. Hu, X.W.; He, G.N.; Peng, H.; Jiang, B.; Zhang, C.L.; Liu, Y.Z. Microstructures and Mechanical Properties of Low Carbon Steel Hot Rolled in Ferrite Region Based on CSP Line. Steel Res. Int. 2019, 90, 7. [Google Scholar] [CrossRef]
  15. Barnett, M.R.; Jonas, J.J. Distinctive Aspects of the Physical Metallurgy of Warm Rolling. ISIJ Int. 1999, 39, 856–873. [Google Scholar] [CrossRef]
  16. Akbari, G.H.; Sellars, C.M.; Whiteman, J.A. Microstructural development during warm rolling of an IF steel. Acta Mater. 1997, 45, 5047–5058. [Google Scholar] [CrossRef]
  17. Han, F.T.; Wang, Z.C.; Jing, C.N.; Liu, X.M.; Su, J.; Zhang, S.Y. Microstructure and Microtexture Evolution during Batch Annealing of Warm-Rolled Ti-IF Steel Sheets. Appl. Mech. Mater. 2013, 331, 443–447. [Google Scholar] [CrossRef]
  18. Barnett, M.R.; Kestens, L. Formation of {111} and {111} Textures in Cold Rolled and Annealed IF Sheet Steel. ISIJ Int. 1999, 39, 923–929. [Google Scholar] [CrossRef]
  19. Samajdar, I.; Verlinden, B.; Houtte, P.V.; Vanderschueren, D. γ-Fibre recrystallization texture in IF-steel: An investigation on the recrystallization mechanisms. Mater. Sci. Eng. A 1997, 238, 343–350. [Google Scholar] [CrossRef]
  20. Jia, M.X.; Lü, Y.P.; Xu, L.F.; Song, Y.P. The Influence of Friction on the Texture Formation of a IF Steel during Hot Rolling in the Ferrite Region. Steel Res. Int. 2013, 84, 761–765. [Google Scholar] [CrossRef]
  21. Bateni, M.R.; Szpunar, J.A.; Wang, X.; Li, D.Y. The effect of wear and corrosion on internal crystalline texture of carbon steel and stainless steel. Wear 2005, 259, 400–404. [Google Scholar] [CrossRef]
  22. Kong, N.; Zhang, J.; Li, H.B.; Wei, B.Y.; Mitchell, D.R. The Influence of a Novel Inorganic-Polymer Lubricant on the Microstructure of Interstitial-Free Steel During Ferrite Rolling. Metals 2020, 10, 178. [Google Scholar] [CrossRef] [Green Version]
  23. Daniel, D.; Jonas, J.J. Measurement and prediction of plastic anisotropy in deep-drawing steels. Metall. Trans. A 1990, 21, 331. [Google Scholar] [CrossRef]
  24. Kapoor, I.; Lan, Y.J.; Rijkenberg, A.; Li, Z.S.; Janik, V. Quasi in-situ analysis of geometrically necessary dislocation density in α-fiber and γ-fiber during static recrystallization in cold-rolled low-carbon microalloyed steel. Mater. Charact. 2018, 145, 686–696. [Google Scholar] [CrossRef] [Green Version]
  25. Gladkovsky, S.V.; Kuteneva, S.V.; Kamantsev, I.S.; Sergeev, S.N.; Safarov, I.M. Effect of plastic deformation on the structure and mechanical properties of an ultra-low carbon interstitial-free steel in the monolithic material and as a component of a sandwich composite. Phys. Metal Metallogr. 2016, 117, 1070–1077. [Google Scholar] [CrossRef]
Figure 1. Sample geometry for EBSD (electron backscatter diffraction) and XRD (X-ray diffraction) investigation.
Metals 11 01341 g001
Figure 2. Typical texture components of IF steel in φ2 = 45° ODF (orientation distribution function) section.
Metals 11 01341 g002
Figure 3. EBSD surface IPF (inverse pole figure) orientation maps of samples rolled with different reduction rates; (a) 800 °C—88%, (b) 800 °C—78%, (c) 800 °C—67%.
Metals 11 01341 g003
Figure 4. φ2 = 45° ODF sections showing surface textures (a) 800 °C—88%, (b) 800 °C—78%, (c) 800 °C—67%.
Metals 11 01341 g004
Figure 5. Macro-texture (φ2 = 45° section of ODF) of samples rolled with different reduction rates (a) 800 °C—88%, (b) 800 °C—78%, (c) 800 °C—67%.
Metals 11 01341 g005
Figure 6. EBSD center IPF orientation maps of samples rolled with different reduction rates (a) 800 °C—88%, (b) 800 °C—78%, (c) 800 °C—67%.
Metals 11 01341 g006
Figure 7. φ2 = 45° ODF sections showing center textures (a) 800 °C—88%, (b) 800 °C—78%, (c) 800 °C—67%.
Metals 11 01341 g007
Figure 8. EBSD surface IPF orientation maps of samples rolled with different deformation temperature (a) 800 °C—78%, (b) 750 °C—78%, (c) 700 °C—78%.
Metals 11 01341 g008
Figure 9. φ2 = 45° ODF sections showing surface textures (a) 800 °C—78%, (b) 750 °C—78%, (c) 700 °C—78%.
Metals 11 01341 g009
Figure 10. Macro-texture (φ2 = 45° section of ODF) of samples rolled with different reduction rates (a) 800 °C—78%, (b) 750 °C—78%, (c) 700 °C—78%.
Metals 11 01341 g010
Figure 11. EBSD center IPF orientation maps of samples rolled with different reduction rates (a) 800 °C—78%, (b) 750 °C—78%, (c) 700 °C—78%.
Metals 11 01341 g011
Figure 12. φ2 = 45° ODF sections showing center textures (a) 800 °C—78%, (b) 750 °C—78%, (c) 700 °C—78%.
Metals 11 01341 g012
Figure 13. EBSD IPF orientation maps of lubricated and non-lubricated samples; surface map of (a) 700 °C—78%, (b) 700 °C—78%—1, (c) 700 °C—78% φ2 = 45° ODF sections showing surface textures, (d) 700 °C—78%—1 φ2 = 45° ODF sections showing surface textures.
Metals 11 01341 g013
Figure 14. Macro-texture (φ2 = 45°section of ODF) of samples rolled with different lubrication condition (a) 700 °C—78%, (b) 700 °C—78%—1.
Metals 11 01341 g014
Figure 15. Misorientation angle distribution under different rolling parameters (a) 800 °C—88%, (b) 800 °C—78%, (c) 800 °C—67%, (d) 700 °C—78%.
Metals 11 01341 g015
Figure 16. EBSD IPF orientation maps of IF steel after annealing; surface map of (a) 800 °C—88% and (b) 800 °C—78%; center map of (c) 800 °C—88% and (d) 800 °C—78%.
Metals 11 01341 g016
Figure 17. Texture intensity along the γ fiber of the surface and center layer of samples rolled with lubrication.
Metals 11 01341 g017
Table 1. Chemical composition of interstitial free (IF) steel (wt%).
CSiMnSPTi
0.00350.0050.2250.00970.0110.067
Table 2. Deep drawing properties of the IF steel under different rolling conditions.
SampleLubricated RollingrΔr
800 °C—88%No0.690.08
800 °C—78%No0.830.28
800 °C—67%No0.850.26
750 °C—78%No0.710.21
700 °C—78%No0.740.16
700 °C—78%—1Yes1.470.78
Table 3. Relationship between the r-value and texture composition [23].
Texture ComponentsrΔr
{001}<110>0.4−0.8
{112}<110>2.1−2.7
{111}<110>2.60
{111}<112>2.60
{554}<225>2.61.1
{011}<001>5.18.9
Publisher’s Note: MDPI stays neutral with regard to jurisdictional claims in published maps and institutional affiliations.

