Article

Deformation-Induced Grain-Interior α Precipitation and β Texture Evolution during the β-Processed Forging of a Near-β Titanium Alloy

1
National Institute for Materials Science, 1-2-1 Sengen, Tsukuba 305-0047, Ibaraki, Japan
2
College of Materials Science and Engineering, Taiyuan University of Technology, No.79 West Street Yingze, Taiyuan 030024, China
*
Author to whom correspondence should be addressed.
Metals 2021, 11(9), 1405; https://doi.org/10.3390/met11091405
Submission received: 13 August 2021 / Revised: 2 September 2021 / Accepted: 3 September 2021 / Published: 6 September 2021

Abstract

:
The effect of grain-interior α precipitation on the β texture evolution of the near-β Ti-6246 alloy during through-transus forging was investigated in two-step sequential forgings. The microstructure and texture were analyzed using scanning electron microscopy, electron-backscatter diffraction, and X-ray diffraction. The previous β forging was performed at 1253 K at 0.01/s, while the subsequent forging in the (α + β) region was conducted at 1073 K at 0.01/s. The forging in the β region facilitated the penetration of the interior α phase into β grains and reduced the formation of grain boundary α. The {001} texture intensity increased during the forging in the single β region. By contrast, the increase in the {001} texture intensity was moderate at a lower temperature (1073 K) because the Schmid factor (SF) value of the {110}<111> slip system drastically decreased, but those of the {112}<111> and {123}<111> slip systems increased before α precipitation. During α precipitation for all β forging ratios, the {110}<111> slip system was activated, resulting in a lowering of the {001} texture intensity. The lower the forging temperature before interior α precipitation under a constant total forging ratio, the more the {001} texture intensity was suppressed in the final β texture, accompanied by interior α precipitation.

1. Introduction

Near-β titanium alloys are used for compressor disks in jet engines because of their high strength and high fracture toughness. The compressor disk is usually produced using β-processed die forging, followed by cooling to room temperature. During cooling, continuous α layers develop at grain boundaries (GBs) [1,2], which might assume crack propagation paths [3]. To minimize the formation of harmful continuous α layers at GBs in the process, “through-transus” forging has been reported, in which the material temperature is lowered from the β single-phase region to the (α + β) dual-phase region through the β-transus temperature, Tβ, during forging [4]. The through-transus forging leads to the formation of α layers being broken up into individual segments on the GBs. The interior Widmanstätten α phase and spherical α phase precipitate within β grains and grow during deformation in the (α + β) dual-phase region, followed by subsequent cooling [3,5].
Deformation texture is formed during deformation, as well. The deformation of the β phase in a single β region results in a strong {001} texture, with the {001} crystal planes perpendicular to the forging direction (FD), whereas {001} and {111} textures develop in the (α + β) region [6]. The β texture is formed as a result of a lattice rotation caused by the accumulated dislocations that glide along the <111> direction on the {110}, {123}, or {123} slip plane [6,7]. There have been few reports on the effect of α formation on the body-centered cubic (bcc) texture evolution during deformation in near-β titanium alloys. Another study [8] by the same authors showed that the increase in {001} texture intensity was inhibited by α precipitation during the β-processed forging in Ti-6246 alloy. This is because the most active hexagonal close-packed (hcp) slip system was {10–11}<11–20> in the α phase, while the α precipitation predominantly activated the {110}<111> bcc slip system through slip transmission between α and β phases under the Burgers orientation relationship [9]. It was demonstrated that the formation of GB α did not affect the β phase texture evolution; however, interior α precipitation inhibited and reduced the {001} β phase’s texture intensity, although the interior α precipitation amount was limited. To achieve the desired properties of the components, controlling the amount of interior α precipitation is critical. Slip transmission between α and β phases depends on α phase volume fraction, which in turn affects the {001} texture intensity in the β phase. It is known that the more deformed and the lower the temperature, the more the α phase precipitates [9]. In this study, the effect of the deformation ratio between the β and (α + β) regions on the α phase formation, and the effect of the promoted interior α precipitation on the β texture evolution, were investigated using Ti-6246 alloy in the two-step sequential forgings at the single β and (α + β) regions. In the two-step forging, the second (α + β) forging was conducted at 1073 K, which is 148 K below the β transus temperature.

2. Materials and Methods

The (α + β) forged-billet (203 mm in diameter, 171 mm in height) of Ti-6246 alloy was supplied by TIMET Co. The chemical composition of the billet is shown in Table 1. The Tβ was measured to be 1221 K, which was described in the approved TIMET Co. certificate. Cylindrical specimens (8 mm in diameter, 12 mm in height) were machined from the as-received billet along a consistent axial direction. The top, bottom, and lateral surfaces were polished using #1200-grit SiC paper. Uniaxial forging tests were performed under vacuum using a Thermecmastor-Z system (Fuji Electronic Industrial Co., Ltd., Saitama, Japan). An R-type thermocouple was welded on the lateral surface at one-half the height of the specimen to measure the specimen temperature. The mica plates were placed on the top and bottom of the specimen as lubricants.
Figure 1 depicts a schematic of the forging tests used in this study. Specimens were heated from room temperature to 1253 K in the β region at 10 K/s and were equilibrated for 600 s at 1253 K. Following that, specimens were uniaxially forged at 1253 K at a strain rate of 0.01/s and cooled to 1073 K in the (α + β) region at −10 K/s. The specimens were then forged at 1073 K with a strain rate of 0.01/s before being gas-quenched to room temperature with He gas. After forging by 15% at 1253 K, subsequent forging by 15%, 30%, 45%, and 60% at 1073 K (hereafter described as 15–15%, 15–30%, 15–45%, and 15–60%) was conducted. Here, the forging ratio for the second (α + β) forging at 1073 K was expressed as the ratio of the height reduction for the second forging to the specimen's initial height before β forging (12 mm). Other forging ratios were 30–15%, 30–30%, and 30–45%. Forgings were conducted exclusively at 1073 K in the (α + β) region after heat treatment without deformation at 1253 K in the β region (i.e., 0–15%, 0–30%, 0–45%, 0–60%, and 0–75%). In addition, the forgings were also performed only at 1253 K following heat treatment at 1253 K in the β region to address the change of the Schmid factor (SF) value [10] of the slip systems in the β phase. The maximum total forging ratio was 75% in the present study.
The forged specimens were cut using an automatic fine-cutting machine and were metallographically polished. The microstructure at the center region of the FD-radial direction (RD) plane was analyzed using scanning electron microscopy (SEM, JEOL JSM-7001F) and electron backscatter diffraction (EBSD) observations (attached to the SEM). The acceleration voltage was 20 kV and the step sizes were 0.7, 0.15 and 0.04 μm for areas of 500 μm × 200 μm, 100 μm × 40 μm, and 30 μm × 10 μm, respectively. The Orientation Imaging Microscopy Analysis V7 software was used to process the EBSD orientation data. The average SF values for the α and β phases were obtained using this software by averaging the SF values of all the measurement points for each phase in the scanned area. Furthermore, the forged specimens were cut and polished at one-half the height of the specimen. X-ray diffraction (XRD) analysis was performed using an X-ray diffractometer (RIGAKU RINT-2200) equipped with a Cu Kα radiation source operated at an acceleration voltage of 40 kV. The peak positions were identified and the α phase volume fraction was calculated based on the peak-area ratio using the JADE software [11].

3. Results and Discussion

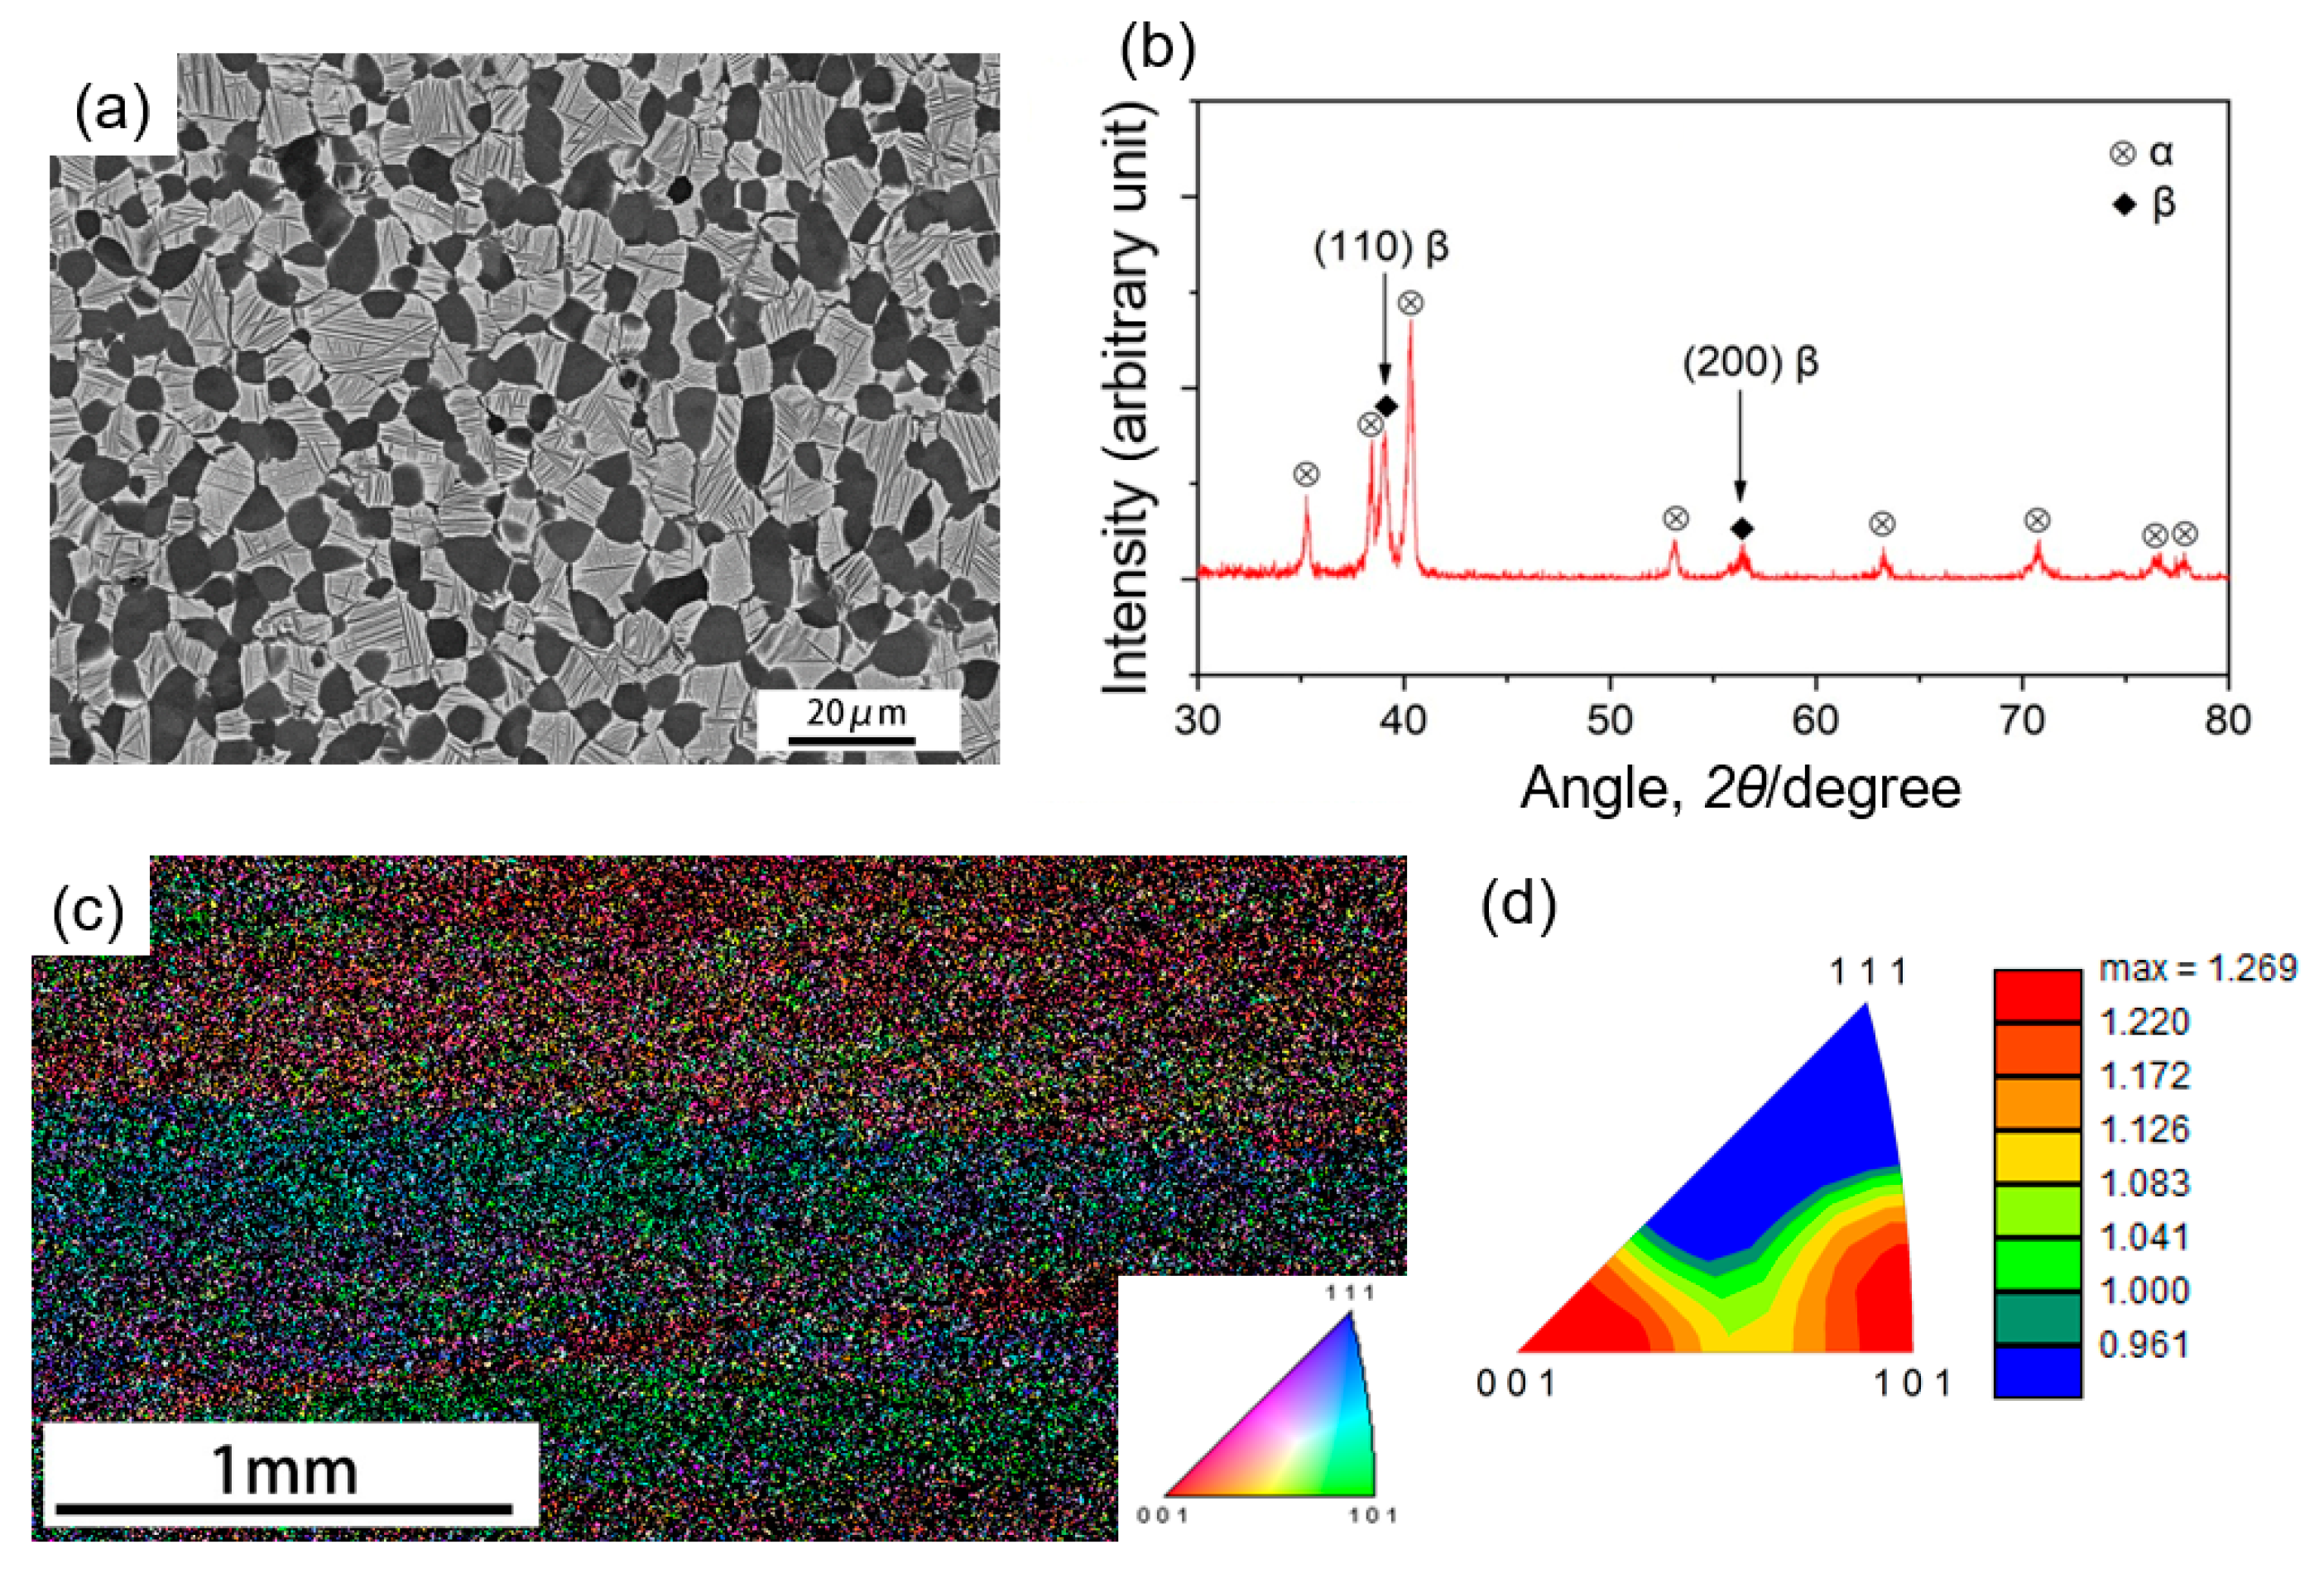
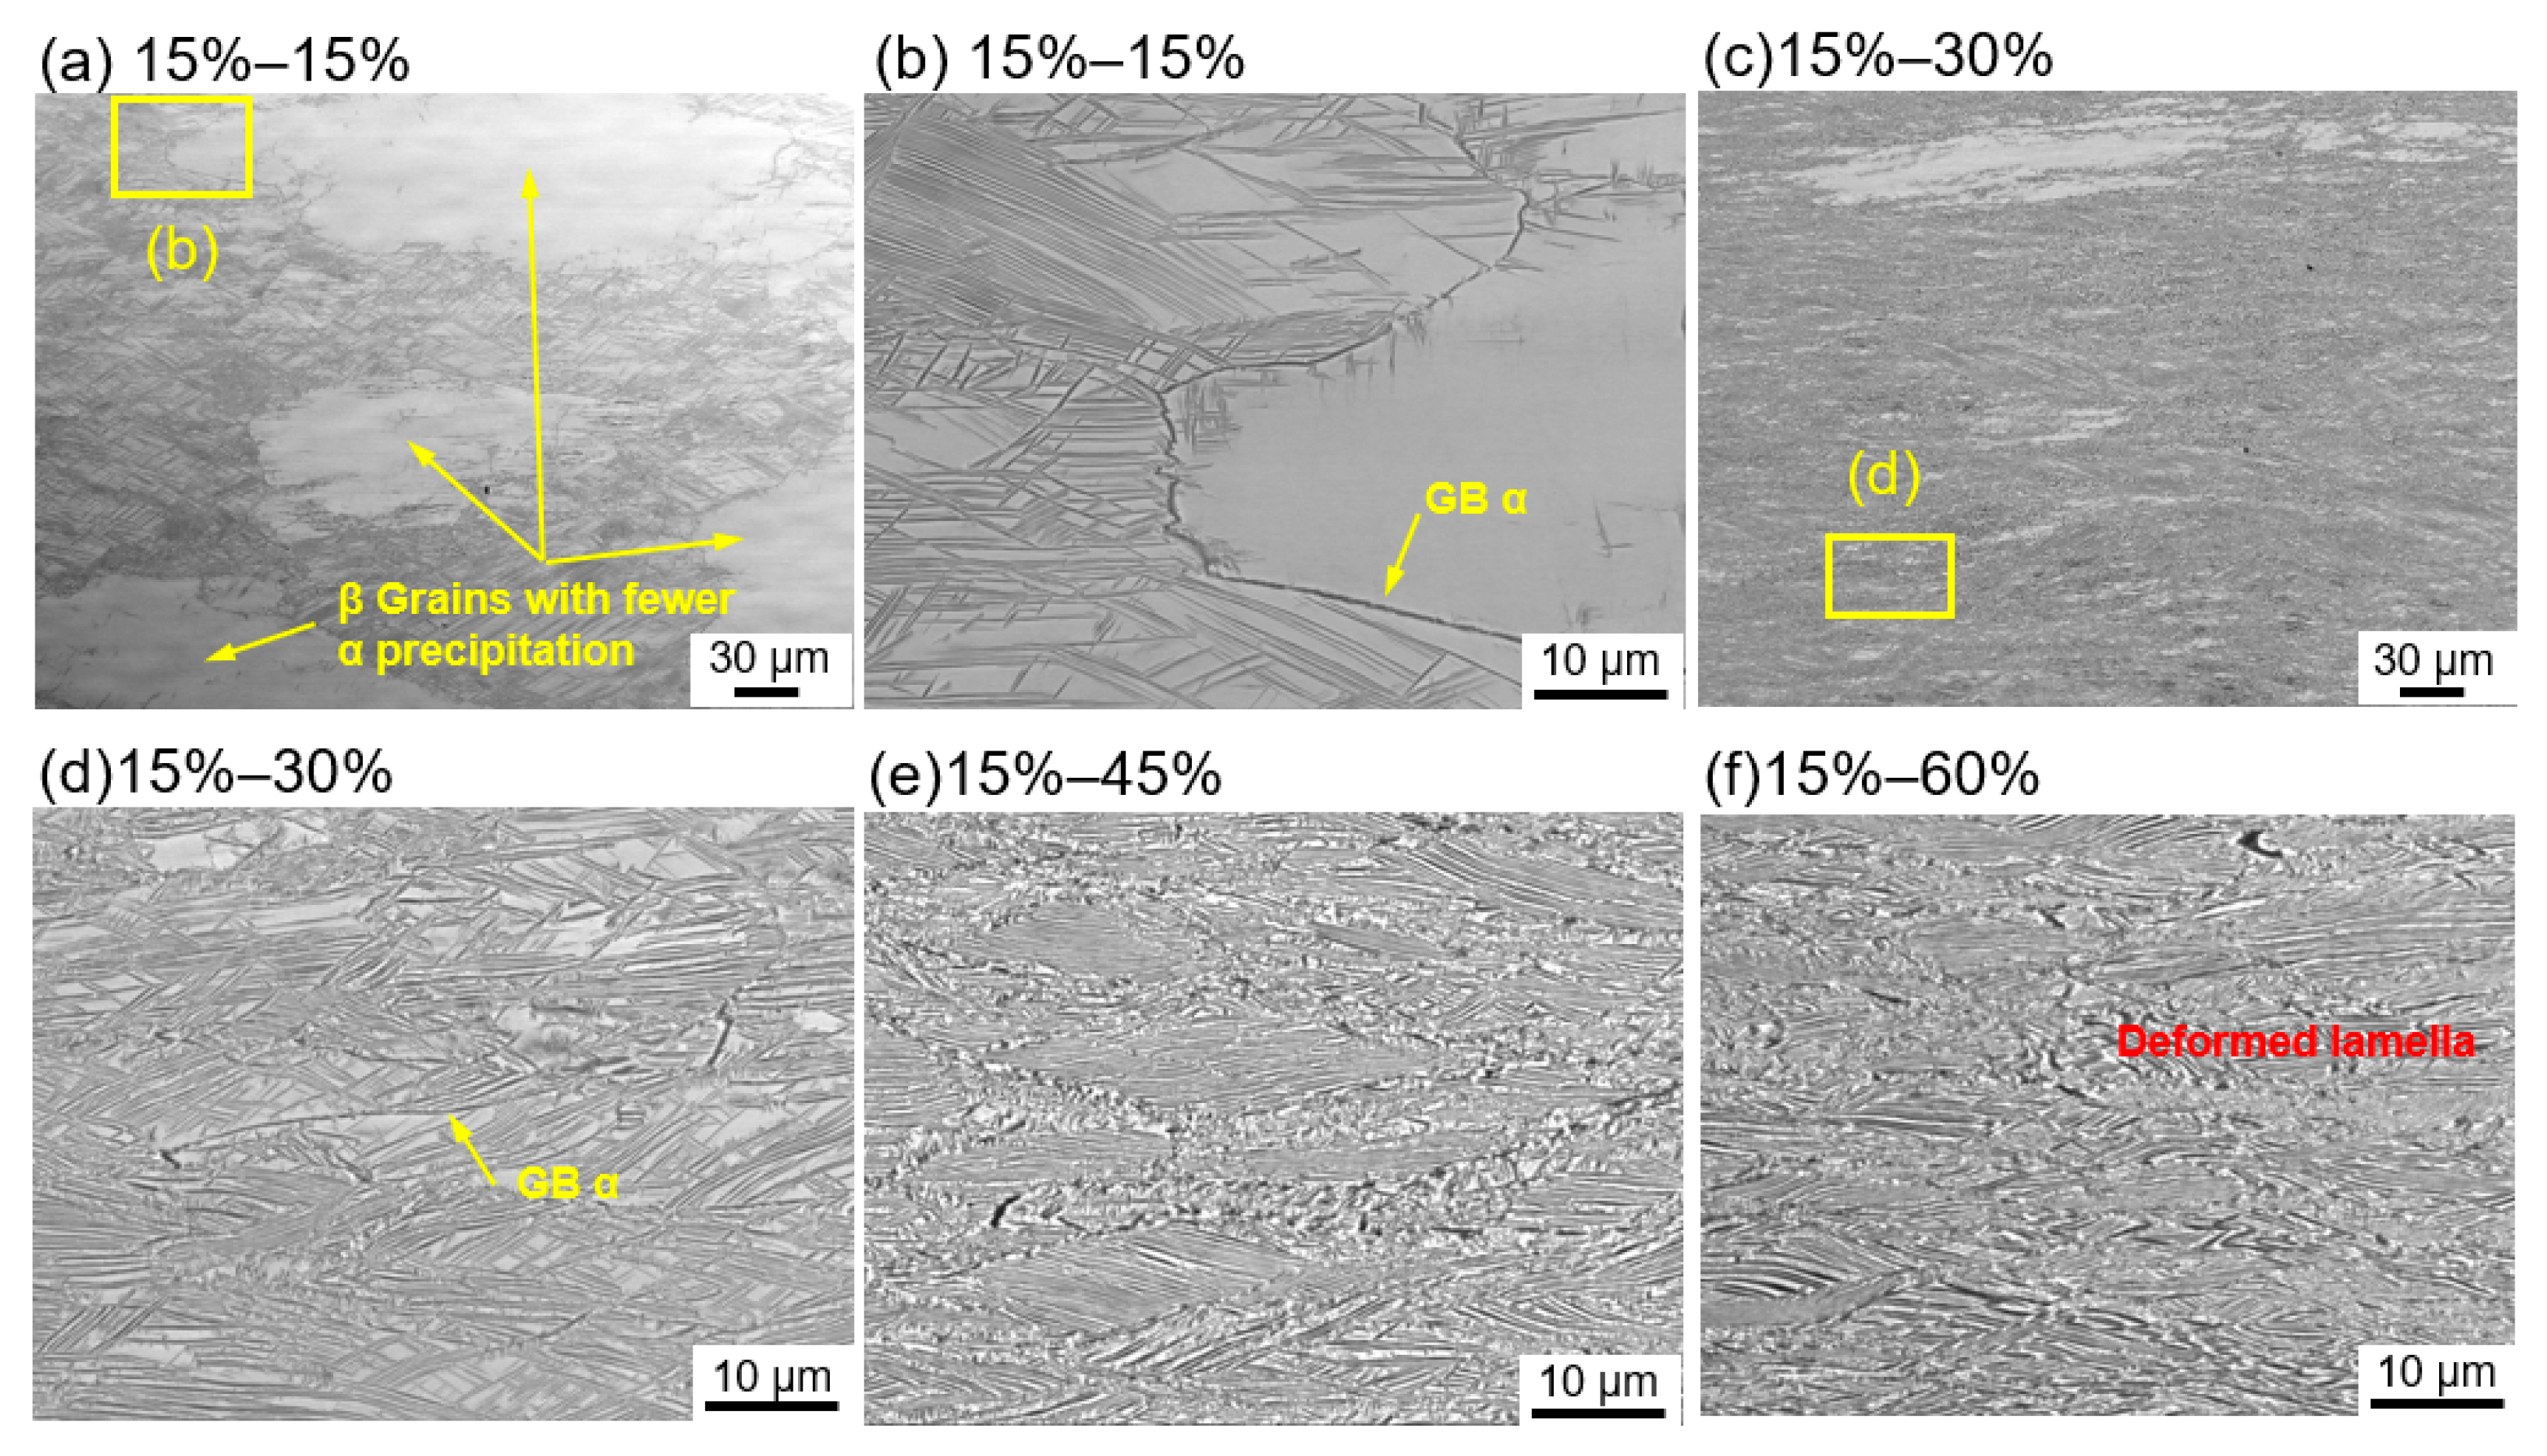
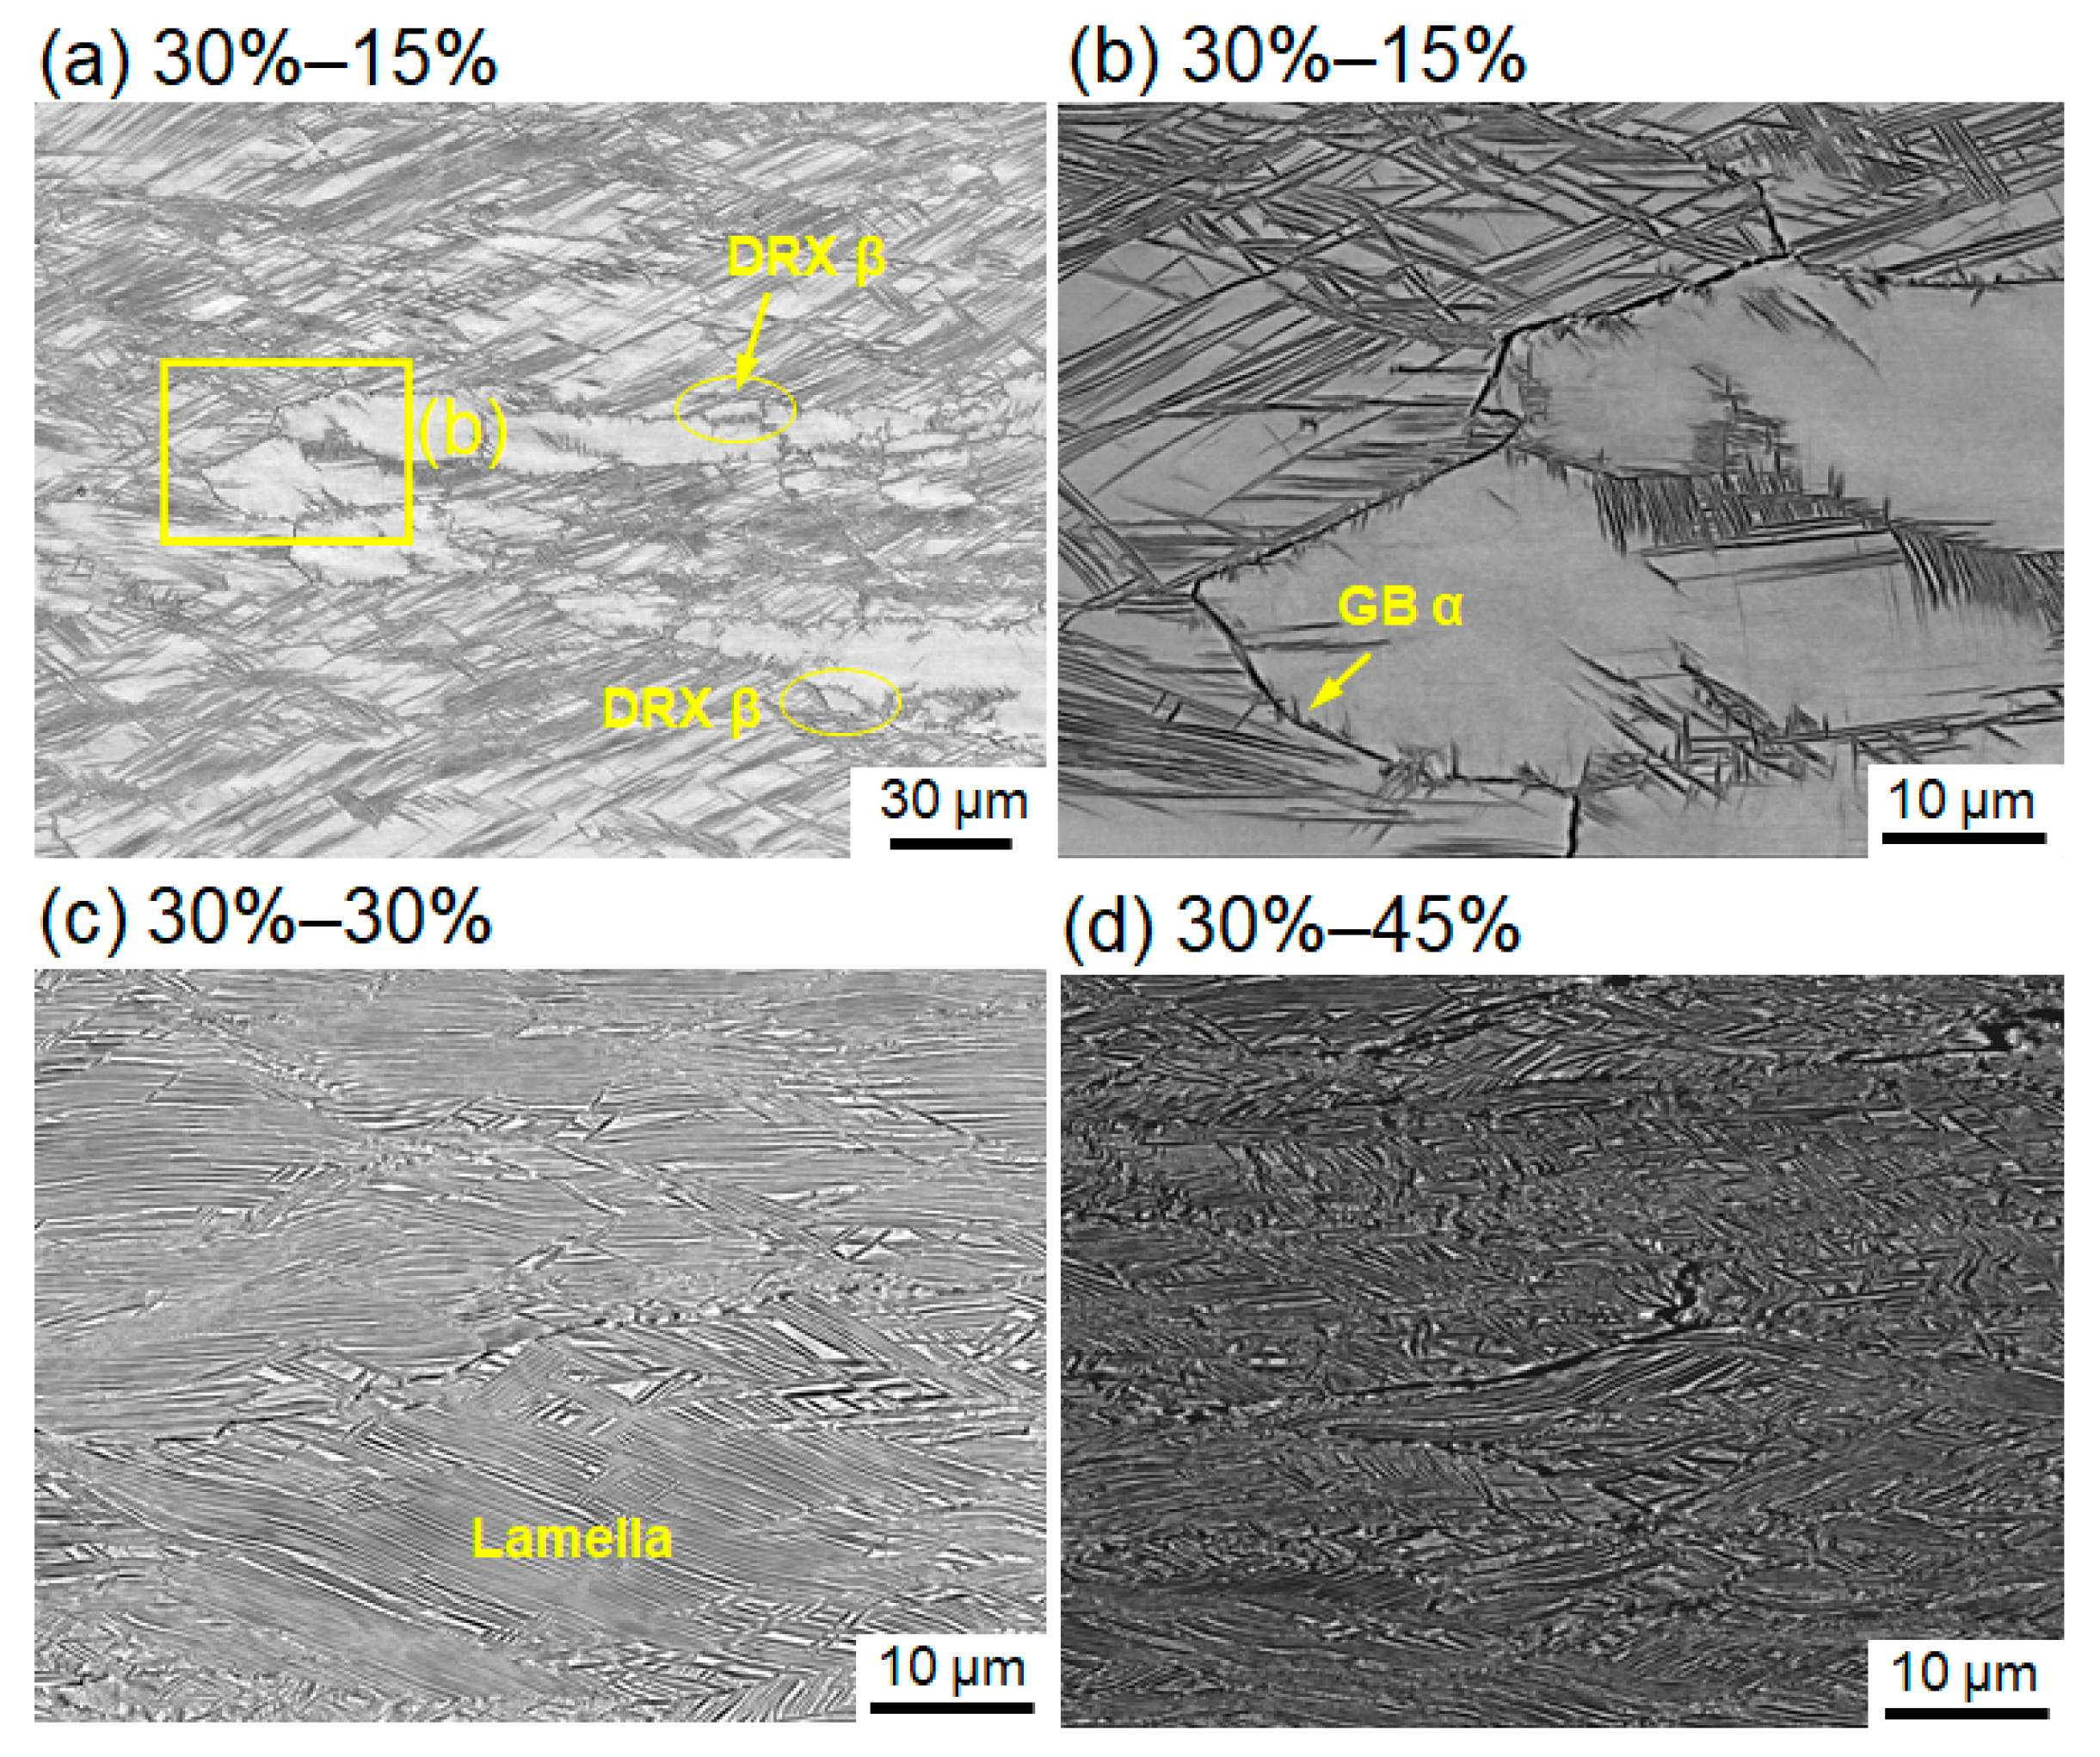
The as-received Ti-6246 billet showed a bimodal microstructure composed of equiaxed α and α/β lamella structures as shown in Figure 2a. The β phase’s initial textures in the as-received billet were {110} and {001} when viewed perpendicular to the FD (Figure 2b–d). In the two-step forging, the specimens were forged by 0%, 15%, or 30% in the single β region, and then by between 15% and 75% in the (α + β) dual-phase region. Figure 3, Figure 4 and Figure 5 show the microstructures at the center region of the FD-RD plane, which was parallel to the FD, for 0%, 15%, and 30% prior-β deformations. The GBs of the prior β grains are observed at the forging ratio of 0–15% (Figure 3a) because of the formation of GB α. Widmanstätten α nucleated at prior GBs and grew into β grains, as shown in Figure 3b. After further 30% (α + β) deformation, more interior α and GB α precipitated at the forging ratio of 0–45%, with some β grains showing less α precipitation within β grains, as shown by arrows in Figure 3c. Acicular α precipitated in a β grain, as shown in Figure 3d, whereas the α/β lamella structure developed and deformed in different β grains. At 60% deformation, GB α became thicker and the lamella structure deformed, and spherical α developed near GBs because of high strain at 75%. In Figure 4a,b, it can be observed that the increase in β deformation by 15% from the forging ratio of 0–15% enhanced acicular α precipitation within β grains, whereas β grains with less α precipitation existed at a forging ratio of 15–15%. Dehghan-Manshadi and Dippenaar demonstrated that the deformation in the β region accelerated β phase transformation to the α phase in Ti-6246 alloy [12]. According to the authors, this could be attributed to the creation of nucleation sites, caused by defects such as deformation bands and dislocation tangles inside β grains during deformation. Those defects remain in the microstructure after deformation. In addition, the dislocation-assisted diffusion through short-circuiting paths near α/β interfaces may enhance the β-to-α transformation [13]. Figure 5 shows that the acicular α phase precipitated and penetrated β grains more at 30% β deformation than at 0% and 15% β deformations under constant (α + β) forging ratios. In addition, the formation of GB α was more suppressed at 30% β deformation under a constant total forging ratio, e.g., at 0–60% (Figure 3e), 15–45% (Figure 4e), and 30–30% (Figure 5c), because the precipitation of the interior α phase was more enhanced at 30% β deformation due to prior β forging under the similar α volume fractions. The volume fraction of the α phase will be intensively addressed in the later section. It should be noted that dynamic recrystallization (DRX) occurred during β forging at 1253 K [8] and the DRX β grains were observed in Figure 5a. During cooling, the dynamically recrystallized grains grew. However, recrystallization scarcely occurs during forging and cooling in the (α + β) region due to α precipitation at β gain boundaries even at a moderate cooling rate [14].
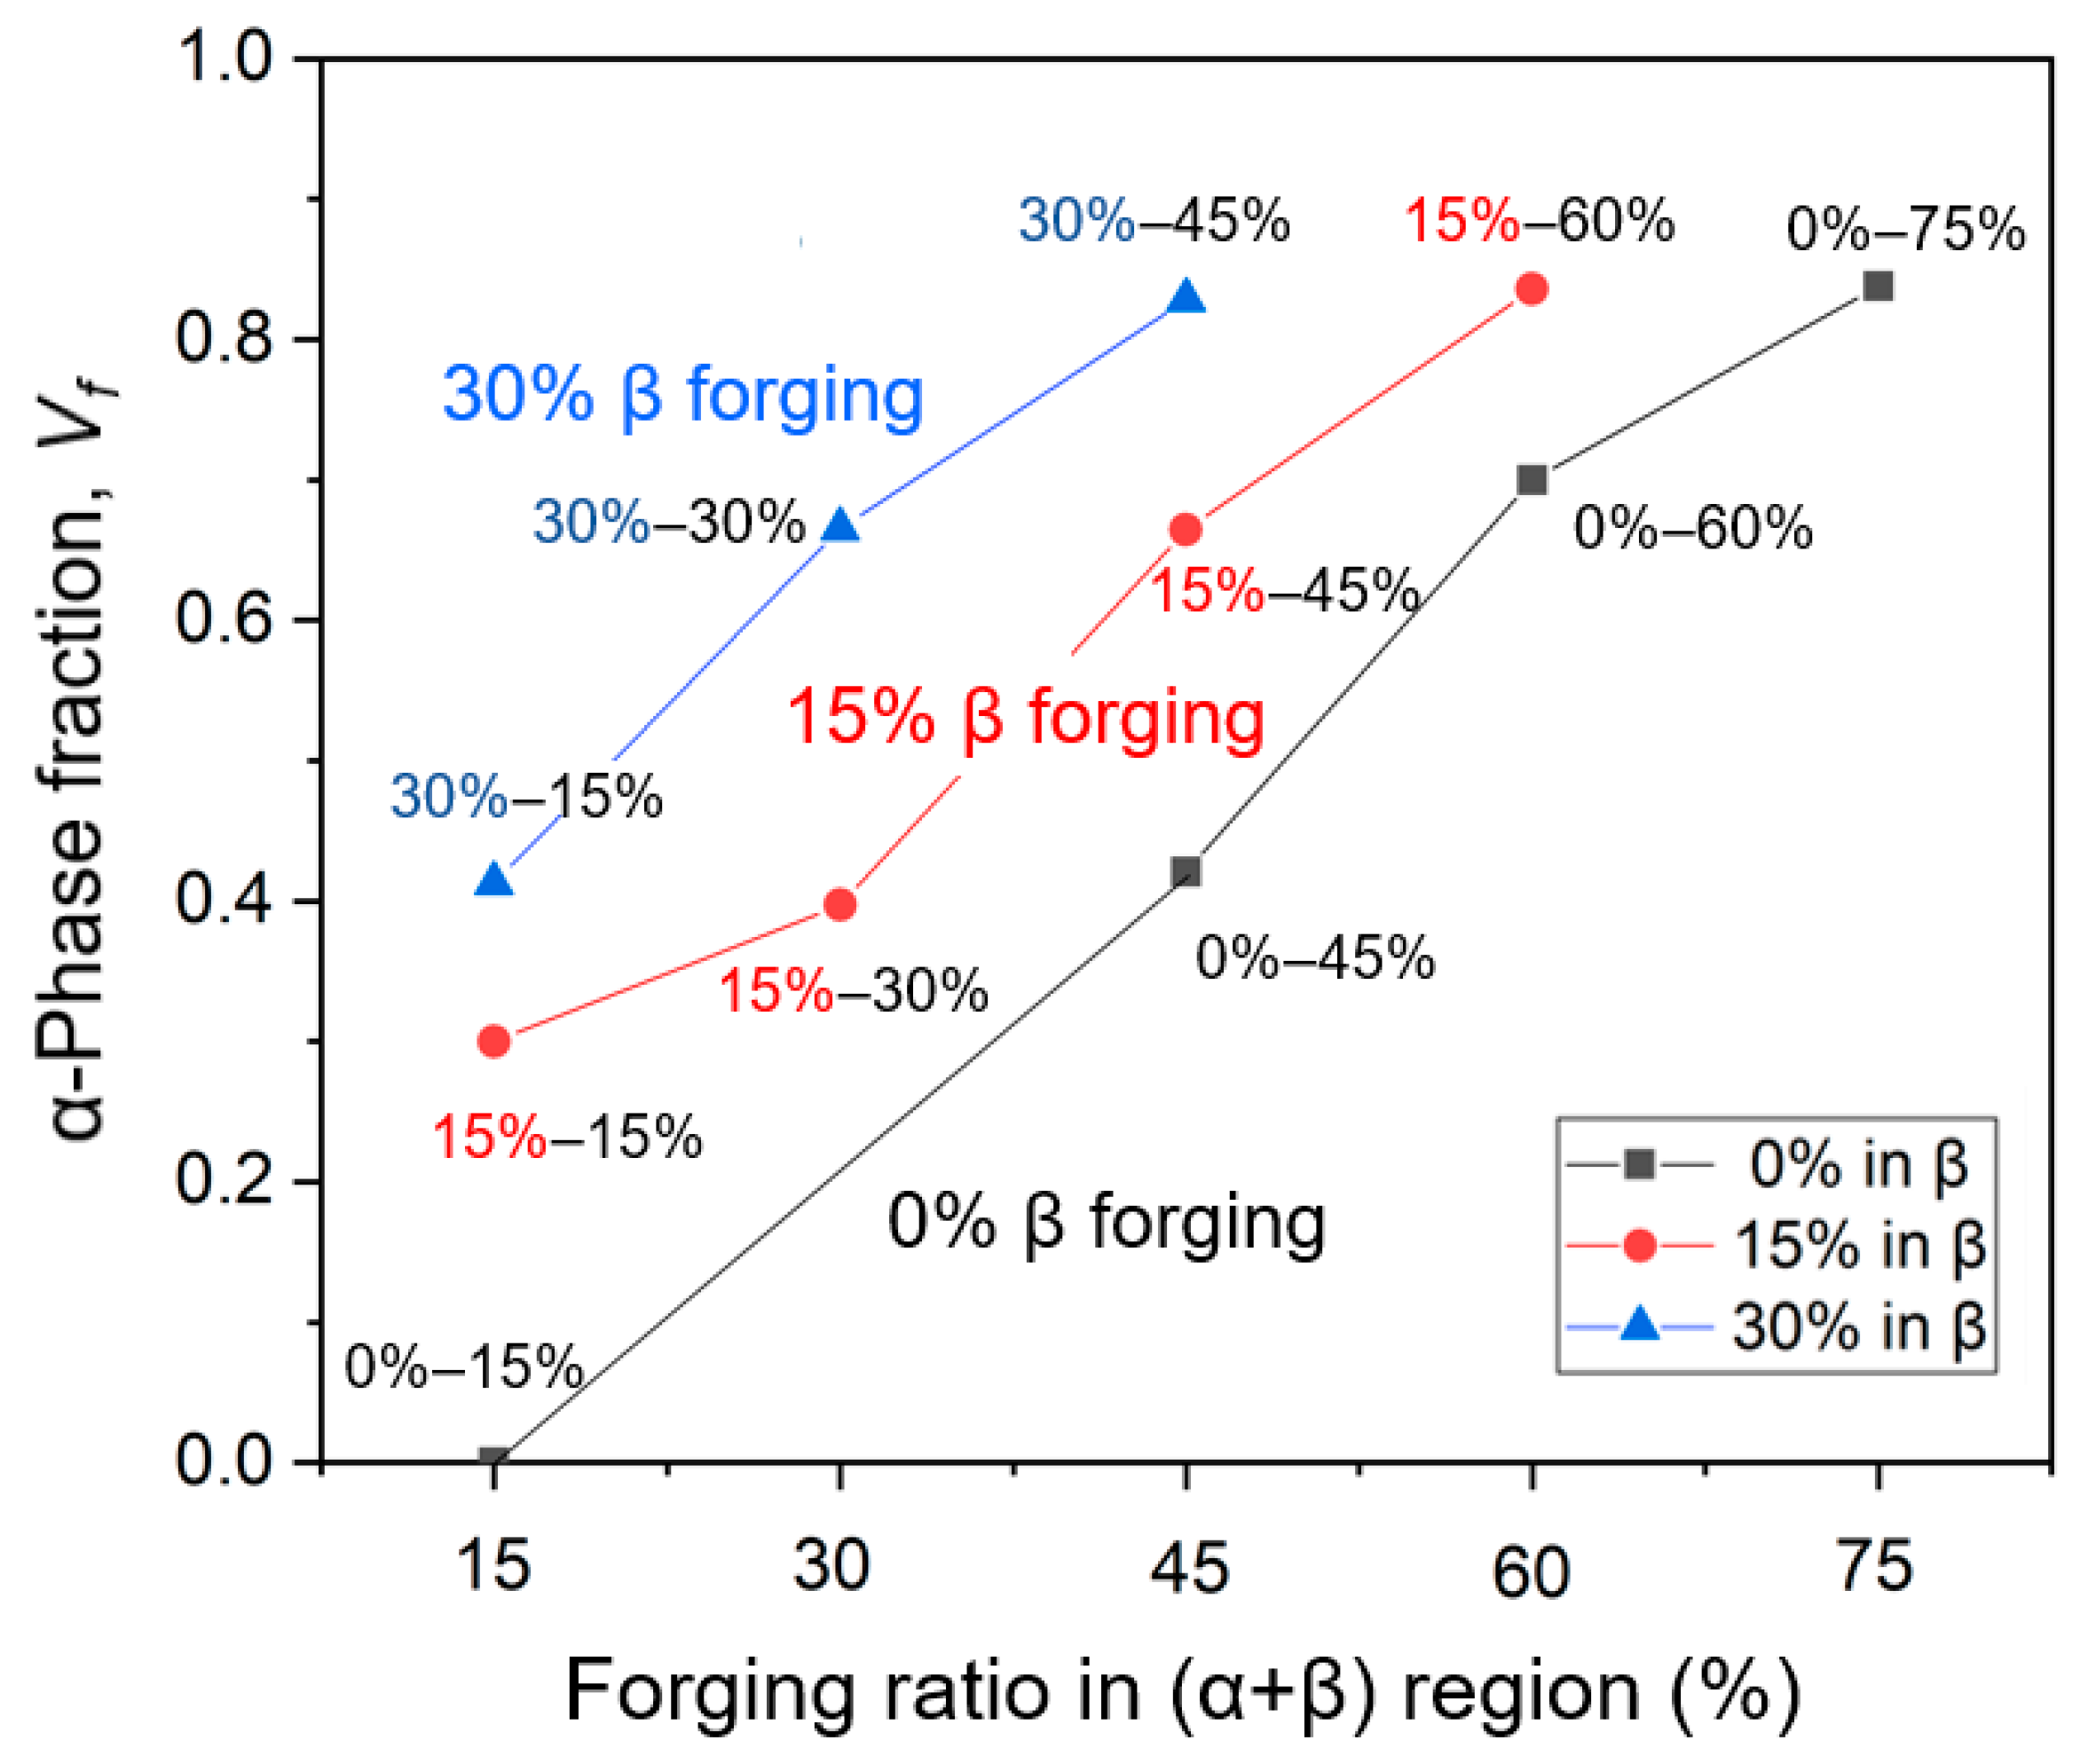
XRD patterns, as shown in Figure 6, were used to identify the constituent phases of the forged specimens. The gas quench after forgings induced the transformation from the β phase to the martensitic α″ phase with an orthorhombic crystal structure as shown in the XRD analysis in Figure 6. The volume fraction of the α phase calculated from the area of the diffraction pattern at each forging ratio is displayed in Figure 7. At a forging ratio of 0–15%, the α phase was not detected in the XRD pattern, as shown in Figure 6a, because the volume fraction of the α phase was insignificant, although we observed α precipitation in Figure 3a,b. For 0%, 15%, and 30% β deformations, the α volume fraction monotonically increased as the (α + β) forging ratio increased, as shown in Figure 7. Furthermore, the higher the deformation ratio in the β region under the constant (α + β) forging ratio, the more the α phase precipitated, as shown in Figure 3, Figure 4 and Figure 5. Thus, both β forging under the constant (α + β) forging ratio and (α + β) forging under the constant β forging ratio promote α precipitation. Moreover, the volume fraction of the α phase was equivalent under the constant total forging ratio, e.g., 30–15%, 15–30%, and 0–45%, although the formation of the interior α phase and thickness of GB α were dependent on the prior β forging ratio.
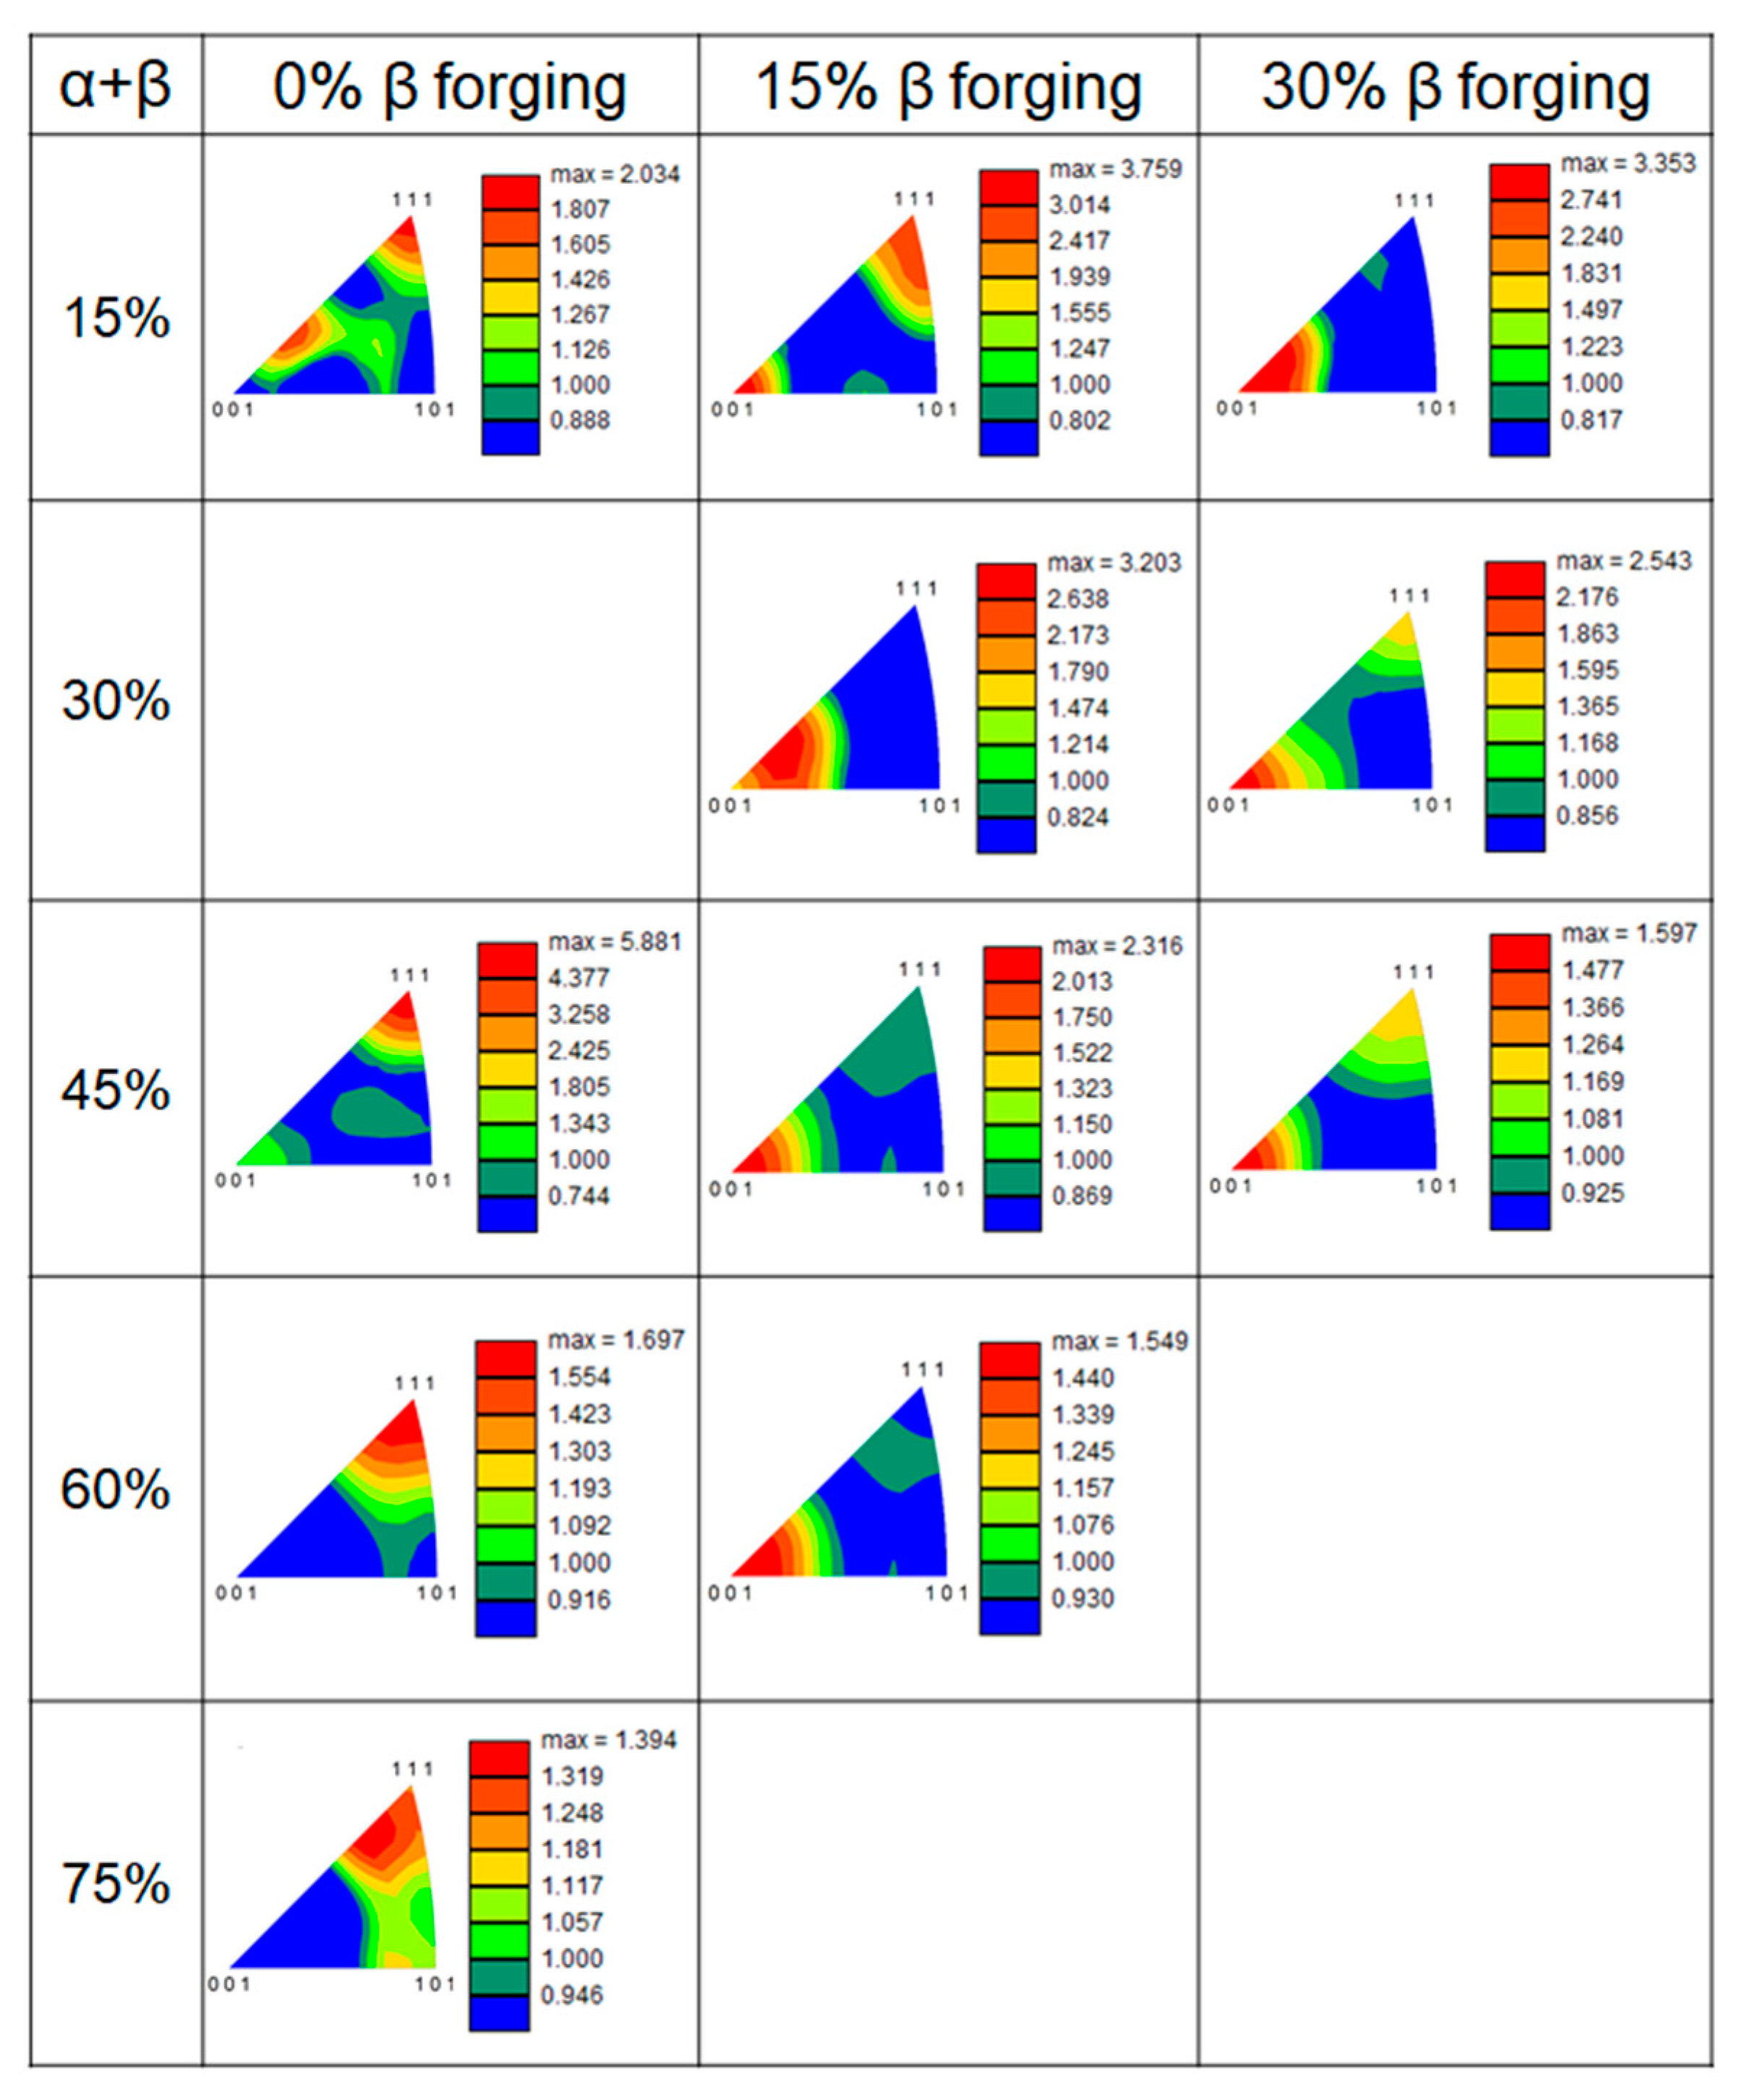
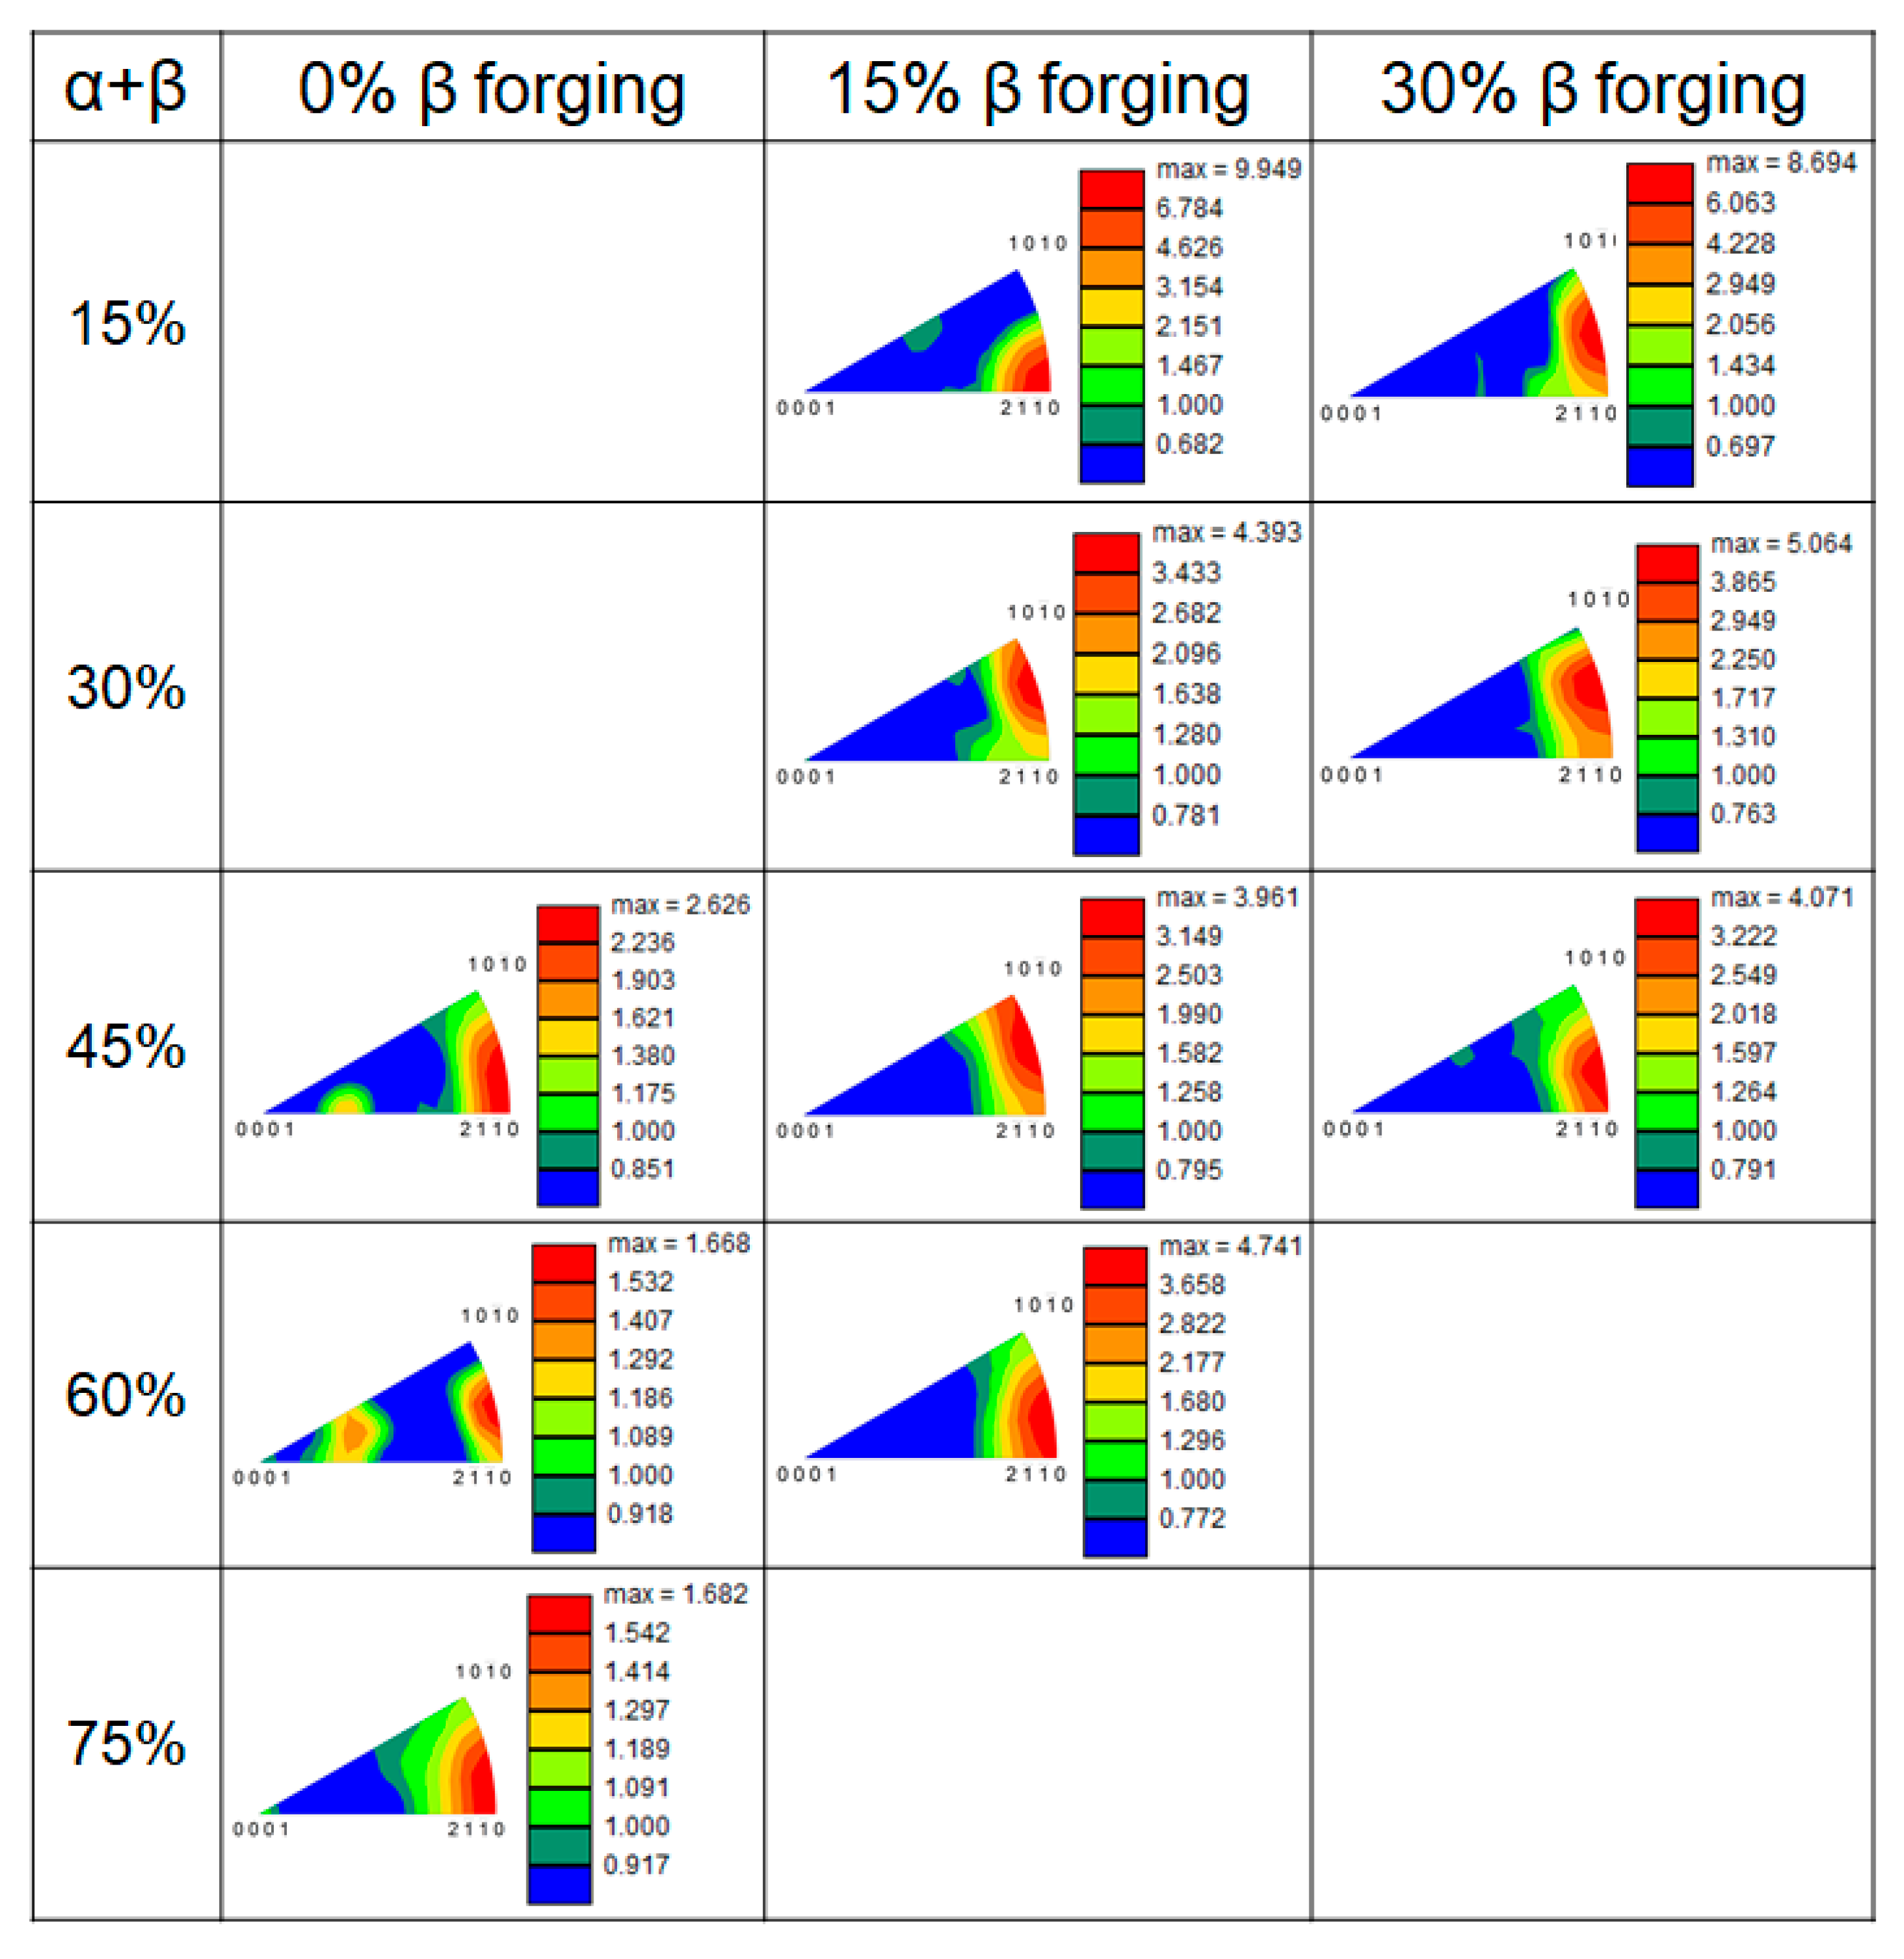
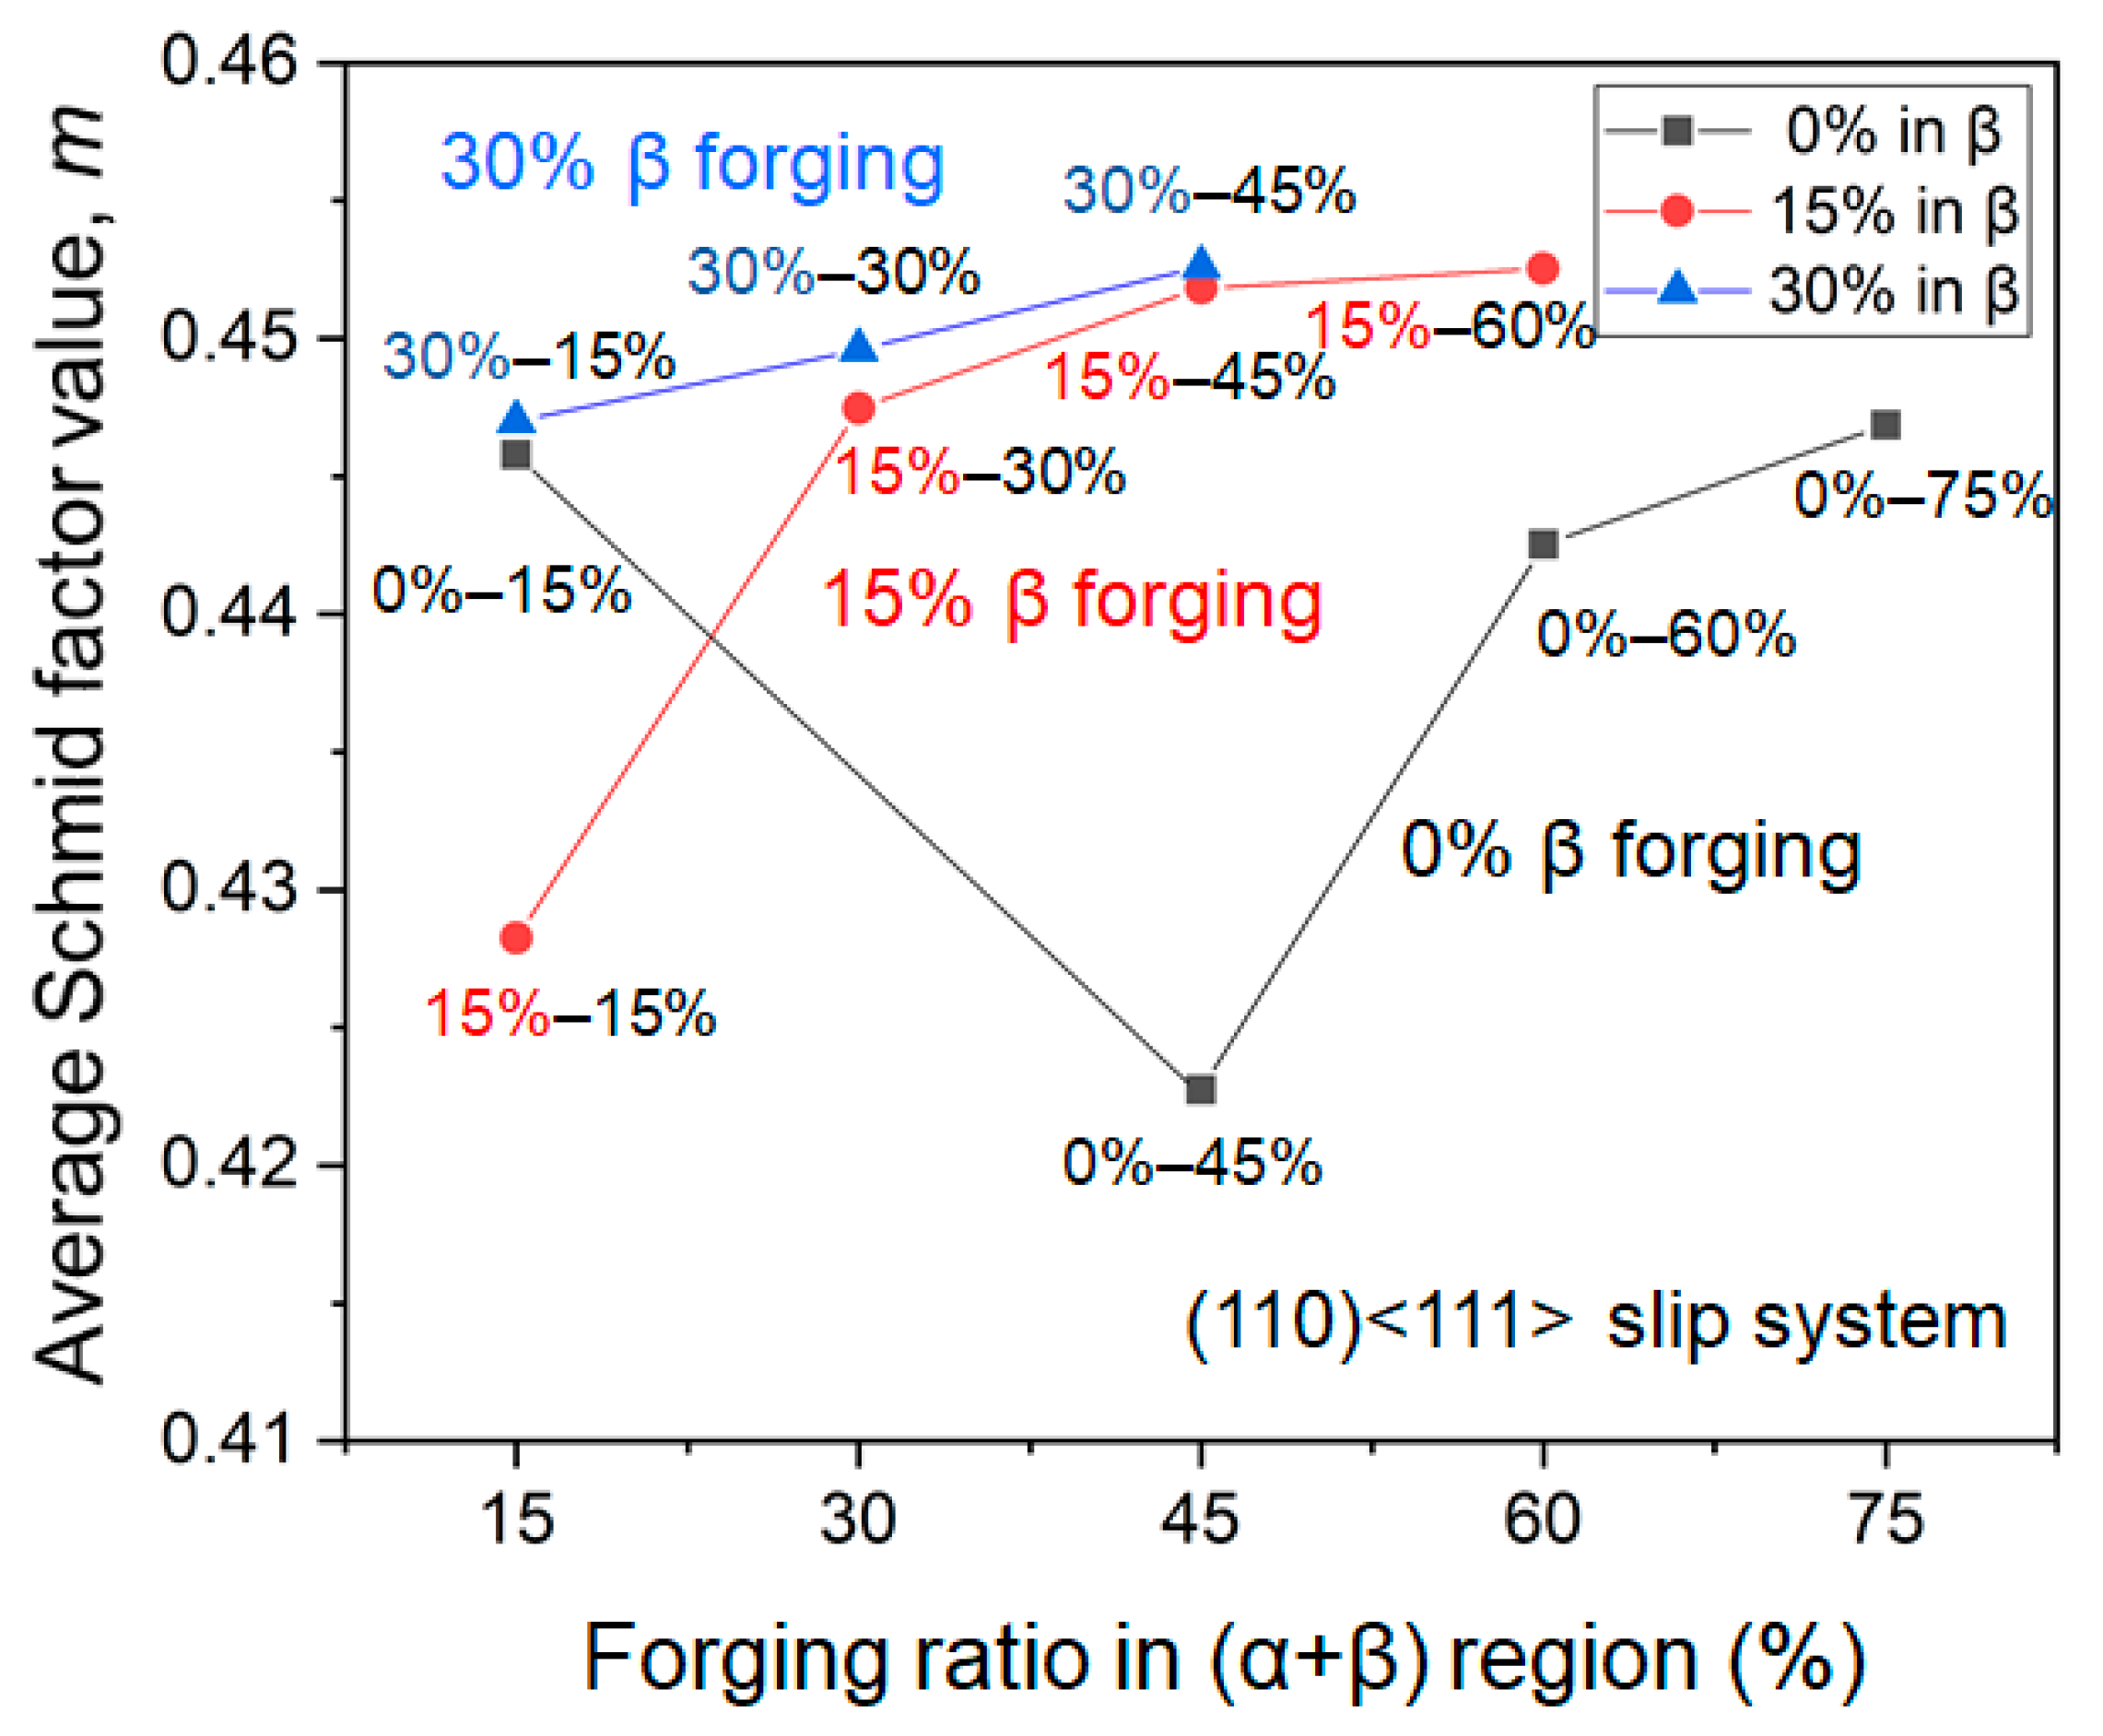
Figure 8 shows the inverse pole figures (IPFs) of the β phase at each forging ratio for 0%, 15%, and 30% β forgings, which were obtained from the orientation maps in the EBSD analysis for 500 μm × 200 μm scanned areas. In the present study, the martensitic α″ phase was detected, which was transformed from the β phase during gas cooling. The atomic positions in the orthorhombic α″ phase are close to those in the cubic β phase, resulting in similarly indexed EBSD patterns [15]. Bertrand et al. [15] demonstrated that the high-temperature β texture was characterized by identifying room temperature Kikuchi patterns using β Ti crystal parameters. These IPFs show typical {001} and {111} bcc forging textures. For 15% and 30% β forgings, the intensity of the {001} texture in the β phase decreased as the (α + β) deformation ratio increased. Figure 9 shows the relationship between the {001} texture intensity and the forging ratio in the (α + β) region for 0%, 15%, and 30% β forgings. It is clear that the {001} texture intensity continuously decreased as the (α + β) forging ratio increased for 15% and 30% β forgings, accompanied by α formation, as shown in Figure 7. As for 0% β forging, the α phase volume fraction was initially low at 0–15% and the {001} texture intensity only slightly increased and then decreased after α precipitation. Figure 10 shows the IPFs of the α phase at each forging ratio. The α-phase, which was formed during (α + β) forgings, showed a strong {11–20} texture for all the forging conditions. The {11–20} texture is a deformation texture [16], as well as a transformation texture, transformed from the textured parent β phase under the BOR [6]. In the α phase, a-Type slip systems include the (0001)<11–20> basal slip, {10–10}<11–20> prismatic slip, and {10–11}<11–20> pyramidal slip. The pyramidal slip showed the largest SF value between these three slip systems (Table 2), indicating that it was dominant in the α phase during forging in this study. It has been reported that the slip transmission occurred between the matrix β phase and the precipitated α phase under the Burgers orientation relationship [17,18,19]. At high temperatures, {110}<111>, {112}<111>, and {123}<111> bcc slip systems in the β phase are active and their critical resolved shear stress (CRSS) values are comparable [20]. Out of those slip systems, the activations of the {112}<111> and {123}<111> bcc slip systems form {001} and {111} textures, and the activation of the {110}<111> slip system leads to strong {111} and weak {001} textures [21,22]. The {10–11}<11–20> pyramidal slip system with the highest SF value in the α phase had a linear relationship with those slip systems in the β phase under the Burgers orientation relationship, resulting in the activation of the {110}<111> slip system in the β phase, which lowered the {001} texture intensity. This is supported by the fact that the SF values of the {110}<111> slip system in the β phase for 0%, 15%, and 30% β forgings increased with α precipitation during (α + β) forging, as shown in Figure 11. Confirmation using transmission electron microscopy will be the subject of a future study.
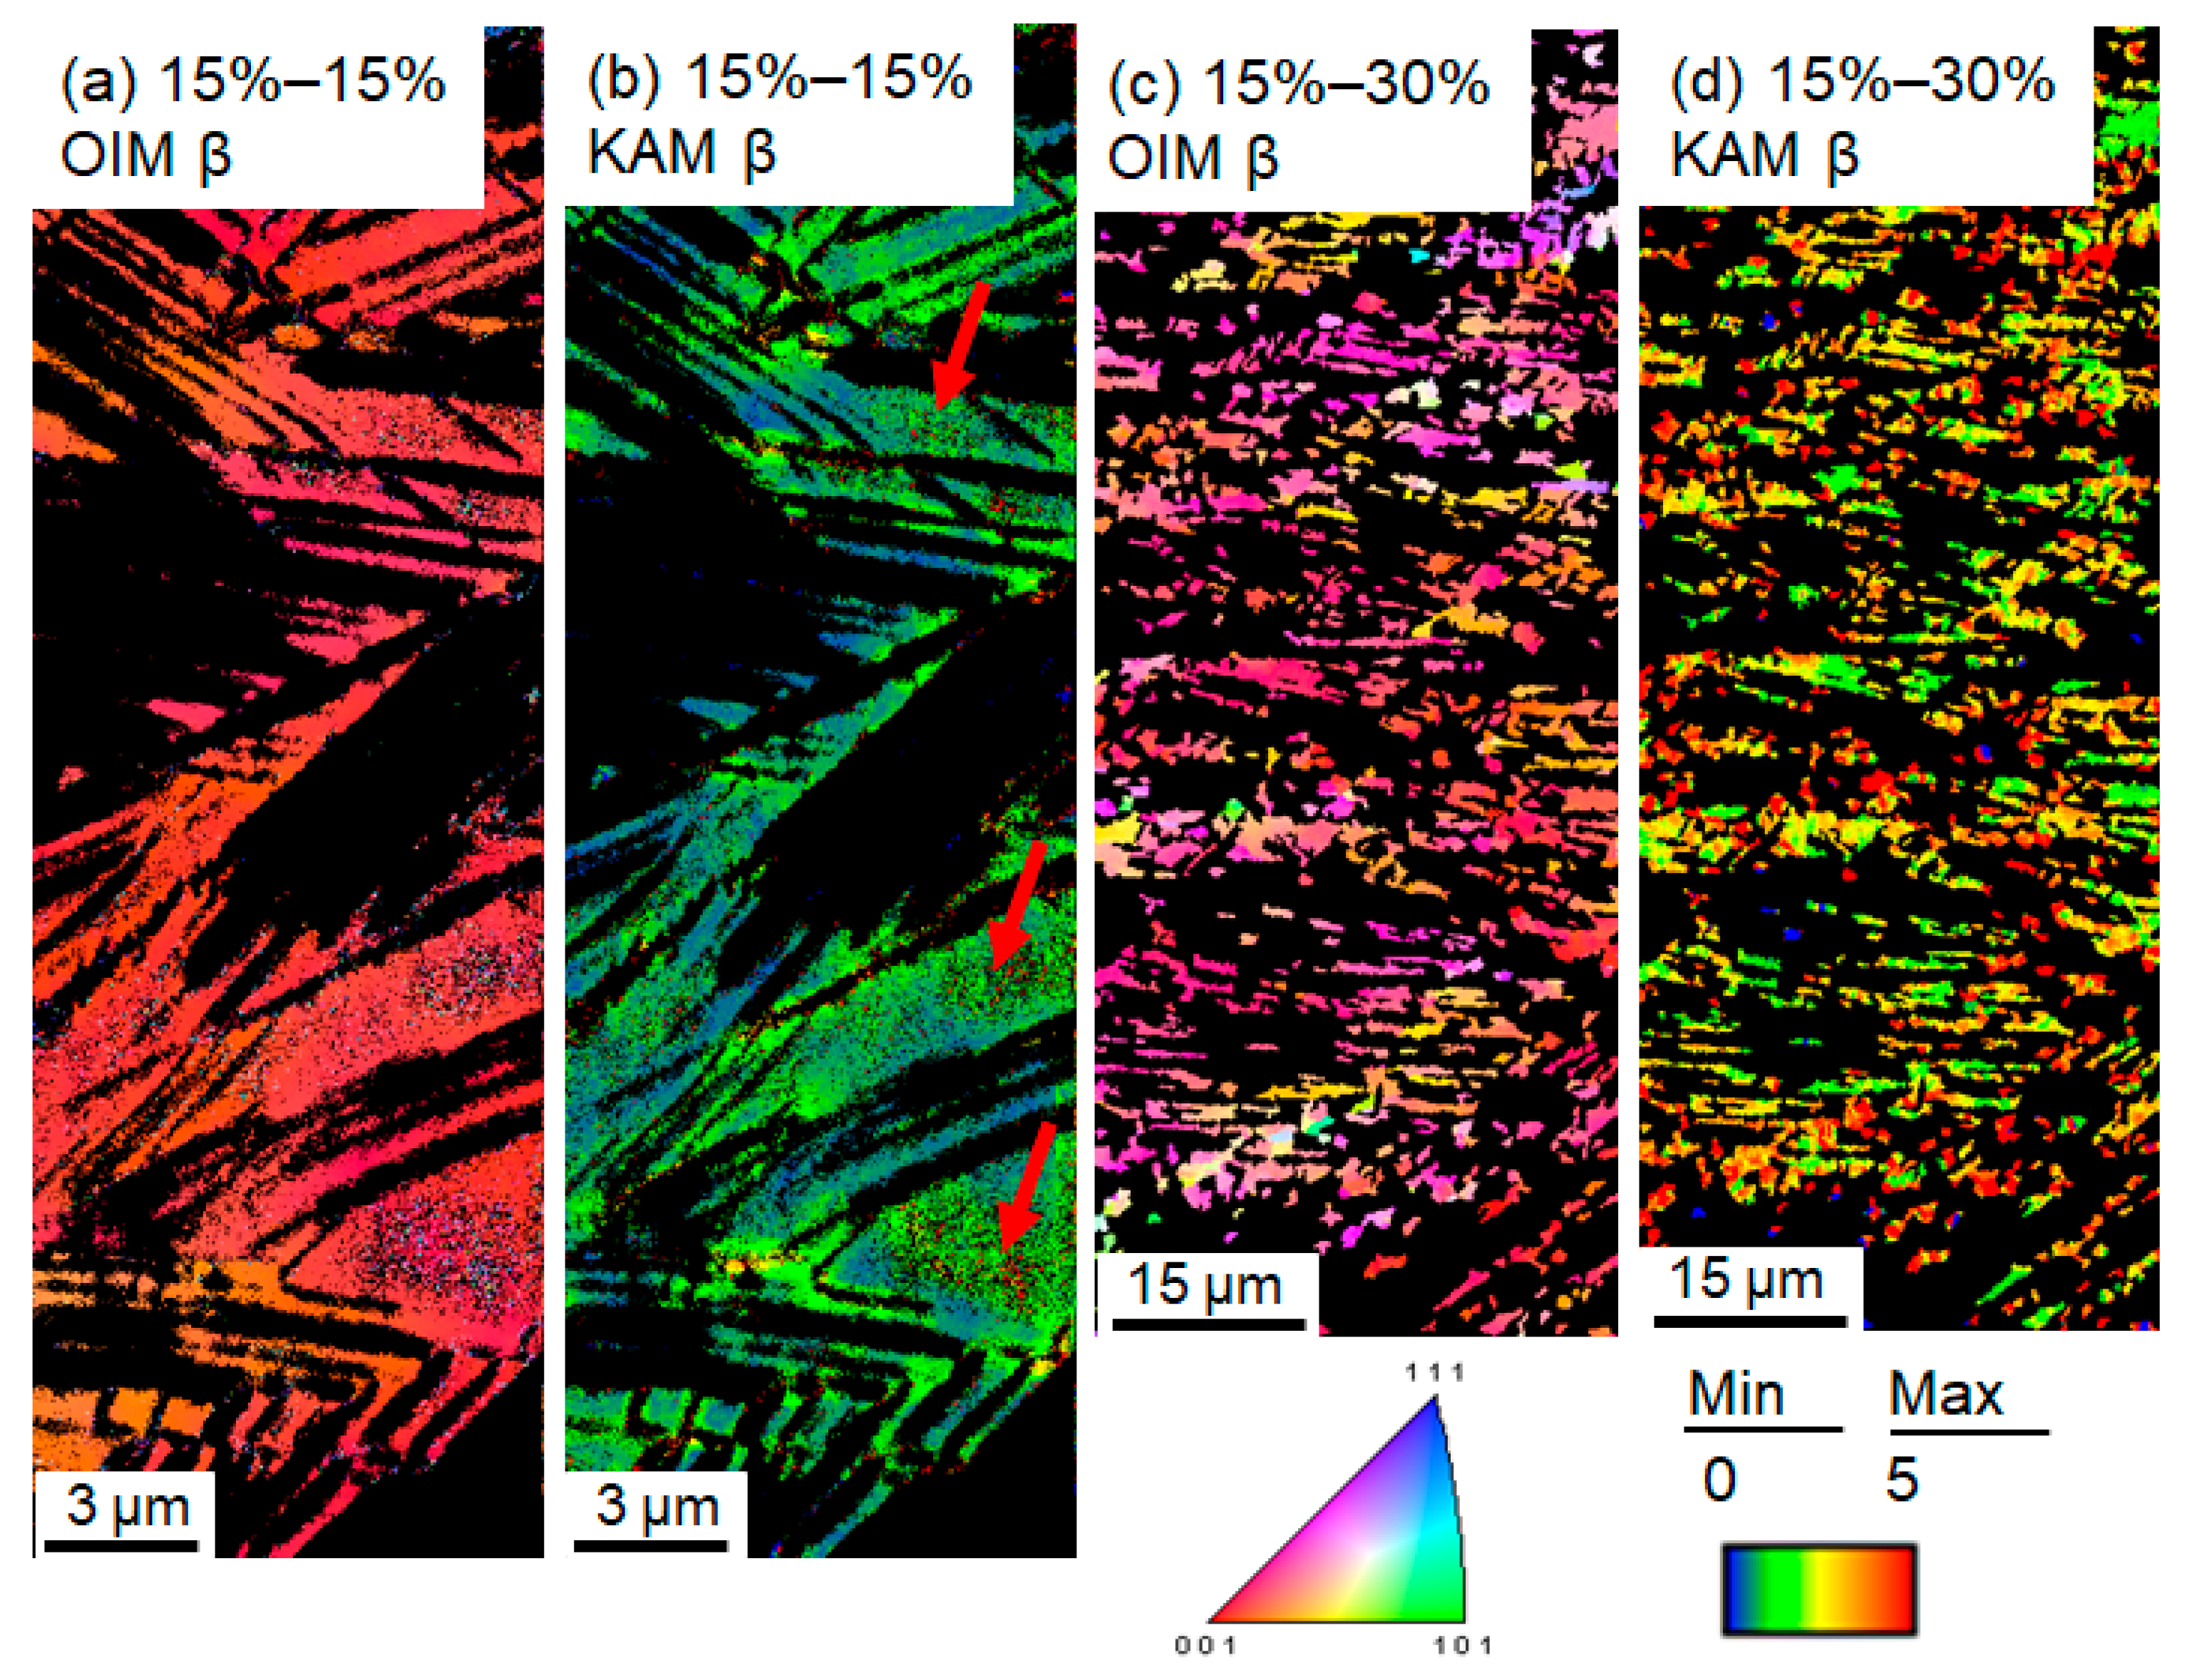
Figure 12 shows the orientation image map and Kernel average misorientation (KAM) value map of the β phase at forging ratios of 15–15% and 15–30%. The KAM value quantifies the average misorientation between the detected point and its neighboring points. At a forging ratio of 15–15%, the volume fraction of the α phase was approximately 0.3 and interior lamella α was scarce, as shown in Figure 7a,b and Figure 12a. In Figure 12b, it can be seen that crystal orientation rotation occurs inside β phases, as shown by arrows. However, the slip transmission between α and β phases occurs at the α/β interface. At a forging ratio of 15–30%, the interior α phase precipitated more inside β grains, the interface area between α and β phases increased, and the slip transmission between α and β phases became more substantial. The crystal orientation rotation in the β phase advanced further, as shown by higher KAM values in Figure 12d, resulting in an increased average SF value of the {110}<111> slip system, as shown in Figure 11.
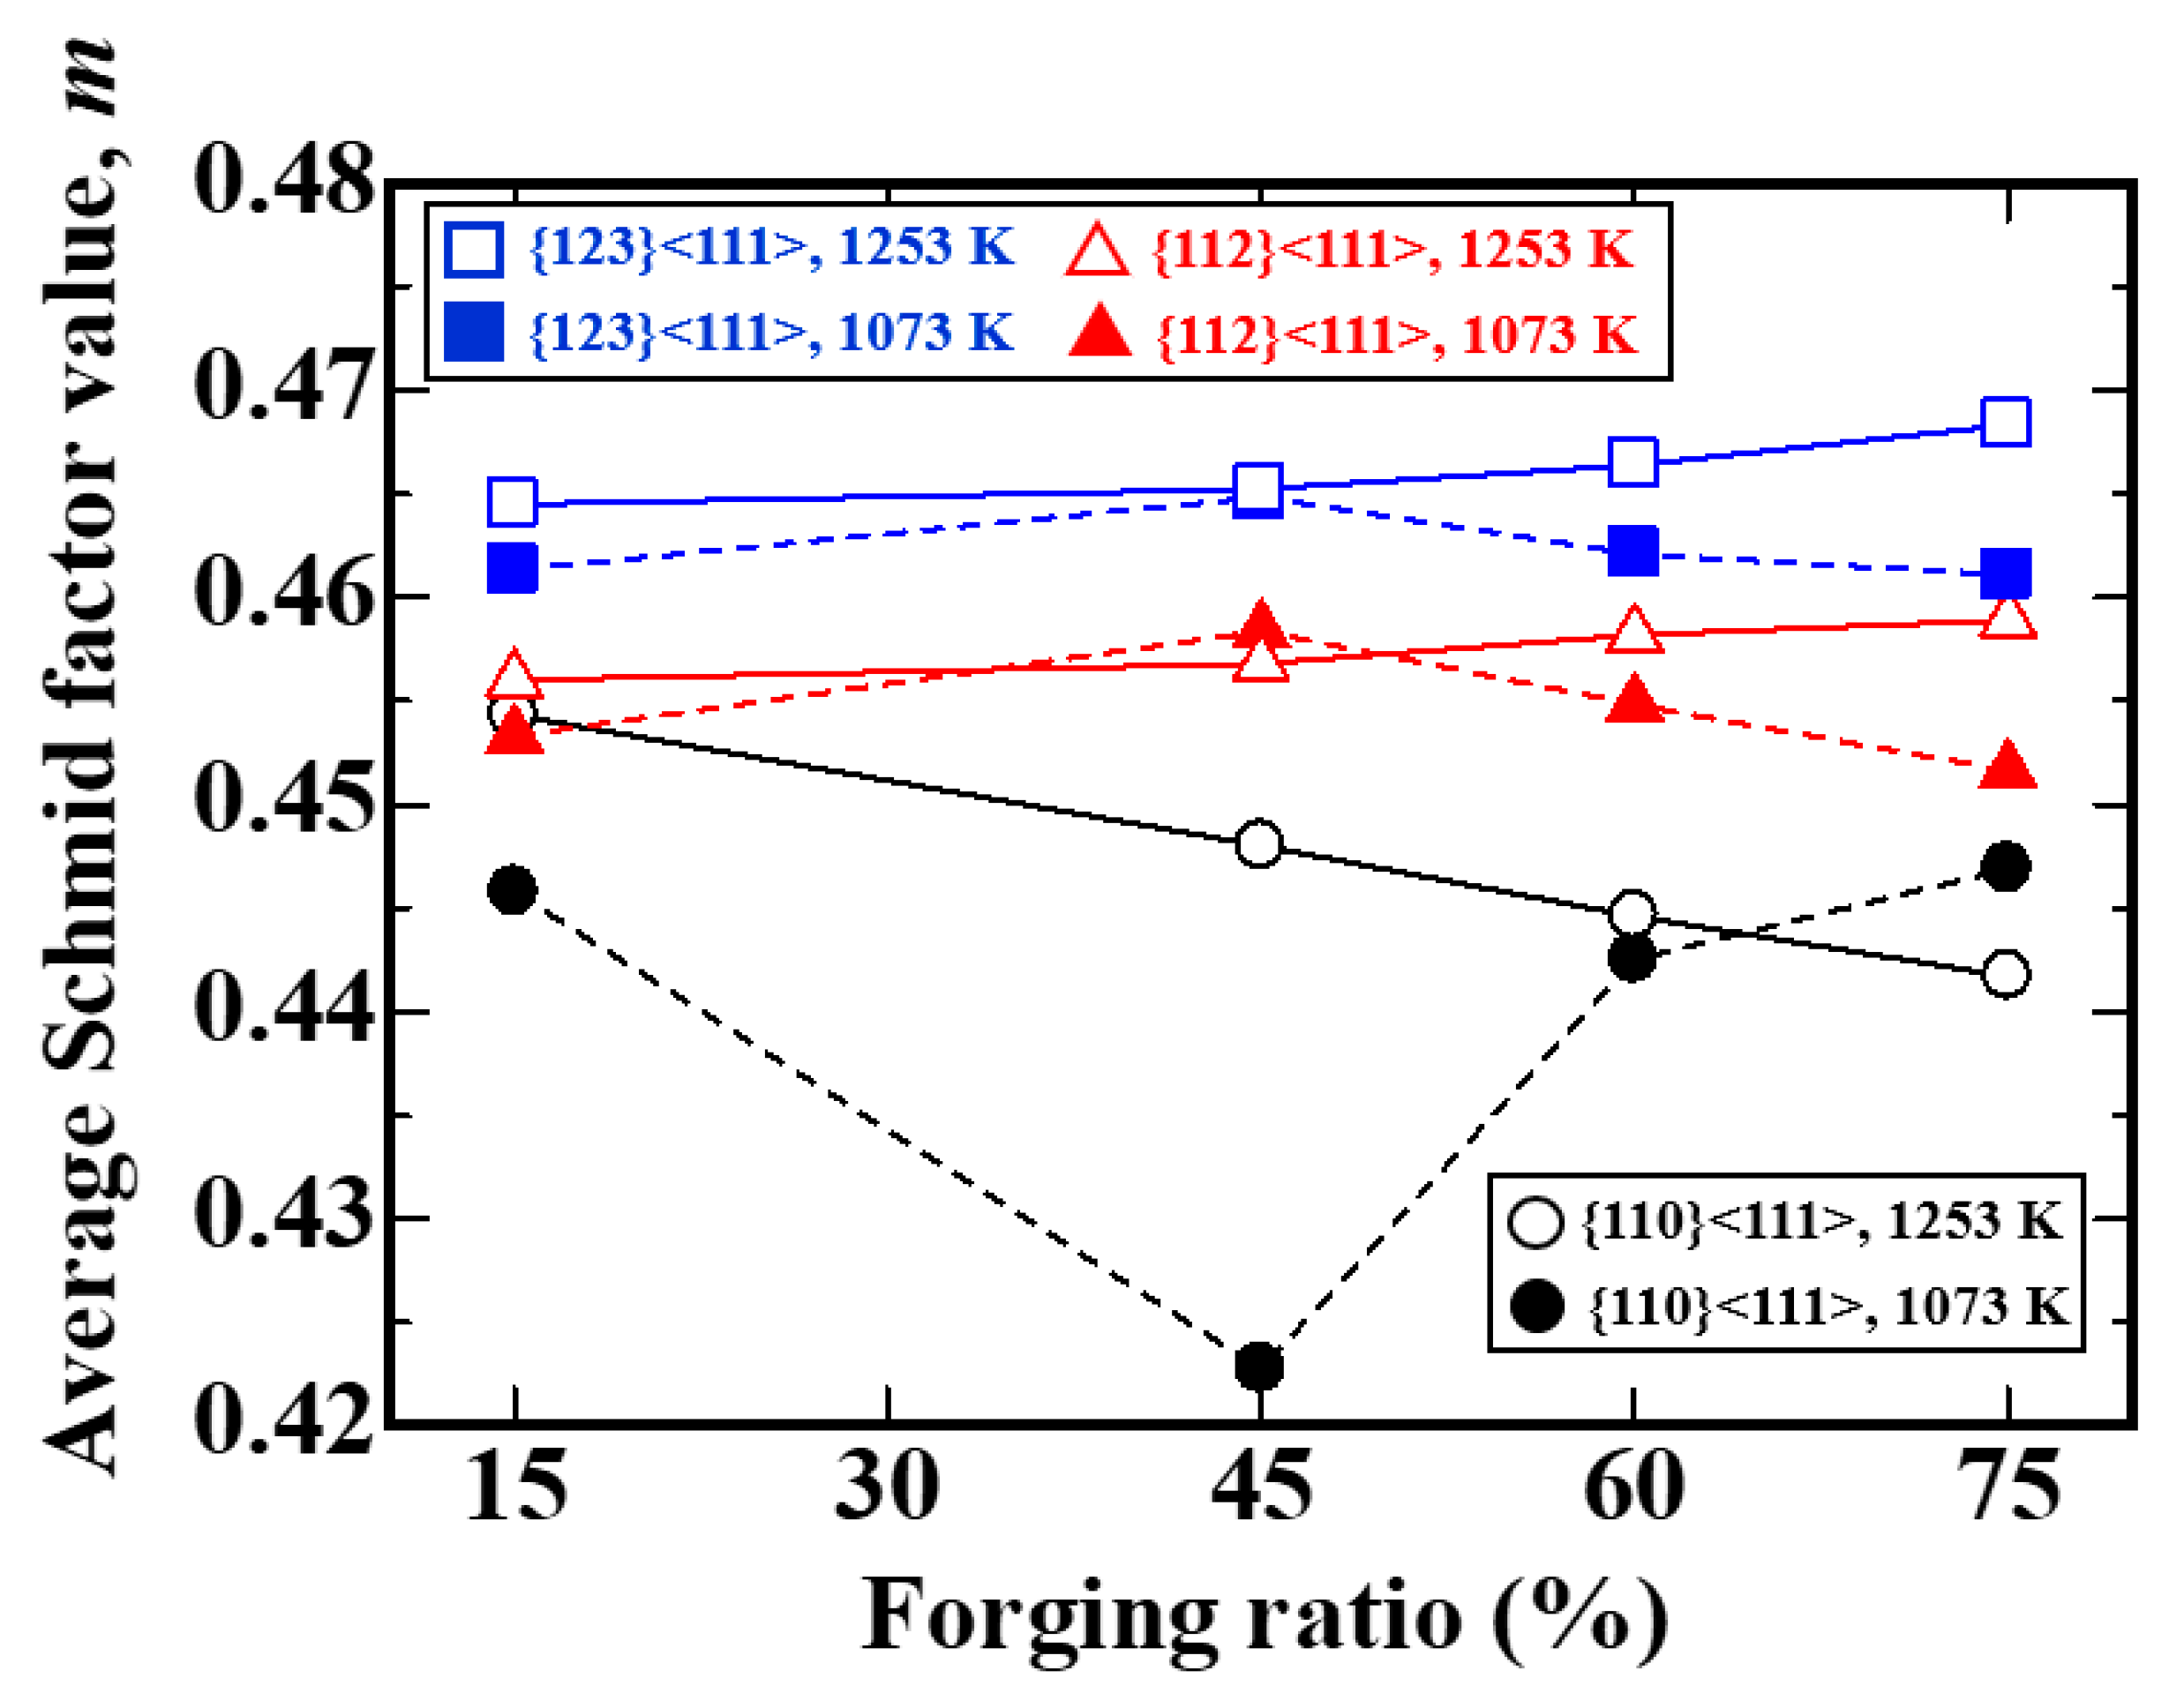
The increase in the interior α volume fraction thus raises the SF value of the {110}<111> slip system in the β phase and decreases the {001} texture intensity. However, the average SF value of the {110}<111> slip system at a forging ratio of 0–45% was lower than that at 15–30%, as shown in Figure 11, although these α volume fractions were comparable. This is primarily because the activities of the {110}<111>, {112}<111>, and {123}<111> slip systems in the β phase are dependent on temperature. The operating slip systems are dictated by the CRSS and SF. The CRSSs of {110}, {112}, and {123} slip planes along the <111> direction for bcc metals are of the same order [23]. All of the three slip systems are active above room temperature during deformation, with {110} being the preferential slip plane [24]. Furthermore, Figure 13 shows the change of the average SF values of the {110}<111>, {112}<111>, and {123}<111> slip systems in the β phase during forgings at 1253 K or 1073 K, following heat treatment at 1253 K for 600 s. The SF values of the {123}<111> and {112}<111> slip systems gradually increased at 1253 K, whereas that of the {110}<111> slip system gradually decreased. By contrast, at 1073 K, the SF value of the {110}<111> slip system significantly decreased and it increased after α precipitation. During the decrease in the SF value of the {110}<111> slip system at 1073 K, the SF values of the {123}<111> and {112}<111> slip systems increased, as shown in Figure 13. These results indicate that both the {111} and {001} texture intensities are enhanced during forging at 1073 K before α precipitation. The SF value of the {110}<111> slip system was low at forging ratios of 0–45% and 15–15%, as shown in Figure 11, and the IPF {111} and {001} texture intensities, as shown in Figure 8, were enhanced at these forging ratios. The decrease in the SF value of the {110}<111> slip system during forging at 1073 K was more obvious at a forging ratio of 0–45% than those at 15–15% and 15–30% because the forging at a ratio of 0–45% was performed by 45% only at 1073 K. It should be noted that the volume fraction of the α phase at 0–45% was 0.4, as can be seen in Figure 7. The SF value of the {110}<111> slip system at 0–45%, as shown in Figure 11, reflects the activation of the {110}<111> slip system following α precipitation, which occurred before the 45% deformation in the (α + β) region.
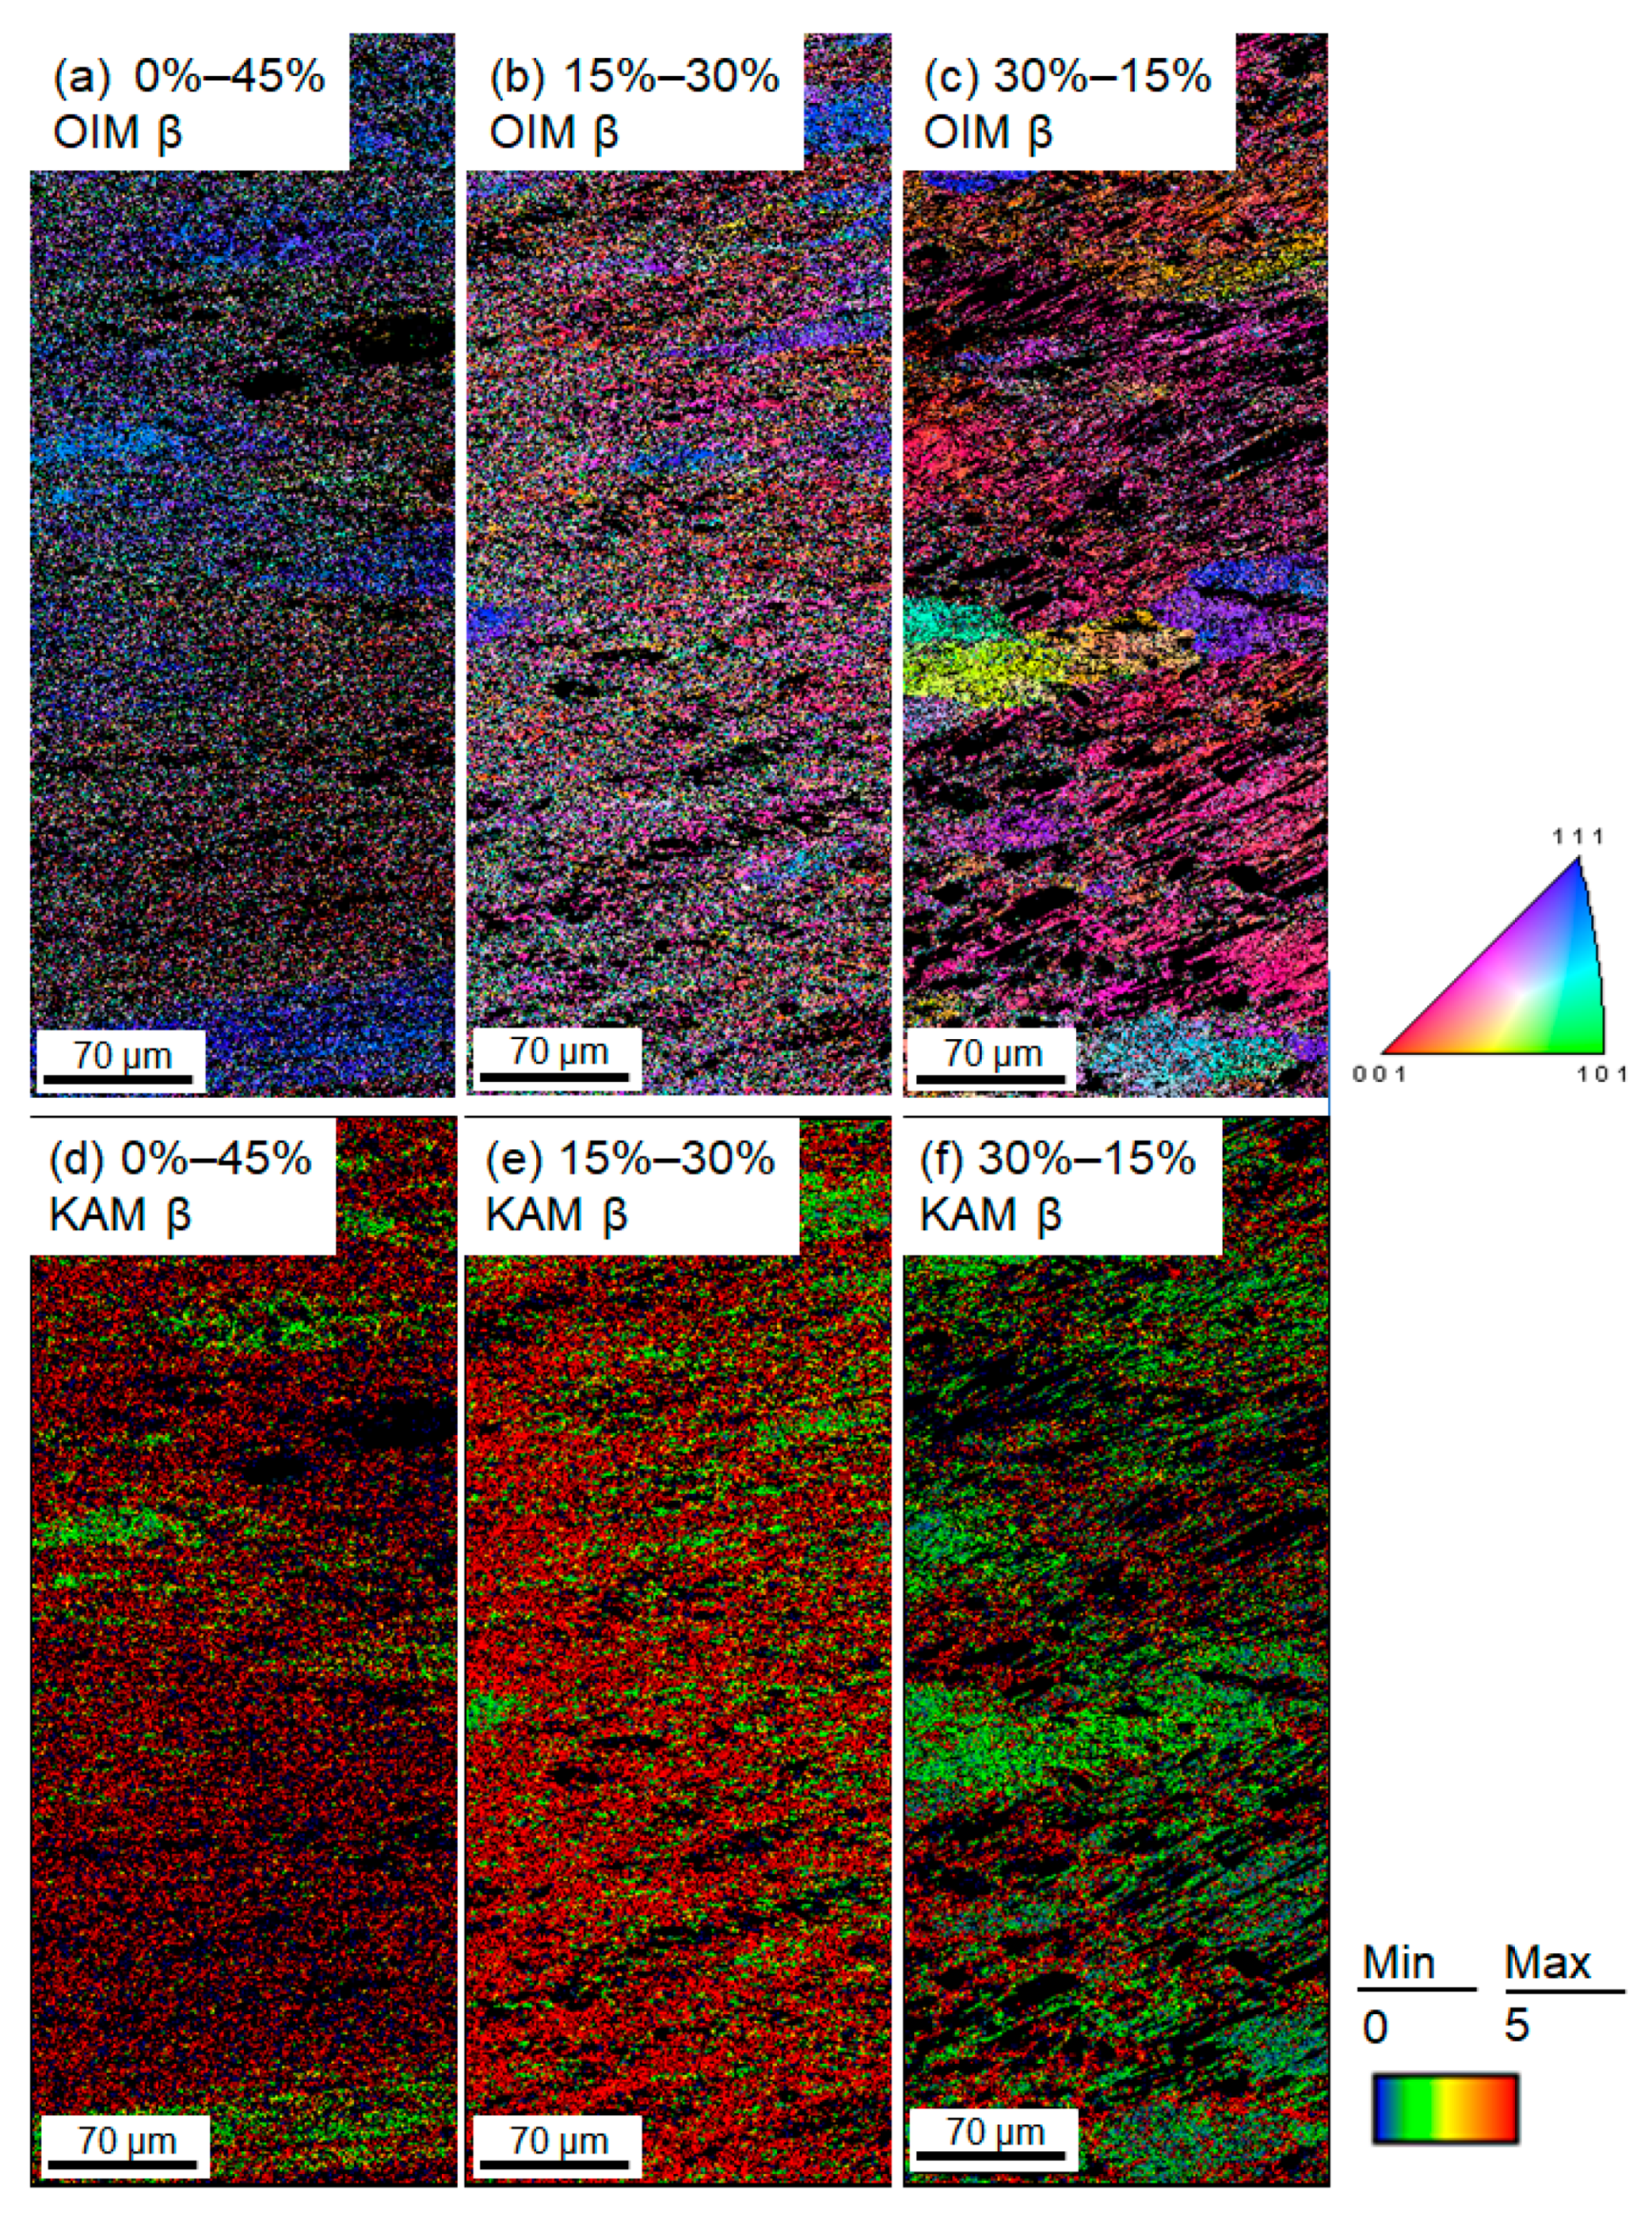
It has been reported that the {001} texture intensity is reinforced by DRX. The DRX is induced by the bulging of GBs inheriting the crystal orientation of a parent grain [25,26,27]. In addition, the growth of dynamic recrystallized grains during cooling in the β region after forging enhanced the {001} texture intensity, whereas dynamic recrystallized grains’ growth was not recognized during cooling in the (α + β) region [14]. Figure 14 shows the β-phase orientation maps and KAM maps of the β-phase at forging ratios of 0–45%, 15–30%, 30–15%, after which the α volume fraction was approximately 0.4 for those conditions, as shown in Figure 7. At 30–15%, the dynamic recrystallized grains nucleated during forging at 1253 K grew, exhibiting broad low KAM value areas, and the acicular α phase extensively penetrated β grains (black-colored areas in Figure 14e). In contrast, at 0–45% and 15–30%, phase distributions were similar between these forging conditions and the KAM value at 15–30% was higher than that at 15–30%, as in Figure 14, during which the DRX was suppressed during β forging at 15–30%. At 30–15%, DRX occurred during β forging at 1253 K and the average SF values’ change of the {110}<111>, {112}<111>, and {123}<111> slip systems in the β phase was low at 30% deformation, as in Figure 13. Furthermore, it can be interpreted that the α volume fraction quickly approached 0.4 during the temperature decrease after the prior β forging and during (α + β) forging because of the higher prior β forging ratio. As a result, the SF value for the {110}<111> slip system in the β phase significantly increased during the 15% deformation at 1253 K, at a forging ratio of 15–30%, as in Figure 11. Subsequently, the SF value of the {110}<111> slip system increased and the {001} texture intensity decreased as the (α + β) forging ratio increased, accompanied by α precipitation (Figure 9). For 0%, 15%, and 30% β forgings, the SF value of the {110}<111> slip system converged to approximately 0.45 at the total forging ratio of 75%. Here, it should be noted that the {001} texture intensity of 30% β forging was lower than that of 15% β forging in Figure 9. This is because the volume fraction of the α phase at the forging ratio of 30–15% was larger than that of 15–15% and the interior α phase precipitated during (α + β) forging, with a comparable transformation rate from the β to α phase between 30% β forging and 15% β forging, as shown in Figure 7.

4. Conclusions

We investigated the effects of grain-interior α precipitation on the β texture evolution of Ti-6246 alloy during sequential forgings at 1253 K in the β region and at 1073 K in the (α + β) region. The results of the present study led to the following conclusions.
  • During forging at 1253 K in the β region, the {001} texture intensity was enhanced and dynamic recrystallization occurred for the 30% β deformation. At 1073 K, the SF value of the {110}<111> slip system significantly decreased but those of the {112}<111> and {123}<111> slip systems increased during forging before α precipitation, which resulted in a moderate increase in the {001} β texture intensity.
  • Following α precipitation, the SF value of the {110}<111> slip system in the β phase increased for all β forging ratios and {001} decreased depending on the α phase fraction.
  • The final β texture was subject to the temperature dependency of β slip activities and the activation of the {110}<111> slip system, with accompanying interior α precipitation. The {001} texture intensity of the final β texture was more suppressed at higher (α + β) forging ratios under a constant total forging ratio, even with a comparable α phase fraction. The final β texture is thus dependent on the through-transus processing route.

Author Contributions

Conceptualization, T.K. and L.M.; methodology, T.K. and L.M.; software, T.K. and L.M.; formal analysis, T.K. and L.M.; resources, T.K. and M.W.; data curation, L.M.; writing—original draft preparation, T.K.; writing—review and editing, L.M. and M.W.; project administration, T.K.; funding acquisition, T.K. and M.W. All authors have read and agreed to the published version of the manuscript.

Funding

This research was partly funded by the Council for Science, Technology, and the Innovation; the Cross-ministerial Strategic Innovation Promotion Program; and the Process Innovation for Super Heat-resistant Metal (funding agency: Japan Science and Technology Agency).

Data Availability Statement

Not applicable.

Acknowledgments

The authors gratefully acknowledge Toshihiro Tsuchiyama at the Kyushu University for the fruitful discussions.

Conflicts of Interest

The authors declare no conflict of interest.

References

  1. Lütjering, G. Influence of processing on microstructure and mechanical properties of (α + β) titanium alloys. Mater. Sci. Eng. A 1998, 243, 32–45. [Google Scholar] [CrossRef]
  2. Weiss, I.; Semiatin, S.L. Thermomechanical processing of alpha titanium alloys—An overview. Mater. Sci. Eng. A 1999, 263, 243–256. [Google Scholar] [CrossRef]
  3. Peters, J.O.; Lütjering, G. Comparison of the fatigue and fracture of α + β and β titanium alloys. Metall. Mater. Trans. A 2001, 32, 2805–2818. [Google Scholar] [CrossRef]
  4. Sauer, C.; Luetjering, G. Thermo-mechanical processing of high strength β-titanium alloys and effects on microstructure and properties. J. Mater. Process. Technol. 2001, 117, 311–317. [Google Scholar] [CrossRef]
  5. Peters, J.O.; Lütjering, G.; Koren, M.; Puschnik, H.; Boyer, R.R. Processing, microstructure, and properties of β-CEZ. Mater. Sci. Eng. A 1996, 213, 71–80. [Google Scholar] [CrossRef]
  6. Le Corre, S.; Forestier, R.; Brisset, F.; Mathon, M.; Solas, D. Influence of β-forging on texture development in Ti 6246 alloy. In Proceedings of the 13th World Conference on Titanium; Venkatesh, V., Pilchak, A.L., Allison, J.E., Ankem, S., Boyer, R., Christodoulou, J., Fraser, H.L., Ashraf Imam, M., Kosaka, Y., Rack, H.J., et al., Eds.; Wiley: Hoboken, NJ, USA, 2016; pp. 757–764. [Google Scholar]
  7. Fan, J.K.; Kou, H.C.; Lai, M.J.; Tang, B.; Chang, H.; Li, J.S. Hot deformation mechanism and microstructure evolution of a new near β titanium alloy. Mater. Sci. Eng. A 2013, 584, 121–132. [Google Scholar] [CrossRef]
  8. Meng, L.; Kitashima, T.; Tsuchiyama, T.; Watanabe, M. Effect of α precipitation on β texture evolution during β-processed forging in a near-β titanium alloy. Mater. Sci. Eng. A 2020, 771, 138640. [Google Scholar] [CrossRef]
  9. Meng, L.; Kitashima, T.; Tsuchiyama, T.; Watanabe, M. β-texture evolution during α precipitation in the two-step forging process of a near-β titanium alloy. Metall. Mater. Trans. A 2020, 51, 5912–5922. [Google Scholar] [CrossRef]
  10. Hirth, J.P.; Lothe, J. Theory of Dislocations, 2nd ed.; John Wiley & Sons: New York, NY, USA, 1982; p. 288. [Google Scholar]
  11. Attallah, M.M.; Zabeen, S.; Cernik, R.J.; Preuss, M. Comparative determination of the α/β phase fraction in α + β-titanium alloys using X-ray diffraction and electron microscopy. Mater. Charact. 2009, 60, 1248–1256. [Google Scholar] [CrossRef]
  12. Dehghan-Manshadi, A.; Dippenaar, R.J. Strain-induced phase transformation during thermo-mechanical processing of titanium alloys. Mater. Sci. Eng. A 2012, 552, 451–456. [Google Scholar] [CrossRef] [Green Version]
  13. Zhao, L.; Park, N.; Tian, Y.; Shibata, A.; Tsuji, N. Deformation-assisted diffusion for the enhanced kinetics of dynamic phase transformation. Mater. Res. Lett. 2018, 6, 641–647. [Google Scholar] [CrossRef] [Green Version]
  14. Meng, L.; Kitashima, T.; Tsuchiyama, T.; Watanabe, M. β-texture evolution of a near-β titanium alloy during cooling after forging in the β single-phase and (α + β) dual-phase regions. Metall. Mater. Trans. A 2021, 52, 303–315. [Google Scholar] [CrossRef]
  15. Bertrand, E.; Castany, P.; Gloriant, T. An alternative way to orient the parent phase in the cubic/orthorhombic martensitic transformation of titanium shape memory alloys. Scr. Mater. 2014, 83, 41–44. [Google Scholar] [CrossRef] [Green Version]
  16. Germain, L.; Gey, N.; Humbert, M.; Vo, P.; Jahazi, M.; Bocher, P. Texture heterogeneities induced by subtransus processing of near α titanium alloys. Acta Mater. 2008, 56, 4298–4308. [Google Scholar] [CrossRef]
  17. Suri, S.; Viswanathan, G.B.; Neeraj, T.; Hou, D.-H.; Mills, M.J. Room temperature deformation and mechanisms of slip transmission in oriented single-colony crystals of an α/β titanium alloy. Acta Mater. 1999, 47, 1019–1034. [Google Scholar] [CrossRef]
  18. He, D.; Zhu, J.; Zaefferer, S.; Raabe, D. Effect of retained beta layer on slip transmission in Ti–6Al–2Zr–1Mo–1V near alpha titanium alloy during tensile deformation at room temperature. Mater. Des. 2014, 56, 937–942. [Google Scholar] [CrossRef] [Green Version]
  19. Tan, C.; Sun, Q.; Xiao, L.; Zhao, Y.; Sun, J. Slip transmission behavior across α/β interface and strength prediction with a modified rule of mixtures in TC21 titanium alloy. J. Alloys Compd. 2017, 724, 112–120. [Google Scholar] [CrossRef]
  20. Williams, J.C.; Baggerly, R.G.; Paton, N.E. Deformation behavior of HCP Ti-Al alloy single crystals. Metall. Mater. Trans. A 2002, 33, 837–850. [Google Scholar] [CrossRef]
  21. Calnan, E.A.; Clews, C.J.B. LXV. The development of deformation textures in metals—Part II. Body-centred cubic metals. London Edinburgh Dublin Philos. Mag. J. Sci. 1951, 42, 616–635. [Google Scholar] [CrossRef]
  22. Weinberger, C.R.; Boyce, B.L.; Battaile, C.C. Slip planes in bcc transition metals. Int. Mater. Rev. 2013, 58, 296–314. [Google Scholar] [CrossRef]
  23. Chin, G.Y. Competition among {110}, {112}, and {123}<111> slip modes in BCC metals. Metall. Trans. 1972, 3, 2213–2216. [Google Scholar] [CrossRef]
  24. Castany, P.; Besse, M.; Gloriant, T. In situ TEM study of dislocation slip in a metastable β titanium alloy. Scr. Mater. 2012, 66, 371–373. [Google Scholar] [CrossRef] [Green Version]
  25. Chen, Y.; Li, J.; Tang, B.; Kou, H.; Xue, X.; Cui, Y. Texture evolution and dynamic recrystallization in a beta titanium alloy during hot-rolling process. J. Alloys Compd. 2015, 618, 146–152. [Google Scholar] [CrossRef]
  26. Wu, Y.; Kou, H.; Wu, Z.; Tang, B.; Li, J. Dynamic recrystallization and texture evolution of Ti-22Al-25Nb alloy during plane-strain compression. J. Alloys Compd. 2018, 749, 844–852. [Google Scholar] [CrossRef]
  27. Hasegawa, M.; Yamamoto, M.; Fukutomi, H. Formation mechanism of texture during dynamic recrystallization in γ-TiAl, nickel and copper examined by microstructure observation and grain boundary analysis based on local orientation measurements. Acta Mater. 2003, 51, 3939–3950. [Google Scholar] [CrossRef]
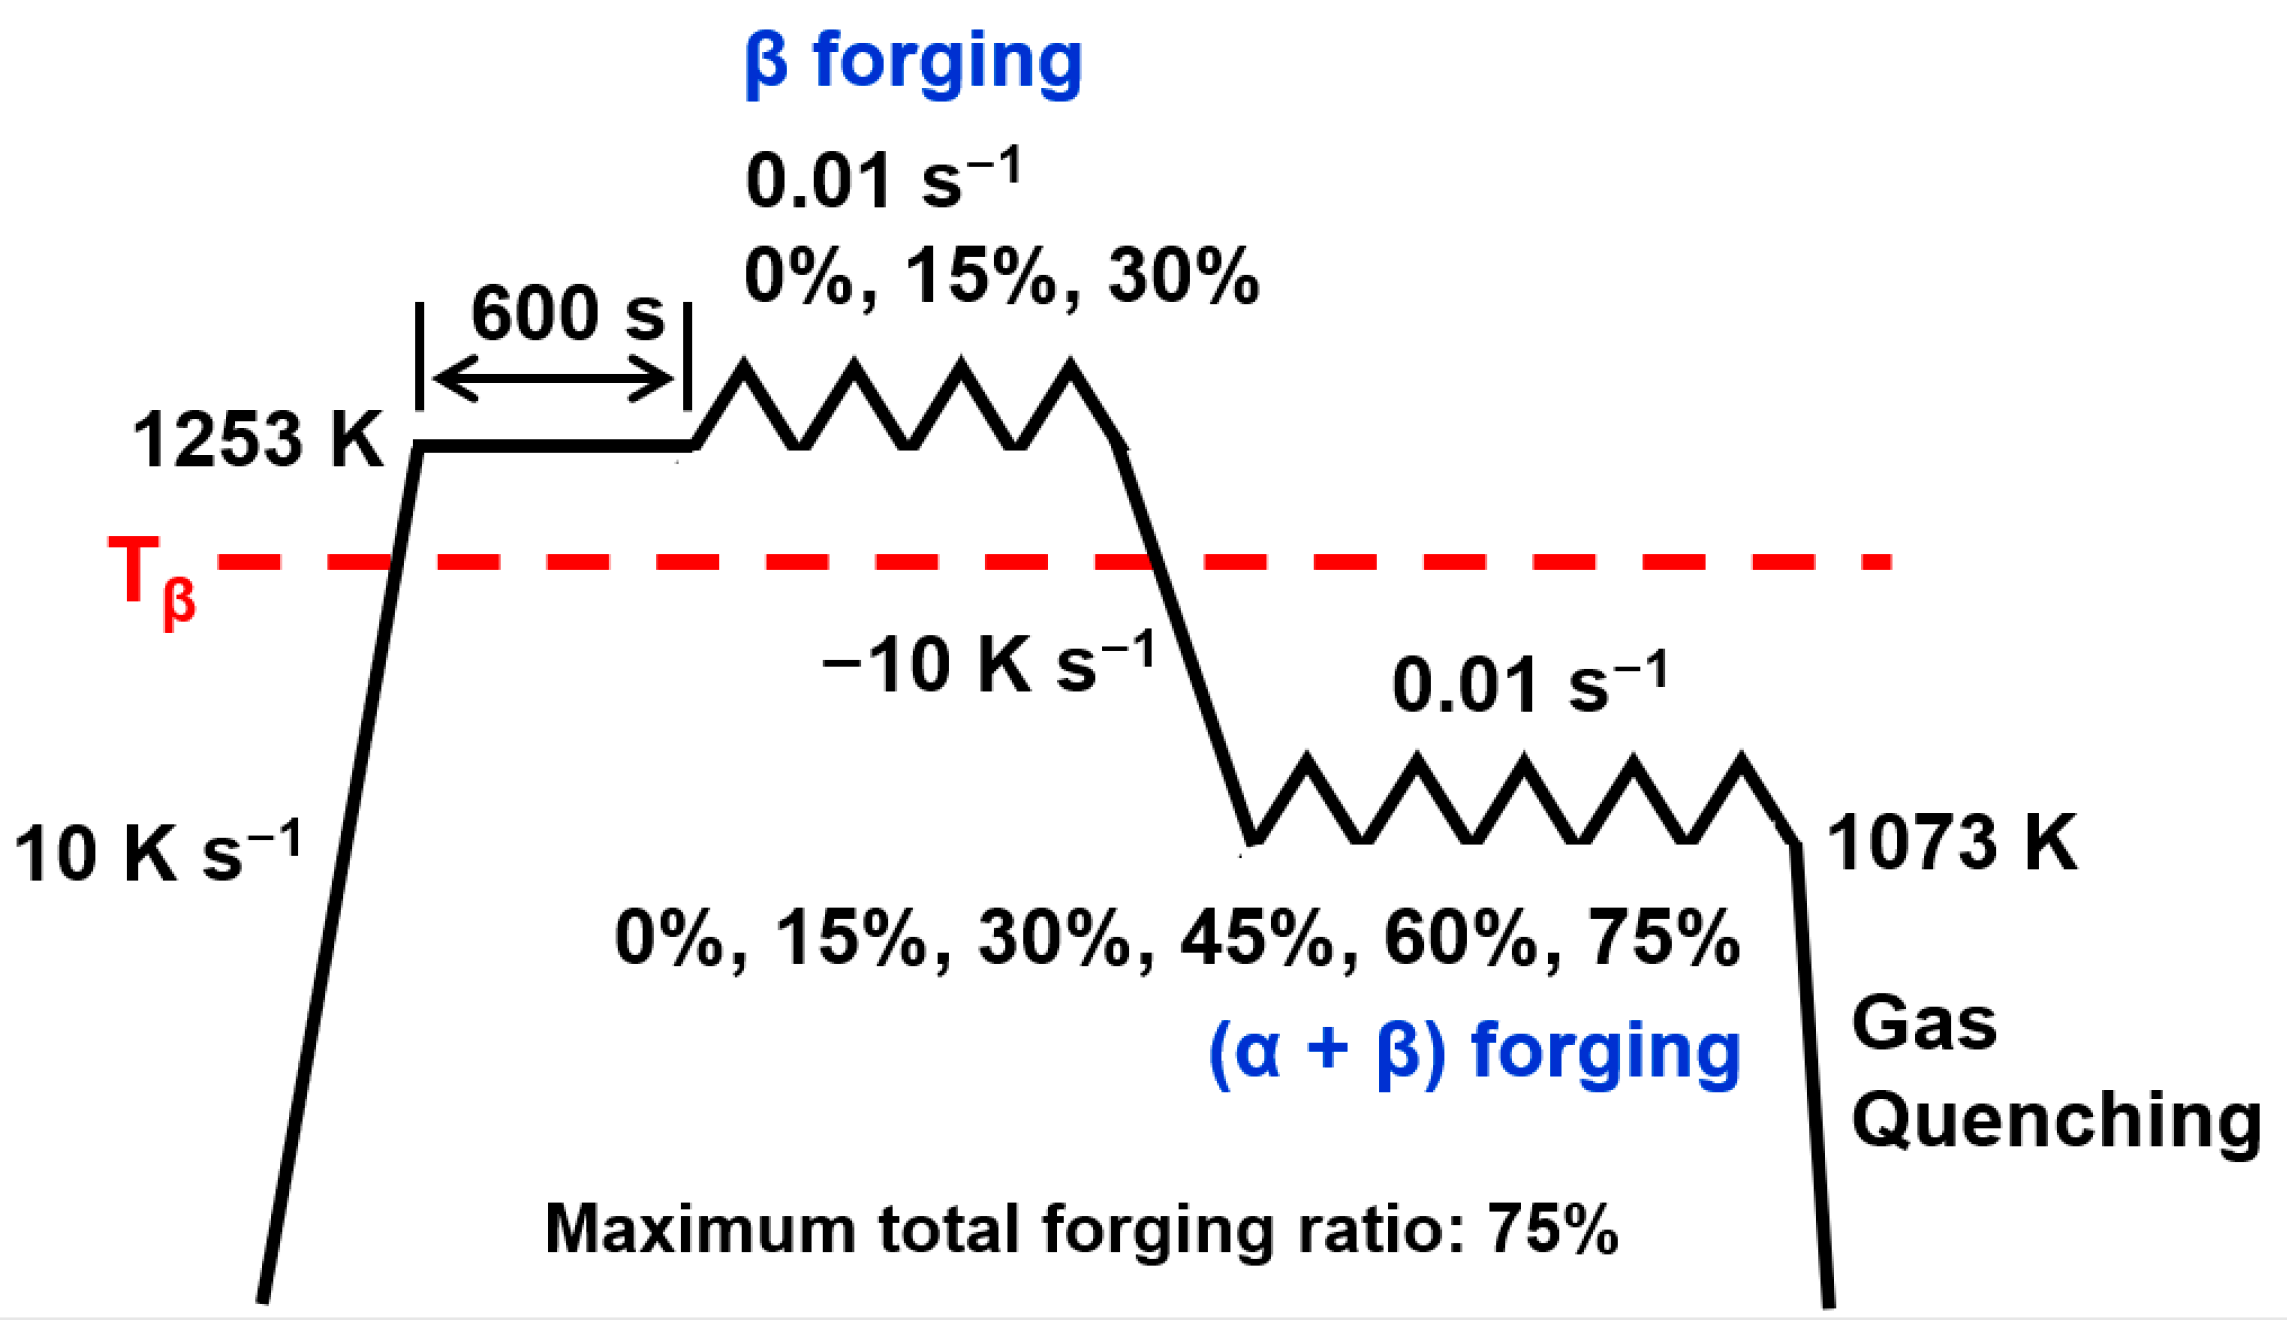
Figure 1. Schematic of the temperature–time sequences of the thermomechanical processes.
Metals 11 01405 g001
Figure 2. (a) Backscattered-electron image, (b) X-ray diffraction (XRD) pattern, (c) β-phase orientation image map, and (d) β-phase inverse-pole figure of the as-received Ti-6246 alloy.
Metals 11 01405 g002
Figure 3. Backscattered-electron images obtained after two-step forging with 0% β forging at forging ratios of (a,b) 0–15%, (c,d) 0–45%, (e) 0–60%, and (f) 0–75%.
Metals 11 01405 g003
Figure 4. Backscattered-electron images obtained after two-step forging with 15% β forging at forging ratios of (a,b) 15–15%, (c,d) 15–30%, (e) 15–45%, and (f) 15–60%.
Metals 11 01405 g004
Figure 5. Backscattered-electron images obtained after two-step forging with 30% β forging at forging ratios of (a,b) 30–15%, (c) 30–30%, and (d) 30–45%.
Metals 11 01405 g005
Figure 6. XRD patterns of forged specimens with (a) 0%, (b) 15%, and (c) 30% β forging in the two-step forging.
Metals 11 01405 g006
Figure 7. α-phase fraction as a function of the forging ratio in the (α + β) region obtained after 0%, 15%, or 30% β forging.
Metals 11 01405 g007
Figure 8. β-phase inverse-pole figures (IPFs) obtained after the two-step forging with 0% β, 15%, and 30% β forging. They are perpendicular to the forging direction (FD).
Metals 11 01405 g008
Figure 9. (001) texture intensity as a function of the forging ratio in the (α + β) region with 0%, 15%, and 30% β forgings. The (001) texture intensity unit is multiples of uniform density (m.u.d.).
Metals 11 01405 g009
Figure 10. α-phase IPFs obtained after the two-step forging with 0%, 15%, and 30% β forging. They are perpendicular to the FD.
Metals 11 01405 g010
Figure 11. Average values of the Schmid factor (SF) values for the {110}<111> bcc β slip system as a function of the forging ratio in the (α + β) region with 0%, 15%, and 30% β forgings.
Metals 11 01405 g011
Figure 12. β-phase orientation image map (OIM) and Kernel average misorientation (KAM) map at forging ratios of (a,b) 15–15% and (c,d) 15–30%. These results were obtained via electron backscatter diffraction (EBSD) analysis.
Metals 11 01405 g012
Figure 13. Average SF values for the {123}<111>, {112}<111>, and {110}<111> bcc β slip systems at 1073 K and 1253 K as a function of the forging ratio.
Metals 11 01405 g013
Figure 14. β-phase OIM at forging ratios of (a) 0–45%, (b) 15–30%, and (c) 30–15%. β-phase KAM map at forging ratios of (d) 0–45%, (e) 15–30%, and (f) 30–15%.
Metals 11 01405 g014
Table 1. Chemical composition (mass percentage) of the Ti–6Al–2Sn–4Zr–6Mo alloy. Ti constitutes the remaining content.
AlSnZrMoFeCONTi
6.242.024.025.990.080.0060.100.002Bal.
Table 2. Average Schmid factor values for a-type (0001)<11–20> basal slip, {10–10}<11–20> prismatic slip, and {10–11}<11–20> pyramidal slip in the α-phase after the two-step forging at different forging ratios.
Forging RatioBasal
(0001)
Prismatic
{10–10}
Pyramidal
{10–11}
15–15%0.210.410.43
15–30%0.220.380.42
15–45%0.210.400.43
15–60%0.210.410.43
30–15%0.170.430.43
30–30%0.200.420.44
30–45%0.240.380.42
0–45%0.270.350.40
0–60%0.320.310.39
0–75%0.290.330.39
Publisher’s Note: MDPI stays neutral with regard to jurisdictional claims in published maps and institutional affiliations.