Article

Investigation of Fatigue Crack Growth in Full-Scale Railway Axles Subjected to Service Load Spectra: Experiments and Predictive Models

1
Dipartimento di Meccanica, Politecnico di Milano, Via La Masa 1, 20156 Milano, Italy
2
LucchiniRS, Via G. Paglia 2, 24065 Lovere, Italy
*
Author to whom correspondence should be addressed.
Metals 2021, 11(9), 1427; https://doi.org/10.3390/met11091427
Submission received: 7 July 2021 / Revised: 27 August 2021 / Accepted: 3 September 2021 / Published: 9 September 2021

Abstract

:
In this paper, a series of experimental investigations was performed on full-scale railway axles to analyze the fatigue crack growth behavior of EA4T steel under load spectrum derived from real operating conditions. The experimental results were compared to life predictions carried out adopting two models: (i) the conventional Nasgro equation and (ii) the cyclic R-curve concept implemented in the Modified Nasgro equation for describing the crack growth behavior of an arbitrary crack length. The results show that the life predictions performed by means of the Modified Nasgro equation coincide well with the experimental results with an underestimation of the residual lifetime less than 32%, while the traditional Nasgro equation leads to significant overestimation (≈120%) of the residual lifetime for load spectra close to the in service scenario.

1. Introduction

Railway axles are critical components, and their design assessment procedure, as well as the maintenance program, require special attention. The design route must consider the deterioration of the axles during service that can be promoted by (i) surface damage from ballast impacts [1,2,3], (ii) pitting from corrosion [4], and (iii) surface scars in press-fits [5,6,7]. All these types of damages can lead to fatigue crack growth under a sufficient level of local cyclic stresses. Accordingly, the traditional design approach based on the infinite life has to be complemented by a damage tolerant approach. Damage tolerance was originally developed for aeronautic applications in the seventies [8,9] and more recently introduced in the railway industry [10,11]. The key concept of damage tolerance is the assumption of pre-existing defects which can be generally treated based on suitable probabilistic approaches [2,3]. By means of appropriate crack growth algorithms, the residual lifetime and, consequently, an adequate inspection plan aimed to improve the reliability of the component can be defined. Establishing a quantitative procedure for determining residual axle lifetimes is of fundamental importance, and it is still the subject of scientific studies as demonstrated by several projects devoted to this issue, e.g., Widem [12], Euraxles [13], and Maraxil [14].
Numerous studies have addressed the experimental investigation of the fatigue crack growth behaviour of full-scale railway axles [15,16,17,18,19,20,21]. As a result, the need for a proper fatigue crack propagation model applicable for the in-service condition of railway axles is essential to plan the inspection intervals. Several studies have presented damage tolerance analyses of railway axles exploiting the relationship between the fatigue crack growth rate, d a / d N , and the stress intensity factor (SIF) range Δ K acquired under constant and variable amplitude load histories [10,22,23,24,25,26]. The Nasgro equation [27] has been widely used in residual lifetime prediction of the railway axles [28] because it allows a good description of the near-threshold regime, which is the most important region for an axle assessment [10]. Moreover, the Nasgro equation also allows describing the crack growth rates for positive and negative load ratios (R). This effect was shown to be very important for modeling the detrimental effect of positive mean stresses induced in notches by the near press-fits [29], the beneficial effect of cold-rolling [30,31], and induction-hardening [21,32].
However, there are two major limitations related to the adoption of the Nasgro equation for residual lifetime predictions of railway axles. First, the Nasgro equation does not adequately describe short crack growth below the long crack SIF threshold range Δ K t h , l c . To overcome this limitation, a modified version of the Nasgro equation has been introduced by J. Maierhofer et al. [33]. This equation can describe the growth rate of arbitrary crack lengths under the condition of small-scale yielding adopting the concept of the cyclic R-curve [34,35,36]. The R-curve highlights the Δ K t h dependency with crack extension Δ a , and this represents an attractive improvement for the conventional Nasgro equation [37] because it allows to obtain a physically-based model for short crack growth behaviour. Second, a recent study by P. Pokorny [38] revealed that the opening function f implemented in Nasgro equation is not able to sufficiently describe the crack closure in the threshold area. The results indicated that the roughness-induced and oxide-induced crack closure mechanisms play an important role in the threshold area of the EA4T steel and that R-curve concept leads to an adequate description of the phenomena [39]. In terms of application to railway axles, the differences between the adoption of Nasgro equation and R-curve concept for describing crack growth curves have been recently discussed [40], but an experimental full-scale validation adopting real load spectrum, and a comparison with the widely used Nasgro equation, is still missing.
This manuscript presents an extensive experimental investigation of the crack growth behaviour of full-scale railway axles subjected to variable amplitude loadings under load spectra representative of real service conditions. Then, the application of the conventional Nasgro model vs R-curve concept for evaluating the residual lifetime of the axle is discussed, and the life predictions are compared with the full-scale experiments. For the first time in the literature, results show non-conservative predictions of the traditional Nasgro model, respect to simulations based on the cyclic R-curve, at stress spectra close to real service scenario of railway axles.

2. Material and Experimental Setup

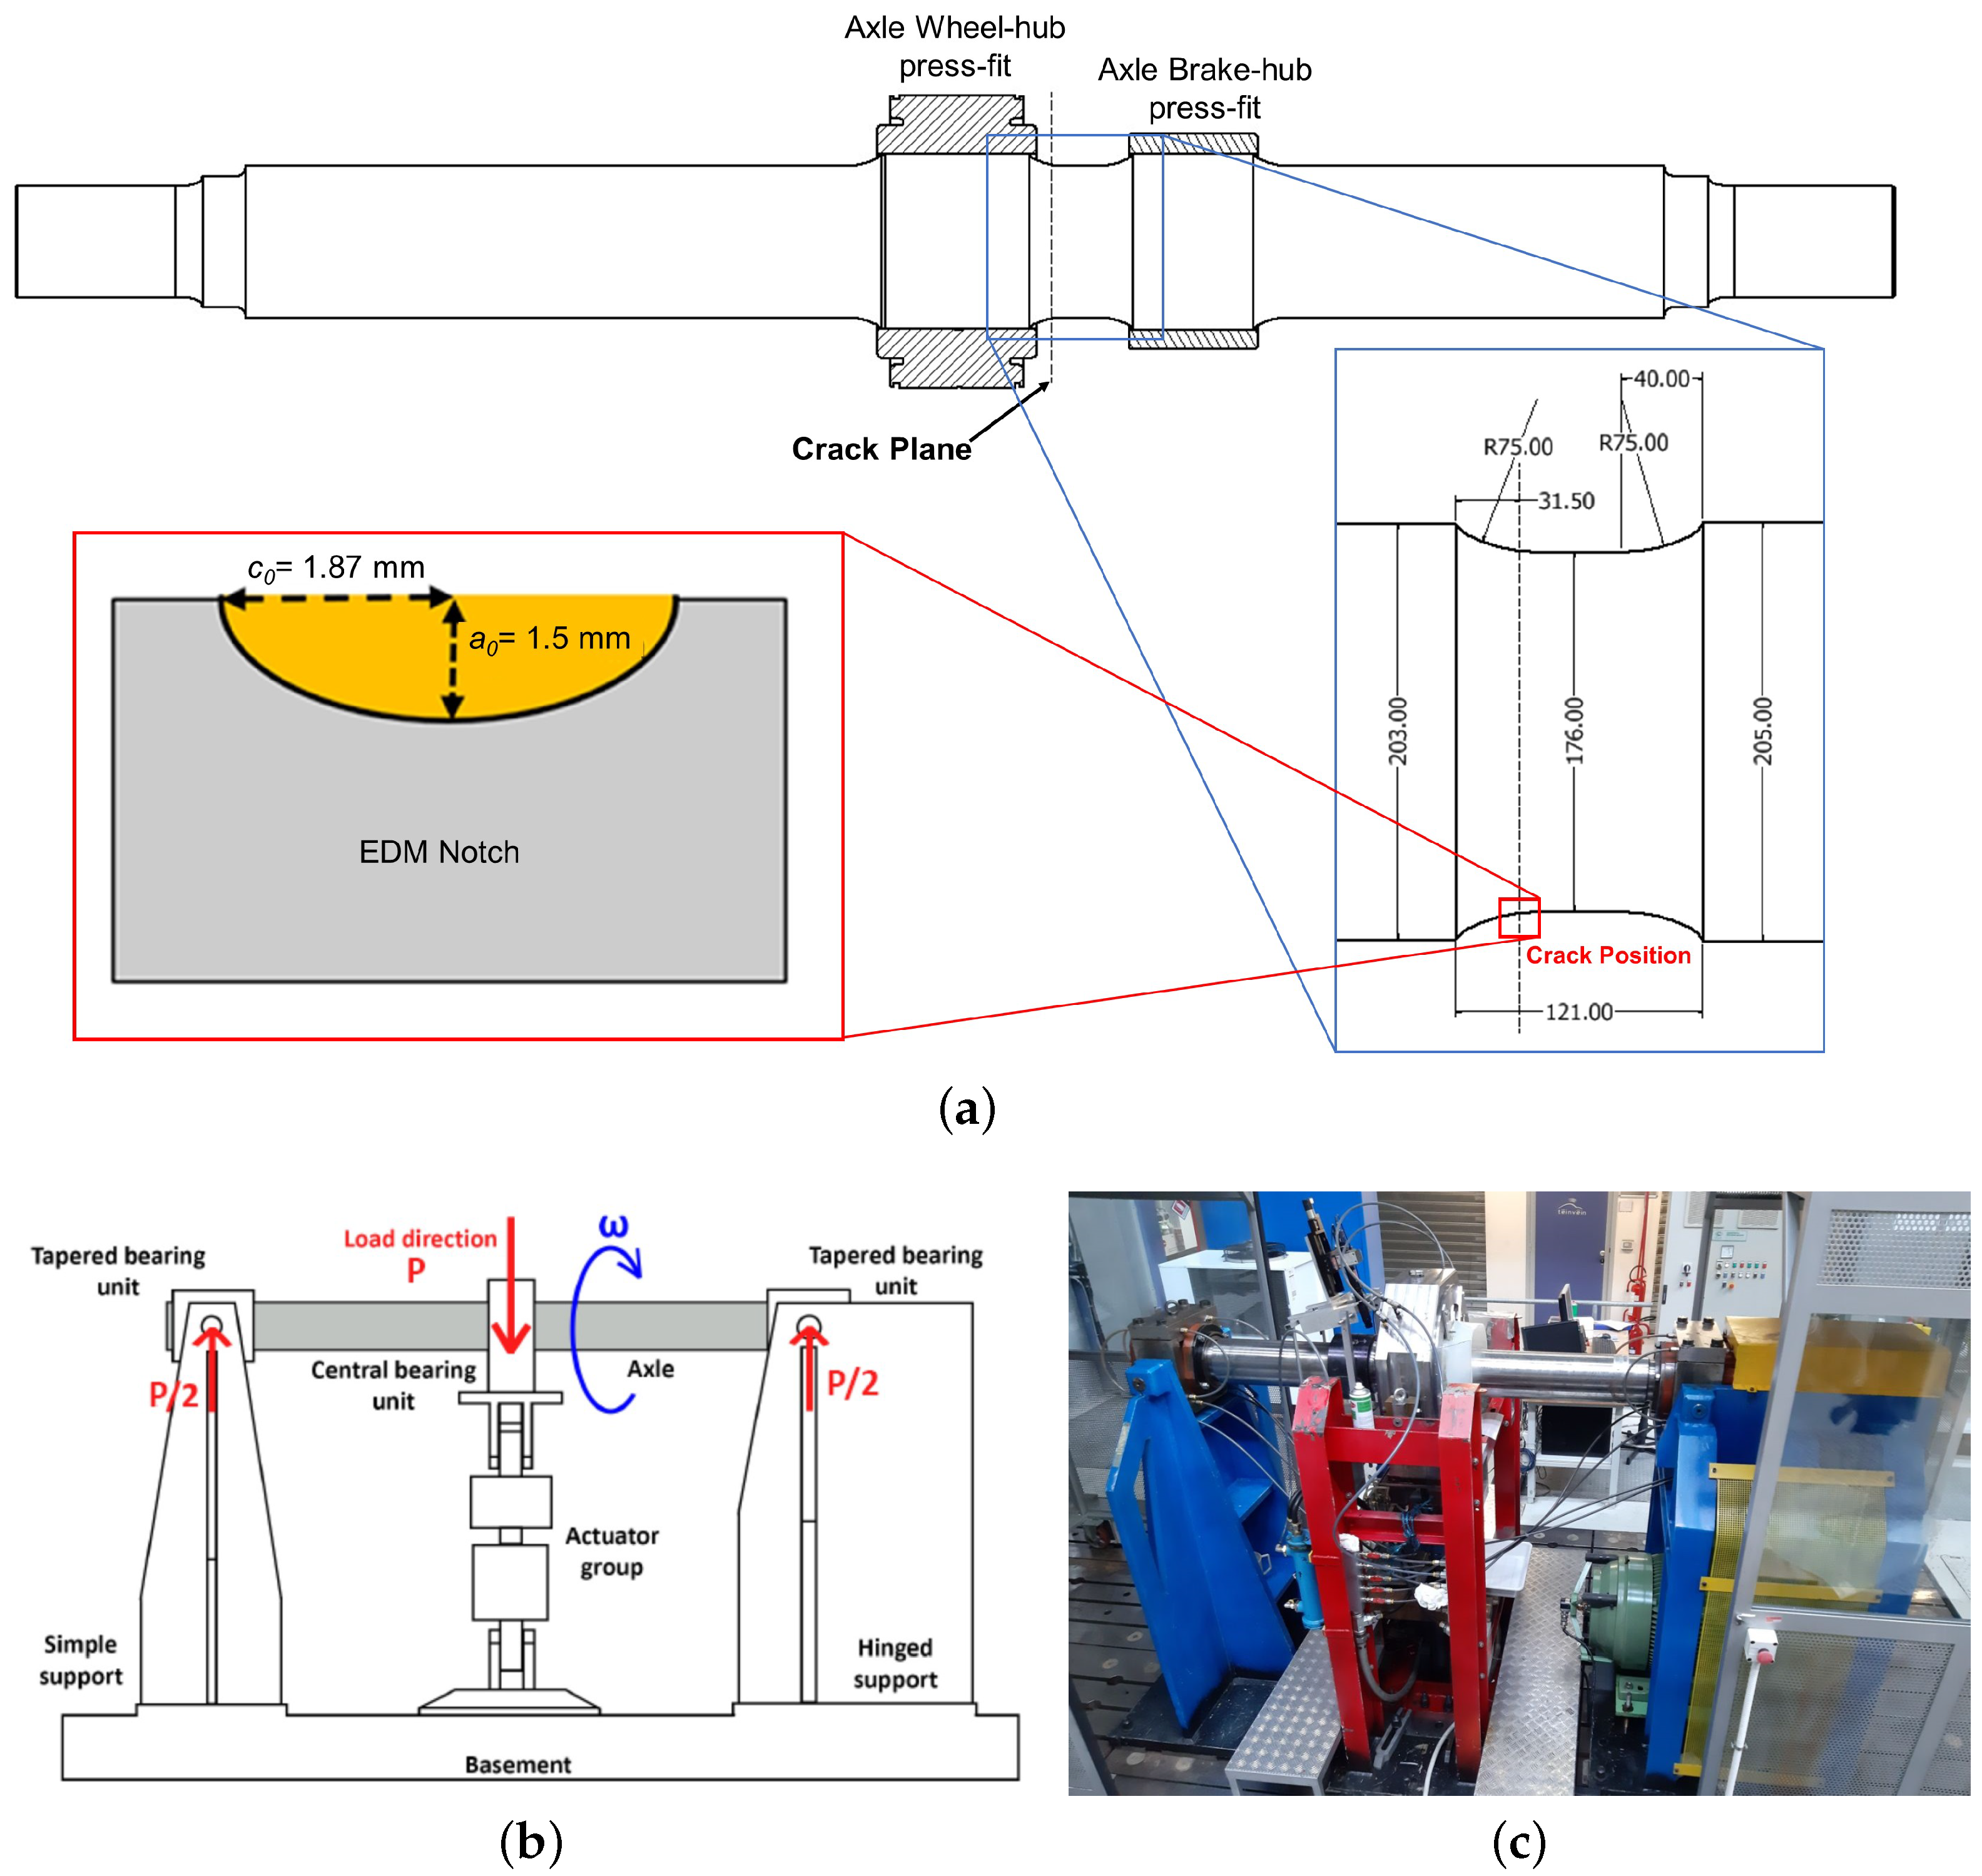
2.1. Specimens and Test Details of Full-Scale Axle Tests

The adopted full-scale axle specimens are shown in Figure 1. The axles were designed to be tested under the three-point bending bench with 250 kN load capacity (Figure 1b,c), available at both Politecnico di Milano and Lucchini Rs R&D laboratories. The axles were made of 25CrMo4 (EA4T) steel according to the European standard BS EN 13261 [41], and they were quenched and tempered with the tensile properties shown in Table 1. Note that the tensile specimens were machined according to the EN 13261 standard from different locations of the axle. Two hubs representing the wheel and the brake were press-fitted to the axle with contact pressures similar to the actual full-scale components. Semi-elliptical artificial defects with initial depth a = 1.5 mm and aspect ratio a / c = 0.8 were introduced by electrical discharge machining (EDM), being c the superficial crack length. The semi-elliptical shape is dictated by the type of damage that is typically promoted by the impact of foreign objects, as shown and discussed also in the literature [1,2,42]. The dimensions, instead, are determined by the minimum detectable defect size of the employed non-destructive methodology [43] together with the statistics obtained in the RSSB T728 project [2].
The identification of the region where a prospective crack would determine the shortest fatigue life is critical for a reliable assessment of railway axles. Analysis of the in-service fatigue failure of the axles [44,45,46] has shown that the notch transitions and the axle body are the most susceptible areas for fatigue failure. Then, for the present axle geometry, it can be expected that the critical position would occur in one of the notches close to the press-fitted wheel due to the combination of (i) the maximum bending moment, (ii) the change of the axle diameter which induces a notch effect, and (iii) the effect of the press-fit. For these reasons, the defects were positioned in the section near the press-fitted wheel and brake disc (see Figure 1a).
The tests on the full-scale axles were interrupted to measure the crack extension by using the combination of three techniques: the plastic replica, the magnetic particle inspection method, and the optical microscope, examples are shown in Figure 2.
Test interruptions were always made at the occurrence minimum load during test sequences. The plastic replica enables capturing short crack extensions from the notch root. However, when the crack extension is higher, the crack length measurements were performed with the optical microscope. Finally, when the total superficial crack length reaches approximately 40 mm, the magnetic particle inspection method was adopted.
The axles were subjected to variable amplitude loading sequences derived from a typical in-service load spectrum train axle applications and representative of 57,000 km service. The load spectrum and its discretization as load blocks are shown in Figure 3. For each test, a variant of this spectrum is employed by increasing the load classes with a given amplification factor. The crack initiation phase of the test, in which the crack extension Δa was less than 200 μm, was disregarded and only the part of the test where the crack exceeded this length was considered.

2.2. Experimental Setup and Test Details of Fatigue Crack Propagation Tests

The single-edge notched bending (SEB) specimen geometry was adopted to determine the crack propagation properties. The present SEB geometry was characterized by a length of 110 mm, thickness of 12 mm, a width of 24 mm, and a notch depth of 6.5 mm. The specimens were all cut from the tested full-scale axles. To nucleate a crack with limited load history effects, the compression pre-cracking procedure was adopted [47,48]. This technique enabled nucleating pre-cracks with lengths in the order of 100 to 200 μm. Following pre-cracking, a combination of different testing procedures were adopted to evaluate the fatigue crack growth rates, the long crack thresholds, and cyclic R-curve:
  • Compression Pre-cracking Constant Amplitude (CPCA) [49]
  • Compression Pre-cracking Load Reduction (CPLR) [48]
  • Compression Pre-cracking Constant- Δ F and Constant- Δ K methods used for the determination of the cyclic R-curve [50].
The tests were performed in bending configuration under a Rumul Craktronic resonant bending load frame characterized by a working frequency of approximately 130 Hz. A summary of the experimental campaign performed on the fatigue crack propagation specimens and the experimental techniques adopted for crack growth measurements is presented in Table 2. Note that an additional 9 specimens were used to determine the R-curve at R = −1 (further details related to these experiments are given in [50]).

3. Experimental Results

3.1. Results of the Full-Scale Tests

The results of the full-scale tests were analyzed in terms of crack length vs. number of cycles. Table 3 summarizes all the full-scale crack propagation tests that were performed in the framework of this research. The table contains the calculated maximum Δ K by adopting the Wang–Lambert [51] weight function SIF solution at surface and deepest points normalized by the average Δ K t h , l c obtained at R = −1 (see Table 2). Table 3 also provides an indication of the load classes which would yield to crack propagation according to a simple crack propagation model that adopts Δ K t h , l c as the threshold condition. It can be seen that the highest level of the spectrum was applied for axle S064 with 2.3 % and 35 % of the spectrum above the Δ K t h , l c for the deepest and surface points of the initial crack, respectively. In comparison, the lowest level of the spectrum was applied for axle S067, where 99.98% and 98.1% of the spectrum at the points a and c were below the Δ K t h , l c at the beginning of the crack propagation phase.
Following the full-scale tests, the axles were cut and broken to analyze the fracture surfaces. As an example, Figure 4 shows the fracture surface of the S064 axle. During crack propagation, the crack depth to surface length ratio a / c varies, but the basic shape remains semi-elliptical, as also observed in other experiments on railway axles [10,24]. As the crack growth during the tests was measured on the surface, the beach marks in the fracture surface were reconstructed using ellipses to assess the crack shape and subsequent crack depth a.

3.2. Fatigue Crack Propagation Tests Results

The trend of the Δ K t h , l c against the stress ratio is reported in Figure 5a. Figure 5b shows the obtained experimental crack growth data for the load ratios R = −2, −1, 0.05, 0.7. The experimental cyclic R-curve at the load ratio R = −1 is illustrated in Figure 6a. The R-curve shows a steep increase in the threshold up to crack extension of 1 mm, then it gradually increases up to 3 mm and reaches asymptotic Δ K t h , l c values. The fitting of the cyclic R-curve will be presented in Section 4.2.

4. Crack Growth Models and Parameter Determination

The conventional Nasgro equation [52] and the Modified Nasgro equation for physically short cracks [33] have been chosen because they take into account different effects acting on the crack propagation rate in components made of metallic materials (i.e., R and load interaction effects). In the following sections, the calibration of the two models is presented and discussed.

4.1. Calibration of the Nasgro Equation

The Nasgro equation fully describes the three regions of the d a / d N vs. Δ K diagram:
d a d N = C 1 f 1 R Δ K n 1 Δ K t h Δ K p 1 K m a x K c q
where C ,   n ,   p , and q are empirically derived constants; Δ K t h is the SIF threshold range; and K c is the critical SIF. The parameter f accounts for the plasticity-induced crack closure [53], and it is calculated with the Newman function provided in the Nasgro equation. Δ K t h is determined from the following equations:
Δ K t h = Δ K 1 a a + a 0 1 R 1 f ( 1 R · C t h ) ( 1 A 0 ) ( C t h + R · C t h ) if R < 0 Δ K 1 a a + a 0 1 R 1 f ( 1 R · C t h + ) ( 1 A 0 ) ( 1 R ) · C t h + if R 0
Δ K 1 is the threshold SIF range for R 1 , A 0 is the parameter used in the crack closure equation of Newman, and C t h + and C t h are two empirical constants which control the Δ K t h dependency on R and need to be considered separately for positive and negative R values. a 0 is the El-Haddad parameter for small cracks [54], its value was taken from previous analyses on EA4T [5]. Figure 5a,b shows the experimental Δ K t h , l c and fatigue crack growth curves obtained by the LR and CA methods (see Section 3.2), respectively. The Nasgro Equations (1) and (2) were fitted applying the least-squares method considering S m a x / S o = 0.3 and α = 2.5 . The present fit is compared with Nasgro fit obtained by EBFW3 project [40] and it can be seen that the results are similar.

4.2. Calibration of the Modified Nasgro Equation

The Nasgro equation (Equation (1)) was modified by Mairhofer and co-authors to improve the accuracy of the predicted crack growth rates in the short crack regime [33]. In particular, the authors proposed to adopt the concept of the cyclic R-curve for the description of the Δ K t h -dependency with crack length. Accordingly, the initial Δ K t h at a nominal crack extension of Δ a = 0 is considered to be equal to the intrinsic SIF range Δ K t h , e f f . This condition is supposed to correspond to the initial condition of a defect in the material. The stabilized Δ K t h for long cracks is Δ K t h , l c , while the transition region is described with the following equation:
Δ K t h = Δ K t h , e f f + Δ K t h , l c Δ K t h , e f f 1 i = 1 n ν i e x p Δ a l i
with the constraint:
i = 1 n ν i = 1
The l i values can be interpreted as fictitious length scales for the formation of crack closure effects which must be determined in conjunction with the ν i by fitting the experiment R-curve data points [50].
For calculating the crack growth rate for an arbitrary crack length, the Nasgro equation (Equation (1)) was simplified as suggested in [33] by setting p = n and q = 1 independent of R, and it was transformed to
d a d N = C · F · Δ K Δ K t h n 1 1 1 R Δ K K c
The crack growth constant C and the Paris exponent n are determined by least-squares fitting of Equation (5), and the crack velocity factor F is calculated using the predetermined l i and ν i parameters:
F = 1 ( 1 F l c ) . 1 i = 1 n ν i e x p Δ a l i
with
F l c = 1 f 1 R n
in which f is the corresponding to the Newman function in Nasgro equation.
Figure 6a illustrates the experimentally obtained R-curve at R = −1 (see Section 3.2) for the present EA4T steel together with the R-curve fit using Equation (3) and a 90% scatter band. To validate the Modified Nasgro model, a comparison of the experimental tests on SEB specimens and predicted crack growth rates for a short crack starting from a notch of depth of 6.5 mm at R = −1 was performed and is presented in Figure 6b. As it can be seen, in the first two load steps the crack growth rate slows down and the crack stops due to the build-up of crack closure. Only after a further increase of the load amplitude, the crack grows reaching the threshold of long cracks.
Additionally, the build-up of crack closure can be assumed to be similar at different R [33]. Following this concept, for modeling the R-curve at different stress ratios, the term ( Δ K t h , l c Δ K t h , e f f ) in Equation (3) was described through Nasgro dependence of Δ K t h , l c on R (see Equation (2) for a > > a 0 ).

5. Residual Lifetime Predictions

For a precise calculation of the residual lifetime of an axle, the knowledge of several factors is required: the load spectrum acting on the axle during service, the crack growth behavior of the adopted steel grade, as well as the precise evaluation of the stress intensity factors along the crack front. In particular, for analyzing semi-elliptical crack propagation, it is necessary to perform separate analyses for the surface point a and for the deepest point c of the crack front.
The Wang–Lambert [51] weight function adopted is valid for a simple plate geometry which can still be used here as it has been proved to give reasonable results when applied to full-scale axles containing semi-elliptical fatigue cracks [55] compared to other solutions [56,57,58,59,60,61]. As shown in Figure 7, the longitudinal normal stresses acting on the crack plane associated with both the rotating bending and the press-fit stresses were obtained by a dedicated finite element model (more details about the finite element analysis can be found in [55]). Due to the press-fit, the wheel squeezes the axle under its seat, and the surrounding regions stretch inducing local tensile stresses which are superimposed with the rotating bending stresses. As the tensile residual stresses are constant, they determine an increment of the local R which will be higher than −1 [29].
There are additional compressive residual stresses acting on the crack plane induced by the manufacturing process. As it is shown in [63], the residual stresses determine a positive or a negative effect on the residual lifetime depending on the sign. The majority of the residual lifetime estimations studies consider the axle loadings as determined by the rotating bending (train weight + dynamic effects of moving train) and the press fit, by neglecting the compressive residual stresses effect at the axle surface [22,29,64,65]. These stresses are observed to have a positive effect determining a residual fatigue life substantially longer [30,66,67,68]. In the recent study by P. Pokorný et al. [69], it was demonstrated that in the case of a standardly manufactured railway axle adopting EA4T steel with consequent heat treatment and machining, it is possible to develop negative residual stresses up to depth of 5 mm inducing a significant effect on the residual lifetime.
The residual stresses were measured in correspondence of the section containing the artificial notch up to depth of 2 mm, using the hole drilling method [70]. The measurements were derived for three surface points (respectively at 0°, 200° and 300°). The average of experimental residual stresses is indicated in Figure 7b with green triangle dots, while the light green shaded area indicates the dispersion of the performed measurements. The obtained residual stresses were compared with the available data by Pokorny [69] and a fair agreement was found with the present results. Therefore, for the sake of simulation of test results, the lower bound profile measured by Pokorny is considered.

Crack Growth Algorithm

The life predictions are based upon a crack growth algorithm which considers the discretized load spectrum shown in the Figure 3. A summary of the algorithm steps is given in the following:
  • Given a block load level, the local load ratio R acting at the points a and c of the crack is calculated by using Equation (8).
    R = K b e n d i n g + K p r e s s f i t + K c o m p r e s s i v e r e s i d u a l s t r e s s e s K b e n d i n g + K p r e s s f i t + K c o m p r e s s i v e r e s i d u a l s t r e s s e s
    In the case of superposition of rotating bending and residual stresses, the effective R is changing between 1.75 < R < 0.7 along the crack propagation path. On the other hand, for the analysis carried out considering only the rotating bending stresses, the load ratio is always R = −1.
  • Evaluation of the SIFs acting at the two points a and c adopting the Wang–Lambert weight function and the normal stress distribution perpendicular to the crack plane for the un-cracked axle calculated with the FE model.
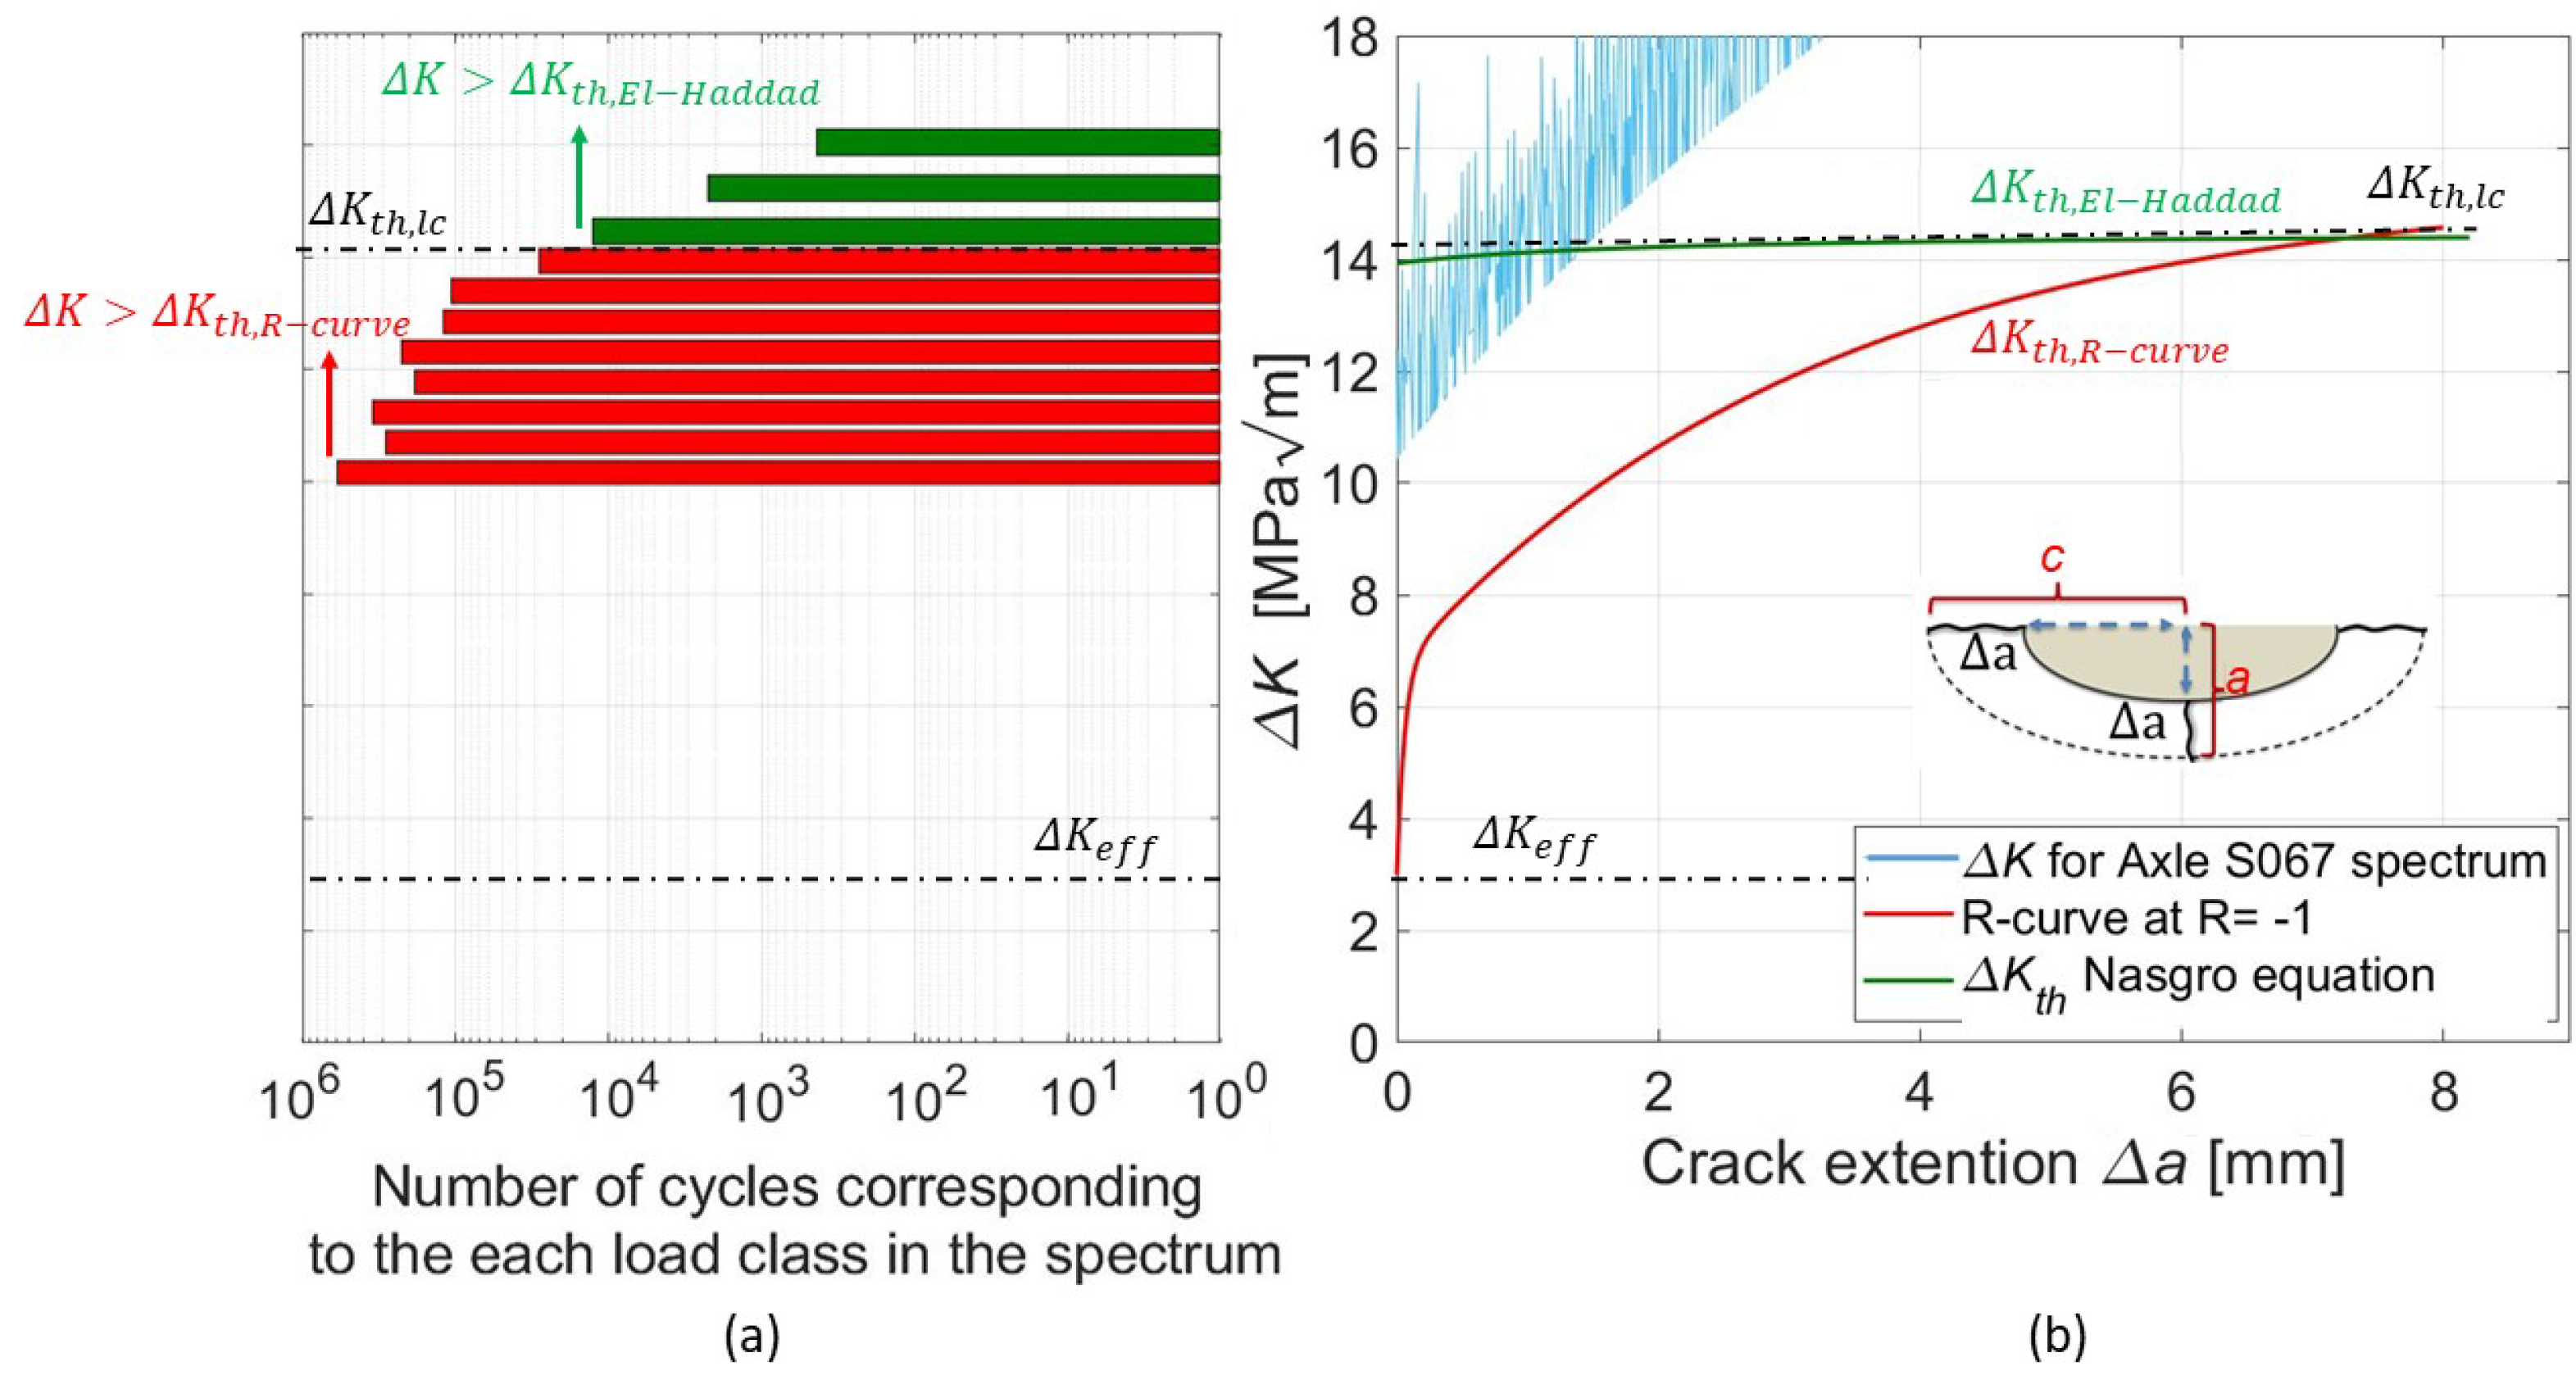
  • Given the stress intensity factor ranges Δ K and the R, for both points a and c, evaluation of the crack growth rates using the conventional Nasgro equation and Modified Nasgro equation (see Section 4). The evaluated crack growth rates for axle S067 has been shown in Figure 8. According to the modified Nasgro equation, at the beginning of the simulation the crack growth rates tend to decrease with crack propagation due to crack closure development. Finally, when the crack closure fully develops and the driving force Δ K increases due to the crack advancement, the crack growth rates increase and converge along the Paris region.
  • Updating the actual crack size and shape, which acted as an input for the following load block.
  • Simulations are run until a crack depth of 20 mm is reached.

6. Results and Discussion

The residual lifetime predictions for each axle are presented in Figure 9 and Table 4. The experimental data are reported with blue dots, while the predictions performed with the Nasgro equation and the Modified Nasgro equation are indicated, respectively, with the green and red colors. In addition, the solid lines indicate the predictions performed considering only the rotating bending stresses, while the dashed lines indicate the predictions considering the superposition of rotating bending stresses and residual stresses.
The first comparison with experiments can be made considering the life predictions based on the stresses induced by the rotating bending (solid lines) and the ones with bending plus residual stresses (dashed lines). It can be seen, as already noted in the literature, that residual stresses have a significant effect on life prediction.
In terms of comparison between the algorithms, the simulations performed with the Modified Nasgro equation are in good agreement with the experimental results. Even if they are slightly conservative (maximum underestimation 30%), it is clear that the Modified Nasgro equation produces predictions with a curvature very close to the experimental results. Remarkably, the predictions are very precise under load spectra with low stresses (Figure 9c,d) that are the ones closer to the real service conditions. By contrast, it is evident that the adoption of the conventional Nasgro equation generally leads to a significant overestimation of the propagation lifetime of the order of 120% (see Section 6.2 for an explanation of this effect).
Even if recent papers have shown the possibility to include interaction effects on propagation simulations based on the R-curve [40], the comparison with the present experiments show that, at the stress levels experienced by axles in service, neglecting those effects does not significantly affects the axle life predictions. This is surely in line with the modest interaction effects already observed for EA4T [71]. In fact, analyses based on the Strip-Yield model [62,72] showed that this effect was due to a small increase of S o p under variable amplitude loads.

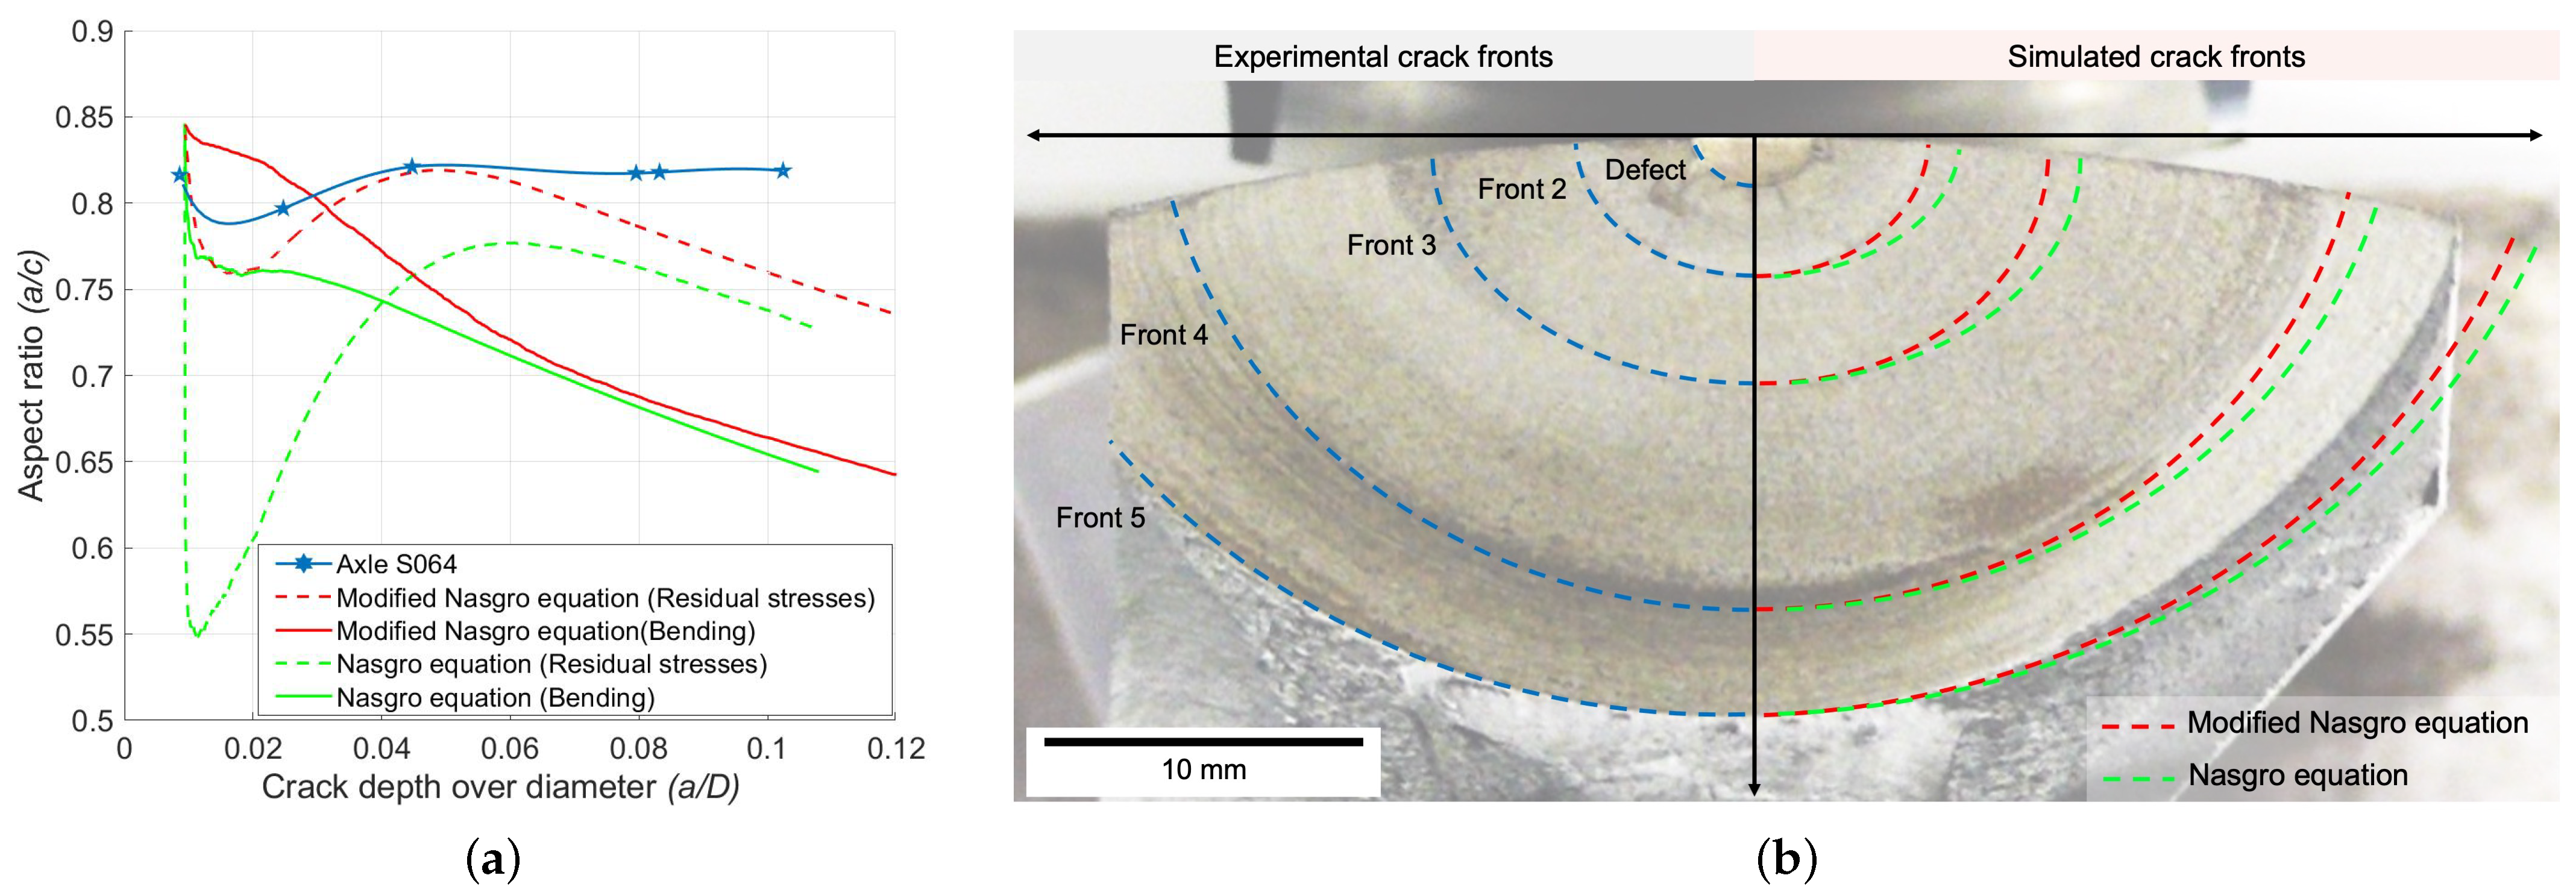
6.1. Crack Shape Evolution

Another interesting analysis is shown in Figure 10, where the experimental crack shape evolution characterized by the shape factor a / c is compared with the numerical predictions (the results refer to the Axle S064). The experimental a / c values show small fluctuations around an average value of approximately 0.8. From the crack propagation simulation results, it can be observed that neglecting the residual stresses determines a continuous decrease of the aspect ratio a / c from the beginning of the simulations, either performed with the Nasgro or Modified Nasgro equations. This tendency is also captured for a / D > 0.05 when considering the residual stresses in the simulation (green and dashed lines in the Figure 10). However, the residual stresses have a paramount effect on the shape factor evolution in the first stages of propagation. In fact, due to the trend of the compressive residual stresses, which displays higher absolute values at 1 mm depth compared to the free surface, the initial trend of the simulated aspect ratio shows a quick drop of a / c (crack forced to propagate faster at the free surface) and a successive increment. Interestingly, both the simulations performed with the Nasgro and the Modified Nasgro equations indicate that a maximum a / c is reached at a crack depth of approximately a / D = 0.05 . Successively, the simulations display a trend of a / c which decreases according the same rate as it is observed for the simulations performed neglecting the residual stresses. From this analysis, it can be concluded that the crack shape evolution is also well captured with the crack propagation algorithm based on the Modified Nasgro equation as evidenced comparing the experimental a / c values (blue dots) and the simulated ones (dashed red line) in the Figure 10a,b.

6.2. Effect of Closure Development

The significant overestimation of the residual lifetime obtained adopting the conventional Nasgro algorithm in the axles tested at low stresses can be clearly understood by analyzing the stress spectrum in terms of Δ K for the initial crack. Figure 11a illustrates the calculated driving forces at the surface point of the initial defect ( a 0 = 1.5 mm and c 0 = 1.87 mm) with a Δ a = 200 μ m crack extension ahead of the notch for axle 067. Figure 11 clearly highlights the difference between the two models. In particular, Figure 11a shows the load blocks involved in crack propagation according to the Nasgro equation (green bars) and the Modified Nasgro equation (red and green bars combined), which correspond to 1.9% and 100% of the overall spectrum, respectively.
Considering that the initial crack depth is 1.7 mm ( a 0 + Δ a ), according to the El-Haddad model, this crack can already be considered as a long crack with Δ K t h Δ K t h , L C . On the other side, according to the R-curve, at the beginning of the crack propagation the threshold Δ K t h is much lower with respect to the long crack threshold Δ K t h , L C . Consequently, for the El-Haddad model, only the loading cycles highlighted with the green bars (see Figure 11b) are above the threshold condition, while, according to the R-curve, all the loading cycles contribute to the early stages of crack propagation. Even if this difference was already discussed in terms of fatigue limit for small cracks/defects [73], it is the first time that its effect has been discussed and experimentally validated through components’ experimental data. The dramatic consequence is that the lifetime predictionbased on the traditional Nasgro algorithm is potentially unsafe at stress levels close to real service conditions.

7. Concluding Remarks

Wheelset requires optimization of the inspection intervals to reduce the service life maintenance costs. The primary tool needed for reaching this objective is developing a robust residual lifetime prediction model which is applicable to realistic operational conditions of the wheelset. In this paper, series of experimental investigations were carried out on full-scale railway axles to analyze the fatigue crack growth behavior of the EA4T steel subjected to real operational load spectrums. Two crack propagation algorithms (Nasgro equation and Modified Nasgro equation) have been applied to estimate the propagation lifetime of a fatigue crack in railway axles and a comparison of predictions with a set of 4 full-scale block-loading experiments was presented. The main results can be summarized as follows.
  • Adopting the concept of cyclic R-curve through the Modified Nasgro equation leads to axle life predictions that are in good agreement with the full-scale experimental results (max underestimation less than 30%) if all the contribution to mean stresses (press-fit stresses + residual stresses) are included in the analysis.
  • The conventional Nasgro equation leads to significant overestimation of propagation lifetime, approximately by a factor 2.2, in the real service scenario for railway axles when the majority of the load classes in the load spectrum corresponds to Δ K which are below the long crack threshold.

Author Contributions

A.P.: full-scale experiments, crack growth algorithms implementation, analysis, manuscript preparation; L.P.: crack growth experiments and analysis, manuscript revision; D.R.: full-scale experiments, manuscript revision; S.B.: conceptualization, project direction, manuscript preparation, manuscript revision. All authors have read and agreed to the published version of the manuscript.

Funding

This research was funded by LucchiniRS through the Research Contract CR82/16 with Politecnico di Milano, Dept. Mechanical Engineering.

Institutional Review Board Statement

Not applicable.

Informed Consent Statement

Not applicable.

Data Availability Statement

The data published in this paper can be requested to the corresponding author.

Acknowledgments

The present results were obtained with a research contract between LucchiniRS and Politecnico di Milano, Dept. Mechanical Engineering. The authors express gratitude to LucchiniRS, especially S. Cantini and S. Cervello, for permission to publish the results here contained.

Conflicts of Interest

The authors declare no conflict of interest. The funders had no role in the design of the study, in the collection, analyses, or interpretation of data. The funders accepted authors’ decision to publish the results in the present paper.

Abbreviations

The following abbreviations are used in this manuscript:
SIFStress intensity factor
RLoad (or stress) ratio
EDMElectrical discharge machining
EA4T25CrMo4 steel
CPCACompression pre-cracking constant-amplitude
CPLRCompression pre-cracking Load reduction

References

  1. Gravier, N.; Viet, J.J.; Leluan, A. Predicting the life cycle of railway axles. Rev. Gen. Chemins Fer 1999, 3, 33–40. [Google Scholar]
  2. Watson, A. Implications of Impact Damage on the Structural Integrity of Axles. 2010. Available online: http://esistc24.mecc.polimi.it/index.html (accessed on 7 July 2021).
  3. Wu, S.; Xu, Z.; Kang, G.; He, W. Probabilistic fatigue assessment for high-speed railway axles due to foreign object damages. Int. J. Fatigue 2018, 117, 90–100. [Google Scholar] [CrossRef]
  4. Beretta, S.; Carboni, M.; Lo Conte, A.; Palermo, E. An investigation of the effects of corrosion on the fatigue strength of AlN axle steel. Proc. Inst. Mech. Eng. Part F J. Rail Rapid Transit 2008, 222, 129–143. [Google Scholar] [CrossRef]
  5. Foletti, S.; Beretta, S.; Gurer, G. Defect acceptability under full-scale fretting fatigue tests for railway axles. Int. J. Fatigue 2016, 86, 34–43. [Google Scholar] [CrossRef]
  6. Pourheidar, A.; Regazzi, D.; Cervello, S.; Foletti, S.; Beretta, S. Fretting fatigue analysis of full-scale railway axles in presence of artificial micro-notches. Tribol. Int. 2020, 150, 106383. [Google Scholar] [CrossRef]
  7. Schmidová, E.; Paščenko, P.; Culek, B.; Schmid, M. Premature failures of railway axles after repeated pressing. Eng. Fail. Anal. 2021, 123, 105253. [Google Scholar] [CrossRef]
  8. Osgood, C. Damage-tolerant design (Safe-life and fail-safe structural design philosophies in fatigue damage and operating lifetime control). Mach. Des. 1969, 41, 91–95. [Google Scholar]
  9. Combes, R.C., Jr. Design for damage tolerance. J. Aircr. 1970, 7, 18–20. [Google Scholar] [CrossRef]
  10. Zerbst, U.; Vormwald, M.; Andersch, C.; Mädler, K.; Pfuff, M. The development of a damage tolerance concept for railway components and its demonstration for a railway axle. Eng. Fract. Mech. 2005, 72, 209–239. [Google Scholar] [CrossRef]
  11. Zerbst, U.; Lundén, R.; Edel, K.O.; Smith, R.A. Introduction to the damage tolerance behaviour of railway rails—A review. Eng. Fract. Mech. 2009, 76, 2563–2601. [Google Scholar] [CrossRef] [Green Version]
  12. Project WIDEM. Available online: http://www.widem.org/ (accessed on 17 February 2021).
  13. Project EURAXLES. Available online: http://www.euraxles.eu (accessed on 17 February 2021).
  14. Project MARAXIL. Available online: http://maraxil.mecc.polimi.it/ (accessed on 17 February 2021).
  15. Beretta, S.; Carboni, M. Variable amplitude fatigue crack growth in a mild steel for railway axles: Experiments and predictive models. Eng. Fract. Mech. 2011, 78, 848–862. [Google Scholar] [CrossRef]
  16. Traupe, M.; Jenne, S.; Lütkepohl, K.; Varfolomeev, I. Experimental validation of inspection intervals for railway axles accompanying the engineering process. Int. J. Fatigue 2016, 86, 44–51. [Google Scholar] [CrossRef]
  17. Sander, M.; Richard, H. Investigations on fatigue crack growth under variable amplitude loading in wheelset axles. Eng. Fract. Mech. 2011, 78, 754–763. [Google Scholar] [CrossRef]
  18. Cao, W.; Koh, C.; Smith, I. Enhancing static-load-test identification of bridges using dynamic data. Eng. Struct. 2019, 186, 410–420. [Google Scholar] [CrossRef]
  19. Yamamoto, M.; Makino, K.; Ishiduka, H. Experimental validation of railway axle fatigue crack growth using operational loading. Eng. Fract. Mech. 2019, 213, 142–152. [Google Scholar] [CrossRef]
  20. Rieger, M.; Moser, C.; Brunnhofer, P.; Simunek, D.; Weber, F.J.; Deisl, A.; Gänser, H.P.; Pippan, R.; Enzinger, N. Fatigue crack growth in full-scale railway axles–Influence of secondary stresses and load sequence effects. Int. J. Fatigue 2020, 132, 105360. [Google Scholar] [CrossRef]
  21. Hu, Y.; Qin, Q.; Wu, S.; Zhao, X.; Wang, W. Fatigue resistance and remaining life assessment of induction-hardened S38C steel railway axles. Int. J. Fatigue 2021, 144, 106068. [Google Scholar] [CrossRef]
  22. Yasniy, O.; Lapusta, Y.; Pyndus, Y.; Sorochak, A.; Yasniy, V. Assessment of lifetime of railway axle. Int. J. Fatigue 2013, 50, 40–46. [Google Scholar] [CrossRef]
  23. Pokornỳ, P.; Hutař, P.; Náhlík, L. Residual fatigue lifetime estimation of railway axles for various loading spectra. Theor. Appl. Fract. Mech. 2016, 82, 25–32. [Google Scholar] [CrossRef]
  24. De Freitas, M.; François, D. Analysis of fatigue crack growth in rotary bend specimens and railway axles. Fatigue Fract. Eng. Mater. Struct. 1995, 18, 171–178. [Google Scholar] [CrossRef]
  25. Zerbst, U.; Schödel, M.; Beier, H.T. Parameters affecting the damage tolerance behaviour of railway axles. Eng. Fract. Mech. 2011, 78, 793–809. [Google Scholar] [CrossRef] [Green Version]
  26. Lundén, R.; Vernersson, T.; Ekberg, A. Railway axle design: To be based on fatigue initiation or crack propagation? Proc. Inst. Mech. Eng. Part F J. Rail Rapid Transit 2010, 224, 445–453. [Google Scholar] [CrossRef]
  27. Forman, R.G.; Mettu, S.R. Behavior of Surface and Corner Cracks Subjected to Tensile and Bending Loads in Ti-6Al-4V Alloy; NASA: Washington, DC, USA, 1990. [Google Scholar]
  28. Beretta, S.; Carboni, M.; Cantini, S.; Ghidini, A. Application of fatigue crack growth algorithms to railway axles and comparison of two steel grades. Proc. Inst. Mech. Eng. Part F J. Rail Rapid Transit 2004, 218, 317–326. [Google Scholar] [CrossRef]
  29. Madia, M.; Beretta, S.; Zerbst, U. An investigation on the influence of rotary bending and press fitting on stress intensity factors and fatigue crack growth in railway axles. Eng. Fract. Mech. 2008, 75, 1906–1920. [Google Scholar] [CrossRef] [Green Version]
  30. Regazzi, D.; Beretta, S.; Carboni, M. An investigation about the influence of deep rolling on fatigue crack growth in railway axles made of a medium strength steel. Eng. Fract. Mech. 2014, 131, 587–601. [Google Scholar] [CrossRef]
  31. Regazzi, D.; Cantini, S.; Cervello, S.; Foletti, S.; Pourheidar, A.; Beretta, S. Improving fatigue resistance of railway axles by cold rolling: Process optimisation and new experimental evidences. Int. J. Fatigue 2020, 137, 105603. [Google Scholar] [CrossRef]
  32. Makino, T.; Sakai, H.; Kozuka, C.; Yamazaki, Y.; Yamamoto, M.; Minoshima, K. Overview of fatigue damage evaluation rule for railway axles in Japan and fatigue property of railway axle made of medium carbon steel. Int. J. Fatigue 2020, 132, 105361. [Google Scholar] [CrossRef]
  33. Maierhofer, J.; Pippan, R.; Gänser, H.P. Modified NASGRO equation for physically short cracks. Int. J. Fatigue 2014, 59, 200–207. [Google Scholar] [CrossRef] [Green Version]
  34. Tanaka, K.; Akiniwa, Y. Resistance-curve method for predicting propagation threshold of short fatigue cracks at notches. Eng. Fract. Mech. 1988, 30, 863–876. [Google Scholar] [CrossRef]
  35. Tanaka, K.; Nakai, Y. Propagation and non-propagation of short fatigue cracks at a sharp notch. Fatigue Fract. Eng. Mater. Struct. 1983, 6, 315–327. [Google Scholar] [CrossRef]
  36. Tabernig, B.; Pippan, R. Determination of the length dependence of the threshold for fatigue crack propagation. Eng. Fract. Mech. 2002, 69, 899–907. [Google Scholar] [CrossRef]
  37. Maierhofer, J.; Kolitsch, S.; Pippan, R.; Gänser, H.P.; Madia, M.; Zerbst, U. The cyclic R-curve–determination, problems, limitations and application. Eng. Fract. Mech. 2018, 198, 45–64. [Google Scholar] [CrossRef]
  38. Pokornỳ, P.; Vojtek, T.; Náhlík, L.; Hutař, P. Crack closure in near-threshold fatigue crack propagation in railway axle steel EA4T. Eng. Fract. Mech. 2017, 185, 2–19. [Google Scholar] [CrossRef]
  39. Vojtek, T.; Pokornỳ, P.; Kuběna, I.; Náhlík, L.; Fajkoš, R.; Hutař, P. Quantitative dependence of oxide-induced crack closure on air humidity for railway axle steel. Int. J. Fatigue 2019, 123, 213–224. [Google Scholar] [CrossRef]
  40. Maierhofer, J.; Gänser, H.P.; Simunek, D.; Leitner, M.; Pippan, R.; Luke, M. Fatigue crack growth model including load sequence effects–Model development and calibration for railway axle steels. Int. J. Fatigue 2020, 132, 105377. [Google Scholar] [CrossRef]
  41. BS EN13261. Railway Applications–Wheelsets and Bogies–Axles–Product Requirements; European Committee for Standardization: Brussels, Belgium, 2003. [Google Scholar]
  42. Gao, J.W.; Dai, G.Z.; Li, Q.Z.; Zhang, M.N.; Zhu, S.P.; Correia, J.A.; Lesiuk, G.; De Jesus, A.M. Fatigue assessment of EA4T railway axles under artificial surface damage. Int. J. Fatigue 2021, 146, 106157. [Google Scholar] [CrossRef]
  43. Carboni, M.; Cantini, S. Advanced ultrasonic “Probability of Detection” curves for designing in-service inspection intervals. Int. J. Fatigue 2016, 86, 77–87. [Google Scholar] [CrossRef]
  44. Joint Sector Group for ERA Task Force on Wagon/Axle Maintenance. Broken Wheelset Axles in Europa Since 1996 (without Hot Axle Boxes); European Railway Agency: Lille, France, 2010. [Google Scholar]
  45. Transportation Safety Board of Canada. Railway Investigation Report Number R01Q0010; Transportation Safety Board of Canada: Gatineau, QB, Canada, 2003. [Google Scholar]
  46. Zerbst, U.; Beretta, S.; Köhler, G.; Lawton, A.; Vormwald, M.; Beier, H.T.; Klinger, C.; Černỳ, I.; Rudlin, J.; Heckel, T.; et al. Safe life and damage tolerance aspects of railway axles—A review. Eng. Fract. Mech. 2013, 98, 214–271. [Google Scholar] [CrossRef]
  47. Pippan, R.; Plöchl, L.; Klanner, F.; Stüwe, H. The use of fatigue specimens precracked in compression for measuring threshold values and crack growth. J. Test. Eval. 1994, 22, 98–103. [Google Scholar]
  48. Newman, J., Jr.; Yamada, Y. Compression precracking methods to generate near-threshold fatigue-crack-growth-rate data. Int. J. Fatigue 2010, 32, 879–885. [Google Scholar] [CrossRef]
  49. Pippan, R. The growth of short cracks under cyclic compression. Fatigue Fract. Eng. Mater. Struct. 1987, 9, 319–328. [Google Scholar] [CrossRef]
  50. Pourheidar, A.; Patriarca, L.; Werner, T.; Madia, M.; Beretta, S. Advancements in the measurement and application of the cyclic R-curve for fatigue assessment. Eng. Fract. Mech. 2021. submitted. [Google Scholar]
  51. Wang, X.; Lambert, S. Stress intensity factors for low aspect ratio semi-elliptical surface cracks in finite-thickness plates subjected to nonuniform stresses. Eng. Fract. Mech. 1995, 51, 517–532. [Google Scholar] [CrossRef]
  52. Nasgro, B. Fracture Mechanics and Fatigue Crack Growth Analysis Software; MIT: Cambridge, MA, USA, 2002. [Google Scholar]
  53. Elber, W. The significance of fatigue crack closure. In Damage Tolerance in Aircraft Structures; ASTM International: West Conshohocken, PA, USA, 1971. [Google Scholar]
  54. El Haddad, M.; Smith, K.; Topper, T. Fatigue crack propagation of short cracks. J. Eng. Mater. Technol. 1979, 101, 42–46. [Google Scholar] [CrossRef]
  55. Pourheidar, A.; Beretta, S.; Ragazzi, D.; Baykara, C. Comparison of SIF solutions for cracks under rotating bending and their impact upon propagation lifetime of railway axles. Procedia Struct. Integr. 2018, 8, 610–617. [Google Scholar] [CrossRef]
  56. Shiratori, M.; Miyoshi, T. Analysis of stress intensity factors for surface cracks subjected to arbitrarily distributed stresses. In Computational Mechanics’ 86; Springer: Berlin/Heidelberg, Germany, 1986; pp. 1027–1032. [Google Scholar]
  57. Pommier, S.; Sakae, C.; Murakami, Y. An empirical stress intensity factor set of equations for a semi-elliptical crack in a semi-infinite body subjected to a polynomial stress distribution. Int. J. Fatigue 1999, 21, 243–251. [Google Scholar] [CrossRef]
  58. Carpinteri, A. Elliptical-arc surface cracks in round bars. Fatigue Fract. Eng. Mater. Struct. 1992, 15, 1141–1153. [Google Scholar] [CrossRef]
  59. Varfolomeev, I.; Luke, M.; Moroz, S. Experimental and numerical investigations of fatigue crack growth in various specimen geometries. Procedia Eng. 2010, 2, 1829–1837. [Google Scholar] [CrossRef]
  60. Newman, J.; Raju, I. Stress-intensity factor equations for cracks in three-dimensional finite bodies subjected to tension and bending loads. Comput. Methods Mech. Fract. 1986, 2, 311–334. [Google Scholar]
  61. Levan, A.; Royer, J. Part-circular surface cracks in round bars under tension, bending and twisting. Int. J. Fract. 1993, 61, 71–99. [Google Scholar] [CrossRef]
  62. Newman, J. A crack-closure model for predicting fatigue crack growth under aircraft spectrum loading. In Methods and Models for Predicting Fatigue Crack Growth under Random Loading; ASTM International: West Conshohocken, PA, USA, 1981. [Google Scholar]
  63. James, M.N.; Hattingh, D.; Asquith, D.; Newby, M.; Doubell, P. Residual stresses in condition monitoring and repair of thermal power generation components. Theor. Appl. Fract. Mech. 2017, 92, 289–297. [Google Scholar] [CrossRef]
  64. Wu, S.; Liu, Y.; Li, C.; Kang, G.; Liang, S. On the fatigue performance and residual life of intercity railway axles with inside axle boxes. Eng. Fract. Mech. 2018, 197, 176–191. [Google Scholar] [CrossRef]
  65. Hannemann, R.; Sander, M. Effect of specimen geometry and press-fit on the stress intensity factor solution for scaled wheelset axles under bending. Procedia Struct. Integr. 2016, 2, 2527–2534. [Google Scholar] [CrossRef] [Green Version]
  66. Gänser, H.P.; Maierhofer, J.; Tichy, R.; Zivkovic, I.; Pippan, R.; Luke, M.; Varfolomeev, I. Damage tolerance of railway axles—The issue of transferability revisited. Int. J. Fatigue 2016, 86, 52–57. [Google Scholar] [CrossRef]
  67. Náhlík, L.; Pokornỳ, P.; Ševčík, M.; Fajkoš, R.; Matušek, P.; Hutař, P. Fatigue lifetime estimation of railway axles. Eng. Fail. Anal. 2017, 73, 139–157. [Google Scholar] [CrossRef]
  68. Hassani-Gangaraj, S.M.; Carboni, M.; Guagliano, M. Finite element approach toward an advanced understanding of deep rolling induced residual stresses, and an application to railway axles. Mater. Des. 2015, 83, 689–703. [Google Scholar] [CrossRef]
  69. Pokornỳ, P.; Dlhỳ, P.; Poduška, J.; Fajkoš, R.; Vojtek, T.; Náhlík, L.; Grasso, M.; Hutař, P. Influence of heat treatment-induced residual stress on residual fatigue life of railway axles. Theor. Appl. Fract. Mech. 2020, 109, 102732. [Google Scholar] [CrossRef]
  70. Schajer, G.S. Advances in hole-drilling residual stress measurements. Exp. Mech. 2010, 50, 159–168. [Google Scholar] [CrossRef]
  71. Beretta, S.; Carboni, M.; Regazzi, D. Load interaction effects in propagation lifetime and inspections of railway axles. Int. J. Fatigue 2016, 91, 423–433. [Google Scholar] [CrossRef]
  72. Newman, J.C., Jr. FASTRAN-2: A fatigue crack growth structural analysis program. NASA STI/Recon Tech. Rep. N 1992, 92, 30964. [Google Scholar]
  73. Zerbst, U.; Vormwald, M.; Pippan, R.; Gänser, H.P.; Sarrazin-Baudoux, C.; Madia, M. About the fatigue crack propagation threshold of metals as a design criterion—A review. Eng. Fract. Mech. 2016, 153, 190–243. [Google Scholar] [CrossRef]
Figure 1. Experimental setup of the full-scale axle tests: (a) drawing of the specimen and EDM micro-notches location, and (b) schematic and (c) picture of the testing bench which reproduces the rotating bending on the full-scale axle.
Metals 11 01427 g001
Figure 2. Crack propagation monitoring techniques adopted in the present study: (a) the plastic replica method, (b) the magnetic particle inspection method, and (c) the images captured by means of optical microscope.
Metals 11 01427 g002
Figure 3. Applied load spectra derived from in-service loading condition: (a) normalized load spectrum and (b) applied load sequence.
Metals 11 01427 g003
Figure 4. Final fracture surface of Axle S064 and reconstruction of crack shape evolution by fitting ellipses.
Metals 11 01427 g004
Figure 5. Fatigue crack growth characterization of the present EA4T steel: (a) Evaluated R-dependence of long crack thresholds Δ K t h , l c (values acquired from [42]) and comparison with the available data in literature [40] and (b) crack growth curves and interpolation with the Nasgro equation.
Metals 11 01427 g005
Figure 6. Modified Nasgro equation calibration: (a) crack growth threshold Δ K t h vs. crack extension Δ a (R-curve) and (b) growth of a short crack near the threshold region, comparison between experimental and predicted crack growth rates.
Metals 11 01427 g006
Figure 7. Stress analysis in the notch section for applied nominal stress of 130 MPa (rearranged from the work in [55]): (a) longitudinal stresses induced by the press-fit and (b) calculated in-depth stress profiles due to the rotating bending and press-fit and manufacturing induced compressive residual stresses (the value of the measured scatter marked with grey is acquired from [62]; the value of residual stress marked as black line is acquired from [62]).
Metals 11 01427 g007
Figure 8. The calculated crack growth rate for Axle S067 by adopting the conventional Nasgro and Modified Nasgro equations at R = −1 (considering only the rotating bending stress).
Metals 11 01427 g008
Figure 9. Residual lifetime predictions and comparison with the full-scale axle test results: (a) Axle S064, (b) Axle S065, (c) Axle S066, and (d) Axle S067.
Metals 11 01427 g009
Figure 10. Crack shape evolution analysis of Axle S067: (a) Crack shape aspect ratio a / c comparison between numerical prediction and experimental and (b) contour plot of the crack shape evaluated by considering residual stresses the comparison with the experimental evidence.
Metals 11 01427 g010
Figure 11. Comparison of the Δ K t h condition according to the Nasgro equation and Modified Nasgro equation (R-curve) for a initial crack size of a 0 = 1.5 and c = 1.85 mm with a Δ a = 200 μ m crack extension ahead of the notch (Axle S067): (a) Δ K levels and corresponding number of cycles in the spectrum and (b) The calculated driving forces Δ K in the surface point of the crack plotted against the threshold condition adopted in Modified nasgro equation and Nasgro equation (El-hadad correction for short cracks).
Metals 11 01427 g011
Table 1. Tensile properties for the EA4T steel investigated in the present study (according to EN13261).
Yield StressUltimate Tensile StressStrain at Failure
R eH R m A 5
(MPa)(MPa)(%)
549 ± 43707 ± 3422.5 ± 1.5
Table 2. Summary of the performed fatigue crack propagation tests.
Load RatioTesting ProcedureNumber of TestsMean Δ K th , lc (MPa m )
0.7CPLR/CPCA32.95
0.05CPLR/CPCA36.87
−1CPLR/CPCA914.6
−2CPLR121.7
Table 3. Summary of full-scale axle test results.
AxleMaximum Δ K at Deepest Point of the Crack (a) (Normalized by Δ K th , lc )Maximum Δ K at Surface Point of the Crack (c) (Normalized by Δ K th , lc )Percentage of Load Blocks below Δ K th , lc for Deepest Point of Crack (a)Percentage of Load Blocks below Δ K th , lc for Surface Point of Crack (c)Number of Cycles to FailureFinial Crack Dimension at Failure (mm)
S0641.191.3897.7%64.5%3,375,000a = 16.7
c = 22.01
S0651.091.2799.8%85.8%5,600,000a = 25.6
c = 36
S0661.111.2999.8%85.8%5,775,000a = 26.1
c = 35.4
S0671.031.2099.98%98.1%9,150,000a = 29
c = 50.5
Table 4. Summary of full-scale axle crack propagation tests and life predictions (B = rotating Bending stress, R = Residual stresses including press-fit stresses and compressive manufacturing induced stresses).
AxleMaximum Δ K at Deepest Point of the Crack (a) (Normalized by Δ K th , lc )Maximum Δ K at Surface Point of the Crack (c) (Normalized by Δ K th , lc )Number of Cycles at Crack Depth = 20 mmModified Nasgro Equation (Cycle)Nasgro Equation (Cycle)
S0641.191.383,375,000B = 2,036,000
B + R = 2,287,000
B = 1,852,000
B + R = 5,014,000
S0651.091.275,230,000B = 3,319,000
B + R = 4,234,000
B = 7,495,000
B+R= 10,850,000
S0661.111.295,420,000B = 3,317,000
B + R = 4,230,000
B = 6,718,000
B + R = 10,250,000
S0671.031.208,920,000B = 4,725,000
B + R = 7,700,000
B = 12,030,000
B + R = 19,570,000
Publisher’s Note: MDPI stays neutral with regard to jurisdictional claims in published maps and institutional affiliations.

