
Relationship among Welding Defects with Convection and Material Flow Dynamic Considering Principal Forces in Plasma Arc Welding

 , , and
Abstract
:1. Introduction
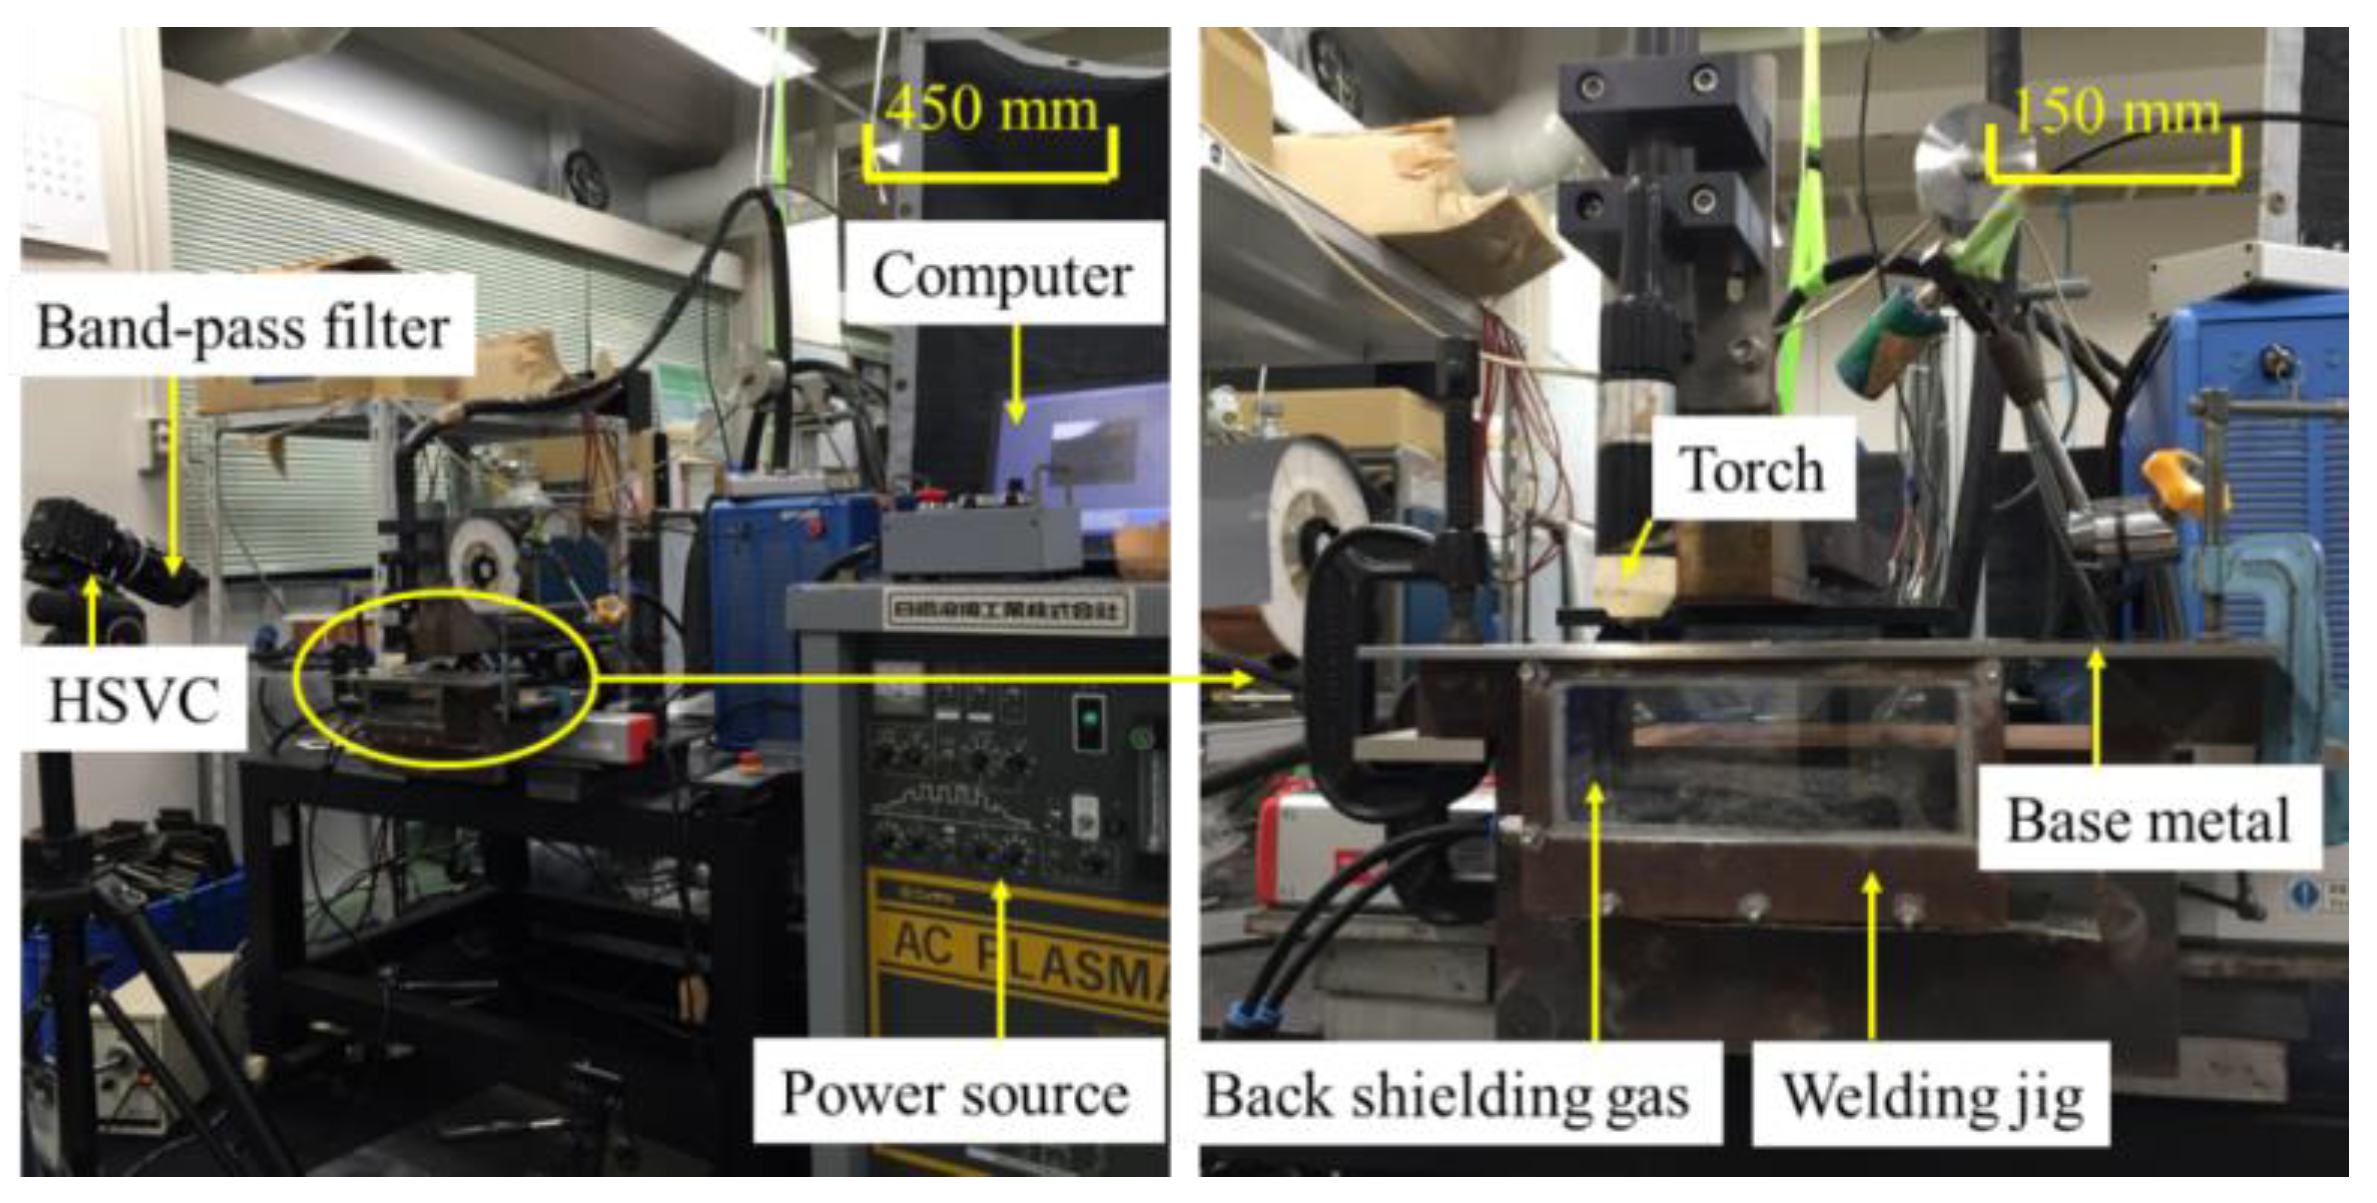
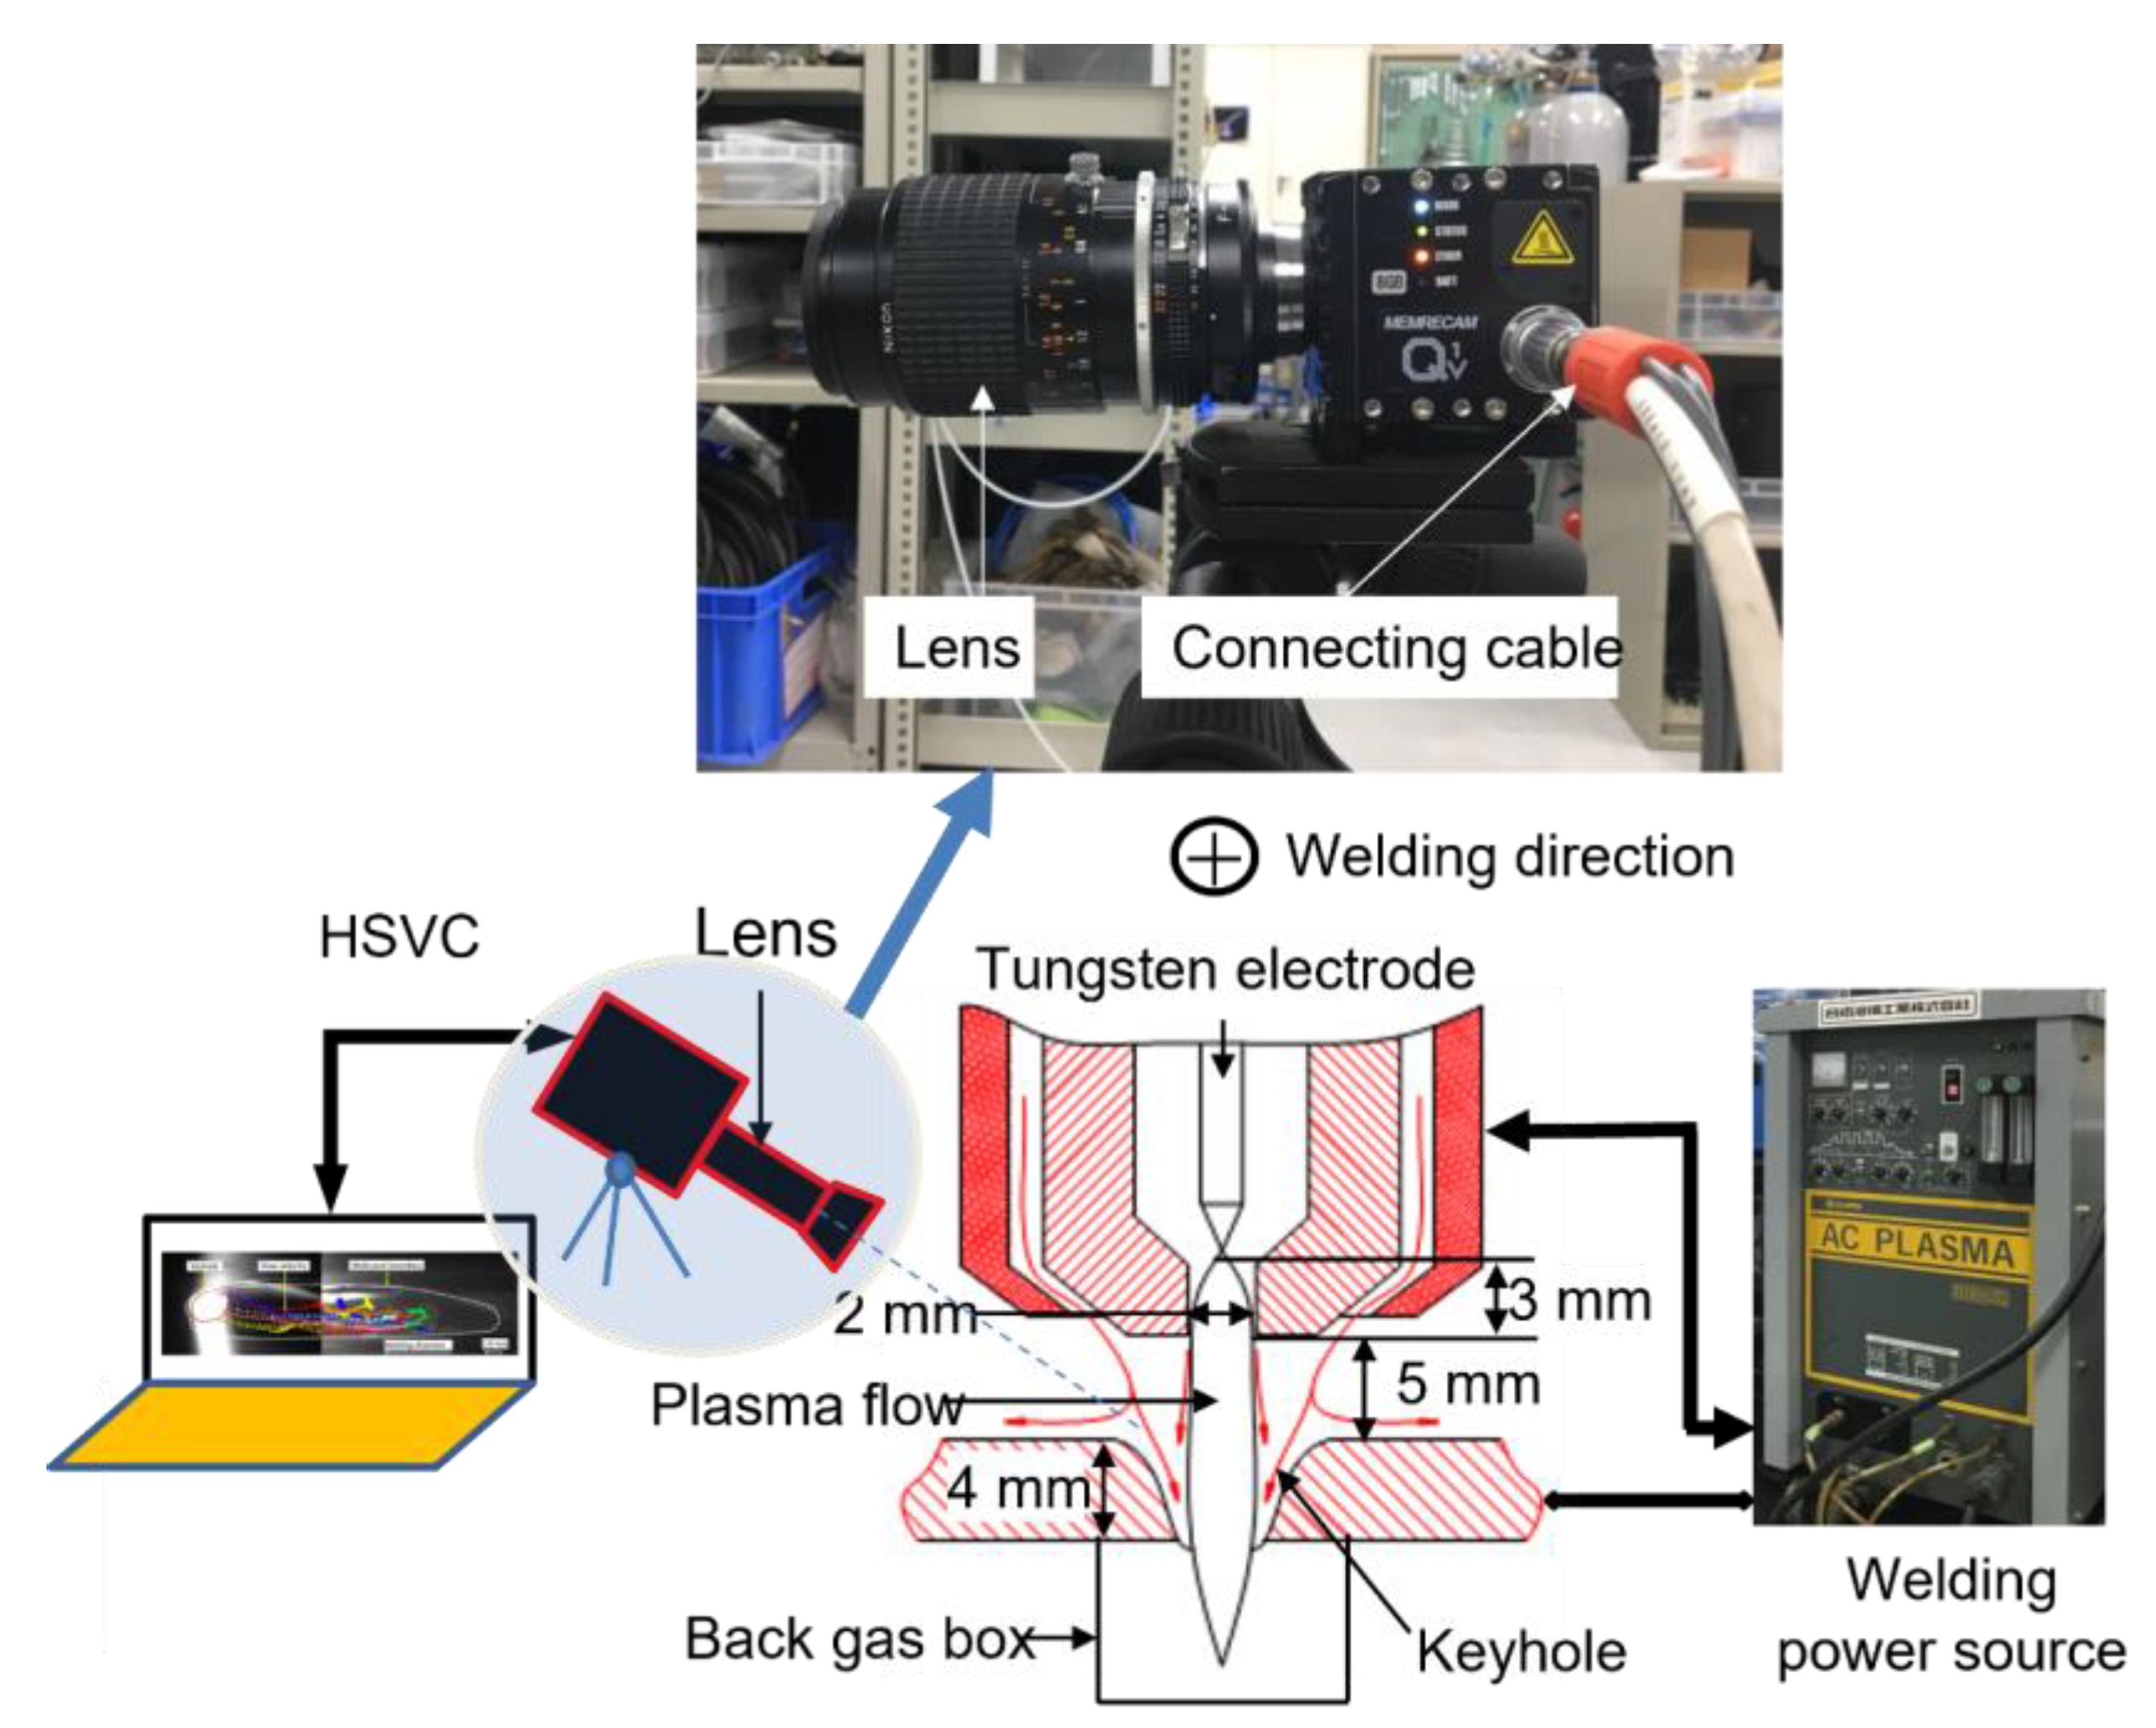
2. Experimental Method
3. Results and Discussion
3.1. Welding Bead Formation and Welding Defects
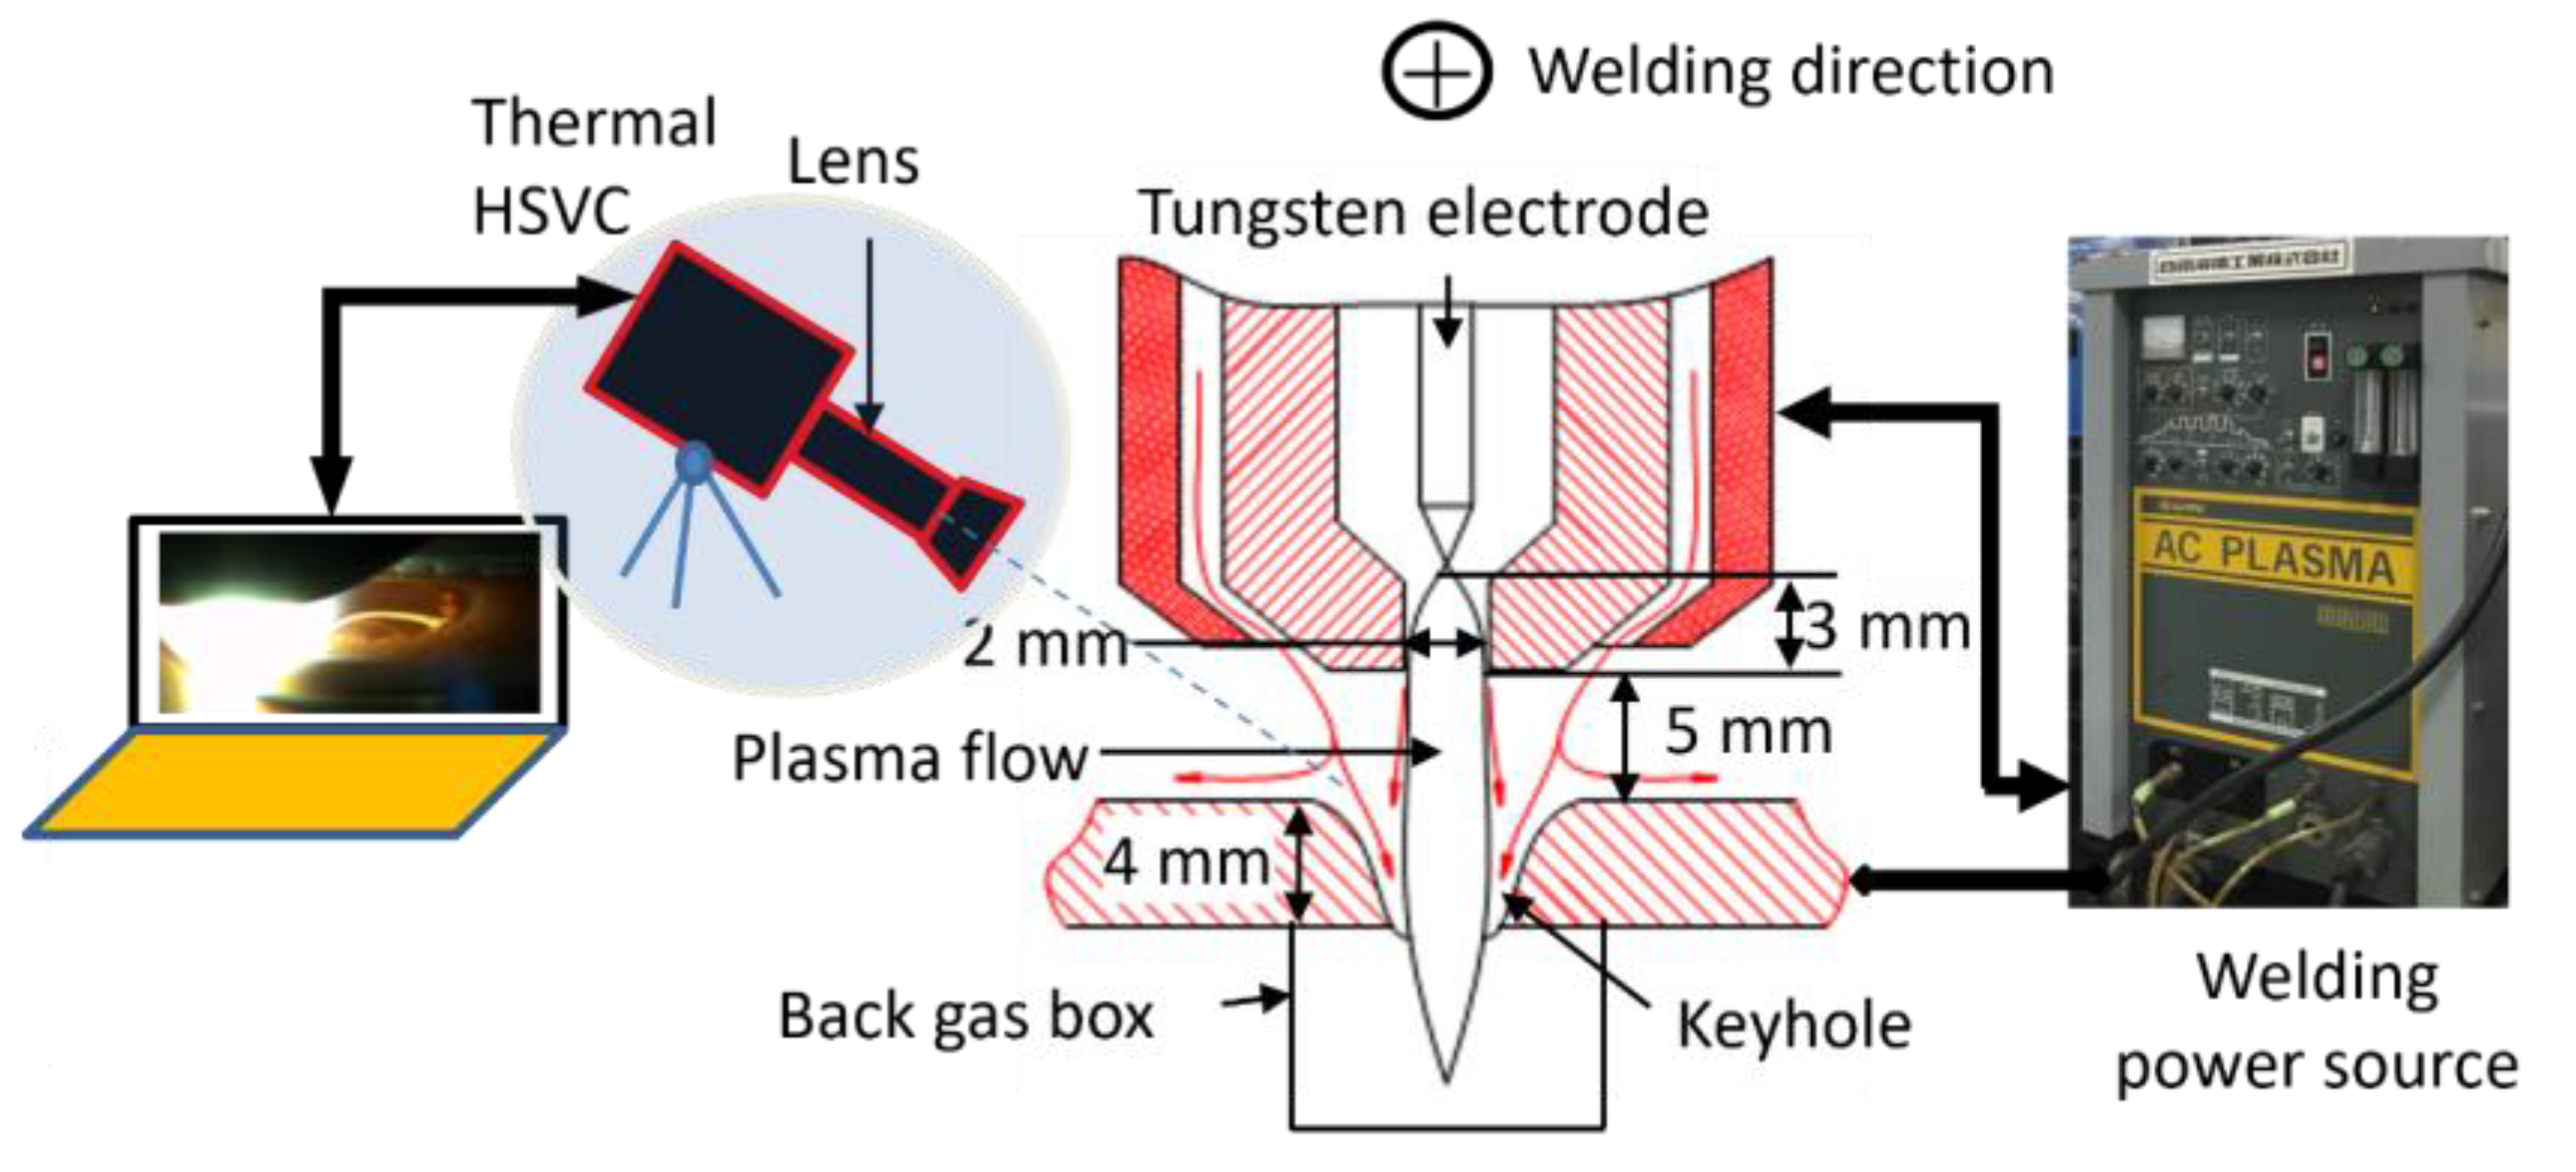
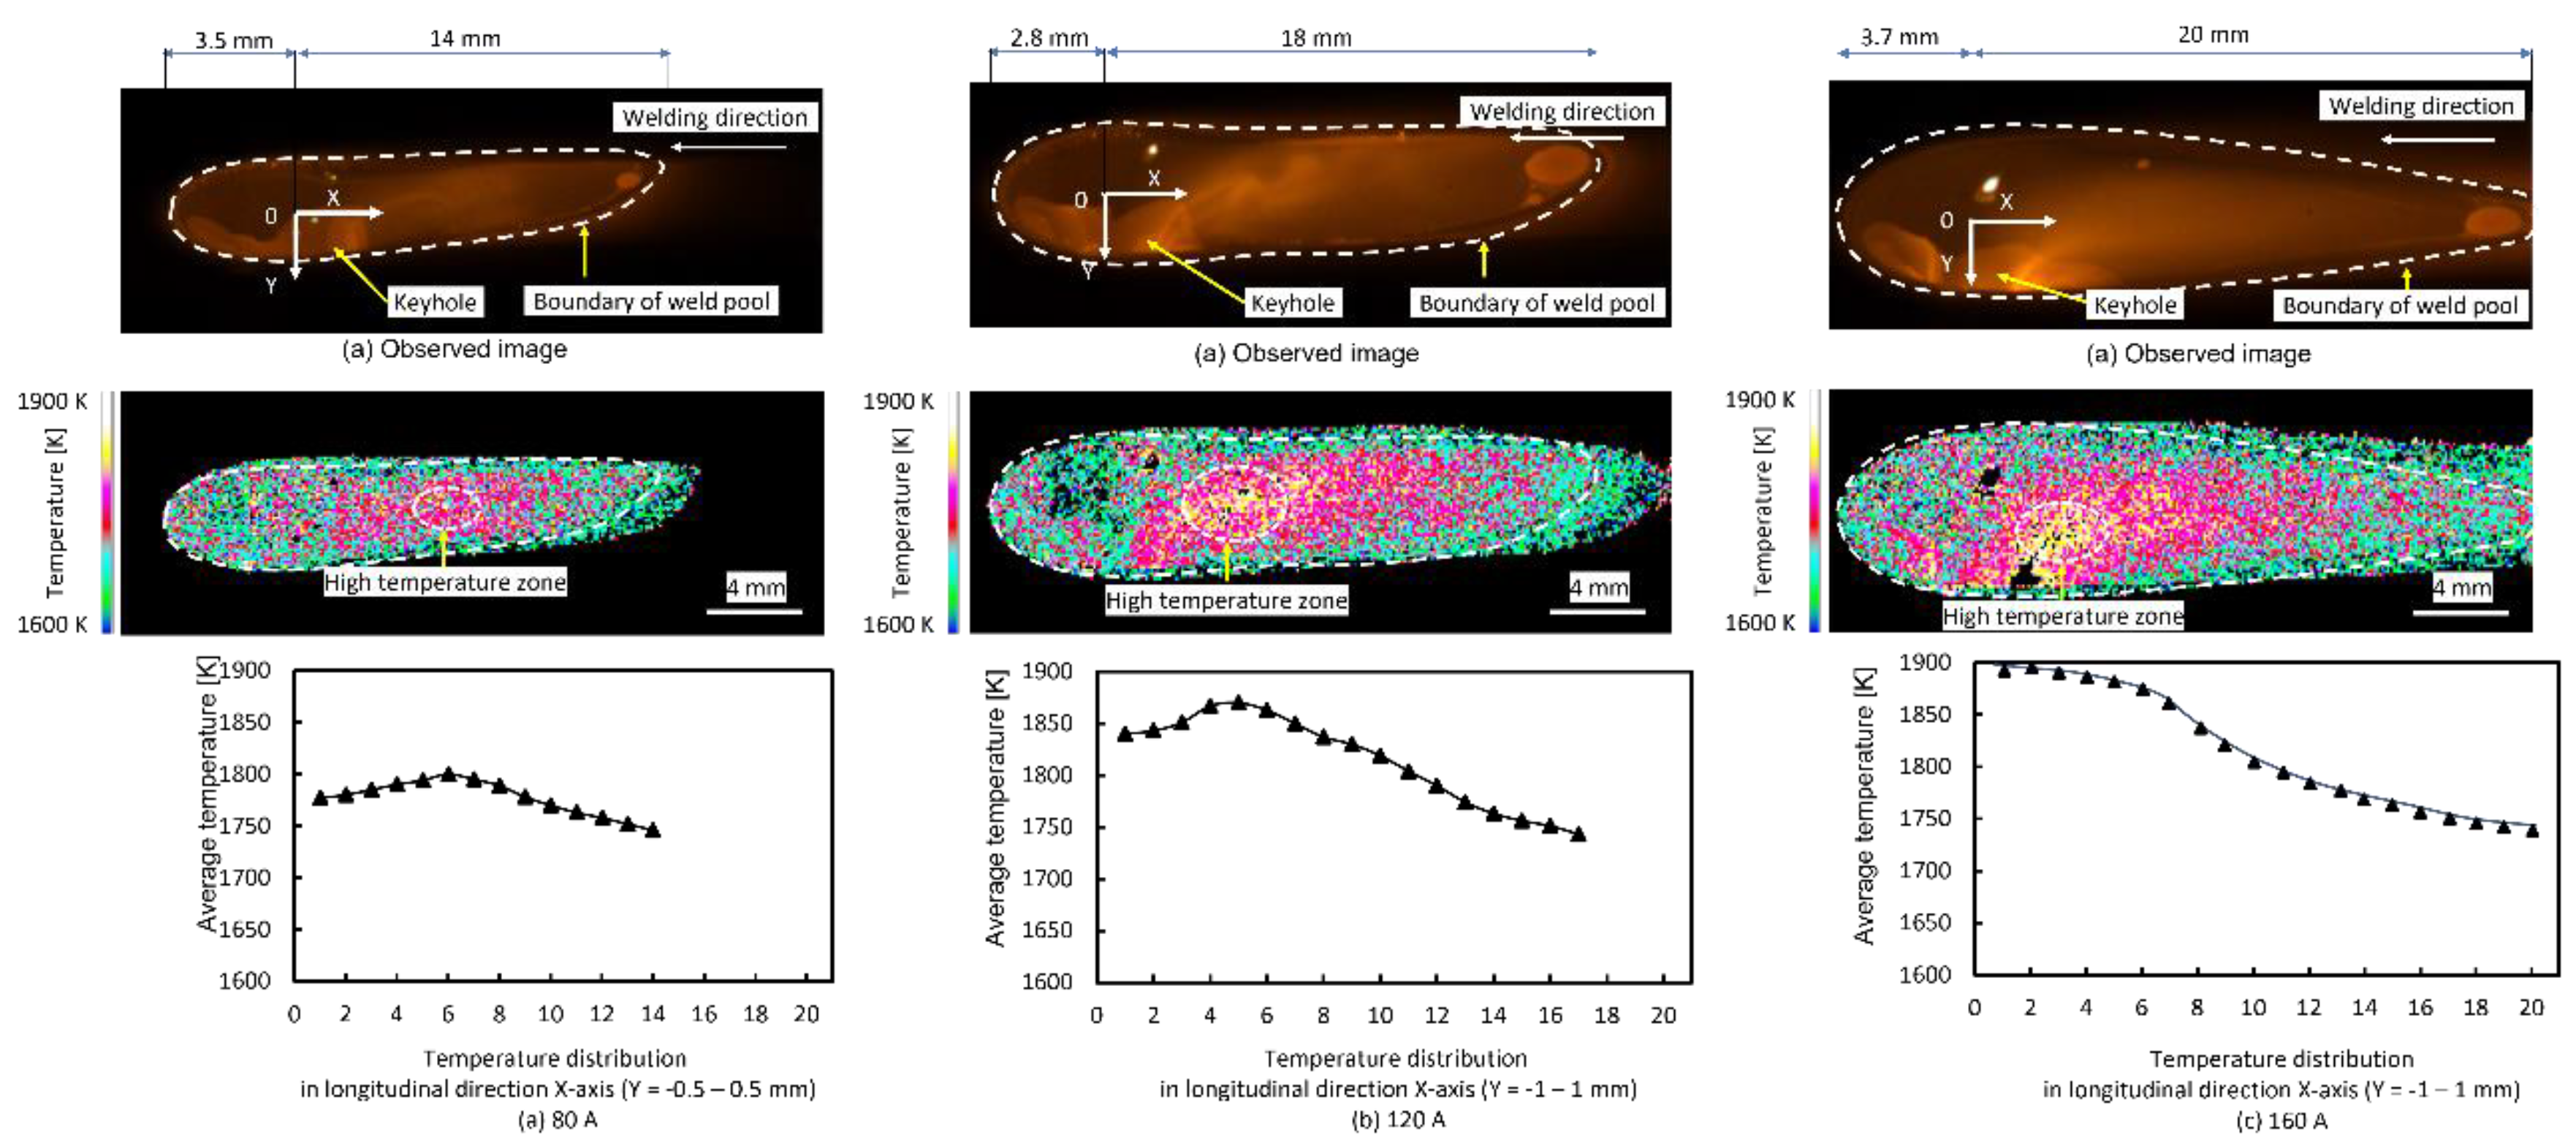
3.2. Temperature on the Melted Domain Surface
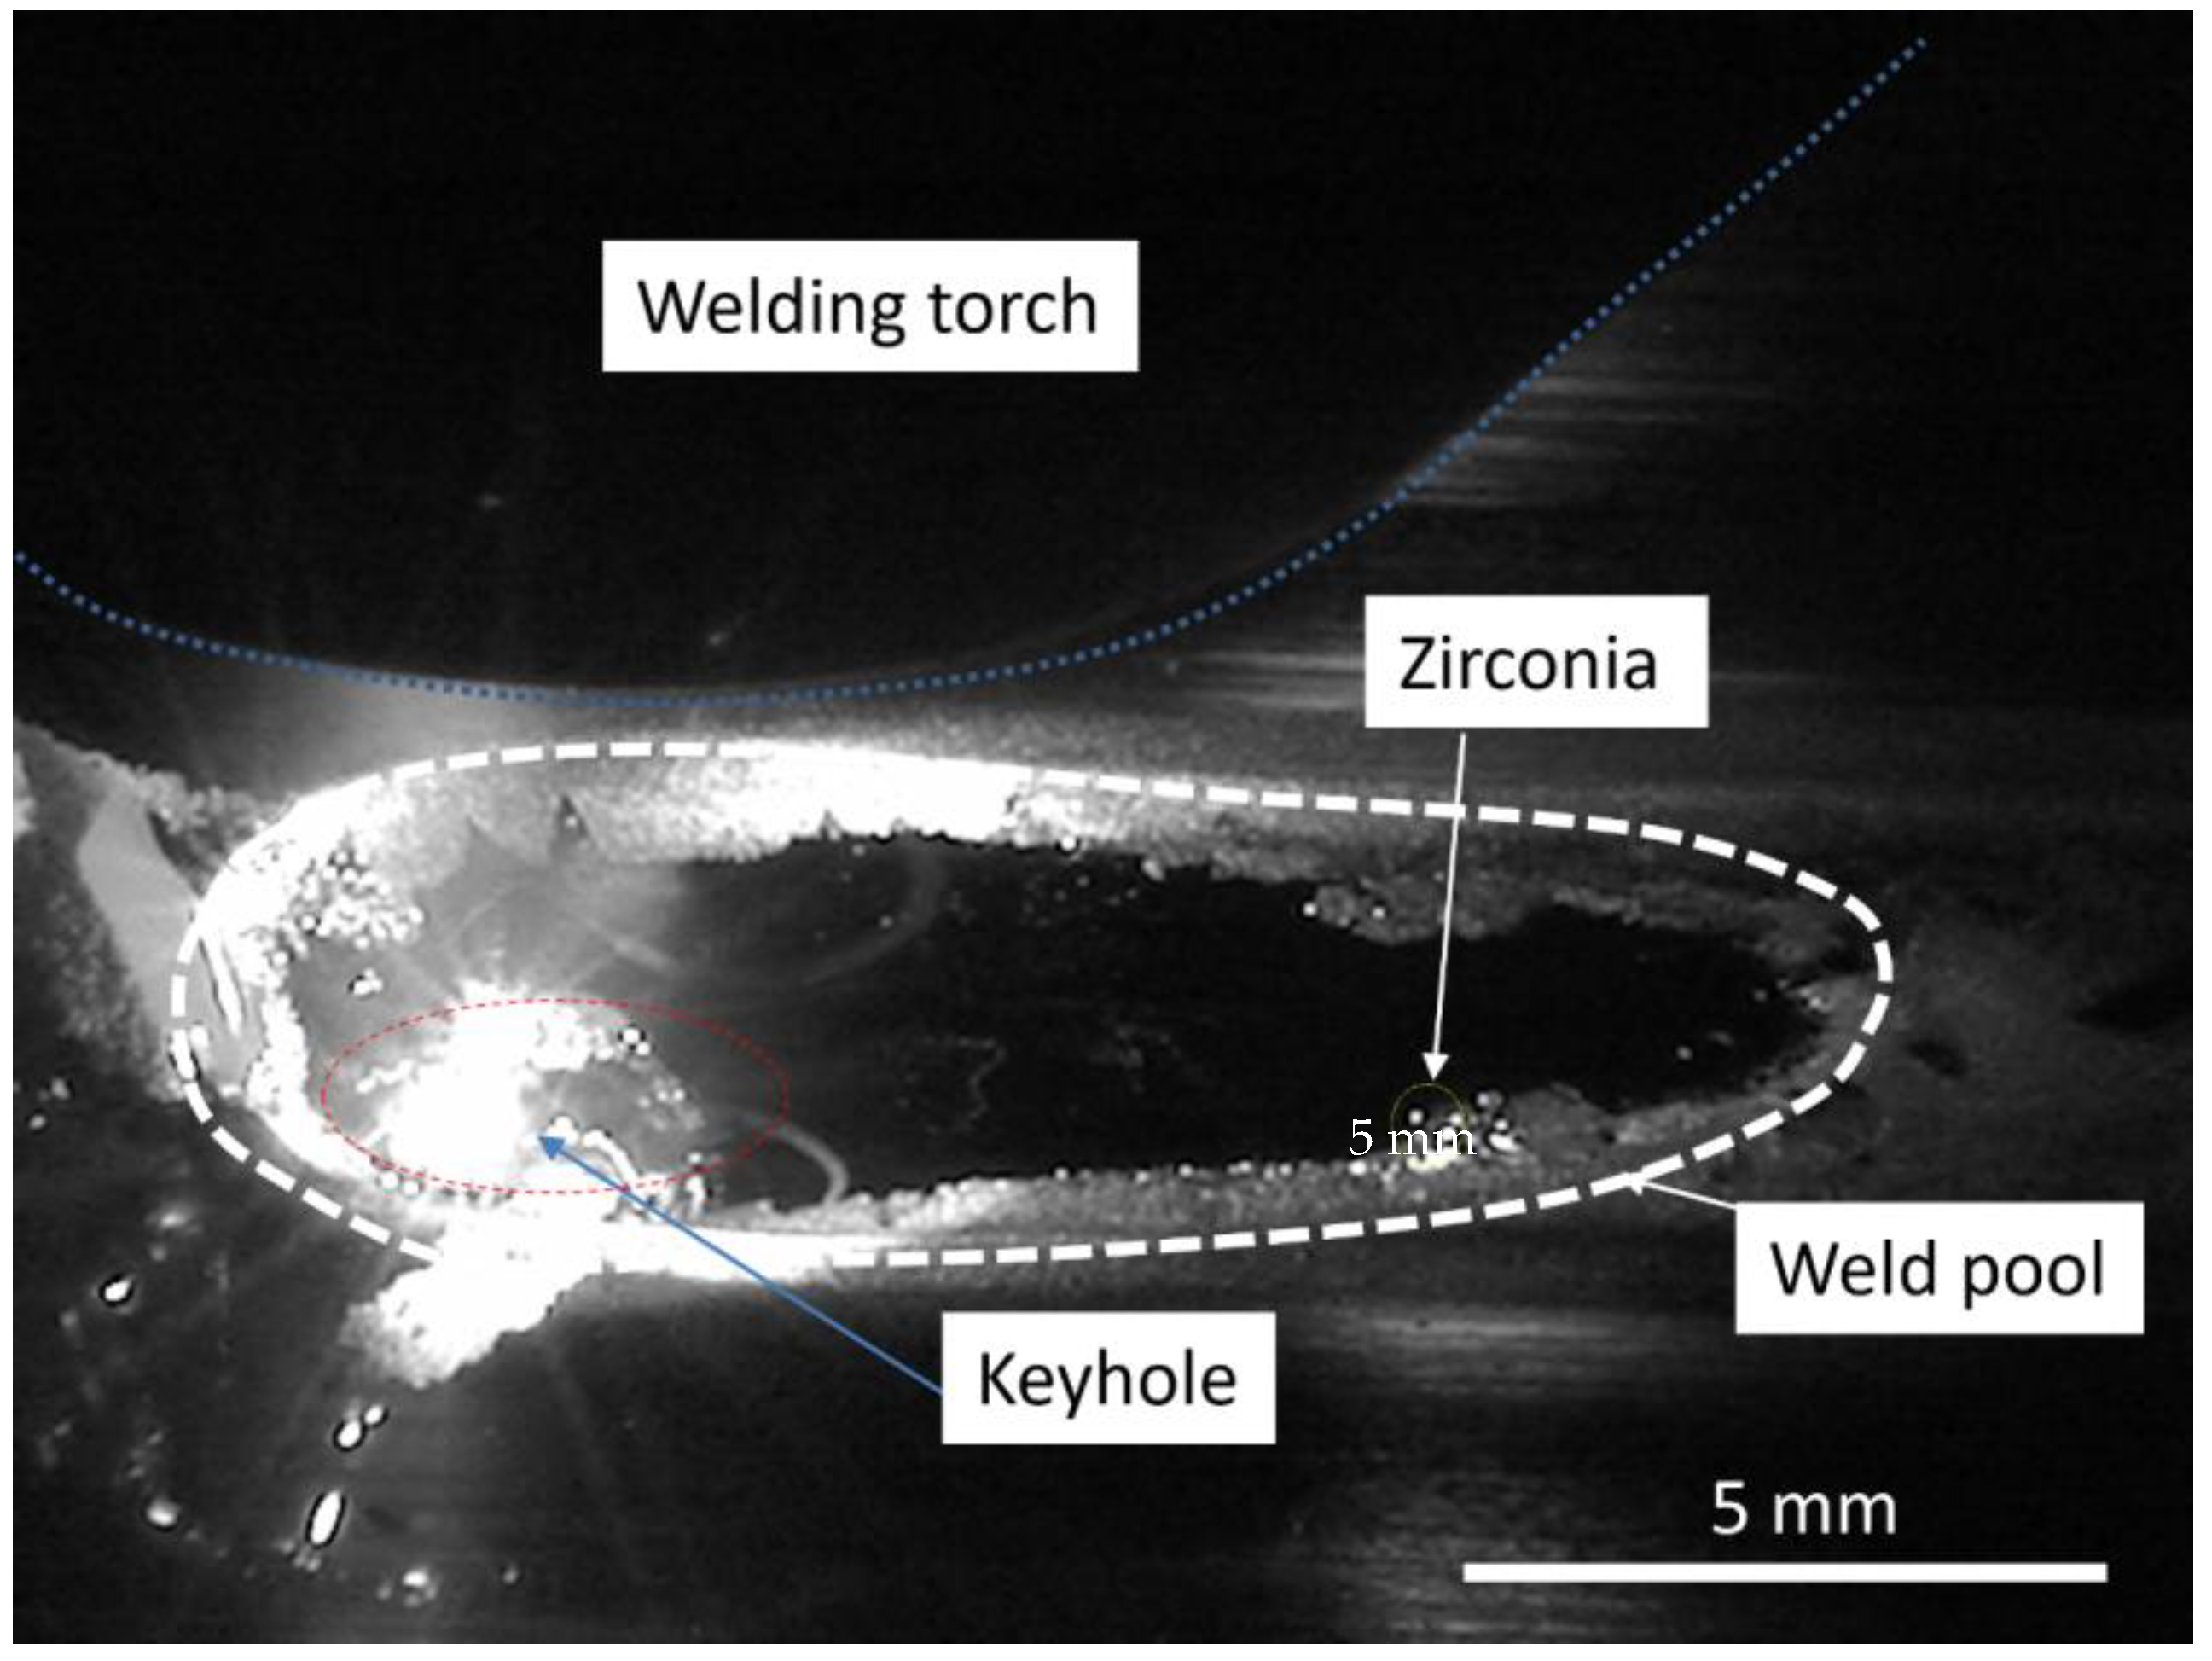
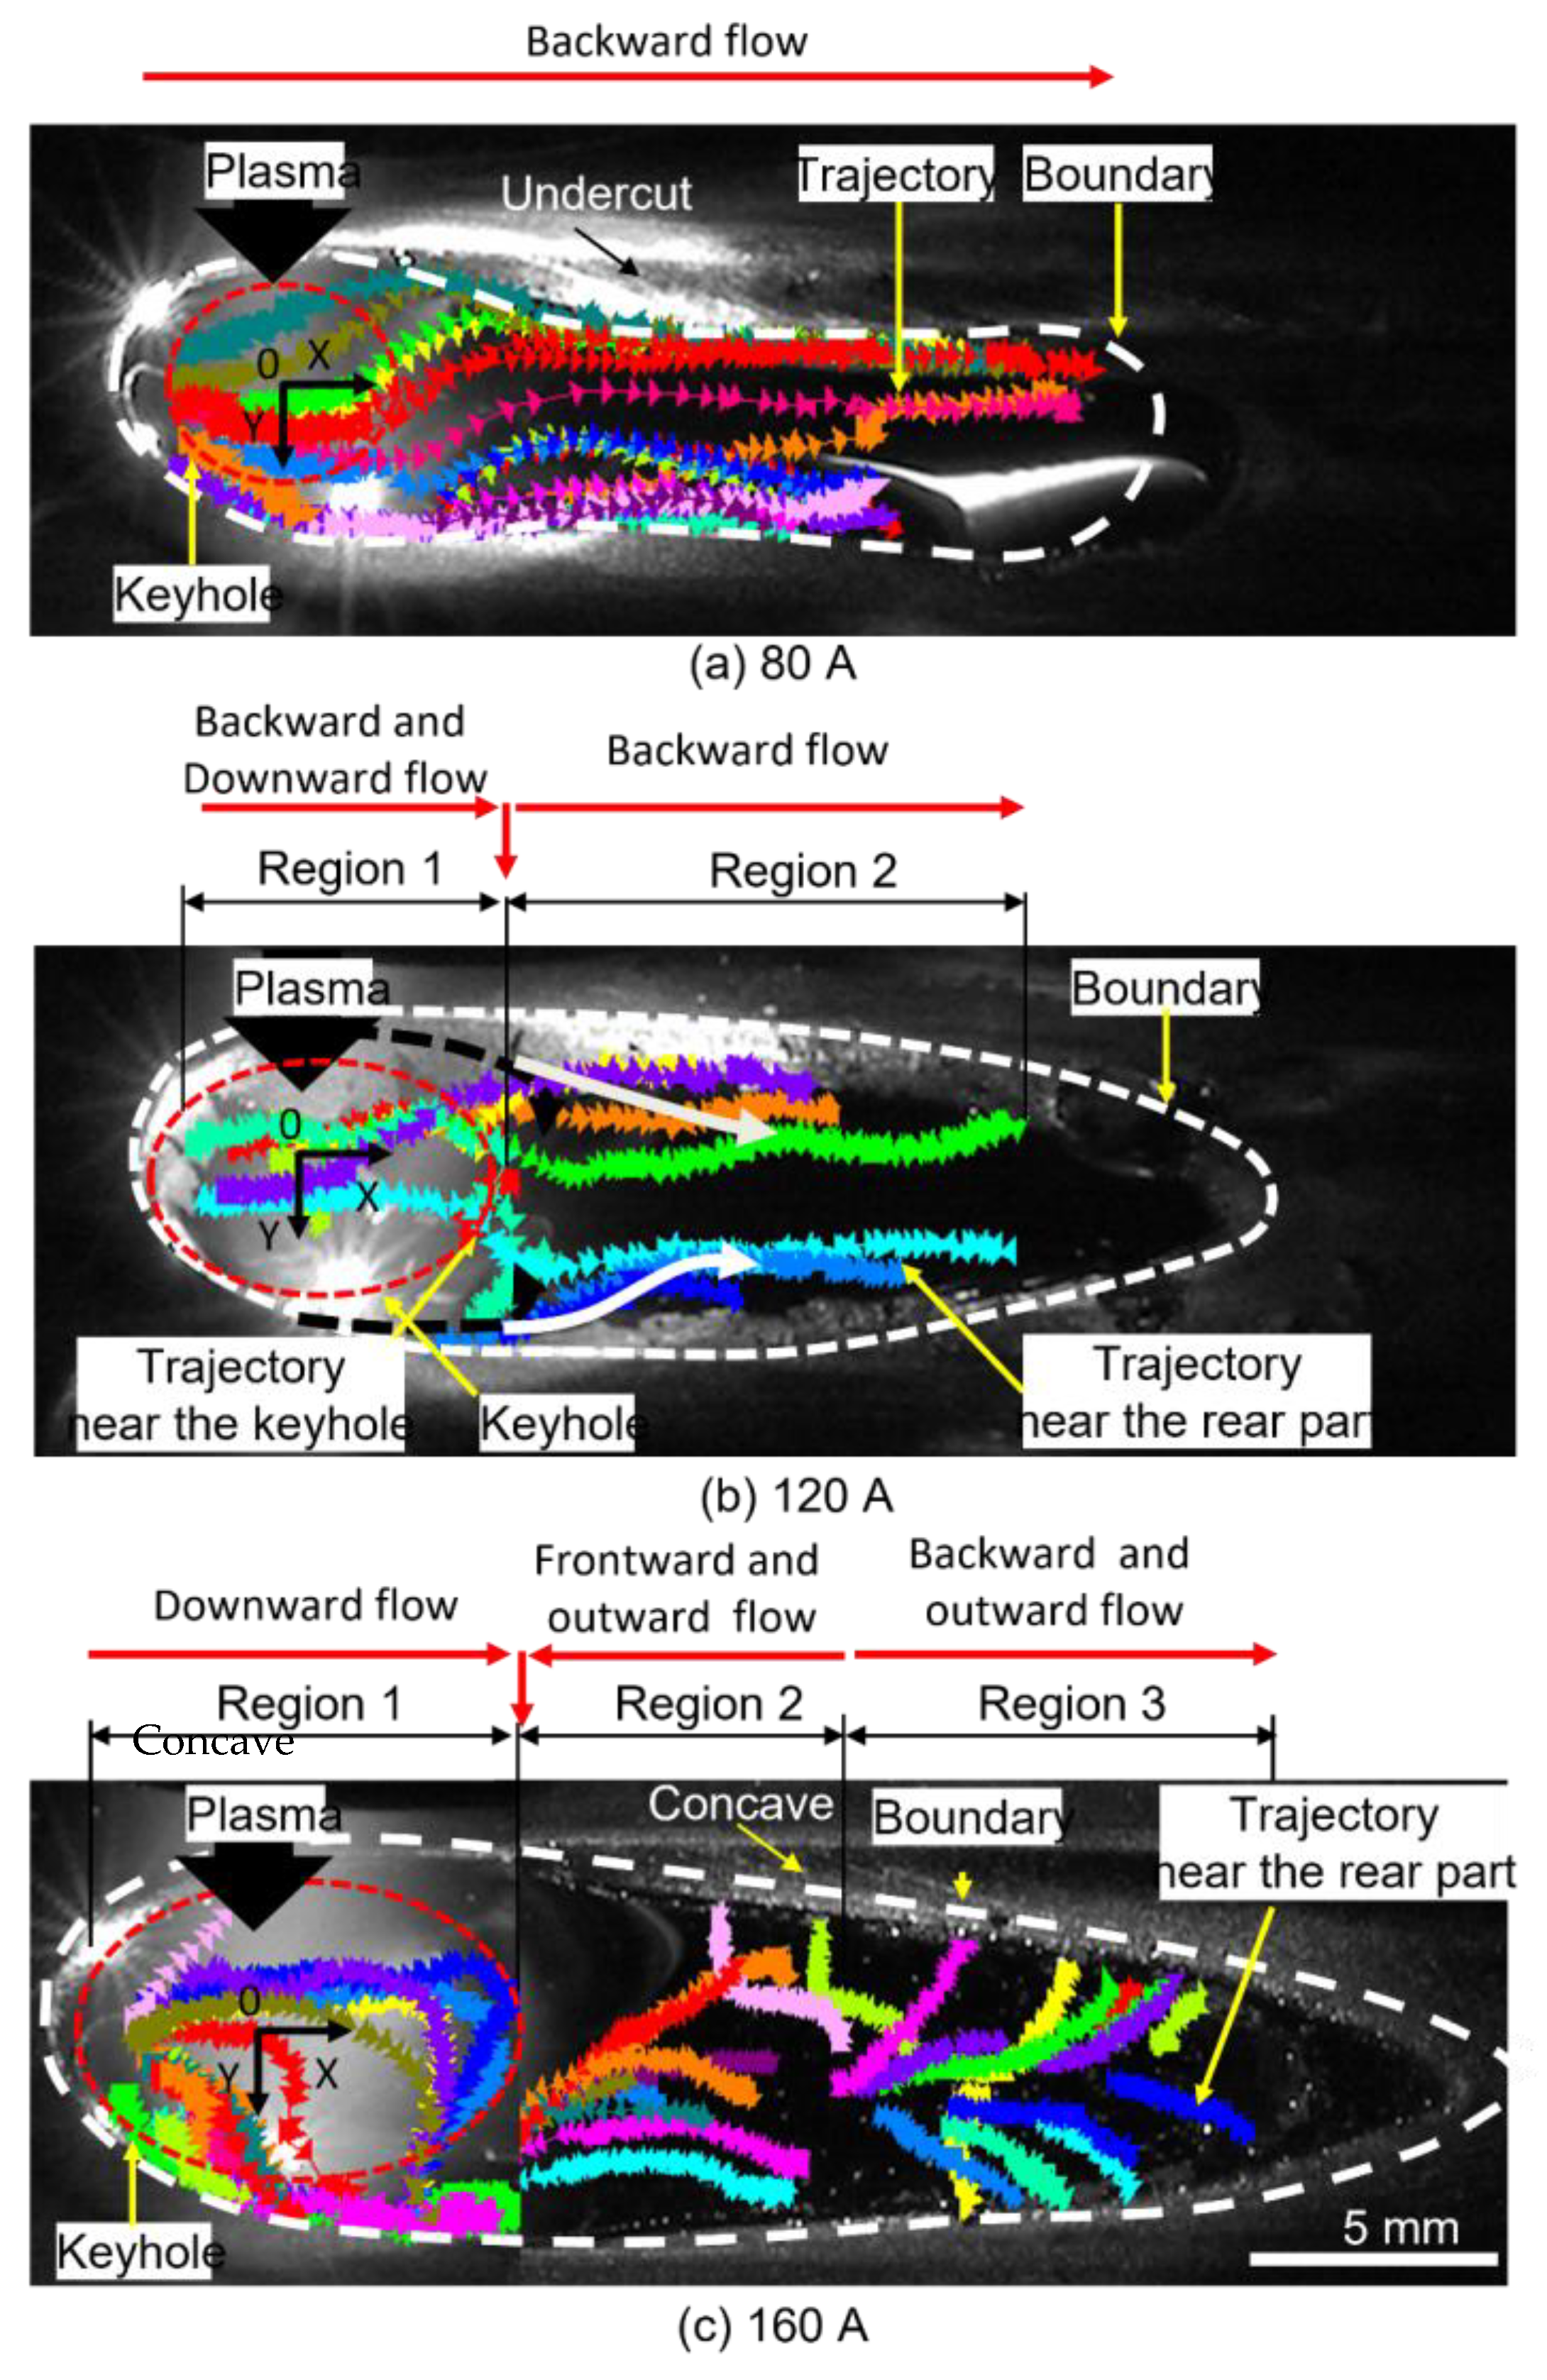
3.3. Material Flow Dynamic on Molten Pool Surface
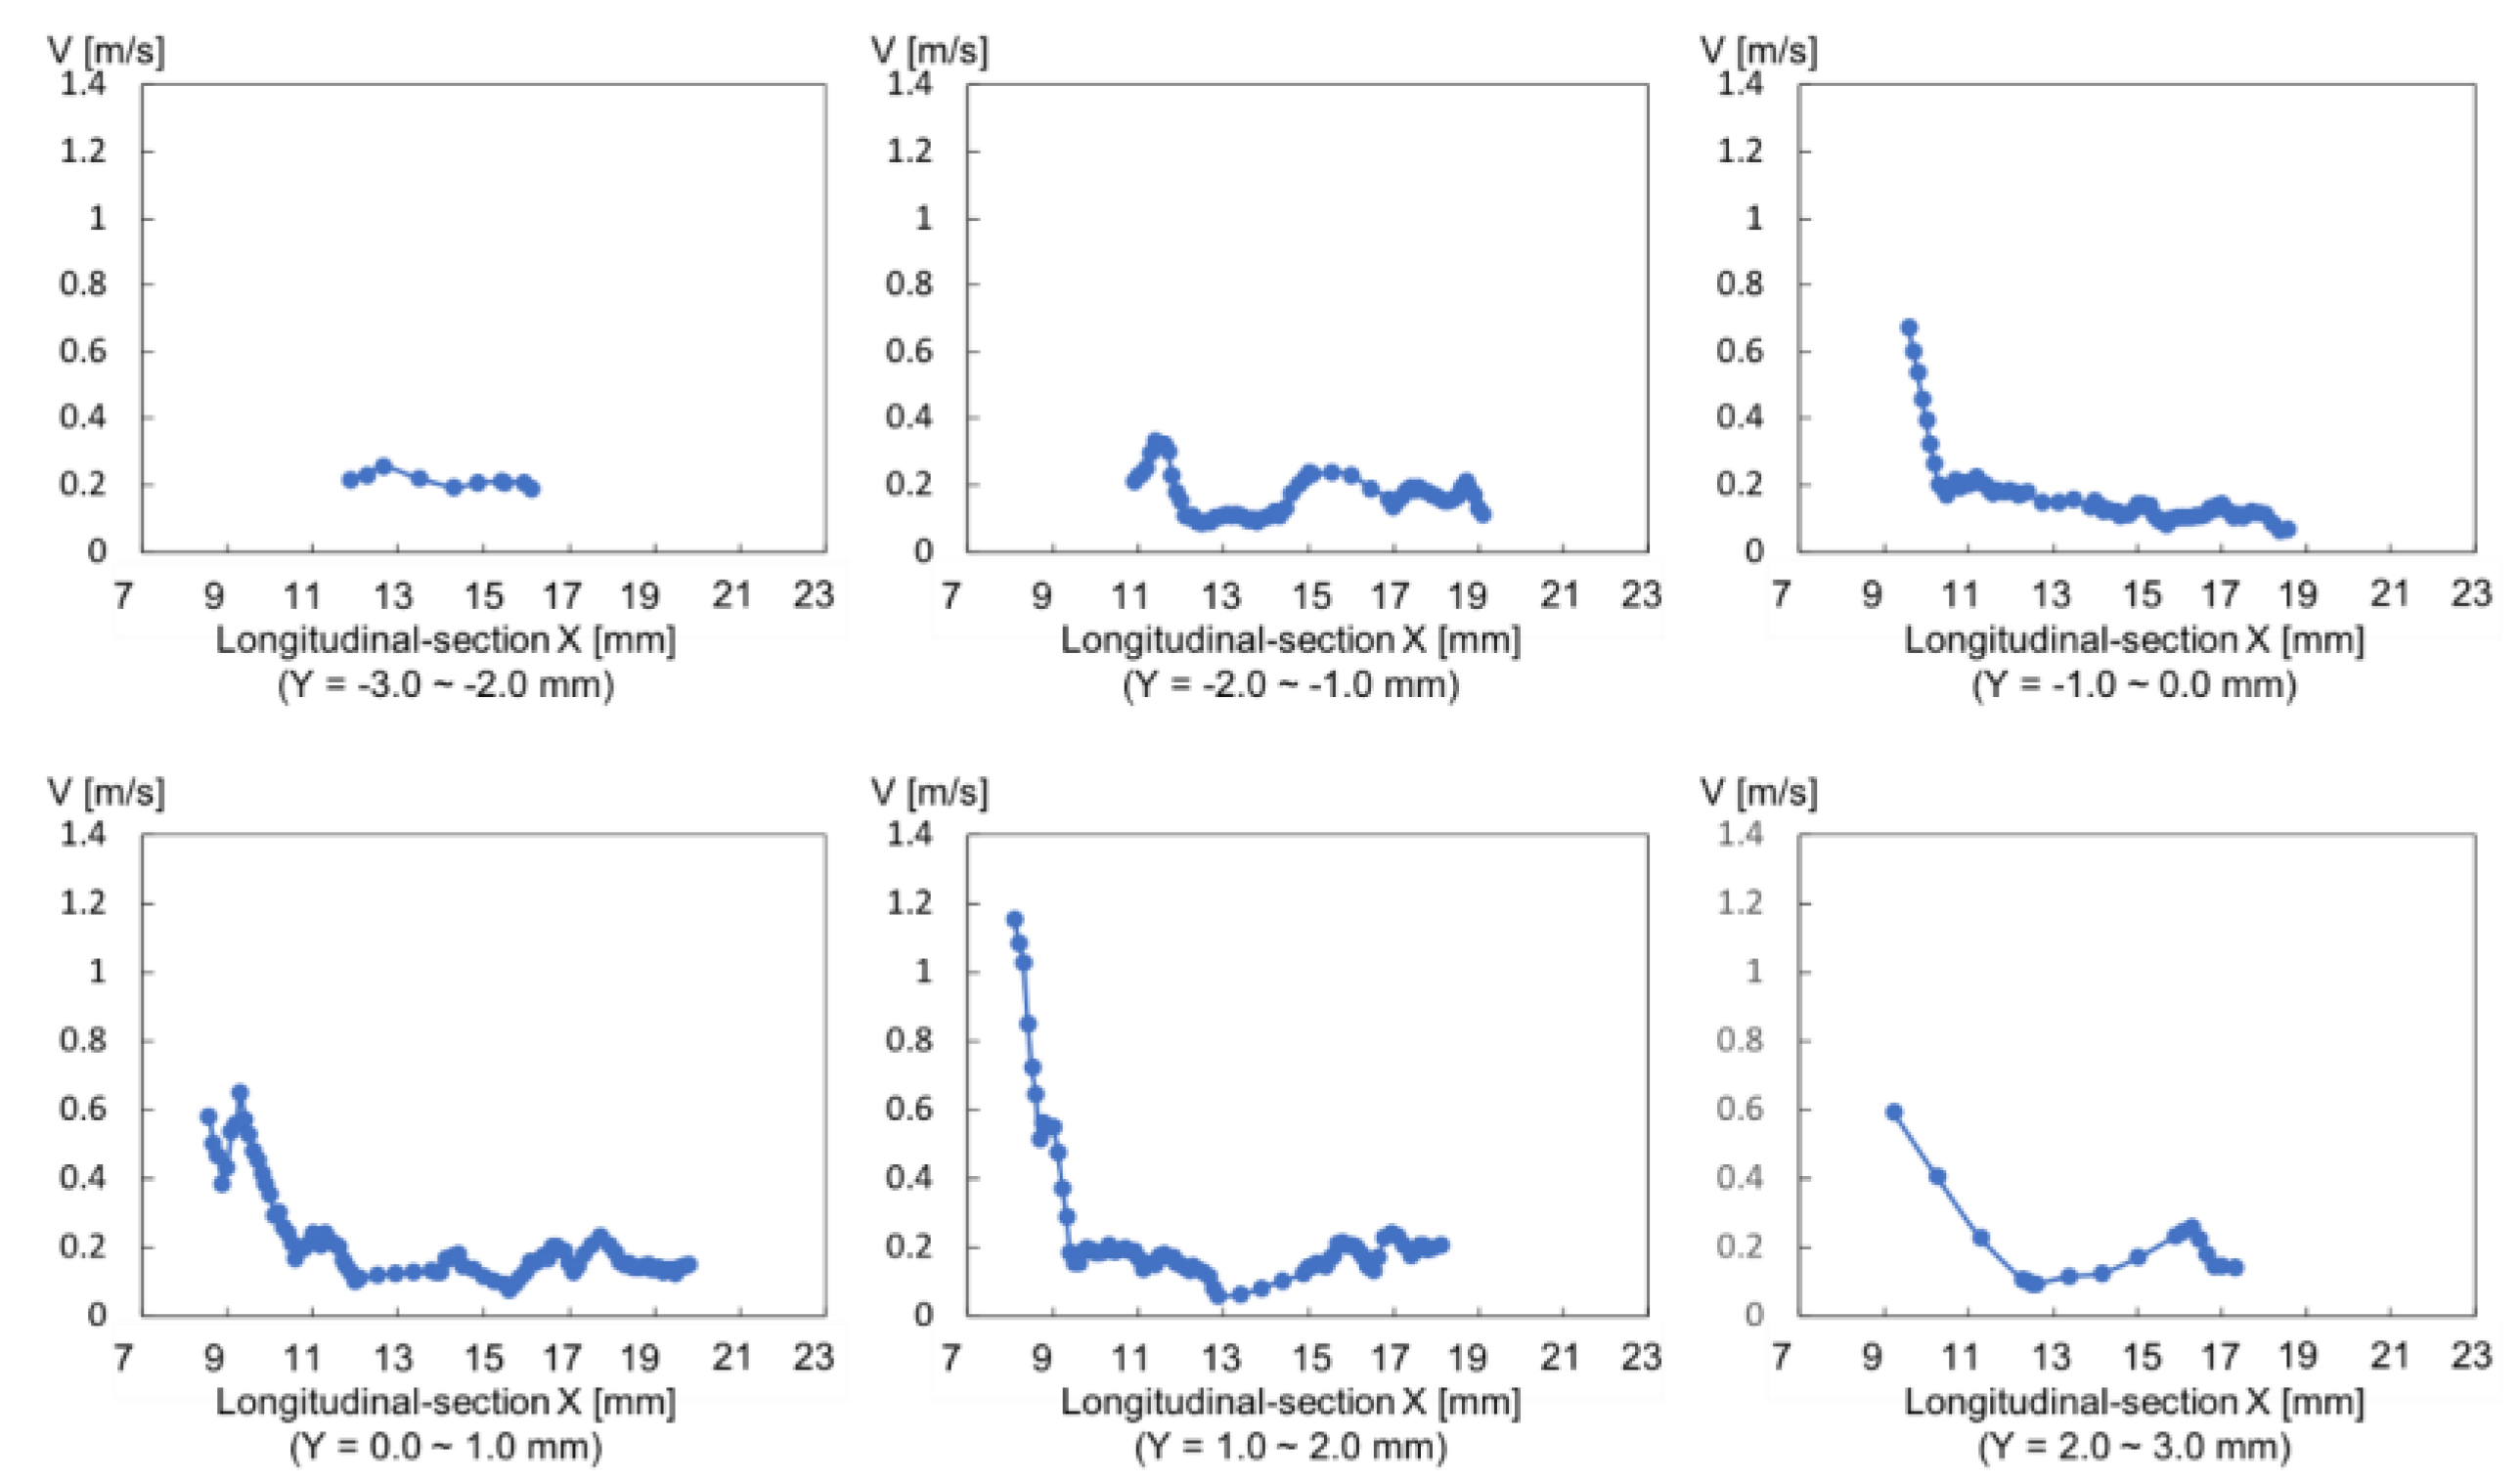
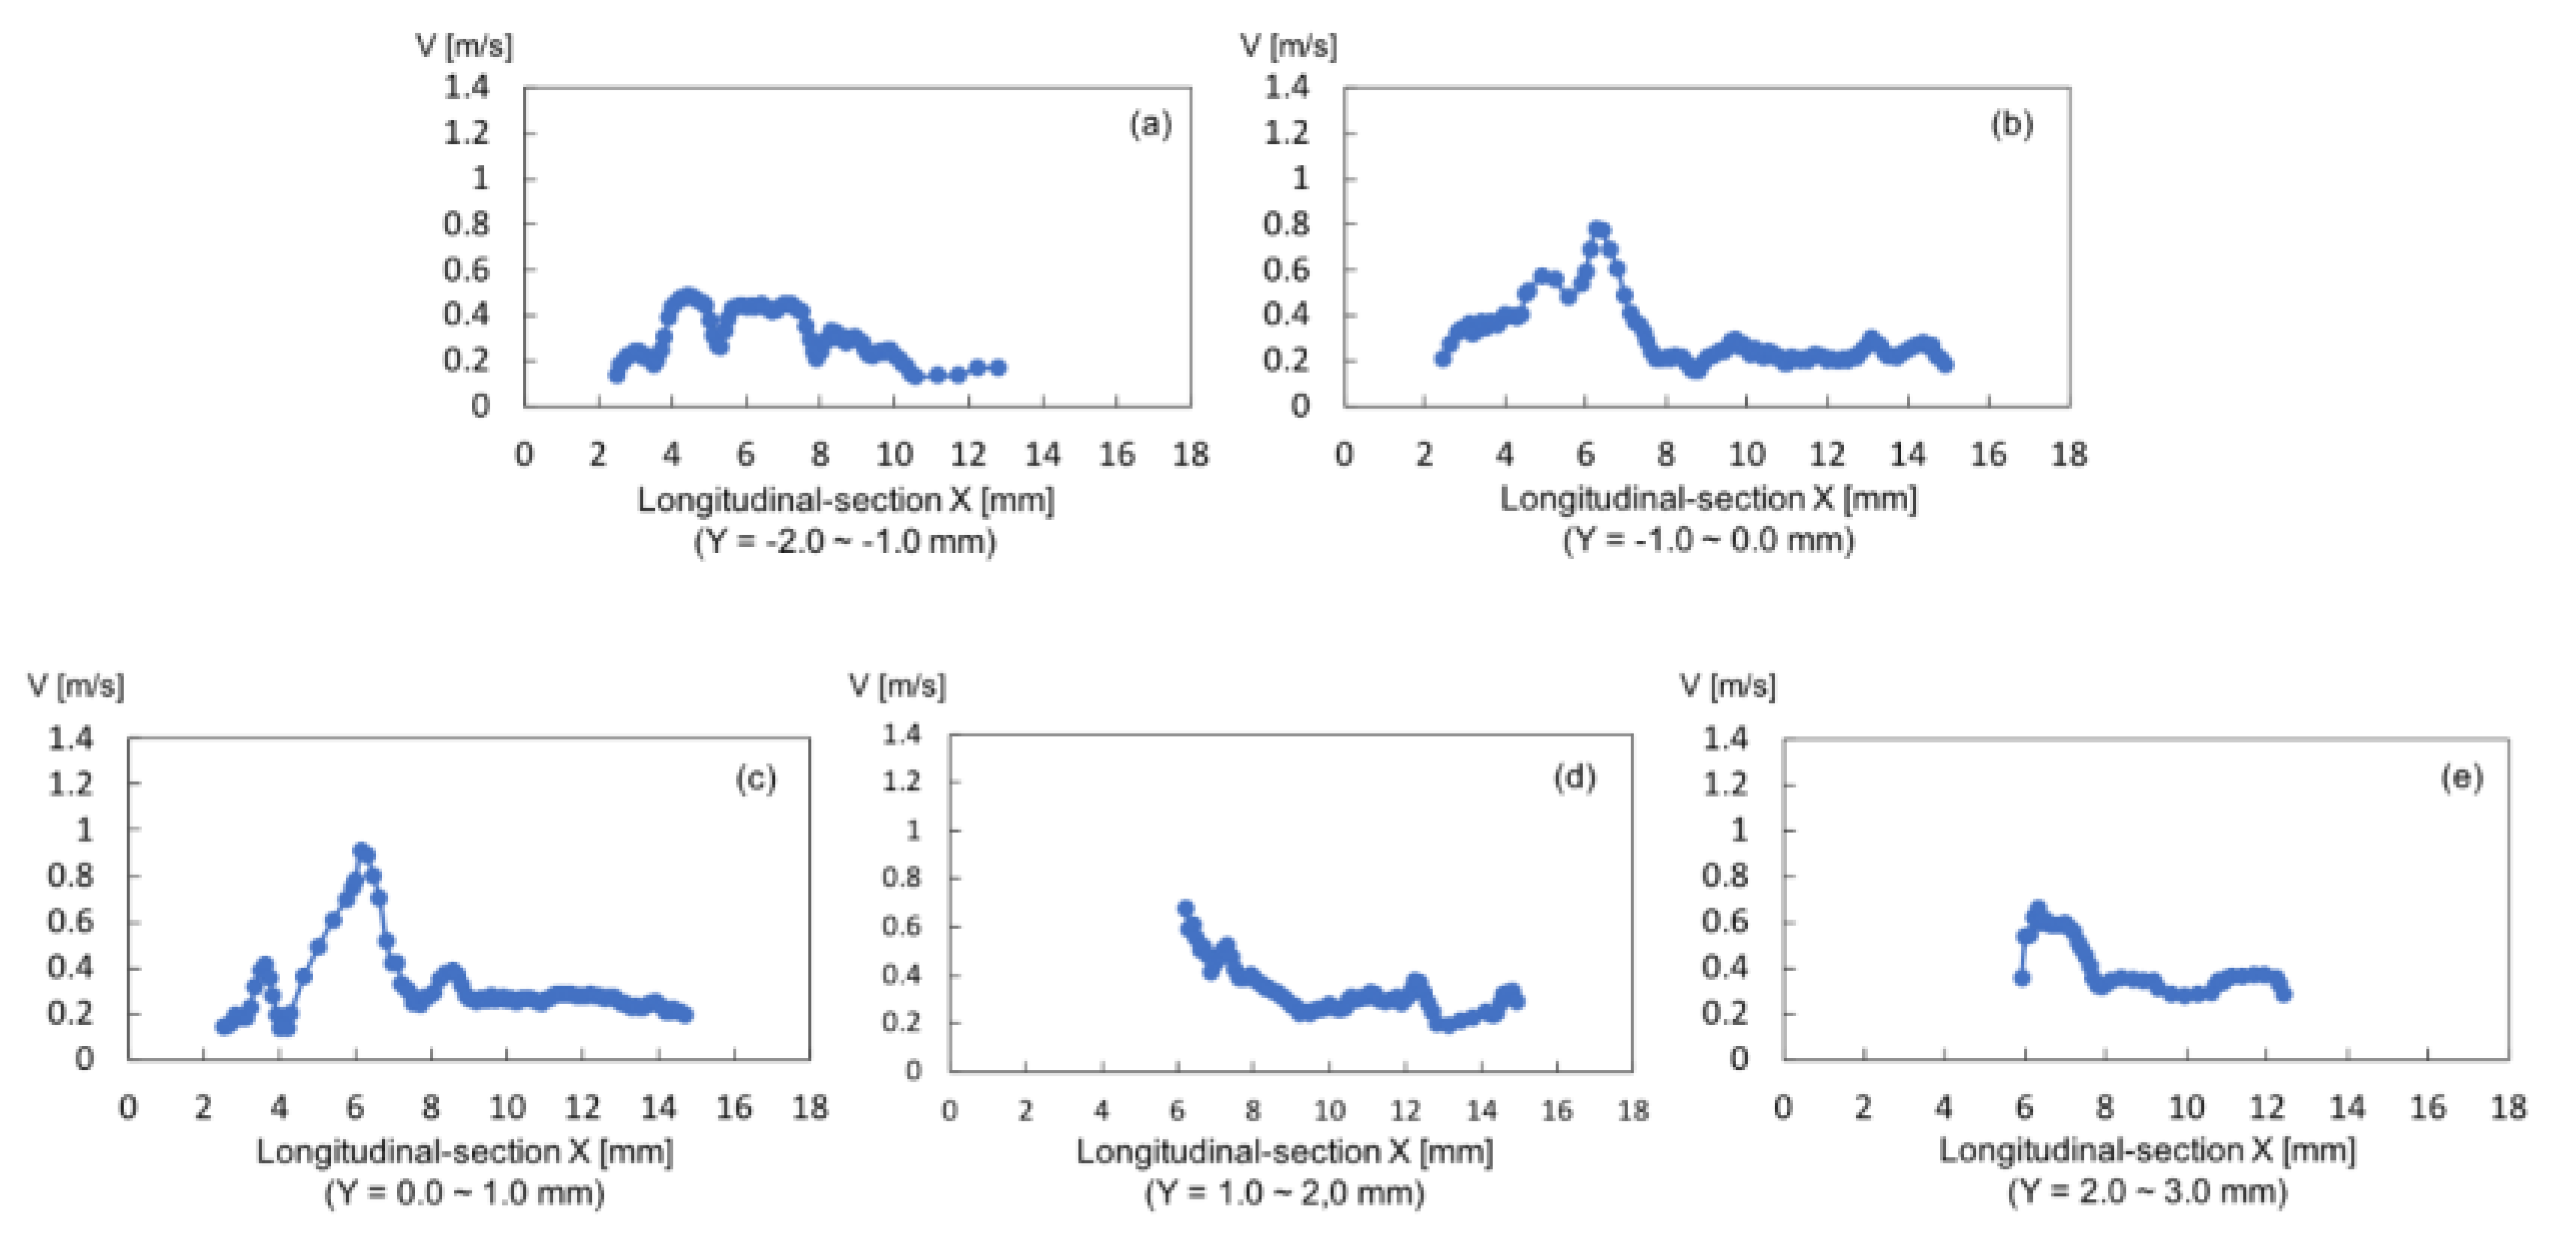
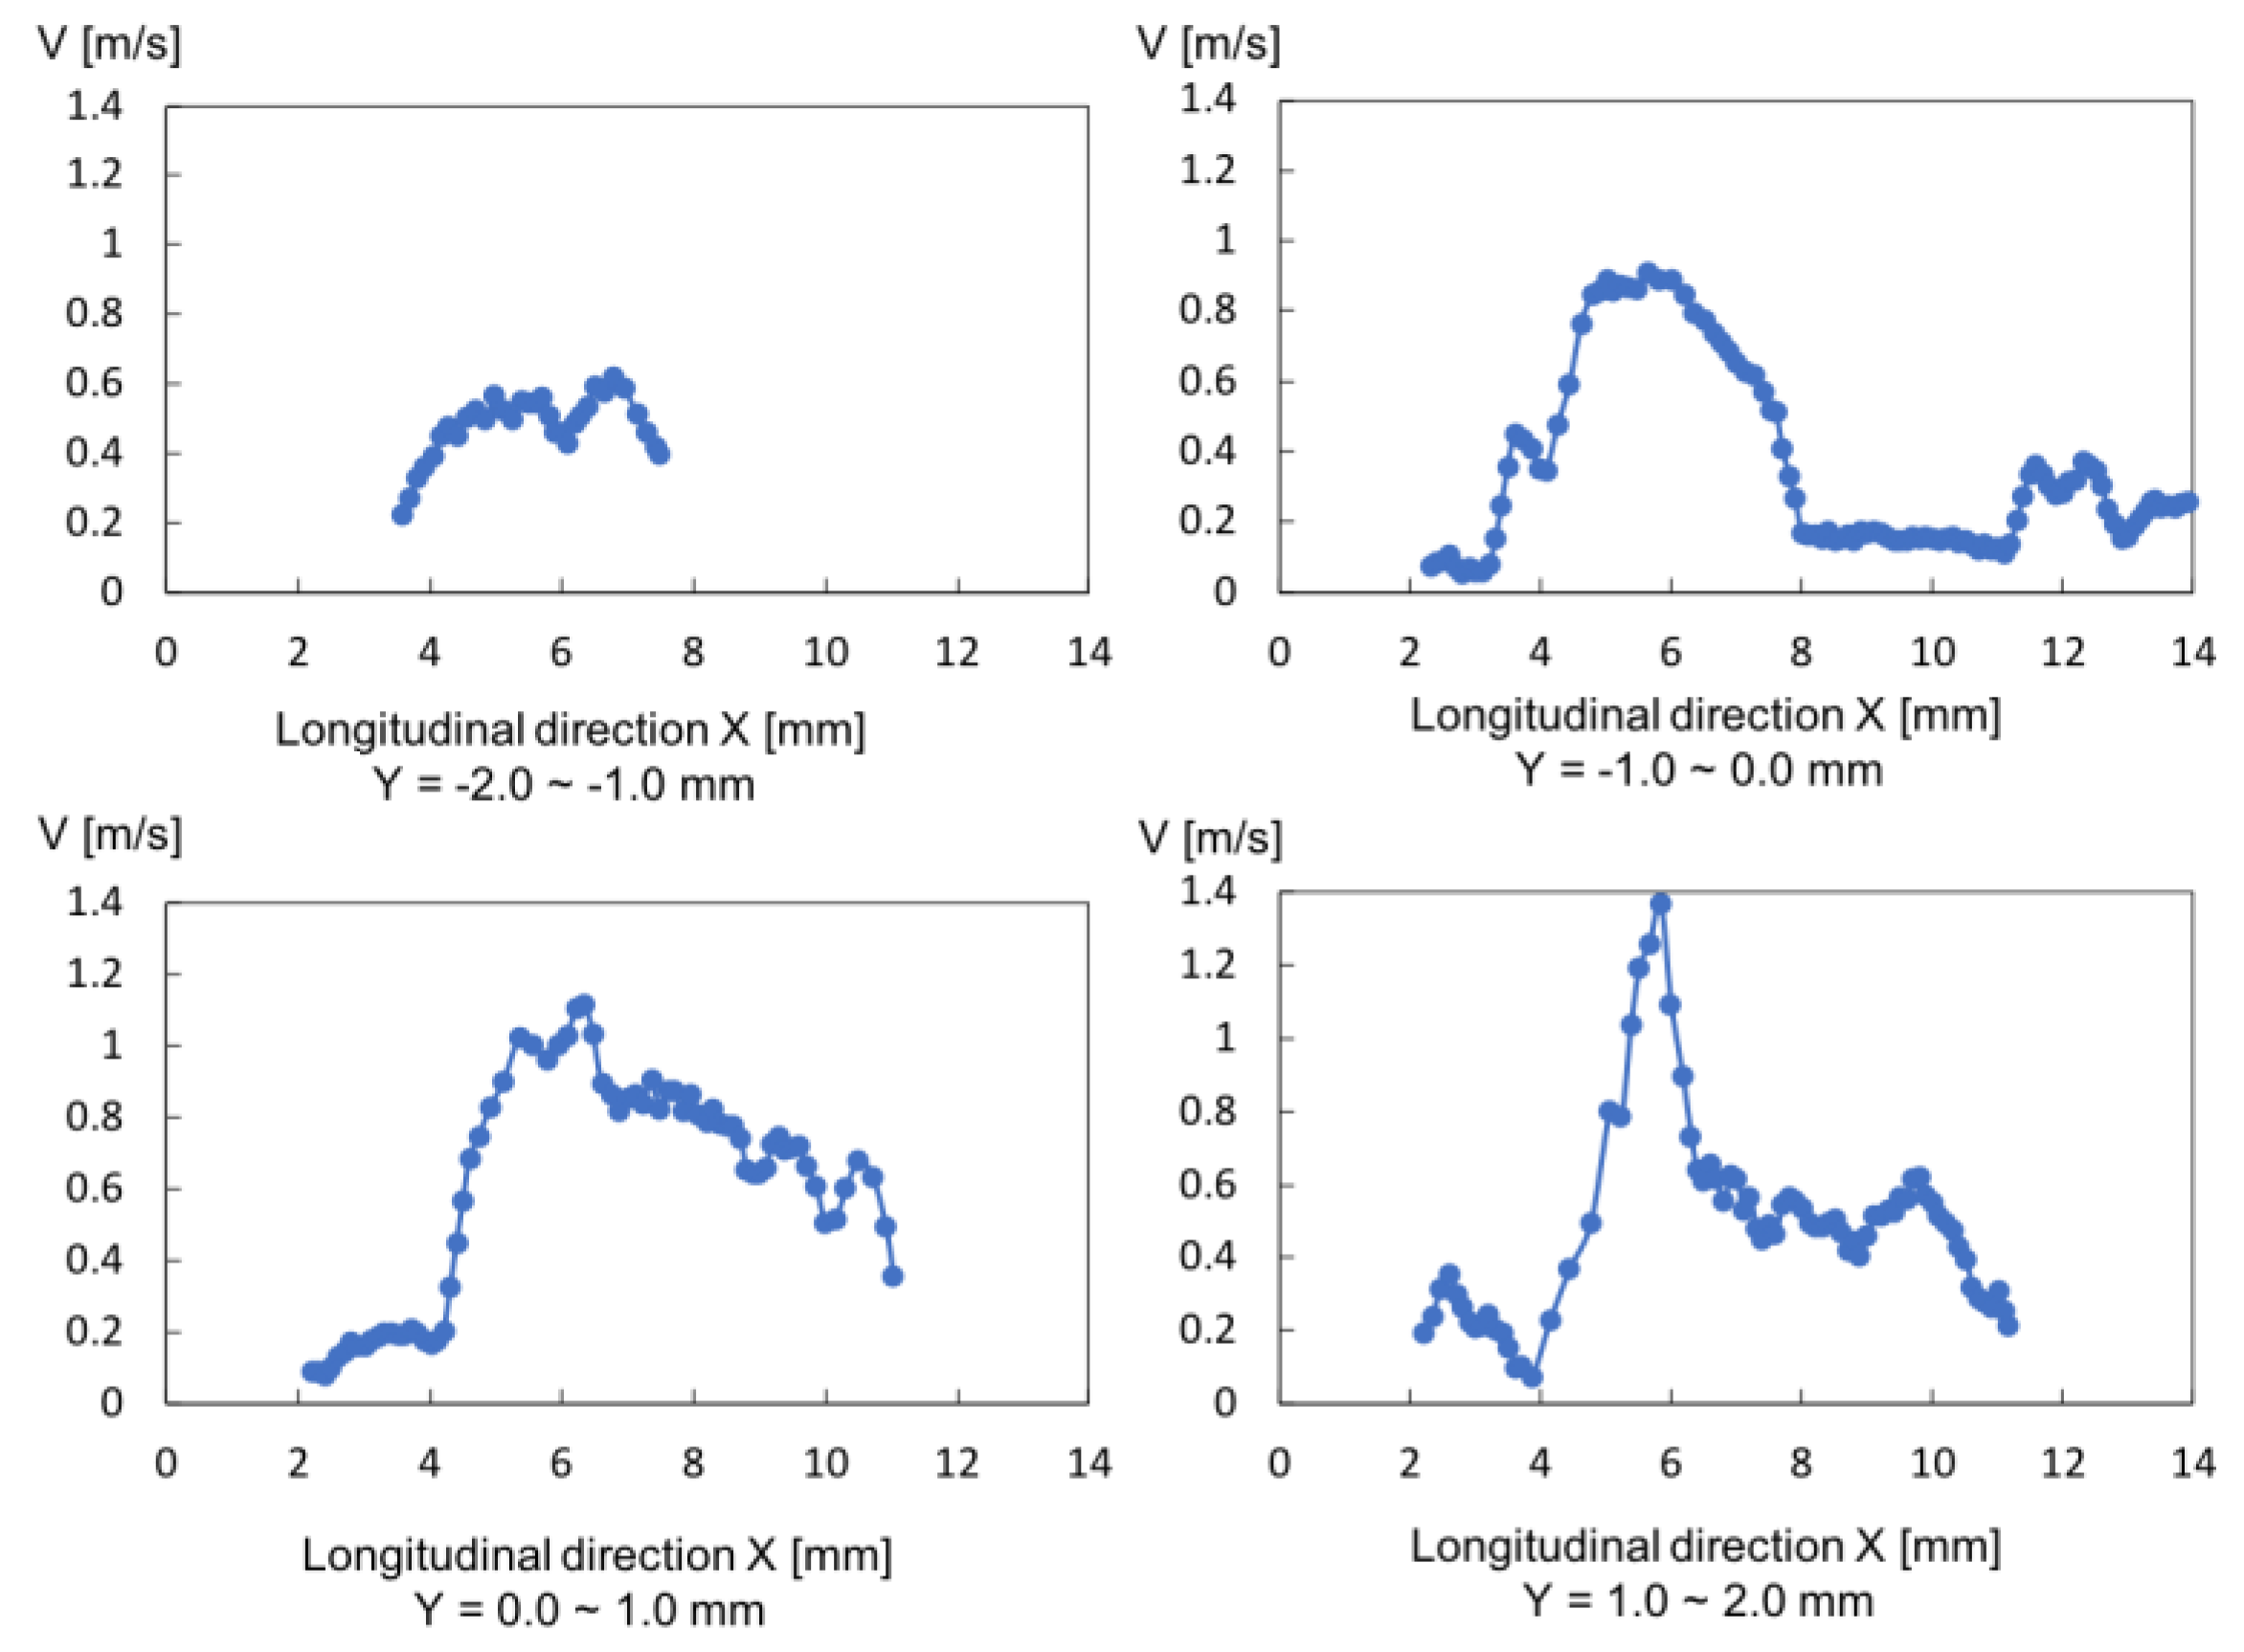
3.4. Velocity of Material Flow on the Melted Domain Surface
3.5. Discussion
4. Conclusions
- No welding defects were seen in the case of 120 A, but serious humping and undercut phenomena was observed in the case of 80 A. Meanwhile, concave and convex occurred in the case of 160 A.
- The welding defects (undercut and humping) related to a high-speed fluid flow on the surface of the melted domain in the case of 80 A.
- The excessive convex and concave on the bottom surface was with a reverse fluid flow in the downward direction around the keyhole in the case of 160 A.
- The convection speed was faster in the case of low welding current (80 A). Meanwhile, the slower speed occurred in the case of high welding current (160 A).
- The interaction between shear force and Marangoni force mainly controlled the convection and heat transportation in the weld pool.
Author Contributions
Funding
Data Availability Statement
Acknowledgments
Conflicts of Interest
References
- Zhao, C.; Parab, N.D.; Li, X.; Fezzaa, K.; Tan, W.; Rollett, A.D.; Sun, T. Critical instability at moving keyhole tip generates porosity in laser melting. Science 2020, 370, 1080–1086. [Google Scholar] [CrossRef] [PubMed]
- Yakout, M.; Phillips, I.; Elbestawi, M.; Fang, Q. In-situ monitoring and detection of spatter agglomeration and delamination during laser-based powder bed fusion of Invar 36. Opt. Laser Technol. 2021, 136, 106741. [Google Scholar] [CrossRef]
- Zong, R.; Chen, J.; Wu, C.S.; Padhy, G.K. Influence of molten metal flow on undercutting formation in GMAW. Sci. Technol. Weld. Join. 2016, 22, 198–207. [Google Scholar] [CrossRef]
- Nguyen, T.C.; Weckman, D.C.; Johnson, D.A.; Kerr, H.W. The humping phenomenon during high speed gas metal arc welding. Sci. Technol. Weld. Join. 2005, 10, 447–459. [Google Scholar] [CrossRef]
- Chen, Y.; Clark, S.J.; Leung, C.L.A.; Sinclair, L.; Marussi, S.; Olbinado, M.P.; Boller, E.; Rack, A.; Todd, I.; Lee, P.D. In-situ Synchrotron imaging of keyhole mode multi-layer laser powder bed fusion additive manufacturing. Appl. Mater. Today 2020, 20, 100650. [Google Scholar] [CrossRef]
- Yousuke, K.; Kouki, N.; Yosuke, U.; Masami, M.; Kouji, N.; Horoshi, K.; Seiji, K. Relationship between melt flows based on three-dimensional X-ray transmission in-situ observation and spatter reduction by angle of incidence and defocusing distance in high-power laser welding of stainless steel. Q. J. Jpn. Weld. Soc. 2016, 34, 239–248. [Google Scholar]
- Kawahito, Y.; Wang, H. In-situ observation of gap filling in laser butt welding. Scr. Mater. 2018, 154, 73–77. [Google Scholar] [CrossRef]
- Morisada, Y.; Fujii, H.; Kawahito, Y.; Nakata, K.; Tanaka, M. Three-dimensinal visualization of material flow during friction stir welding by two pairs of X-ray transmission system. Scipta Mater. 2011, 65, 1085–1088. [Google Scholar] [CrossRef]
- Aucott, L.; Dong, H.; Mirihanage, W.; Atwood, R.; Kidess, A.; Gao, S.; Wen, S.; Marsden, J.; Feng, S.; Tong, M.; et al. Revealing internal flow behaviour in arc welding and additive manufacturing of metals. Nat. Commun. 2018, 9, 1–7. [Google Scholar] [CrossRef] [Green Version]
- Chen, Y.; Clark, S.J.; Huang, Y.; Sinclair, L.; Leung, C.L.A.; Marussi, S.; Connolley, T.; Magdysyuk, O.V.; Atwood, R.C.; Baxter, G.J.; et al. In situ X-ray quantification of melt pool behaviour during directed energy deposition additive manufacturing of stainless steel. Mater. Lett. 2021, 286, 129205. [Google Scholar] [CrossRef]
- Cunningham, R.; Zhao, C.; Parab, N.; Kantzos, C.; Pauza, J.; Fezzaa, K.; Sun, T.; Rollett, A.D. Keyhole threshold and morphology in laser melting revealed by ultrahigh-speed x-ray imaging. Science 2019, 363, 849–852. [Google Scholar] [CrossRef]
- Guo, Q.; Zhao, C.; Qu, M.; Xiong, L.; Hojjatzadeh, S.M.H.; Escano, L.I.; Parab, N.D.; Fezzaa, K.; Sun, T.; Chen, L. In-situ full-field mapping of melt flow dynamics in laser metal additive manufacturing. Addit. Manuf. 2020, 31, 100939. [Google Scholar] [CrossRef]
- Miyagi, M.; Wang, J. Keyhole dynamics and morphology visualized by in-situ X-ray imaging in laser melting of austenitic stainless steel. J. Mater. Process. Technol. 2020, 282, 116673. [Google Scholar] [CrossRef]
- Xu, B.; Chen, S.; Tashiro, S.; Jiang, F.; Tanaka, M. Physical mechanism of material flow in variable polarity plasma arc keyhole welding revealed by in situ x-ray imaging. Phys. Fluids 2021, 33, 017121. [Google Scholar] [CrossRef]
- van Anh, N.; Tashiro, S.; van Hanh, B.; Tanaka, M. Influence of plasma gas on the behavior of convention flow on weld pool surface. Q. J. Jpn. Weld. Soc. 2017, 35, 98s–102s. [Google Scholar]
- van Anh, N.; Manh, N.H.; Tashiro, S.; Tanaka, M. Behavior of keyhole exit during the cutting arc period. Mater. Eng. Forum 2018, 26, 92–97. [Google Scholar]
- Wu, D.; Tashiro, S.; Hua, X.; Tanaka, M. A novel electrode-arc-weld pool model for studying the keyhole formation in the keyhole plasma arc welding process. J. Phys. D Appl. Phys. 2019, 52, 165203. [Google Scholar] [CrossRef]
- Xu, B.; Chen, S.; Tashiro, S.; Jiang, F.; Nguyễn, V.A.; Tanaka, M. Material flow analyses of high-efficiency joint process in VPPA keyhole flat welding by X-ray transmission system. J. Clean. Prod. 2020, 250, 119450. [Google Scholar] [CrossRef]
- Huu, M.N.; Van, A.N.; Van, T.N.; Hai, D.T.; Van, T.N.; Tien, D.N.; Nguyen, T.-H. Material Flow Behavior on Weld Pool Surface in Plasma Arc Welding Process Considering Dominant Driving Forces. Appl. Sci. 2020, 10, 3569. [Google Scholar] [CrossRef]
- Shu, Y.F.; Rubinsky, B. Two-dimensional heat transfer study on the keyhole plasma arc welding process. Int. J. Heat Mass Transfer. 1988, 31, 1409–1421. [Google Scholar]
- Keanini, R.G.; Rubinsky, B. Three-dimensional simulation of the plasma arc welding process. Int. J. Heat Mass Transfer. 1993, 36, 3283–3298. [Google Scholar] [CrossRef]
- Jian, X.; Wu, C.S. Numerical analysis of the coupled arc-weld pool-keyhole behaviors in stationary plasma arc welding. Int. J. Heat Mass Transfer. 2015, 84, 839–847. [Google Scholar] [CrossRef]
- Li, Y.; Feng, Y.; Li, Y.; Zhang, X.; Wu, C. Plasma arc and weld pool coupled modeling of transport phenomena in keyhole welding. Int. J. Heat Mass Transf. 2016, 92, 628–638. [Google Scholar] [CrossRef]
- Pan, J.; Hu, S.; Yang, L.; Chen, S. Numerical analysis of the heat transfer and material flow during keyhole plasma arc welding using a fully coupled tungsten–plasma–anode model. Acta Mater. 2016, 118, 221–229. [Google Scholar] [CrossRef]
- Tanaka, M.; Lowke, J.J. Predictions of weld pool profiles using plasma physics. J. Phys. D Appl. Phys. 2007, 40, R1. [Google Scholar] [CrossRef]
- van Anh, N.; Tashiro, S.; Manh, N.H.; van Hanh, B.; Tanaka, M. Effect of the eddies formed inside a weld pool on welding defects during plasma keyhole arc welding. J. Manuf. Process. 2020, 59, 649–657. [Google Scholar]
- Van Anh, N.; Tashiro, S.; Van Hanh, B.; Tanaka, M. Experimental investigation on the weld pool formation process in plasma keyhole arc welding. J. Phys. D Appl. Phys. 2018, 51, 015204. [Google Scholar] [CrossRef]
- Van Anh, N.; Wu, D.S.; Tashiro, S.; Tanaka, M. Undercut formation mechanism in the keyhole plasma arc welding. Weld. J. 2019, 98, 204–212. [Google Scholar]
- Norman, P.M.; Karlsson, J.; Kaplan, A.F.H. Mechanisms Forming Undercuts during Laser Hybrid Arc Welding. Phys. Procedia 2011, 12, 201–207. [Google Scholar] [CrossRef] [Green Version]
- Zong, R.; Chen, J.; Wu, C.S.; Chen, M.A. Undercutting Formation Mechanism in Gas Metal Arc Welding. Weld. J. 2016, 95, 174–184. [Google Scholar]
- Abbasi, Z.; Yuhas, D.; Zhang, L.; Basantes, A.-D.-C.; Tehrani, N.N.; Ozevin, D.; Indacochea, E. The Detection of Burn-Through Weld Defects Using Noncontact Ultrasonics. Materials 2018, 11, 128. [Google Scholar] [CrossRef] [PubMed] [Green Version]


| Bead side | (a) 80 A | (b) 120 A | (c) 160 A |
| Bead profile | |||
| Upper side | 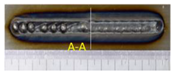 | 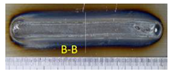 | 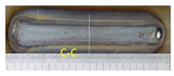 |
| Back side | 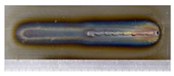 | 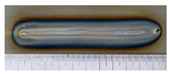 | 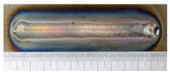 |
| (A-A) cross-section | (B-B) cross-section | (C-C) cross-section | |
| Upper side | 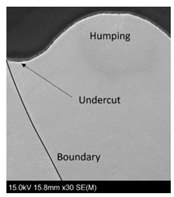 | 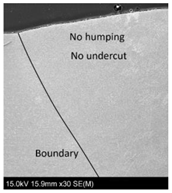 |  |
| Back side | 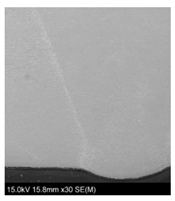 |  |  |
Publisher’s Note: MDPI stays neutral with regard to jurisdictional claims in published maps and institutional affiliations. |
© 2021 by the authors. Licensee MDPI, Basel, Switzerland. This article is an open access article distributed under the terms and conditions of the Creative Commons Attribution (CC BY) license (https://creativecommons.org/licenses/by/4.0/).
Share and Cite
Nguyen, H.L.; Van Nguyen, A.; Duy, H.L.; Nguyen, T.-H.; Tashiro, S.; Tanaka, M. Relationship among Welding Defects with Convection and Material Flow Dynamic Considering Principal Forces in Plasma Arc Welding. Metals 2021, 11, 1444. https://doi.org/10.3390/met11091444
Nguyen HL, Van Nguyen A, Duy HL, Nguyen T-H, Tashiro S, Tanaka M. Relationship among Welding Defects with Convection and Material Flow Dynamic Considering Principal Forces in Plasma Arc Welding. Metals. 2021; 11(9):1444. https://doi.org/10.3390/met11091444
Chicago/Turabian StyleNguyen, Huu Loc, Anh Van Nguyen, Han Le Duy, Thanh-Hai Nguyen, Shinichi Tashiro, and Manabu Tanaka. 2021. "Relationship among Welding Defects with Convection and Material Flow Dynamic Considering Principal Forces in Plasma Arc Welding" Metals 11, no. 9: 1444. https://doi.org/10.3390/met11091444