
Self-Induced Internal Corrosion Stress Transgranular Cracking in Gradient-Structural Ploycrystalline Materials at High Temperature


Abstract
:1. Introduction
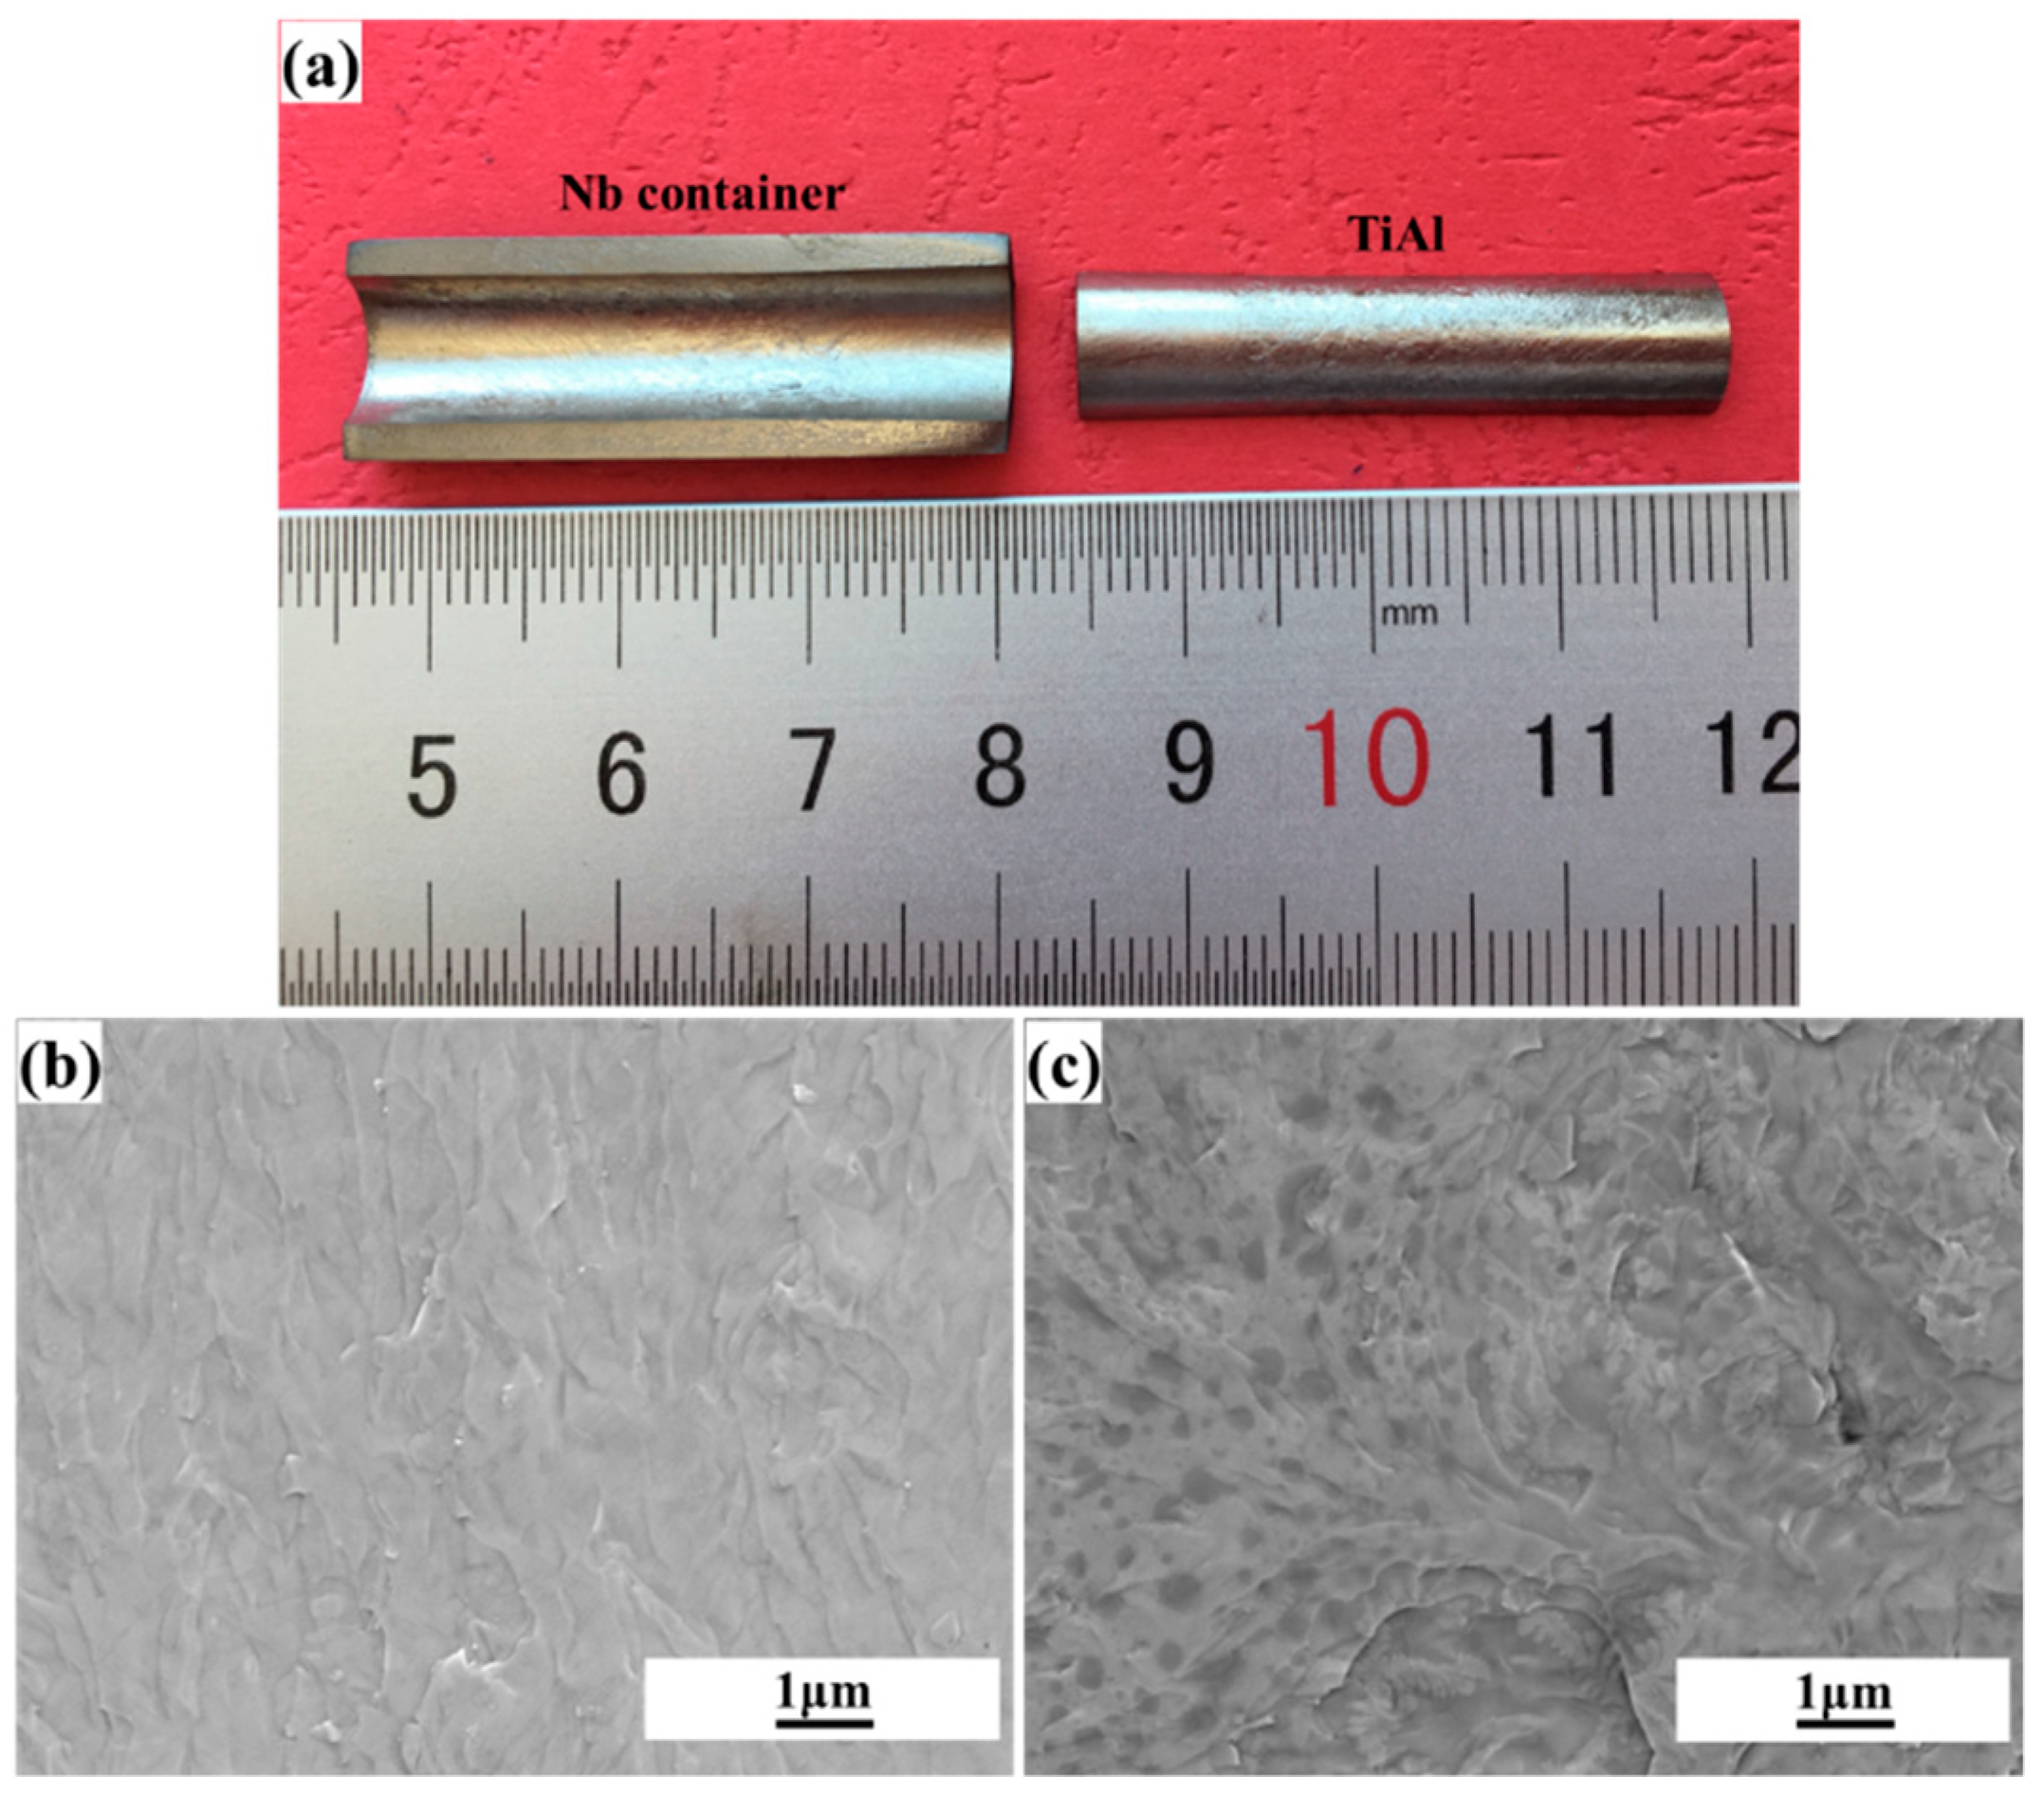
2. Experiment
3. Results
4. Discussion
4.1. The Source of the Force
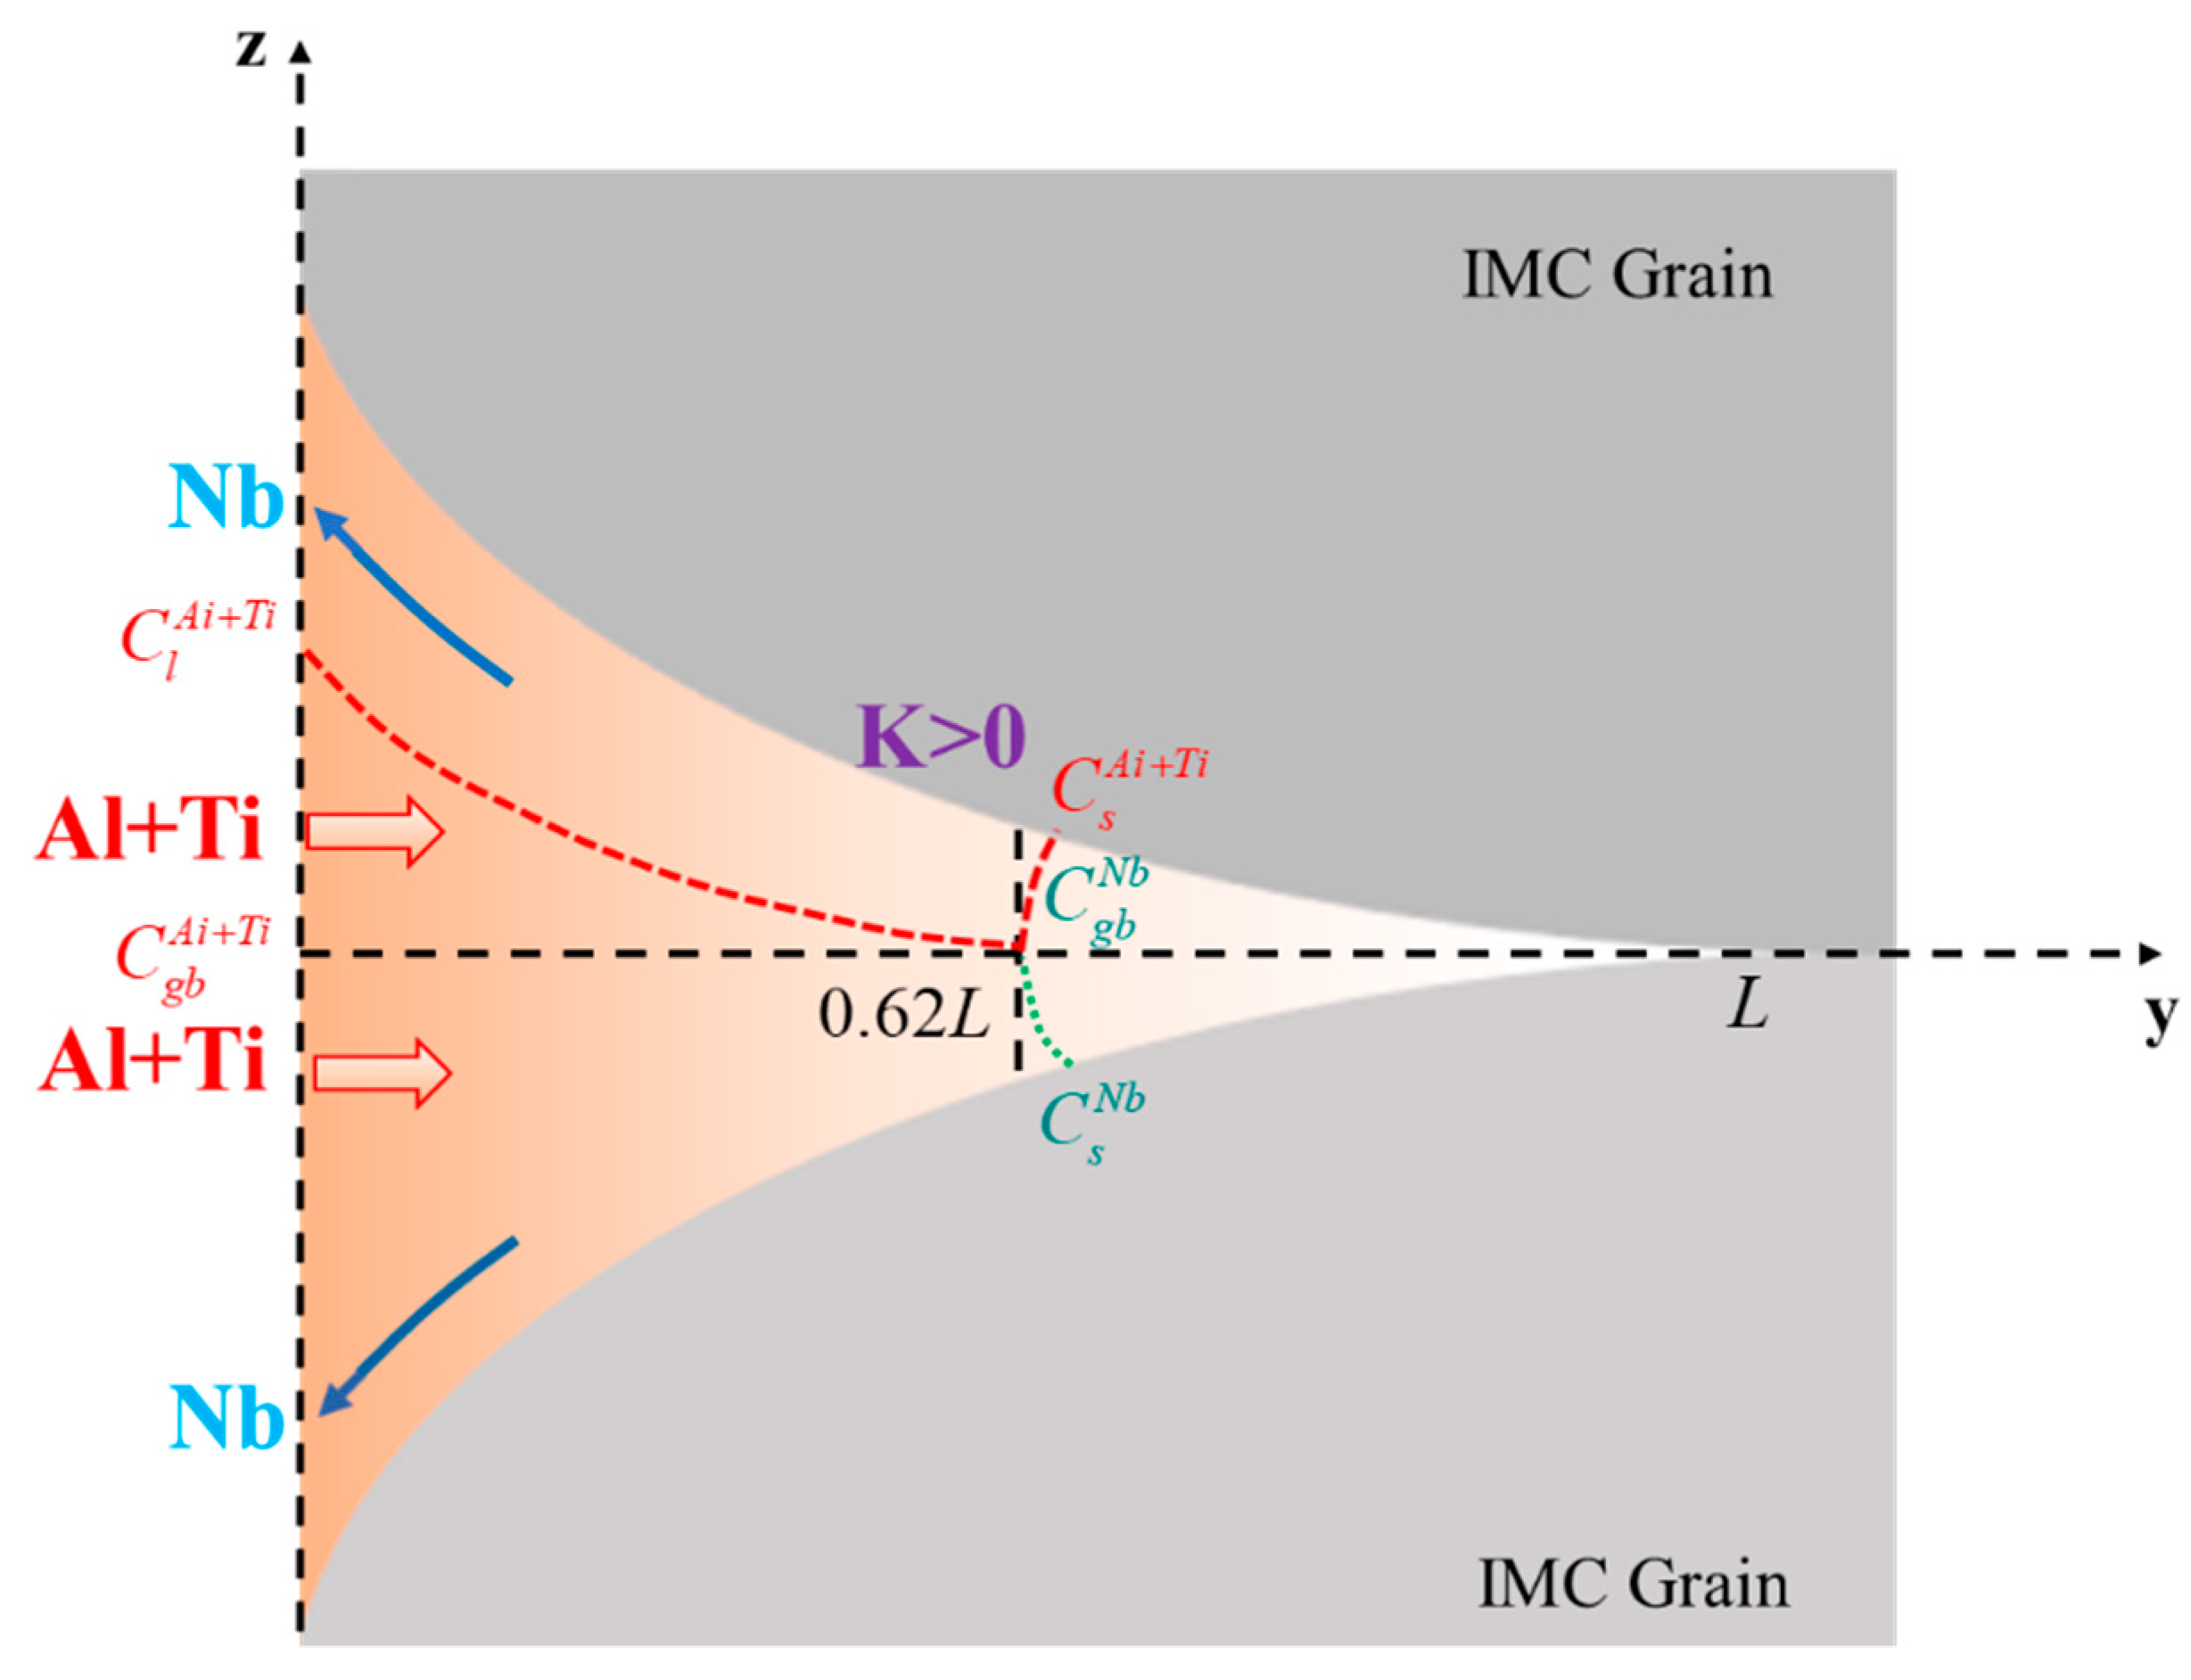
4.2. Crack Mechanism Coupling with Diffusion in Dynamic Grooves
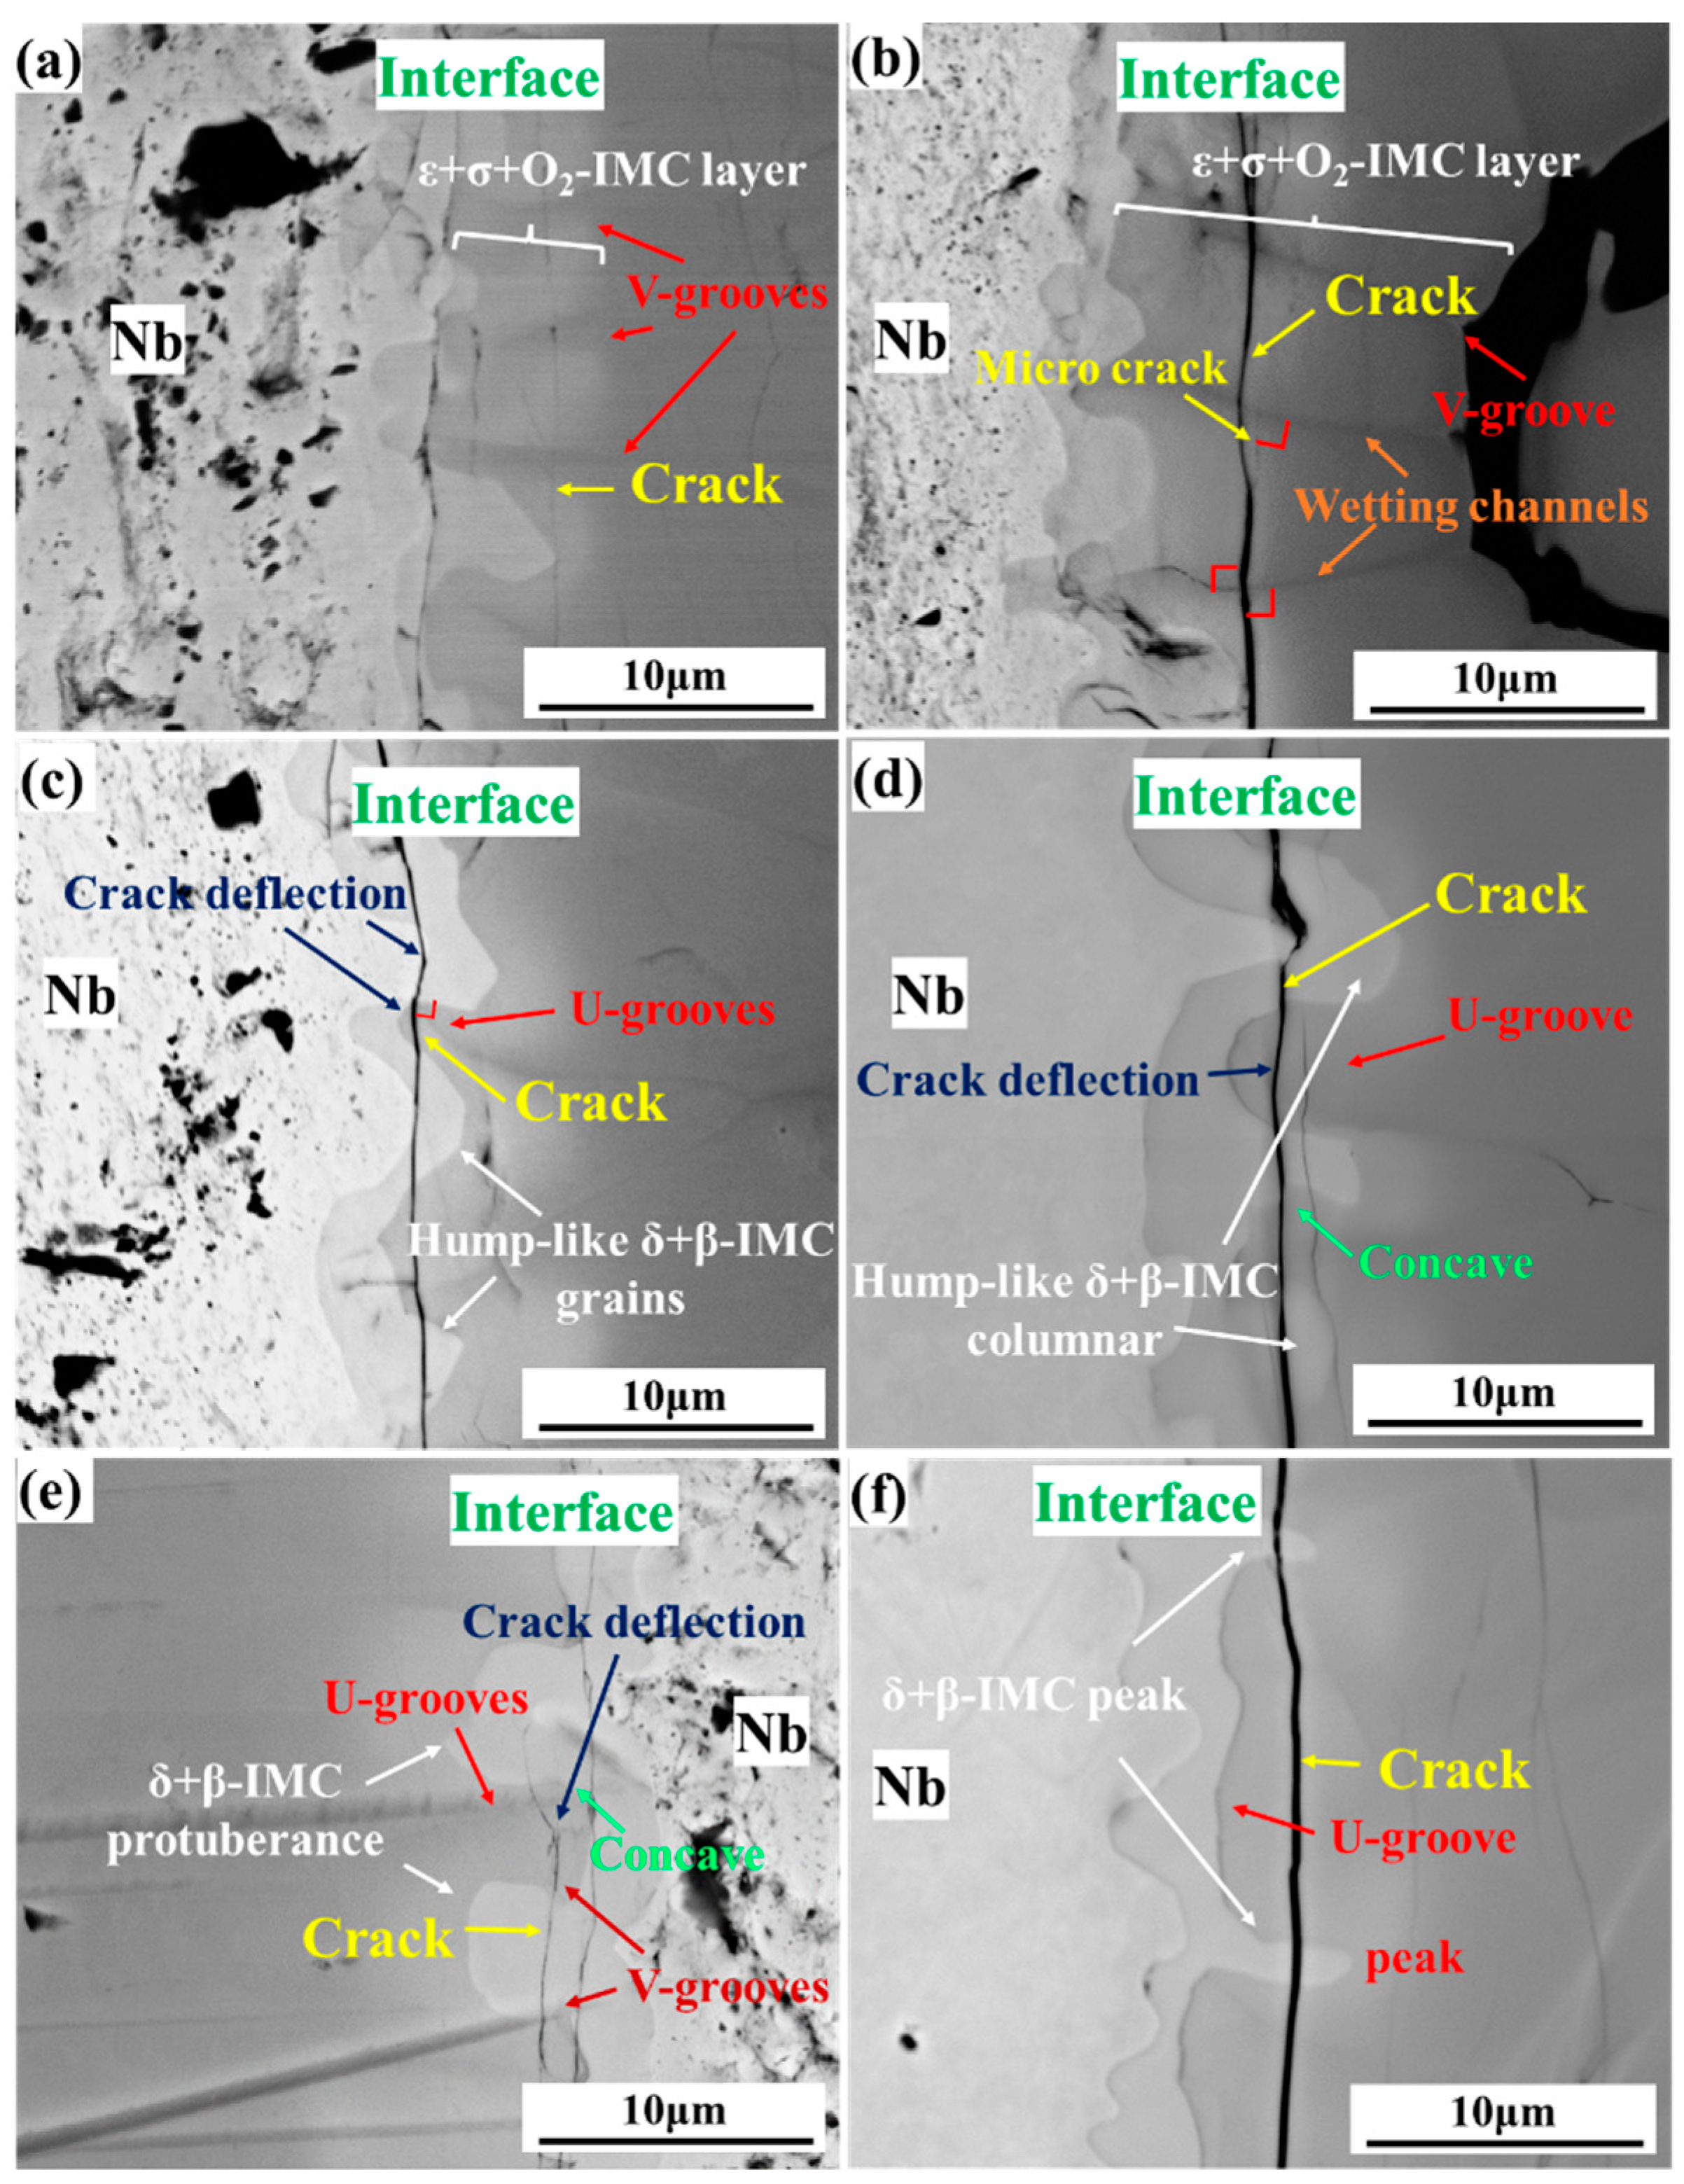
4.2.1. Mechanical Interaction and Crack Mechanism in V-Grooves
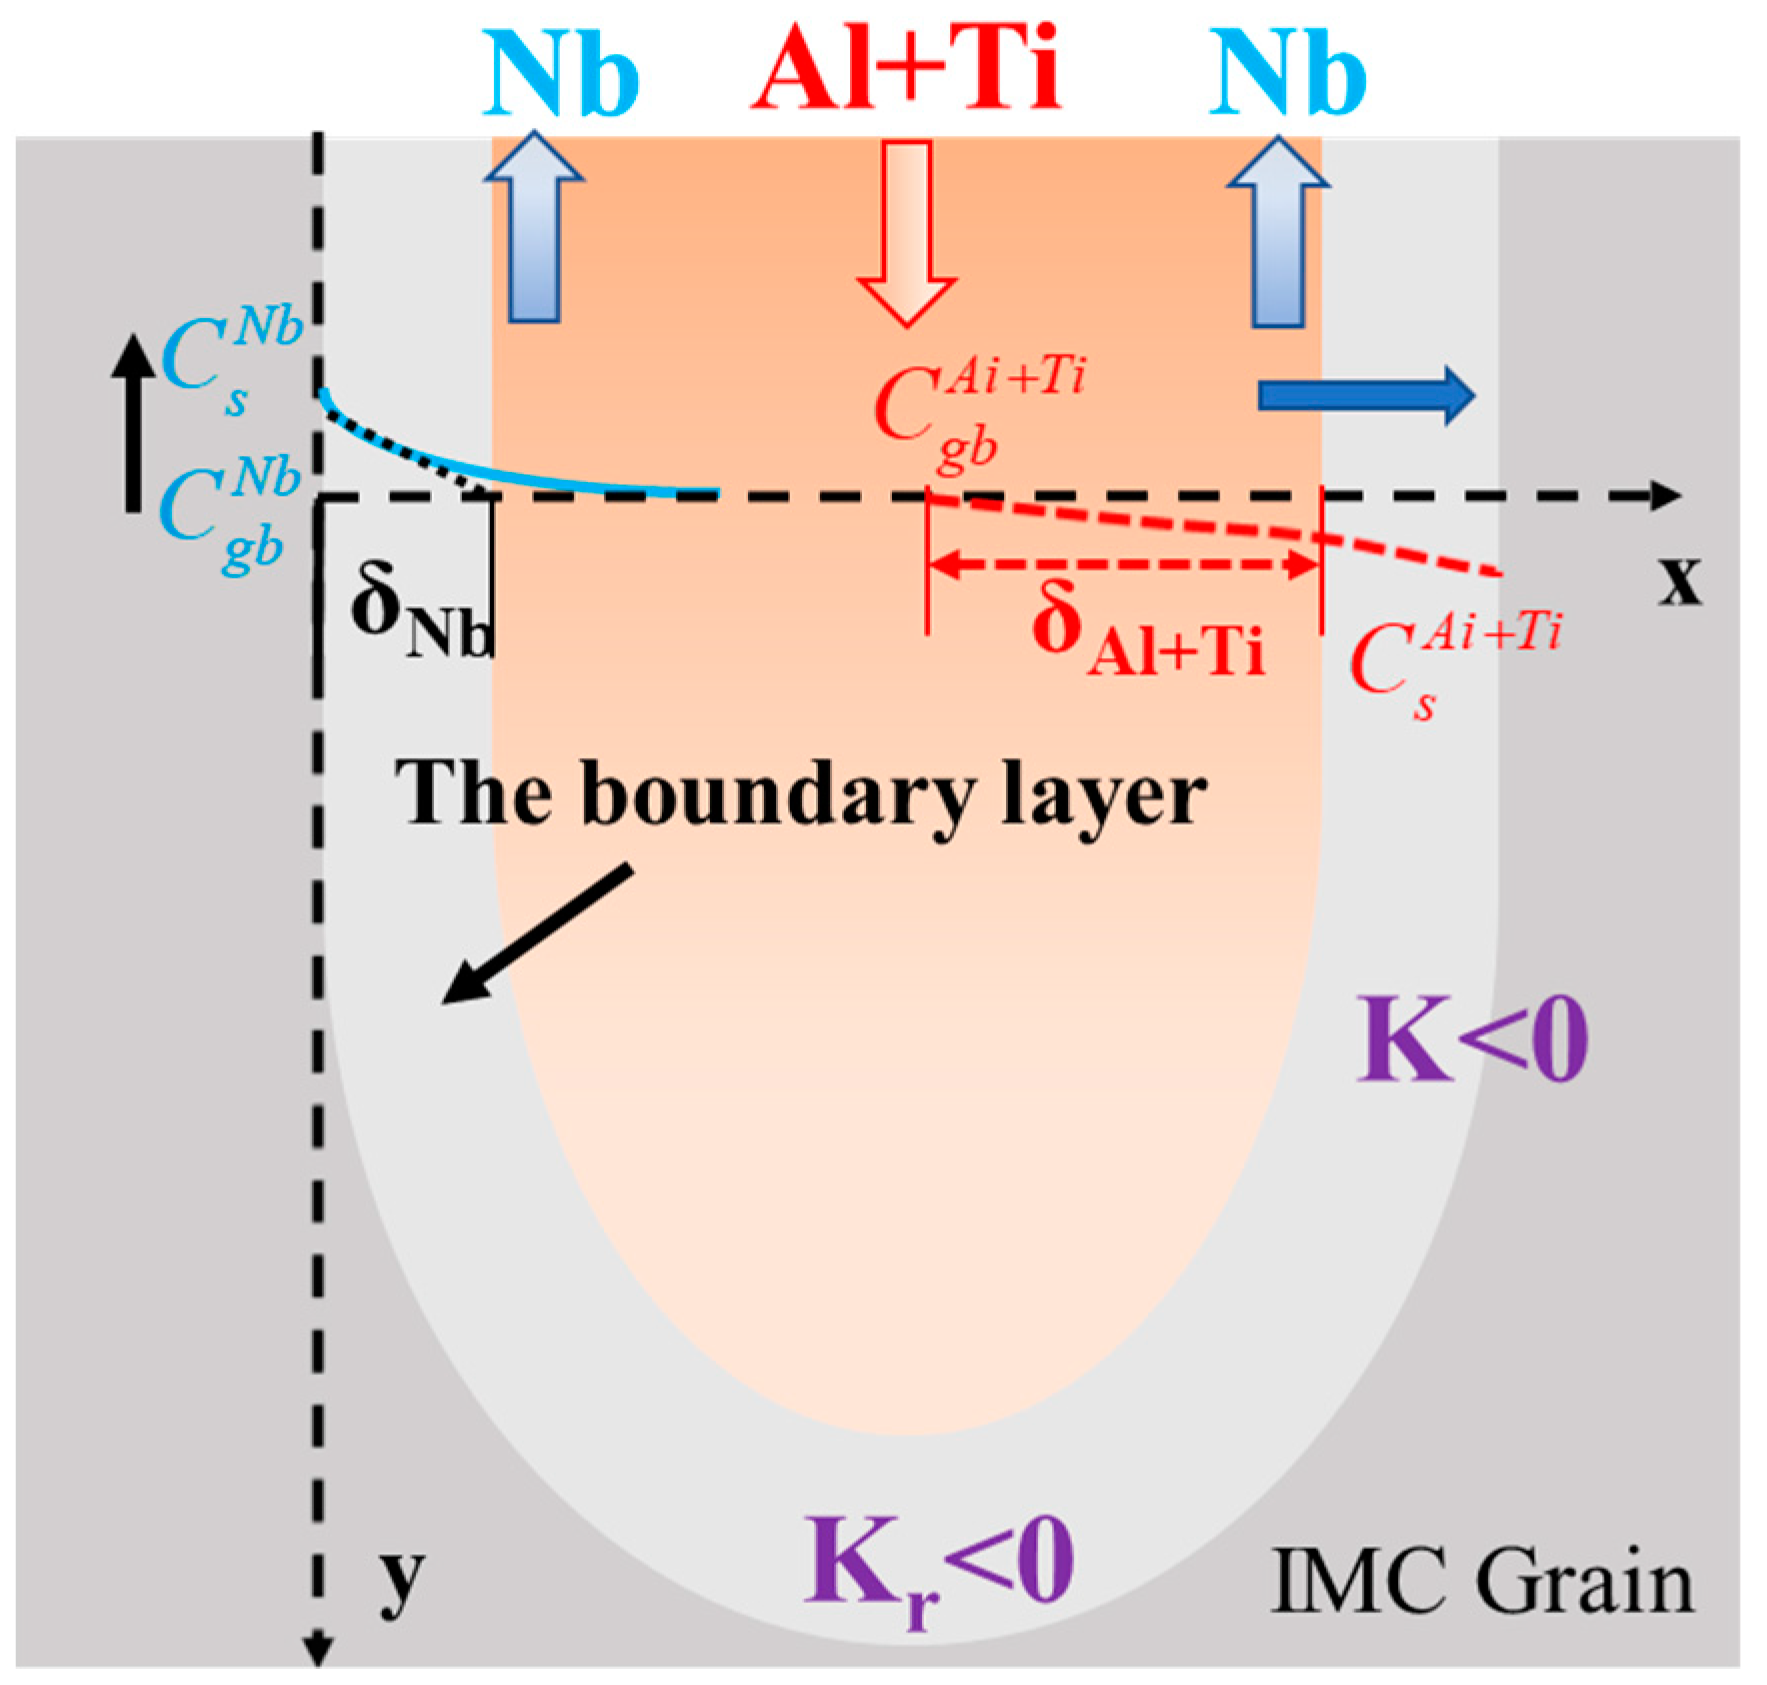
4.2.2. Mechanical Interaction and Crack Mechanism in U-Grooves
4.3. Passivation and Crack Prediction
5. Crack Mechanism Map
6. Summary
Author Contributions
Funding
Data Availability Statement
Conflicts of Interest
References
- Yacobi, B.; Martin, S.; Davis, K.; Hudson, A.; Hubert, M. Adhesive bonding in microelectronics and photonics. J. Appl. Phys. 2002, 91, 6227–6262. [Google Scholar] [CrossRef]
- Kim, J.; Hardy, J.; Weil, K. Effect of CuO content on the wetting behavior and mechanical properties of a Ag-CuO braze for ceramic joining. J. Am. Ceram. Soc. 2005, 88, 2521–2527. [Google Scholar] [CrossRef]
- Gusak, A.M.; Tu, K.N.; Chen, C. Extremely rapid grain growth in scallop-type Cu6Sn5 during solid-liquid interdiffusion reactions in micro-bump solder joints. Scr. Mater. 2020, 179, 45–48. [Google Scholar] [CrossRef]
- Lu, N.; Lei, Z.; Hu, K.; Yu, X.; Li, P.; Bi, J.; Wu, S.; Chen, Y. Hot cracking behavior and mechanism of a third-generation Ni-based s ingle-crystal superalloy during directed energy deposition. Addit. Manuf. 2020, 34, 101228. [Google Scholar]
- Asl, K.M.; Luo, J. Impurity effects on the intergranular liquid bismuth penetration in polycrystalline nickel. Acta Mater. 2012, 60, 149–165. [Google Scholar] [CrossRef]
- Marié, N.; Wolski, K.; Biscondi, M. Grain boundary penetration of nickel by liquid bismuth as a film of nanometric thickness. Scr. Mater. 2000, 43, 943–949. [Google Scholar] [CrossRef]
- Zhang, Z.G.; Teng, X.; Mao, Y.L. Improvement of Oxidation Resistance of γ-TiAl at 900 and 1000 °C Through Hot-dip Aluminizing. Oxid. Met. 2010, 73, 455–466. [Google Scholar] [CrossRef]
- López, G.A.; Mittemeijer, E.J.; Straumal, B.B. Grain boundary wetting by a solid phase; microstructural development in a Zn-5 wt% Al alloy. Acta Mater. 2004, 52, 4537–4545. [Google Scholar] [CrossRef]
- Hoyt, J.; Asta, M.; Haxhimali, T.; Karma, A.; Napolitano, R.E.; Trivedi, R.; Laird, B.; Morris, J. Crystal-Melt Interfaces and Solidification Morphologies in Metals and Alloys. MRS Bull. 2004, 29, 935–939. [Google Scholar] [CrossRef]
- Kelton, K.; Greer, A.; Herlach, D.; Holland-Moritz, D. The Influence of Order on the Nucleation Barrier. MRS Bull. 2004, 29, 940–944. [Google Scholar] [CrossRef]
- Levi, G.; Kaplan, W.D.; Bamberger, M. Interfacial phenomena and microstructure evolution during solidification of binary and ternary Al-Mg-Si alloys cast with titanium carbonitride. Mater. Sci. Eng. A 2002, 326, 288–296. [Google Scholar] [CrossRef]
- Roy, S.; Suwas, S. Orientation dependent spheroidization response and macro-zone formation during sub β-transus processing of Ti-6Al-4V alloy. Acta Mater. 2017, 134, 283–301. [Google Scholar] [CrossRef]
- Gorse, D.; Boutard, J.L. Structural materials for hybrid systems: A challenge in metallurgy—Paris, France—October 29-31. 2001—Preface. J. de Phys. IV 2002, 12, III–VI. [Google Scholar]
- Gao, H.; Zhang, L.; Nix, W.D.; Thompson, C.V.; Arzt, E. Crack-like grain-boundary diffusion wedges in thin metal films. Acta Mater. 1999, 47, 2865–2878. [Google Scholar] [CrossRef]
- Qu, W.; Li, S.; Chen, Z.; Li, C.; Pei, Y.; Gong, S. Hot corrosion behavior and wettability of calcium-magnesium-alumina-silicate (CMAS) on LaTi2Al9O19 ceramic. Corros. Sci. 2020, 162, 108199. [Google Scholar] [CrossRef]
- Zou, Y.; Huang, A.; Wang, R.; Fu, L.; Gu, H.; Li, G. Slag corrosion-resistance mechanism of lightweight magnesia-based refractories under a static magnetic field. Corros. Sci. 2020, 167, 108517. [Google Scholar] [CrossRef]
- Zhang, J.; Li, N. Analytical Solution on the Transient Corrosion/Precipitation in Non-Isothermal Liquid Lead Bismuth Eutectic Flow Loops. Corrosion 2004, 60, 331–341. [Google Scholar] [CrossRef]
- Joseph, B.; Picat, M.; Barbier, F. Liquid metal embrittlement: A state-of-the-art appraisal. Eur. Phys. J. Appl. Phys. 1999, 5, 19–31. [Google Scholar] [CrossRef]
- Turnbull, A. Stress Corrosion Cracking in Metals-Mechanisms, Reference Module in Materials Science and Materials Engineering; Elsevier: Amsterdam, The Netherlands, 2016. [Google Scholar]
- Nam, H.S.; Srolovitz, D.J. Effect of material properties on liquid metal embrittlement in the Al-Ga system. Acta Mater. 2009, 57, 1546–1553. [Google Scholar] [CrossRef]
- Naderi, M.; Peterlechner, M.; Schafler, E.; Divinski, S.V.; Wilde, G. Kinetic, volumetric and structural effects induced by liquid Ga penetration into ultrafine grained Al. Acta Mater. 2015, 99, 196–205. [Google Scholar] [CrossRef]
- Apikhtina, I.; Gulevskii, S.; Dolgopolov, N.; Petelin, A.; Rakov, S.; Rodin, A. Crack Formation Induced by Boundary Wetting. Defect Diffus. Forum 2005, 237–240, 855–860. [Google Scholar] [CrossRef]
- Luo, J.; Cheng, H.; Asl, K.M.; Kiely, C.J.; Harmer, M.P. The Role of a Bilayer Interfacial Phase on Liquid Metal Embrittlement. Science 2011, 333, 1730. [Google Scholar] [CrossRef] [PubMed]
- Joseph, S.; Lindley, T.C.; Dye, D.; Saunders, E.A. The mechanisms of hot salt stress corrosion cracking in titanium alloy Ti-6Al-2Sn-4Zr-6Mo. Corros. Sci. 2018, 134, 169–178. [Google Scholar] [CrossRef]
- Seitz, F. On the porosity observed in the Kirkendall effect. Acta Metall. 1953, 1, 355–369. [Google Scholar] [CrossRef]
- Lin, Z.J.; Li, M.S.; Wang, J.Y.; Zhou, Y.C. High-temperature oxidation and hot corrosion of Cr2AlC. Acta Mater. 2007, 55, 6182–6191. [Google Scholar] [CrossRef]
- Liu, R.; Cui, Y.; Liu, L.; Zhang, B.; Wang, F. A primary study of the effect of hydrostatic pressure on stress corrosion cracking of Ti-6Al-4V alloy in 3.5% NaCl solution. Corros. Sci. 2020, 165, 108402. [Google Scholar] [CrossRef]
- Liao, Y.; Zhang, B.; Chen, M.; Feng, M.; Wang, J.; Zhu, S.; Wang, F. Self-healing metal-enamel composite coating and its protection for TiAl alloy against oxidation under thermal shock in NaCl solution. Corros. Sci. 2020, 167, 108526. [Google Scholar] [CrossRef]
- Turnbull, A. Modelling of environment assisted cracking. Corros. Sci. 1993, 34, 921–960. [Google Scholar] [CrossRef]
- Xu, G.; Wang, K.; Dong, X.; Jiang, H.; Wang, Q.; Ye, B.; Ding, W. Multiscale corrosion-resistance mechanisms of novel ferrous alloys in dynamic aluminum melts. Corros. Sci. 2020, 163, 108276. [Google Scholar] [CrossRef]
- Tang, N.; Li, Y.P.; Kurosu, S.; Koizumi, Y.; Matsumoto, H.; Chiba, A. Interfacial reactions of solid Co and solid Fe with liquid Al. Corros. Sci. 2012, 60, 32–37. [Google Scholar] [CrossRef]
- Tunthawiroon, P.; Li, Y.; Chiba, A. Influences of alloyed Si on the corrosion resistance of Co-Cr-Mo alloy to molten Al by iso-thermal oxidation in air. Corros. Sci. 2015, 100, 428–434. [Google Scholar] [CrossRef]
- Springer, H.; Kostka, A.; Payton, E.J.; Raabe, D.; Kaysser-Pyzalla, A.; Eggeler, G. On the formation and growth of intermetallic phases during interdiffusion between low-carbon steel and aluminum alloys. Acta Mater. 2011, 59, 1586–1600. [Google Scholar] [CrossRef]
- Azimaee, H.; Sarfaraz, M.; Mirjalili, M.; Aminian, K. Effect of silicon and manganese on the kinetics and morphology of the intermetallic layer growth during hot-dip aluminizing. Surf. Coat. Technol. 2019, 357, 483–496. [Google Scholar] [CrossRef]
- Shunk, F.A.; Warke, W.R. Specificity as an aspect of liquid metal embrittlement. Scr. Metall. 1974, 8, 519–526. [Google Scholar] [CrossRef]
- Pu, C.; Gao, Y.; Wang, Y.; Sham, T.L. Diffusion-coupled cohesive interface simulations of stress corrosion intergranular cracking in polycrystalline materials. Acta Mater. 2017, 136, 21–31. [Google Scholar] [CrossRef]
- Bika, D.; McMahon, C.J. A model for dynamic embrittlement. Acta Metall. Et Mater. 1995, 43, 1909–1916. [Google Scholar] [CrossRef]
- Klinger, L.; Rabkin, E. The effect of stress on grain boundary interdiffusion in a semi-infinite bicrystal. Acta Mater. 2007, 55, 4689–4698. [Google Scholar] [CrossRef]
- Ludwig, W.; Pereiro-López, E.; Bellet, D. In situ investigation of liquid Ga penetration in Al bicrystal grain boundaries: Grain boundary wetting or liquid metal embrittlement? Acta Mater. 2005, 53, 151–162. [Google Scholar] [CrossRef]
- Dong, X.; Feng, X.; Hwang, K.C. Stress-diffusion interaction during oxidation at high temperature. Chem. Phys. Lett. 2014, 614, 95–98. [Google Scholar] [CrossRef]
- Padture, N.; Gell, M.; Jordan, E. TBCs for Gas-Turbine Engine Applications. Science 2002, 296, 280–284. [Google Scholar] [CrossRef]
- Drexler, J.M.; Gledhill, A.D.; Shinoda, K.; Vasiliev, A.L.; Reddy, K.M.; Sampath, S.; Padture, N.P. Jet Engine Coatings: Jet Engine Coatings for Resisting Volcanic Ash Damage (Adv. Mater. 21/2011). Adv. Mater. 2011, 23, 2388. [Google Scholar] [CrossRef]
- Nichols, H.; Rostoker, W. On the mechanism of crack initiation in embrittlement by liquid metals. Acta Metall. 1961, 9, 504–509. [Google Scholar] [CrossRef]
- Chuang, T.J. A Diffusive Crack-Growth Model for Creep Fracture. J. Am. Ceram. Soc. 1982, 65, 93–103. [Google Scholar] [CrossRef]
- Vitek, V. A theory of diffusion controlled intergranular creep crack growth. Acta Metall. 1978, 26, 1345–1356. [Google Scholar] [CrossRef]
- Koeller, R.C.; Raj, R. Diffusional relaxation of stress concentration at second phase particles. Acta Metall. 1978, 26, 1551–1558. [Google Scholar] [CrossRef]
- Hugo, R.C.; Hoagland, R.G. In-Situ TEM Observation of Aluminum Embrittlement by Liquid Gallium. Scr. Mater. 1998, 38, 523–529. [Google Scholar] [CrossRef]
- Yan, S.; Qi, Z.; Chen, Y.; Cao, Y.; Zhang, J.; Zheng, G.; Chen, F.; Bian, T.; Chen, G. Interlamellar boundaries govern cracking. Acta Mater. 2021, 215, 117091. [Google Scholar] [CrossRef]
- Chen, K.; Han, J.; Thomas, S.L.; Srolovitz, D.J. Grain boundary shear coupling is not a grain boundary property. Acta Mater. 2019, 167, 241–247. [Google Scholar] [CrossRef] [Green Version]
- Palumbo, G.; King, P.J.; Aust, K.T.; Erb, U.; Lichtenberger, P.C. Grain boundary design and control for intergranular stress-corrosion resistance. Scr. Metall. Et Mater. 1991, 25, 1775–1780. [Google Scholar] [CrossRef]
- Klinger, L.; Rabkin, E. Strains and stresses caused by penetrative wetting of grain boundaries by the liquid phase. Scr. Mater. 2010, 62, 918–923. [Google Scholar] [CrossRef]
- Lei, X.; Wang, X.; Kong, F.; Chen, Y. The high temperature wetting and corrosion mechanism analysis of Nb by TiAl alloy melt. Corros. Sci. 2021, 186, 109316. [Google Scholar] [CrossRef]
- Ainslie, N.; D’Heurle, F.; Wells, O. Coating, Mechanical Constraints, and Pressure Effects on Electromigration. Appl. Phys. Lett. 1972, 20, 173–174. [Google Scholar] [CrossRef]
- Jiran, E.; Thompson, C.V. Capillary instabilities in thin films. J. Electron. Mater. 1990, 19, 1153–1160. [Google Scholar] [CrossRef]
- Trautt, Z.T.; Mishin, Y. Capillary-driven grain boundary motion and grain rotation in a tricrystal: A molecular dynamics study. Acta Mater. 2014, 65, 19–31. [Google Scholar] [CrossRef]
- Bokstein, B.S.; Klinger, L.M.; Apikhtina, I.V. Liquid grooving at grain boundaries. Mater. Sci. Eng. A 1995, 203, 373–376. [Google Scholar] [CrossRef]
- Chatain, D.; Rabkin, E.; Derenne, J.; Bernardini, J. Role of the solid/liquid interface faceting in rapid penetration of a liquid phase along grain boundaries. Acta Mater. 2001, 49, 1123–1128. [Google Scholar] [CrossRef]
- Straumal, B.; Rabkin, E.; Łojkowski, W.; Gust, W.; Shvindlerman, L.S. Pressure influence on the grain boundary wetting phase transition in Fe-Si alloys. Acta Mater. 1997, 45, 1931–1940. [Google Scholar] [CrossRef]
- Kennard, E.H. Kinetic Theory of Gases. McGraw-hill: New York, NY, USA, 1938; Volume 142, pp. 494–495. [Google Scholar] [CrossRef]
- Yost, F.G. Voiding due to thermal stress in narrow conductor lines. Scr. Metall. 1989, 23, 1323–1328. [Google Scholar] [CrossRef]
- Shah, D.M.; Anton, D.L. Evaluation of refractory intermetallics with A15 structure for high temperature structural applications. Mater. Sci. Eng. A 1992, 153, 402–409. [Google Scholar] [CrossRef]
- Pereiro-López, E.; Ludwig, W.; Bellet, D. Discontinuous penetration of liquid Ga into grain boundaries of Al polycrystals. Acta Mater. 2004, 52, 321–332. [Google Scholar] [CrossRef]
- Glickman, E.; Nathan, M. On the Kinetic Mechanism of Grain Boundary Wetting in Metals. J. Appl. Phys. 1999, 85, 3185–3191. [Google Scholar] [CrossRef]
- Jost, W. Diffusion in Solids, Liquids, Gases; Academic: New York, NY, USA, 1952. [Google Scholar]
- Glickman, E.E. Grain Boundary Grooving Accelerated by Local Plasticity as a Possible Mechanism of Liquid Metal Embrittlement. Interface Sci. 2003, 11, 451–459. [Google Scholar] [CrossRef]
- Shabrov, M.N.; Briant, C.L.; Needleman, A.; Kim, S.; Sylven, E.; Sherman, D.H.; Chuzhoy, L. Void nucleation by inclusion cracking. Metall. Mater. Trans. A 2004, 35, 1745–1755. [Google Scholar] [CrossRef]


| Material | Form | Chemical Composition (wt%) | ||||||||||||
|---|---|---|---|---|---|---|---|---|---|---|---|---|---|---|
| Ti (bala.) | Sponge | Fe | Si | Cl | C | N | O | Mn | Mg | H | ||||
| 0.015 | 0.009 | 0.047 | 0.009 | 0.005 | 0.047 | 0.003 | 0.004 | 0.001 | ||||||
| Al(bala.) | Lump | Fe | Si | Ga | Cu | Mg | Zn | |||||||
| 0.1 | 0.03 | 0.02 | 0 | 0 | 0.01 | |||||||||
| Nb a (bala.) | Tube | C | N | H | O | Fe | Si | Mo | W | Ti | Ta | Ni | Hf | Zr |
| 8 | 49 | 3 | 110 | 15 | 30 | 32 | 140 | <5 | 500 | <5 | 20 | 32 | ||
| Phase | Chemistry Formula |
|---|---|
| δ | Nb3Al |
| σ | Nb2Al |
| ε | (Ti1-xNbx)Al3, TiAl3(h), NbAl3 |
| O2 | Ti2NbAl |
| β | (Nb)ss |
Publisher’s Note: MDPI stays neutral with regard to jurisdictional claims in published maps and institutional affiliations. |
© 2021 by the authors. Licensee MDPI, Basel, Switzerland. This article is an open access article distributed under the terms and conditions of the Creative Commons Attribution (CC BY) license (https://creativecommons.org/licenses/by/4.0/).
Share and Cite
Lei, X.; Wang, X.; Kong, F.; Zhou, H.; Chen, Y. Self-Induced Internal Corrosion Stress Transgranular Cracking in Gradient-Structural Ploycrystalline Materials at High Temperature. Metals 2021, 11, 1465. https://doi.org/10.3390/met11091465
Lei X, Wang X, Kong F, Zhou H, Chen Y. Self-Induced Internal Corrosion Stress Transgranular Cracking in Gradient-Structural Ploycrystalline Materials at High Temperature. Metals. 2021; 11(9):1465. https://doi.org/10.3390/met11091465
Chicago/Turabian StyleLei, Xianjun, Xiaopeng Wang, Fantao Kong, Haitao Zhou, and Yuyong Chen. 2021. "Self-Induced Internal Corrosion Stress Transgranular Cracking in Gradient-Structural Ploycrystalline Materials at High Temperature" Metals 11, no. 9: 1465. https://doi.org/10.3390/met11091465
APA StyleLei, X., Wang, X., Kong, F., Zhou, H., & Chen, Y. (2021). Self-Induced Internal Corrosion Stress Transgranular Cracking in Gradient-Structural Ploycrystalline Materials at High Temperature. Metals, 11(9), 1465. https://doi.org/10.3390/met11091465