Abstract
Multiaxial stress states frequently occur in technical components and, due to the multitude of possible load situations and variations in behaviour of different materials, are to date not fully predictable. This is particularly the case when loads lie in the plastic range, when strain accumulation, hardening and softening play a decisive role for the material reaction. This study therefore aims at adding to the understanding of material behaviour under complex load conditions. Fatigue tests conducted under cyclic torsional angles (5°, 7.5°, 10° and 15°), with superimposed axial static compression loads (250 MPa and 350 MPa), were carried out using smooth specimens at room temperature. A high nitrogen alloyed austenitic stainless steel (nickel free), was employed to determine not only the number of cycles to failure but particularly to aid in the understanding of the mechanical material reaction to the multiaxial stresses as well as modes of crack formation and growth. Experimental test results indicate that strain hardening occurs under the compressive strain, while at the same time cyclic softening is observable in the torsional shear stresses. Furthermore, the cracks’ nature is unusual with multiple branching and presence of cracks perpendicular in direction to the surface cracks, indicative of the varying multiaxial stress states across the samples’ cross section as cross slip is activated in different directions. In addition, it is believed that the static compressive stress facilitated the Stage I (mode II) crack to change direction from the axial direction to a plane perpendicular to the specimen’s axis.
1. Introduction
Conventional uni-axial fatigue tests are very important and have been used for a long time to predict the fatigue life of industrial components, aircraft and car parts, structures, etc. These tests have aided in saving many lives and properties because the structural integrity of components can be determined. However, there are complex situations where the mode of fatigue failure is not so simple. For instance, several stress components can be simultaneously in operation at a point in a material. This leads to either proportional or non-proportional multiaxial stress states. Proportional multiaxial stress state occurs when there is a proportional increase or decrease on one stress with respect to another stress component. For example, when an object is simultaneously subjected to sinusoidal torsion and tension with no phase shift between the two stresses, the shear and normal stress components are then proportional to each other. On the contrary, if there is a phase difference between torsion and tension, there is loss of proportionality and this is generally called non-proportional multiaxial stress state [1]. Non-proportional stress states have a rotation of principal strain and stress axes which of course results to somewhat different material dependent responses and consequently, different fatigue damage modes [2]. Generally, mechanical devices and parts in most situations experience complex fatigue loading conditions that create non-proportional multiaxial stress states at critical points. It has been generally noted that classical fatigue estimation models such as S-N and -N, conventional for uni-axial loading conditions, may be extended further to proportional multiaxial stress states by determination of equivalent stress values such as Von Mises or Tresca stresses because principal stress axes remain unchanged during loading process. For an object subjected to bi-axial loading, the equivalent Von Mises stress is determined using Equation (1) as follows:
where is the amplitude of the normal stress component and is the amplitude of the shear stress component. Unfortunately, this relationship is ineffective in fatigue damage prediction of non-proportional multiaxial loading and would lead to a huge over-prediction of the fatigue life if used [3]. Note that how much non-proportional fatigue damage occurs in an object depends on two factors: the loading paths in operation and the material. Until now, a model of fatigue damage that is able to take both load path dependency and material properties into consideration is still an important and challenging issue that has been insufficiently addressed, even though non-proportional fatigue has been found to be generally more damaging than proportional loading [4,5,6,7,8]. Bearing in mind that there is a continuous interest in cost and weight reduction as well as materials savings while simultaneously having to fulfill stricter product reliability requirements, a deeper understanding of the effect of complex and severe loading conditions on material behaviour is desirable. multiaxial fatigue is typically measured on cruciform sheet specimens subjected to tension-tension loading conditions, or on solid/hollow specimens subjected to tension/compression in addition to torsional stresses [9]. Tension-tension tests on cruciform specimens and tension-torsional tests on solid/hollow bars have widely been studied but compressive-torsional tests are few. Open questions remain for this type of multiaxial fatigue loading especially since many components and structures in daily life experience this combination of loading. In addition, in manufacturing processes such as in forming, a combination of pressure and shear is often used, because compressive stresses suppress the formation of cracks and therefore high strains can be introduced before material failure [10]. Limited attention has been paid to the interaction between pressure and shear stresses. For instance, it is important to determine which fraction of loading is dominating the material failure, i.e., whether shear or pressure stresses. Fatemi and Socie observed that the shear stress on the critical plane often leads to initial cracks and normal stress promotes crack propagation [8]. Forsyth established that un-notched ductile material samples have micro-crack growth along the plane of maximum shear stress characteristic of Mode II (sliding mode), it is then followed by macro-crack growth along the plane of maximum tensile stress typical of Mode I (opening mode) [11]. Furthermore, Zhang and Akid [12] demonstrated that a static tensile stress in a multiaxial loading stimulated the Stage I (mode II) crack to change direction from the longitudinal direction to a plane normal to the axis of the sample in a high strength steel, but this effect was not observed in stainless steel. There is therefore needed to comprehend the mechanisms of crack growth operating in different materials. Močilnik et al. [13] discovered that a positive static tensile stress reduced the fatigue life and a compressive static axial stress was found to significantly enhance the fatigue life of a high strength spring steel. It is believed that the reason for this increase of fatigue life of specimens subjected to compressive-torsion multiaxial stress is because “overloads” or residual stresses counteract crack initiation [14]. However, it is still not clear why an axial compression of specimen occurs although the compressive stress applied is below the yield point of the material [15]. It can be assumed that the specimens experience creep, but this behaviour needs to be investigated more in detail. According to the knowledge of the authors, there is no literature dealing with interaction of static compressive stresses and shear stresses particularly for austenitic stainless steels. Highly interstitial alloyed austenitic stainless steels are a group of steels with a good combination of ductility, high strength and corrosion resistance and are thus used in various sectors such as biomedical engineering, process engineering, automotive industry, etc. It was further established that with increasing the content of interstitially dissolved C+N, the fatigue strength increases, the maximum of which is reached at a C+N content of 0.96% by weight [16]. Due to the multitude of possible load conditions and the complexity of the interpretation of material behaviour, multiaxial fatigue behaviour for many materials is only insufficiently understood. In particular, the effects of multiaxial load on the deformation and damage mechanisms both on macro- and microscopic scale requires further research. In this project, REX 734 (ISO 5832-9, X4CrNiMoN21-9-4, 1.4472) high-nitrogen austenitic stainless steel is subjected to constant compressive stress superimposed on cyclic torsional strains. It is important to highlight that, the works reported here takes a different approach to multiaxial fatigue testing in that while most investigations are carried out using cyclic dynamic tension on one axis in combination with, for example, torsion on another axis. In this work, we employed a static compressive force on one axis in combination with torsion on the other axis. Two different compressive stress states, both in the elastic regime, and five different torsional angles in the plastic regime are applied. The mechanical behaviour and the formation of cracks was recorded and observed, revealing different damage modes for the various loading conditions.
2. Materials and Methods
2.1. Multiaxial Fatigue Tests
The chemical composition of the test material are shown in Table 1, the alloying elements in this material are carefully selected to give the material superior corrosion resistance and a good combination of strength and toughness. In the solution-annealed condition (1050 °C for 45 min and quenching in water), the tensile strength of the material X4CrNiMoN21-9-4 was 903 MPa, the yield strength was 464 MPa and the elongation was 29%.

Table 1.
Chemical composition of the test material [17].
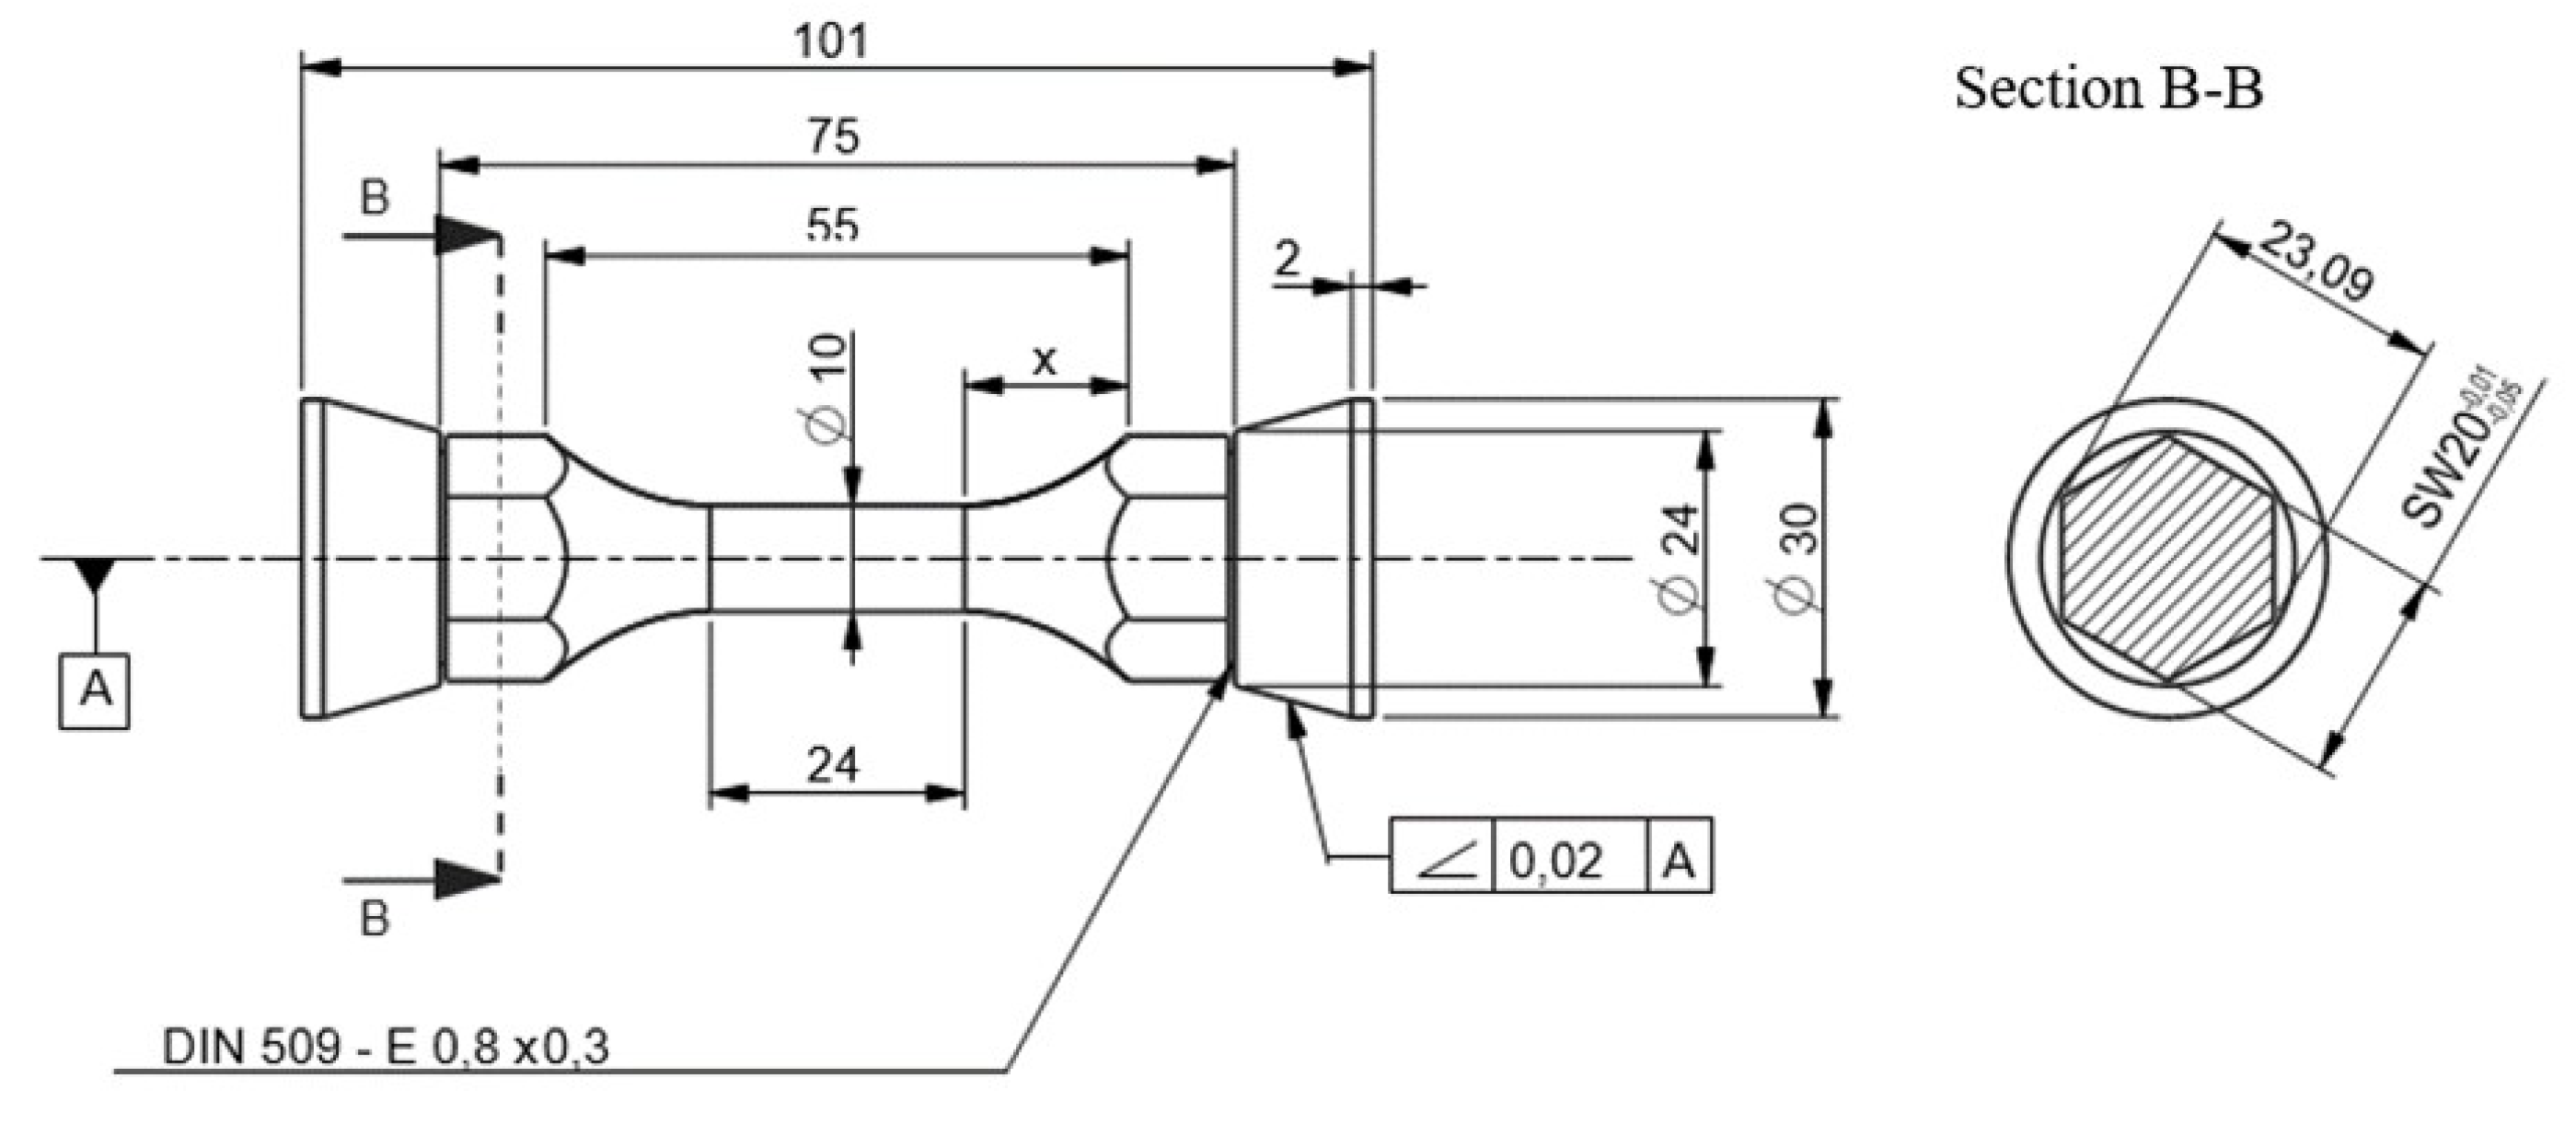
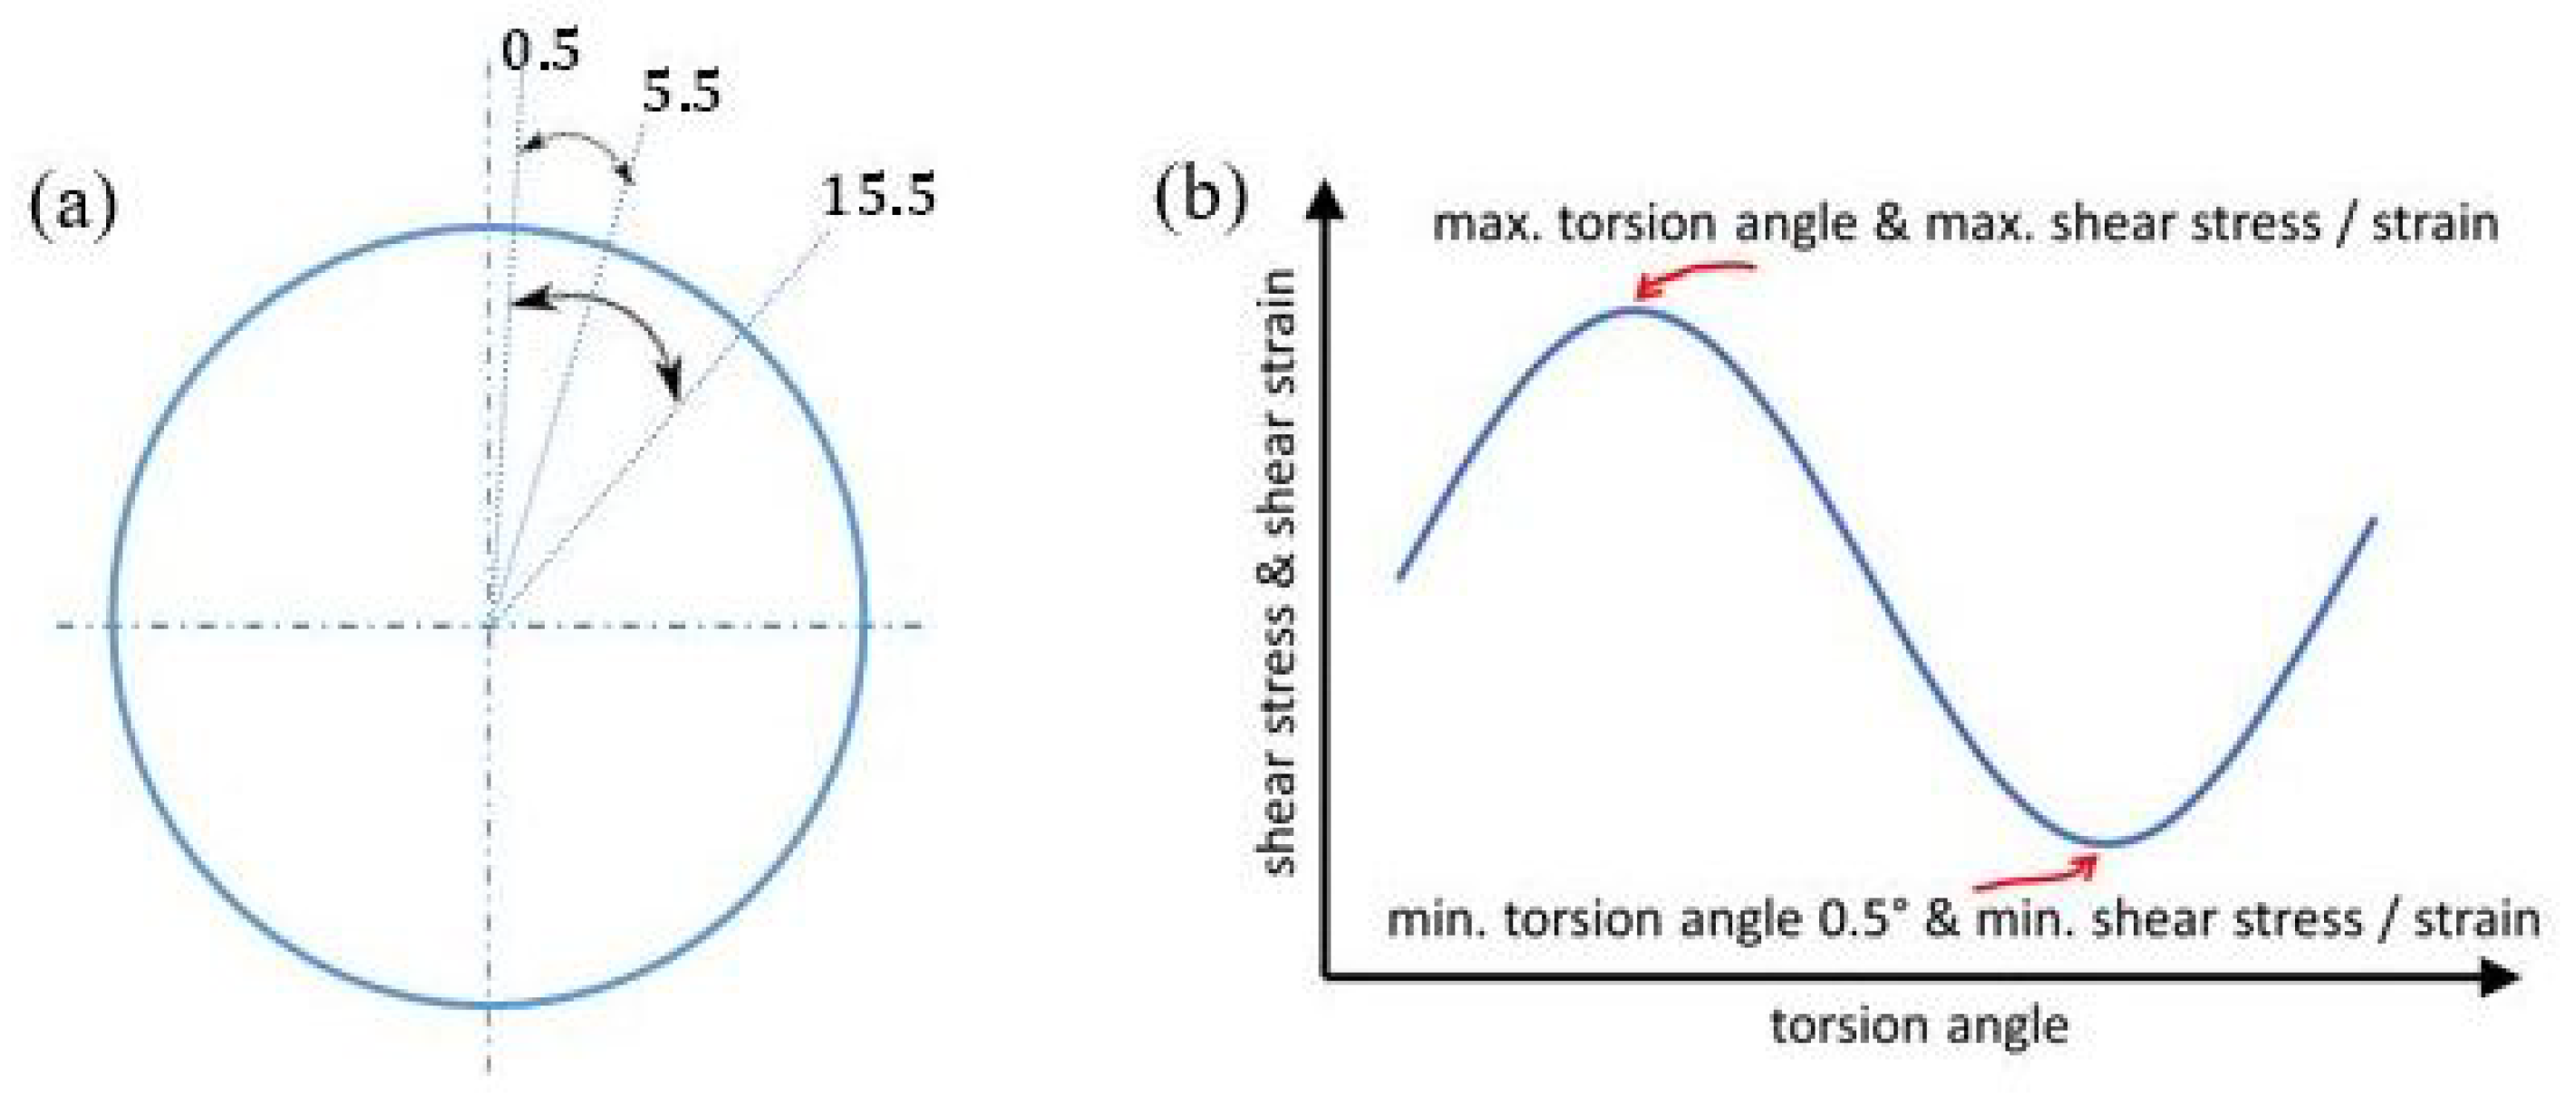
The aim of the experiments was not only to determine the respective number of load cycles to failure, but especially the understanding of the mechanical and microstructural material reaction to this specific load condition. The multiaxial fatigue tests were carried out on cylindrical double-cone samples with 10 mm diameter in the test section (as shown in Figure 1) which are loaded with torsional angles cyclically varied between 0.5°, which is the minimum angle in all experiments, and different maximum values between 5° and 15° (yielding torsional stress ratios R between 0.1 and 0.03). Consequently, the range of torsional cycling lies between 5.5° and 15.5° for the different experimental conditions as shown in Figure 2. The frequency of the torsional load variation was 2 Hz. Additionally, a monotonous constant compressive stress of either 250 or 350 MPa was superimposed. Axial forces applied to reach the predetermined compressive stress are related to the smallest cross section of samples, which is measured at a precision of 10 m after surface polishing, and is approximately 10 mm.

Figure 1.
Dimensions of samples.
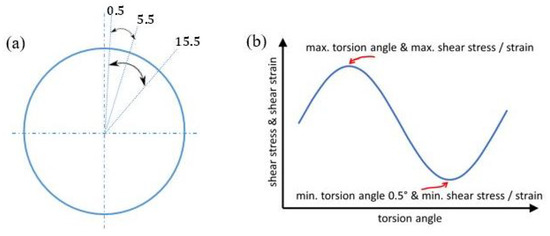
Figure 2.
(a) Schematic depiction of sample cross section in the middle of gauge length, describing the range of angles used. (b) Cycle of applied torsional angle, red arrows mark values for stress and strain presented later.
The specimen design as shown in Figure 1 includes cone shaped heads with an additional hexagonal section. The cone is used to fix the sample in place and apply the compressive stress by a hydraulic ram onto the end faces. The hexagonal section provides an additional fit with the clamping device to ensure the transmission of high torque resulting from high torsional angles, if needed. The specimen thus has no degrees of freedom and therefore cannot move within the clamping. A servo-hydraulic universal testing machine (Bionix 858 from MTS Systems Corp., Eden Prairie, MN, USA) was used for the multiaxial fatigue tests. The upper piston of the machine carries out both axial and torsional movement, allowing for a maximum axial load of 50 kN and maximum torque of 300 Nm. Axial force, torque, rotational angle, and axial displacement are recorded during the experiments by sensors in the machine and are retrieved as Excel workbooks after the experiment. Under combined compression and torsion, final failure of the specimen by fracture is not a suitable criterion for test termination. Cracks forming in the specimen are closed under the applied loads, yielding relative movement and friction between the fracture surfaces. Due to this, a clear drop in torque at the initiation of cracks was also not always observable and did therefore not provide a suitable test termination criterion either. Therefore, the tests were simply terminated when cracks appeared clearly visible. One experiment was terminated after ~65,000 cycles, although no cracks and no significant compressive strain were observed until this loading time. Stopping the machine was necessitated by a hydraulic failure of the machine but the data obtained is still useful since the nature of the softening and hardening behaviour, especially at the beginning of the experiment is displayed. Also, the maximum shear stresses, which are realised at the beginning of the experiment can be determined.
2.2. Metallography
After testing, samples were prepared for microstructural analyses by light microscopy which comprised the grinding, polishing, and etching steps.
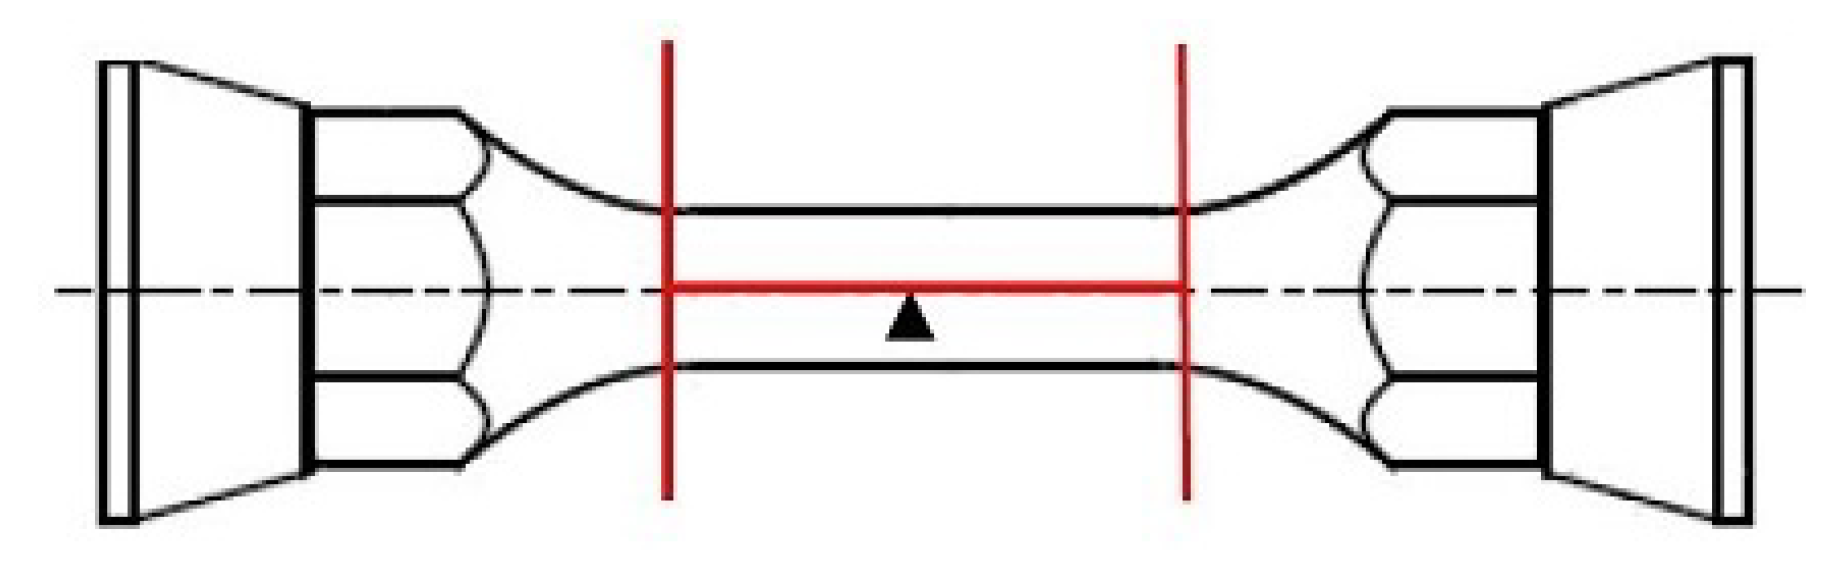
Specimens 30 mm long and 10 mm wide were separated in the longitudinal direction as shown in Figure 3, and then hot-mounted in Technotherm 3000 resin for ease in holding during the grinding and polishing processes. The grinding process was automated with specimen holders for up to six specimens on the Saphir 350 grinding machine (from ATM-GmbH, Blieskastel, Germany ) and comprised two stages of grinding with SiC abrasive papers (from Struers GmbH, Willich, Germany) with grit sizes of 220 and 800. During in each step of grinding the specimens were cooled with water. This process was carried out in steps of two to six minutes at a pressure of 2 bar and at a velocity of 200 rpm until a flat surface was obtained. The polishing process also took place automatically on the RotoPol-31 polishing machine (Struers GmbH, Willich, Germany) in three stages. Polishing agents with reduced grain size were used successively. The grain sizes of the diamond suspension were 6 m and 1 m. A 6 m MD-Dac polishing cloth from Struers GmbH was used in the first step. The second polishing was then performed on MD-Nap polishing cloth (from Struers-GmbH) using 1 m polycrystalline diamond suspension. All polishing steps were carried out by using Lubricant Blue (Struers GmbH) in addition to polycrystalline diamond suspension (from ATM GmbH), except for the last polishing step. The final polishing was done on the polishing cloth MD-Chem (Struers GmbH), with the addition of a suspension of equal parts of deionized water and MasterMet2 (Buehler, IL, USA). Contrast etching of the microstructure was done with electrolytic etching. The procedural framework conditions are set out in Table 2. To improve the conductivity, copper tape was used between the electrode and the sample. After etching, the samples were immersed in deionized water and then ultrasonically cleaned in ethanol. Finally, to remove all liquid residues from the surface, the sample was dried in a hot air stream.
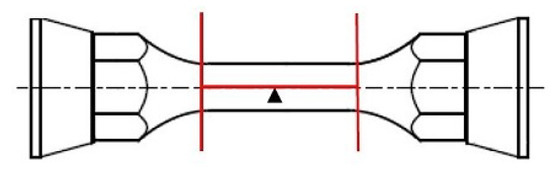
Figure 3.
Cuts for longitudinal grindings.
Table 2.
Parameters for electrolytic etching.
2.3. Finite Element Modelling
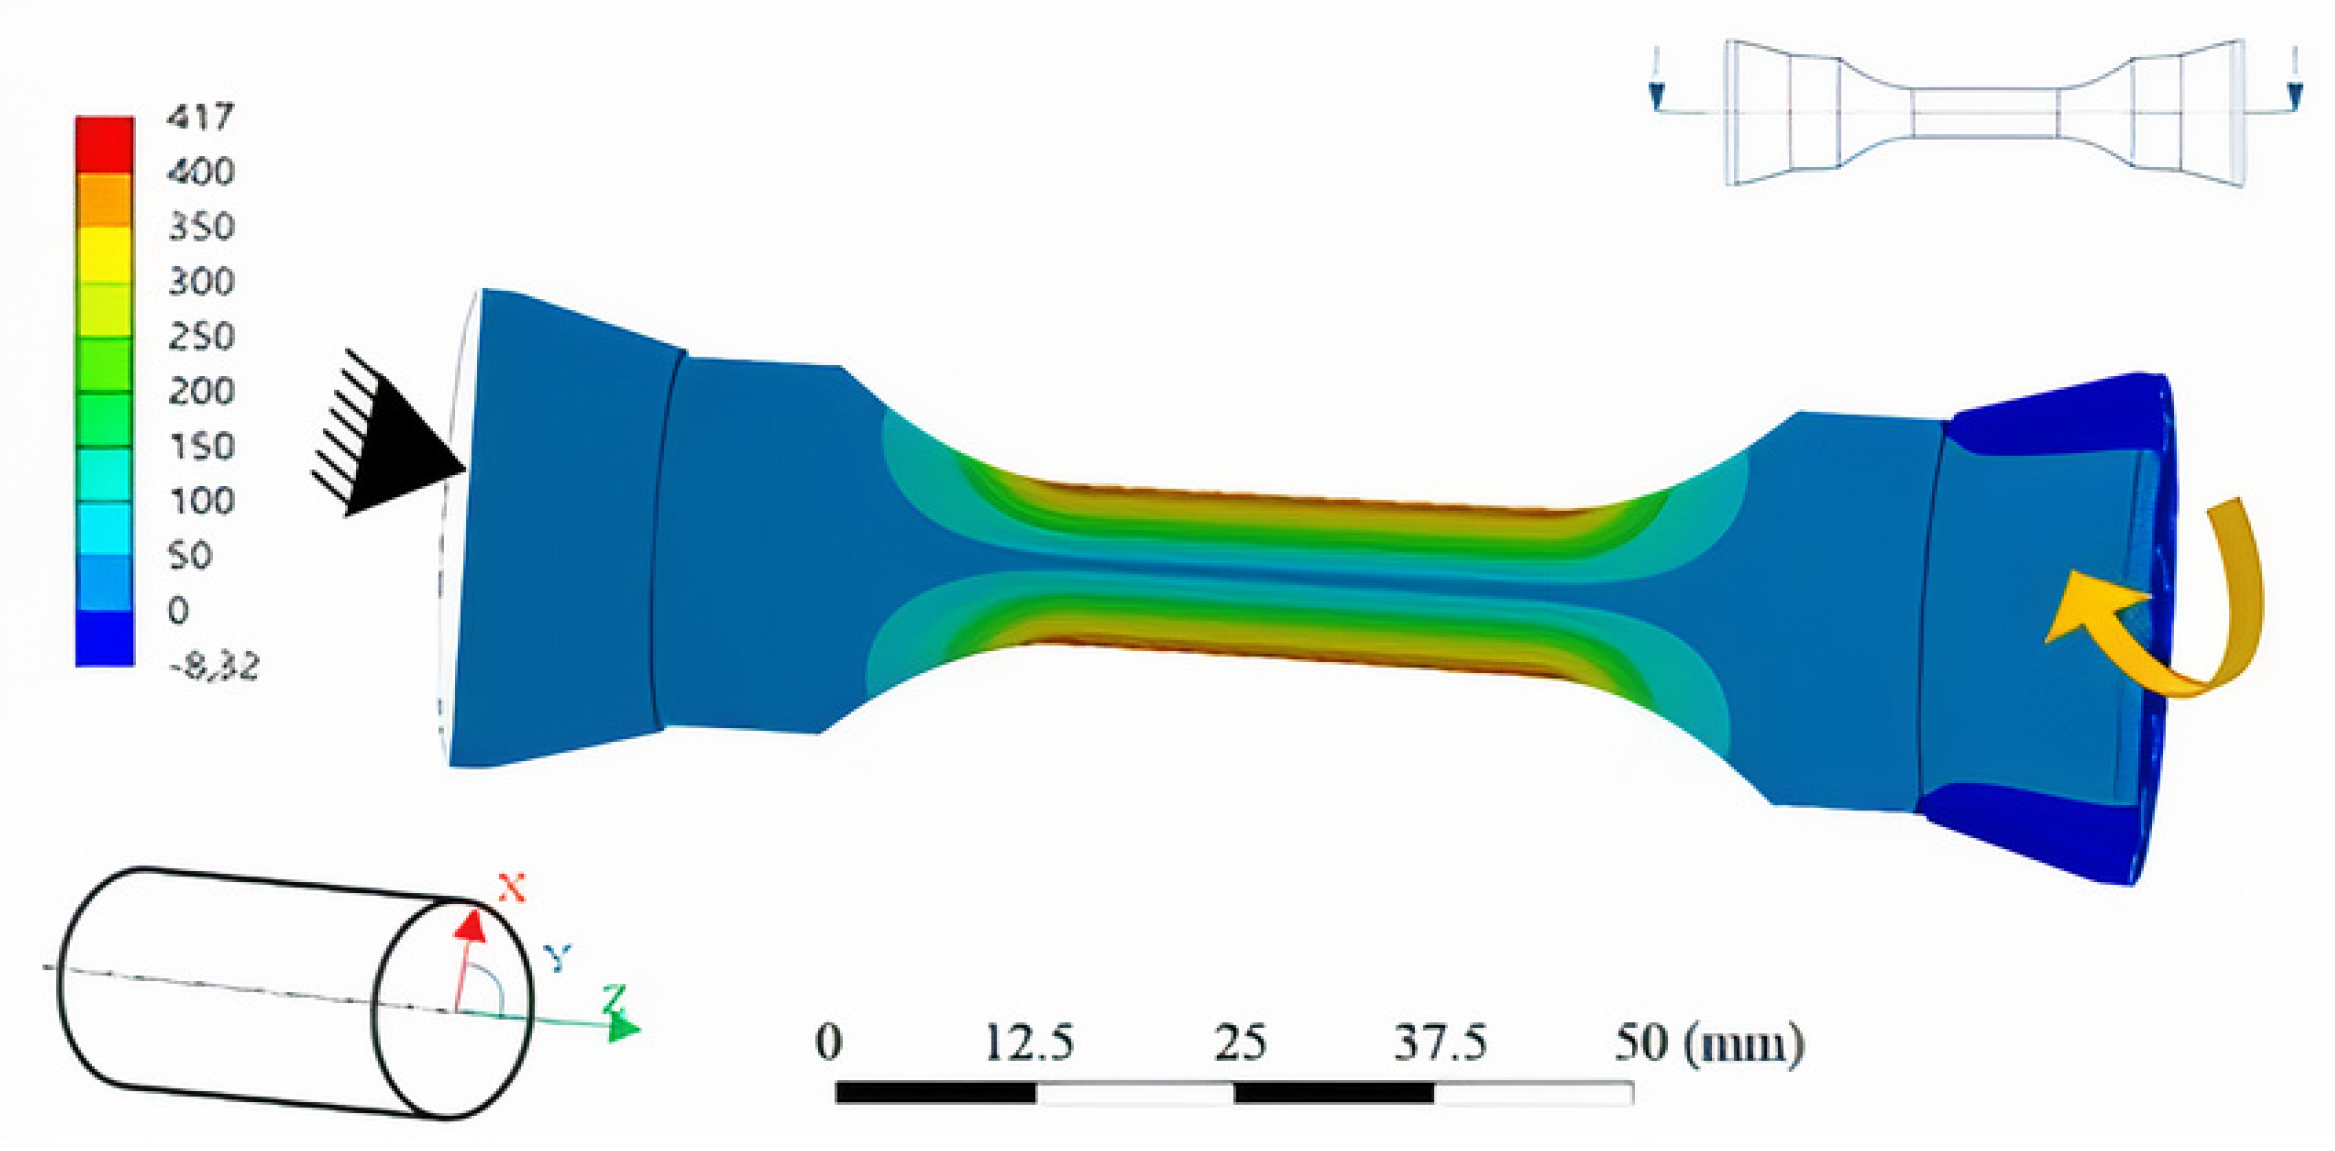
The software Ansys 2020 R1 (from Ansys Inc., Canonsburg, PA, USA) was used to calculate the shear stress distribution in a specimen at one load condition (7.5° and 350 MPa) in the initial cycle. The aim of this model was to elucidate the initial stress distribution inside the specimen under the combined load condition applied in this work. This shall serve to provide a clear understanding of the load condition and allow to correlate the damage mechanisms.
3. Results
3.1. Evolution of Shear Stresses
The resulting shear stress for each angle was determined from the maximum torque required to carry out the full rotational movement. According to Equation (2), is the shear stress, T is the torque and is the diameter of the smallest cross section of sample. The von Misses stresses were calculated using the von Misses equation (Equation (3)).
3.1.1. Maximum Shear Stress and Maximum Compressive Strain
To obtain a clearer understanding of the load condition within the sample, an FEM calculation was conducted on ANSYS 2020 R1. The distribution of shear stress in a sample loaded at 350 MPa and in the position of maximum torsional angle of 7.5° is presented in Figure 4. In this model, the initial torsion of the sample in the first cycle is considered, neglecting effects of strain hardening and plastic deformation occurring with repeated loading in the real experiment. The highest value for shear stress is reached at the location where the thinnest cross section of sample can rotate least. This location lies on the constrained side of the sample, just before the thickness of cross section starts to increase again, as indicated by the arrow in Figure 4.
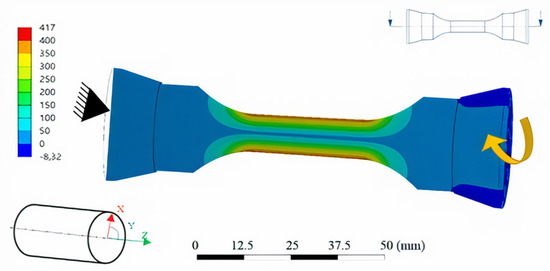
Figure 4.
Sectional view depicting the shear stress inside the sample for 350 MPa compressive stress and 7.5° torsion.
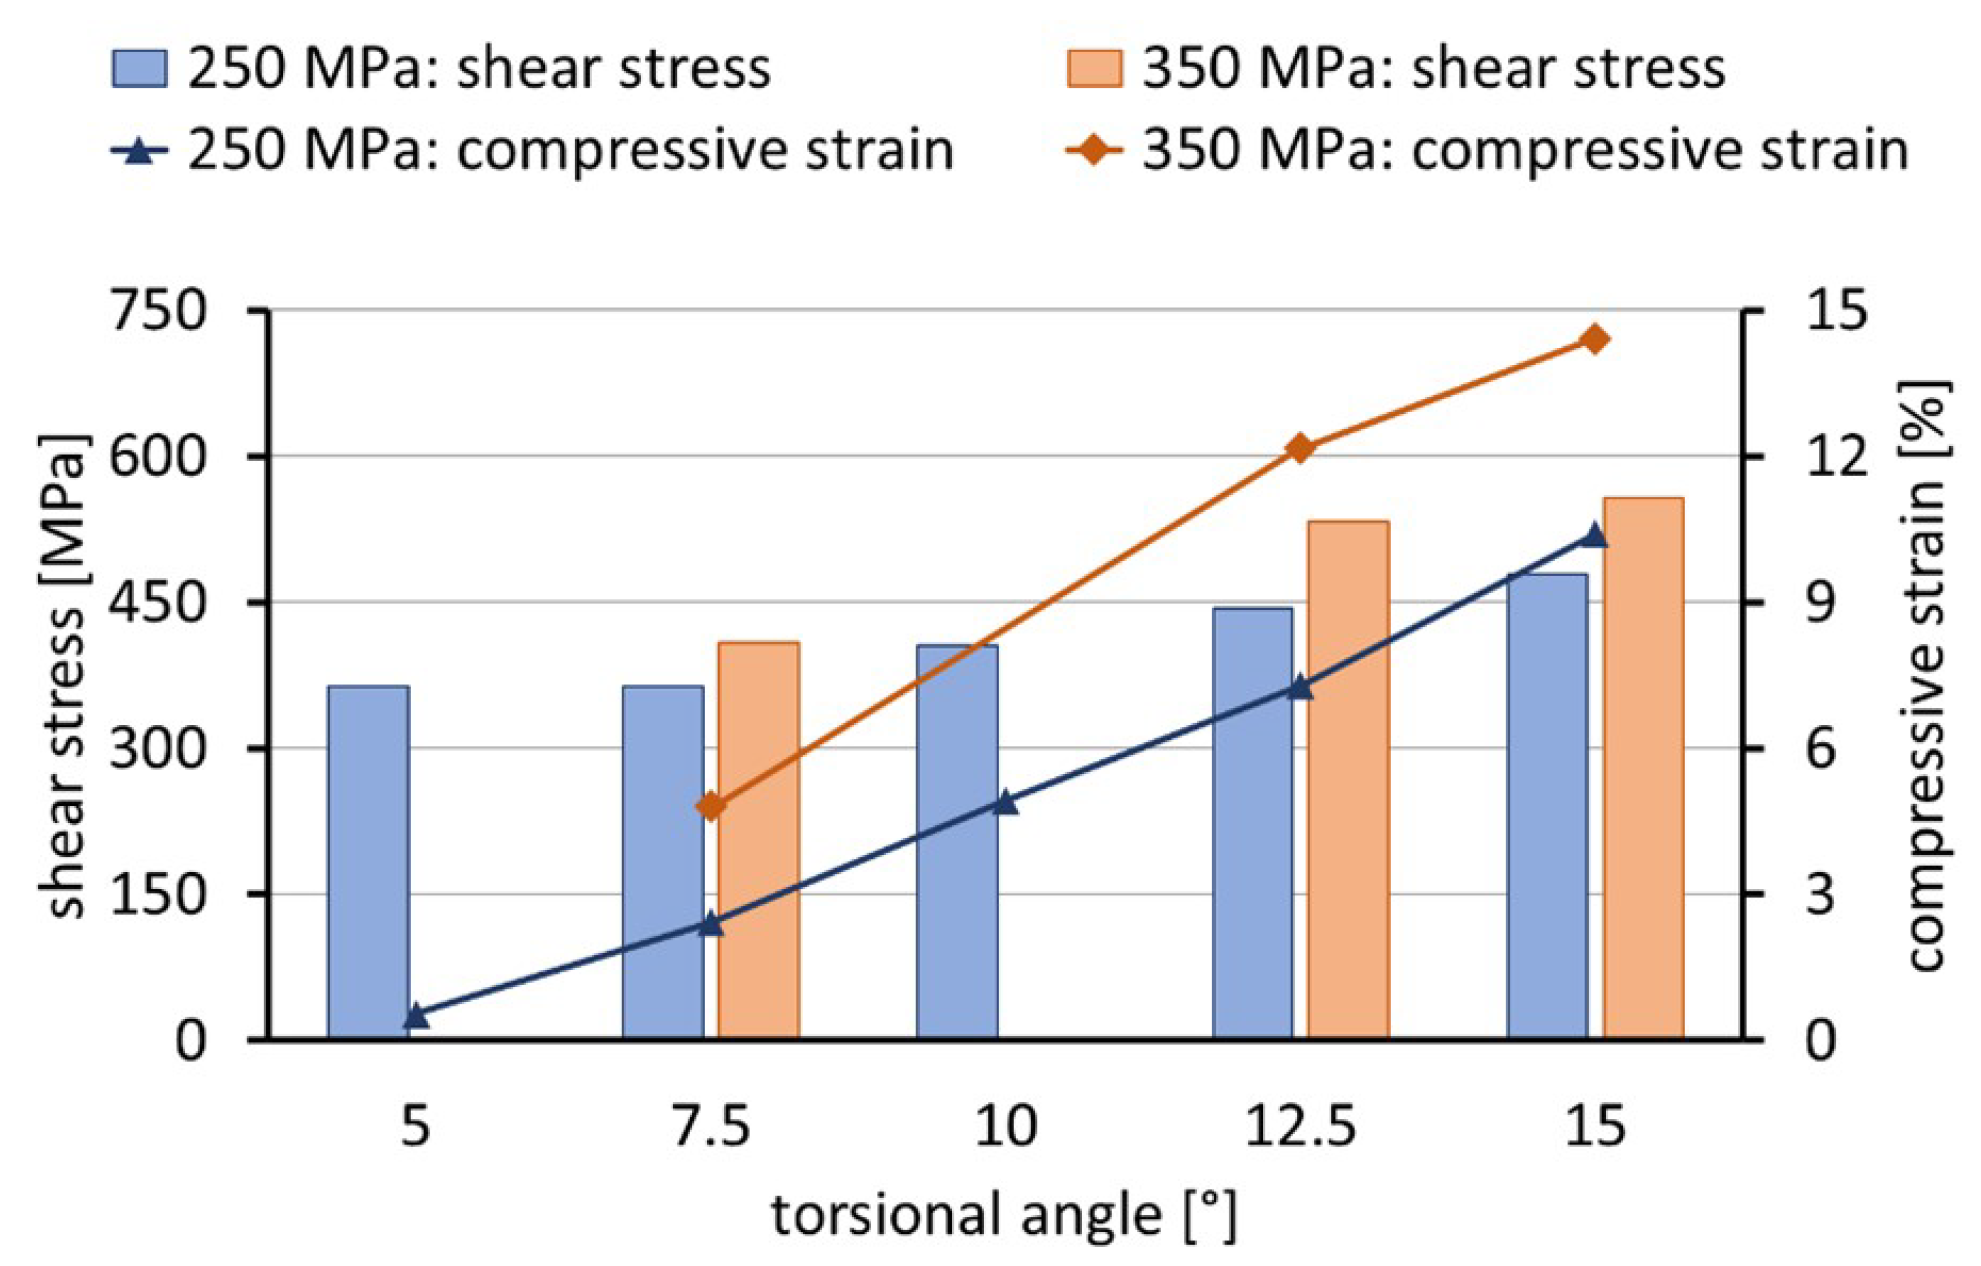
An overview of the applied test parameters and resulting maximum shear stresses measured during the first 120 cycles of each test are listed in Table 3 and presented in Figure 4. Calculated von Mises stress and the maximum compressive strain at the end of each experiment are also given. The compressive strain results from a shortening of the samples over the test time, are shown in detail in the following sections. Under 250 MPa compressive stress and 5° torsion angle the maximum shear stress measured for the sample is around 363 MPa (Table 3; Figure 4). Increasing the angle to 7.5° does not result to a shear stress increase. However, further increase to 10°, 12.5° and 15° results in an increase in shear stress in steps of around 50 MPa, 38 MPa and finally 34 MPa for each rise in torsional angle. It appears that the increment by which the shear stress increases becomes slightly smaller with increasing angle above 10°. Von Mises equivalent stresses at the maximum torsion angles, i.e., the maximum von Mises stresses, were also calculated for all load combinations tested, as listed in Table 3. Even for the lowest angle and compressive stress the resulting von Mises stress lies at 677 MPa which is relatively high in comparison to the tensile strength of the material (902 ± 1 MPa, measured on three samples). At 12.5° and 15° torsional angle under 350 MPa compressive stress, the calculated maximum von Mises stress lies well above the tensile strength (986 MPa and 1026 MPa, respectively). Expectedly, an increase of compressive stress leads to a higher von Mises stress level. Note that a difference of >100 MPa in von Mises stresses acts at the same torsional angle but different compressive stress, with a further increase of this difference for higher angles. Interestingly, under higher compressive stress more torque is required to reach the same degree of torsion, yielding higher shear stress (see Figure 5). The compressive strain at the end of each test increases with both compressive stress and torsion angle. The behaviour seems to depend almost linearly on the angle (see Figure 5). While at 5° torsion angle the axial strain is only 0.55%, it reaches a maximum value of 14.42% for the highest compressive stress and angle.
Table 3.
Test parameters and resulting maximum shear stress at beginning of experiment and max. compressive strain at the end of each experiment.

Figure 5.
Graphical presentation of data in Table 3: max. shear stress at beginning of experiment, max. compressive strain at the end of each experiment.
3.1.2. Shear Stress and Compressive Strain Evolution over the Test Duration
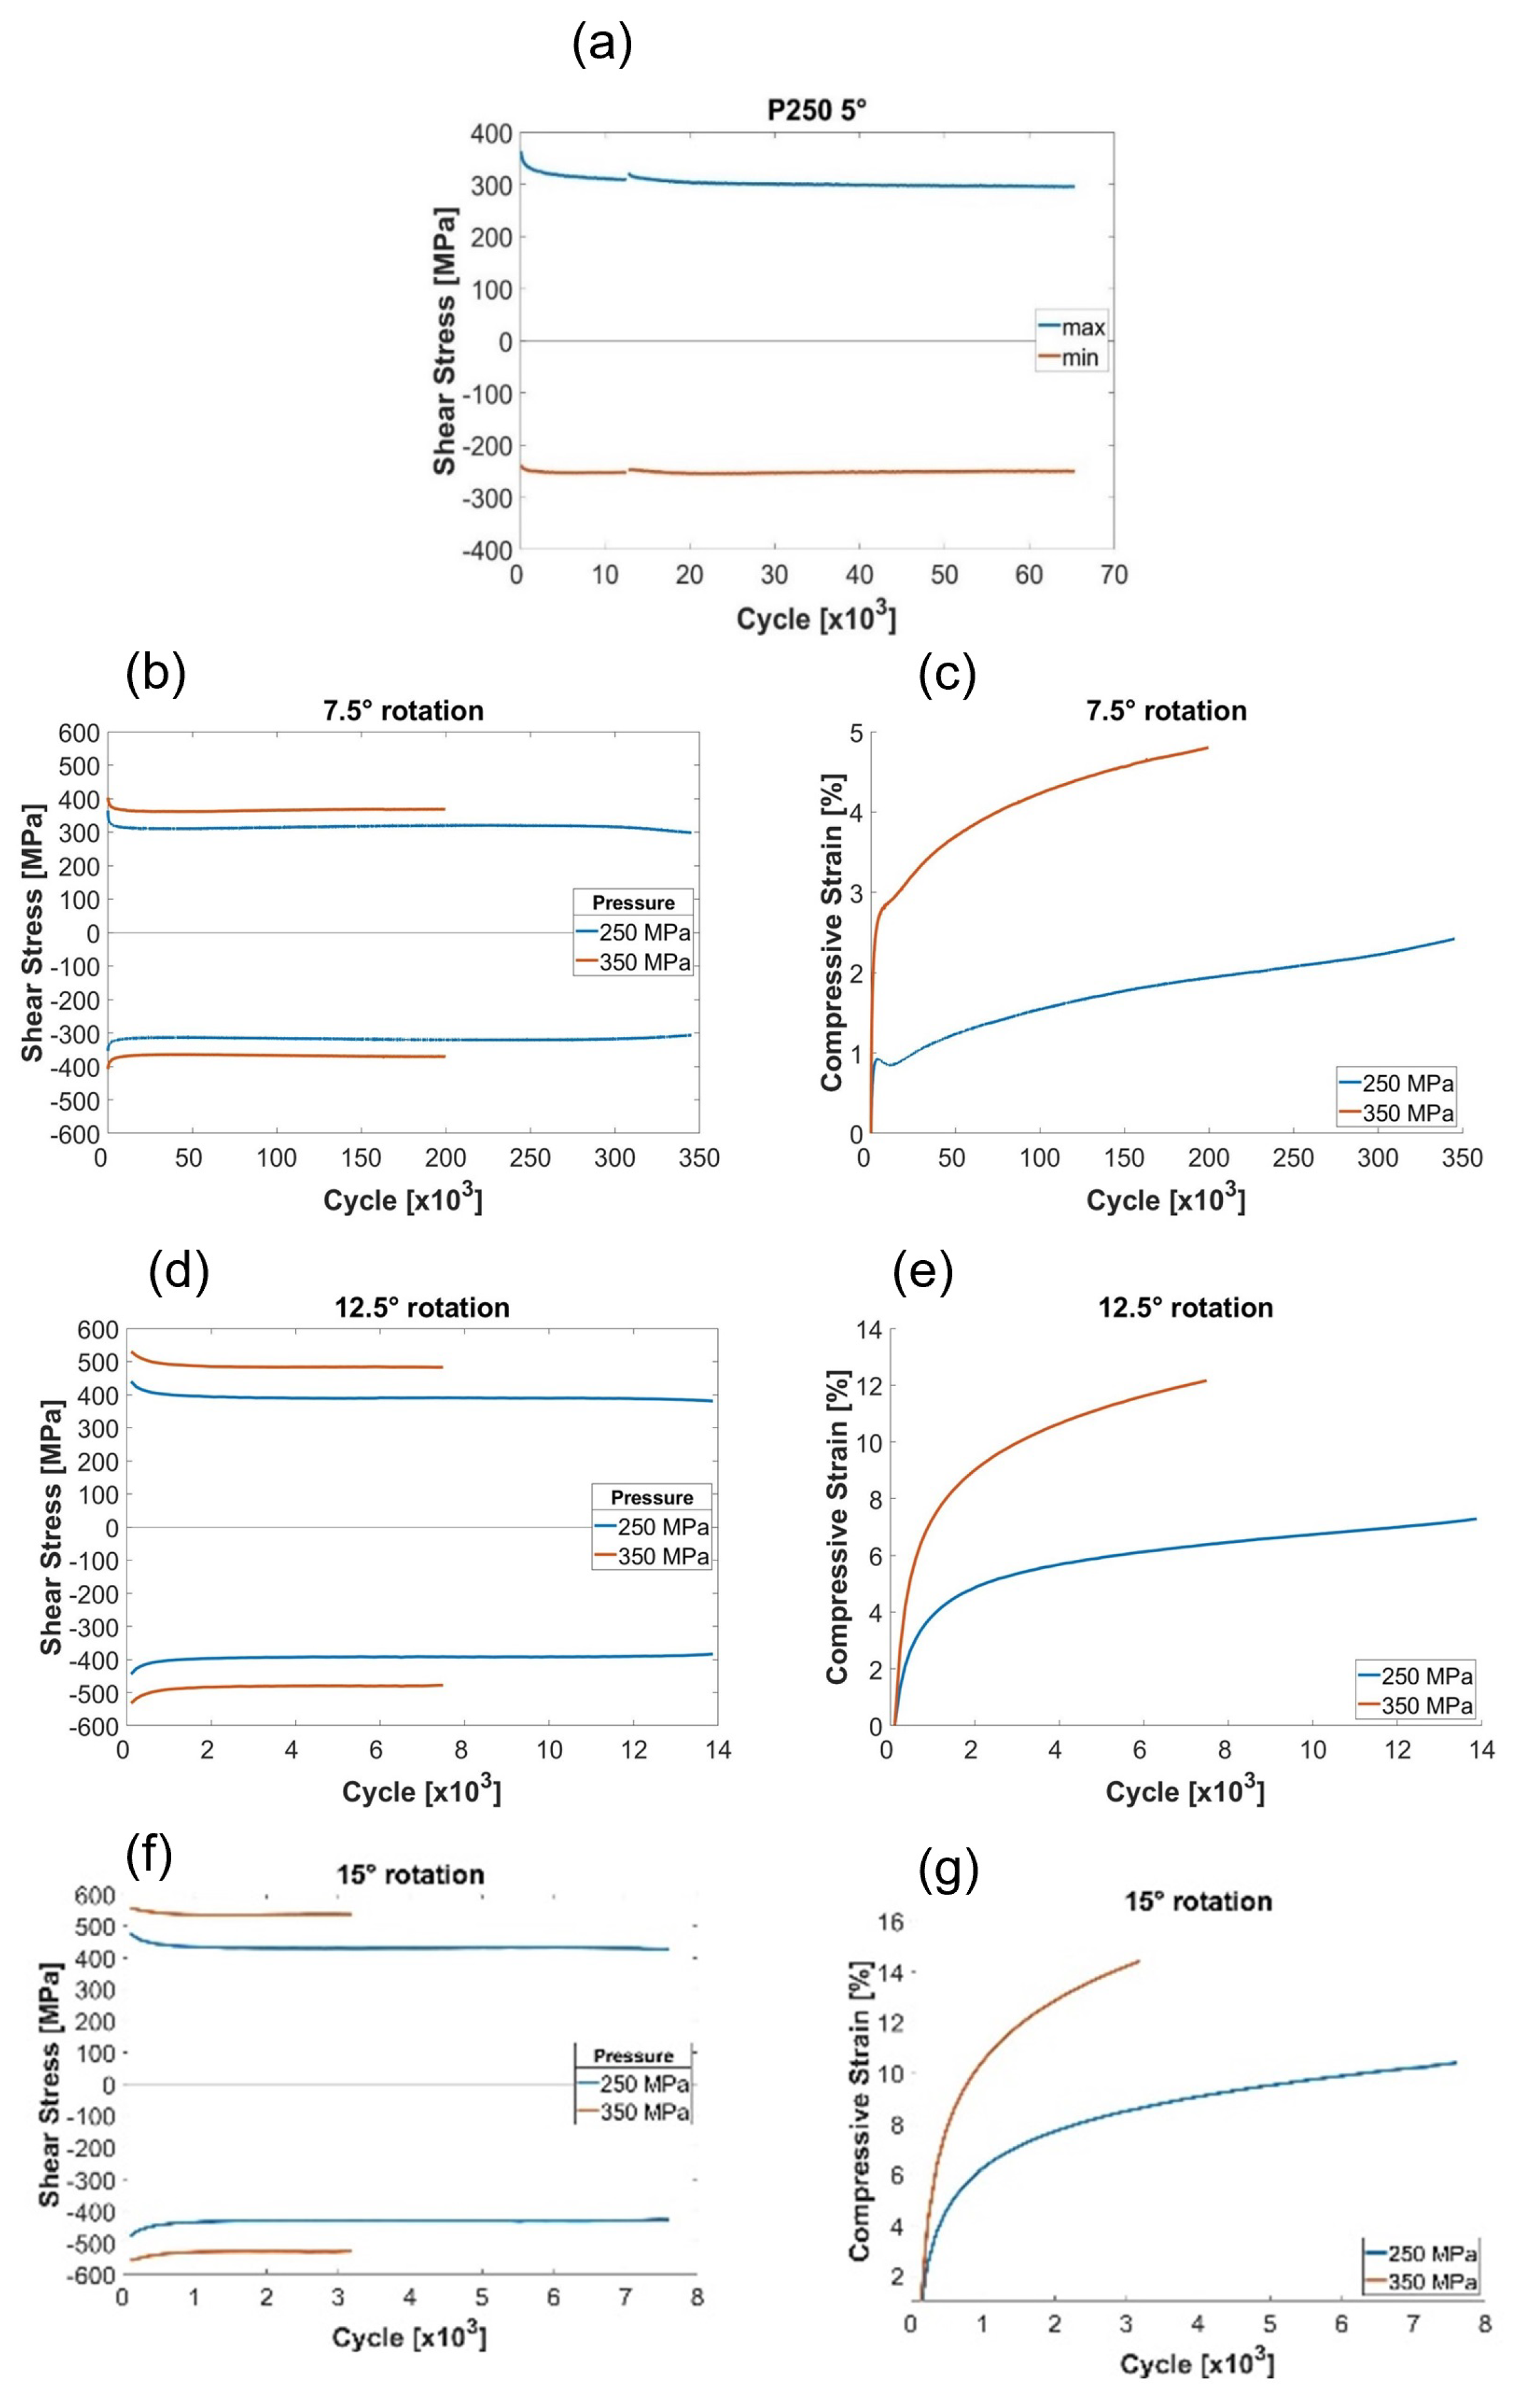
During the first cycles of the experiments, a cyclic softening effect for the maximum shear stress was observed, except for the sample with 5° torsional angle at 250 MPa compressive stress. The evolution of shear stress in the torsional reversal points and the compressive strain over test duration are presented in Figure 5. Interestingly, during the first ≈1000 cycles the sample with 5° torsion angle (Figure 6a) shows cyclic softening for torsional rotation towards the high angle, but cyclic hardening for rotation movement in opposite direction. The small discontinuity in the curves at approximately 10,200 cycles originates from an interruption of the experiment. After initial cyclic softening and hardening, the shear stress of the sample stabilizes followed by slow cyclic softening until the experiment is stopped at ≈65,000 cycles with a shear stress of ≈295 MPa in positive and approximately −250 MPa in negative rotation direction. The sample obviously undergoes significant plastic deformation during the first cycle already. The fact that the shear stress at the minimum angle (0.5°) is in the negative range already in the first cycles shows an immediate shift of the mean stress due to plastic flow. The combination of 250 MPa static pressure with cyclic torsional angle of 5° induces a shortening of the sample over the test duration, to a compressive strain of 0.55% in relation to the original sample length (curve not shown). The experiment was terminated before the sample displayed easily visible cracks. At 7.5° torsional angle and 250 MPa compressive stress cyclic softening occurs followed by very slight cyclic hardening over the duration of the experiment. Here (as well as for 350 MPa compressive stress), positive and negative shear stresses display the same absolute values, indicating that plastic flow shifts the torsional mean stress quickly to zero (Figure 6b). The initial cyclic softening over the first 10,000 cycles is followed by a continuous, very mild cyclic hardening, which reaches its maximum value at 240,000 cycles. After 275,000 cycles the final softening takes place due to defect and crack formation, and the experiment is stopped at 345,000 cycles. Interestingly, increasing the rotation to 7.5° does not show a noteworthy change of torque and thus shear stress, but the compressive strain of the sample increases and reaches 2.42%, as shown in Figure 6c. The increase of compressive stress to 350 MPa leads to cyclic softening up to cycle 15,000 at higher shear stress as shown in the brown colored curves of Figure 6b. At 25,000 cycles mild cyclic hardening begins, reaching its maximum value at 150,000 cycles. Test termination due to visible cracks is reached with the same shear stress level at 200,000 cycles, with an axial compressive strain of 4.8% (the brown colored curve in Figure 6c). The shear stress and compressive strain evolution of the samples exposed to higher torsion angles (12.5° and 15°) are shown in Figure 6d–g. It is observable that the trends in the behaviour evolution remain the same, but increasing angles and compressive stress yield faster softening, hardening, compressive straining and, finally, crack formation. Still, the effect of compressive stress increase from 250 MPa to 350 MPa seems to be more significant for higher torsion angles, yielding, e.g., an increase in shear stress in the middle part of tests by ≈15% at 7.5°, by ≈23% for 12.5° angle and by ≈29% for 15° angle.
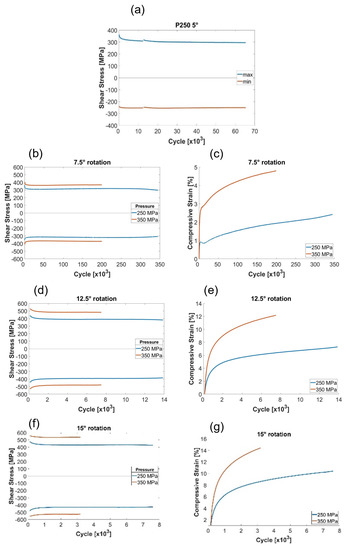
Figure 6.
Evolution of shear stress and compressive strain over the duration of experiments for 250 MPa and 350 MPa compressive stress. (a) 250 MPa and 5°, (b,c) 7.5°, (d,e) 12.5° and (f,g) 15° torsional angle.
3.2. Damage and Crack Formation
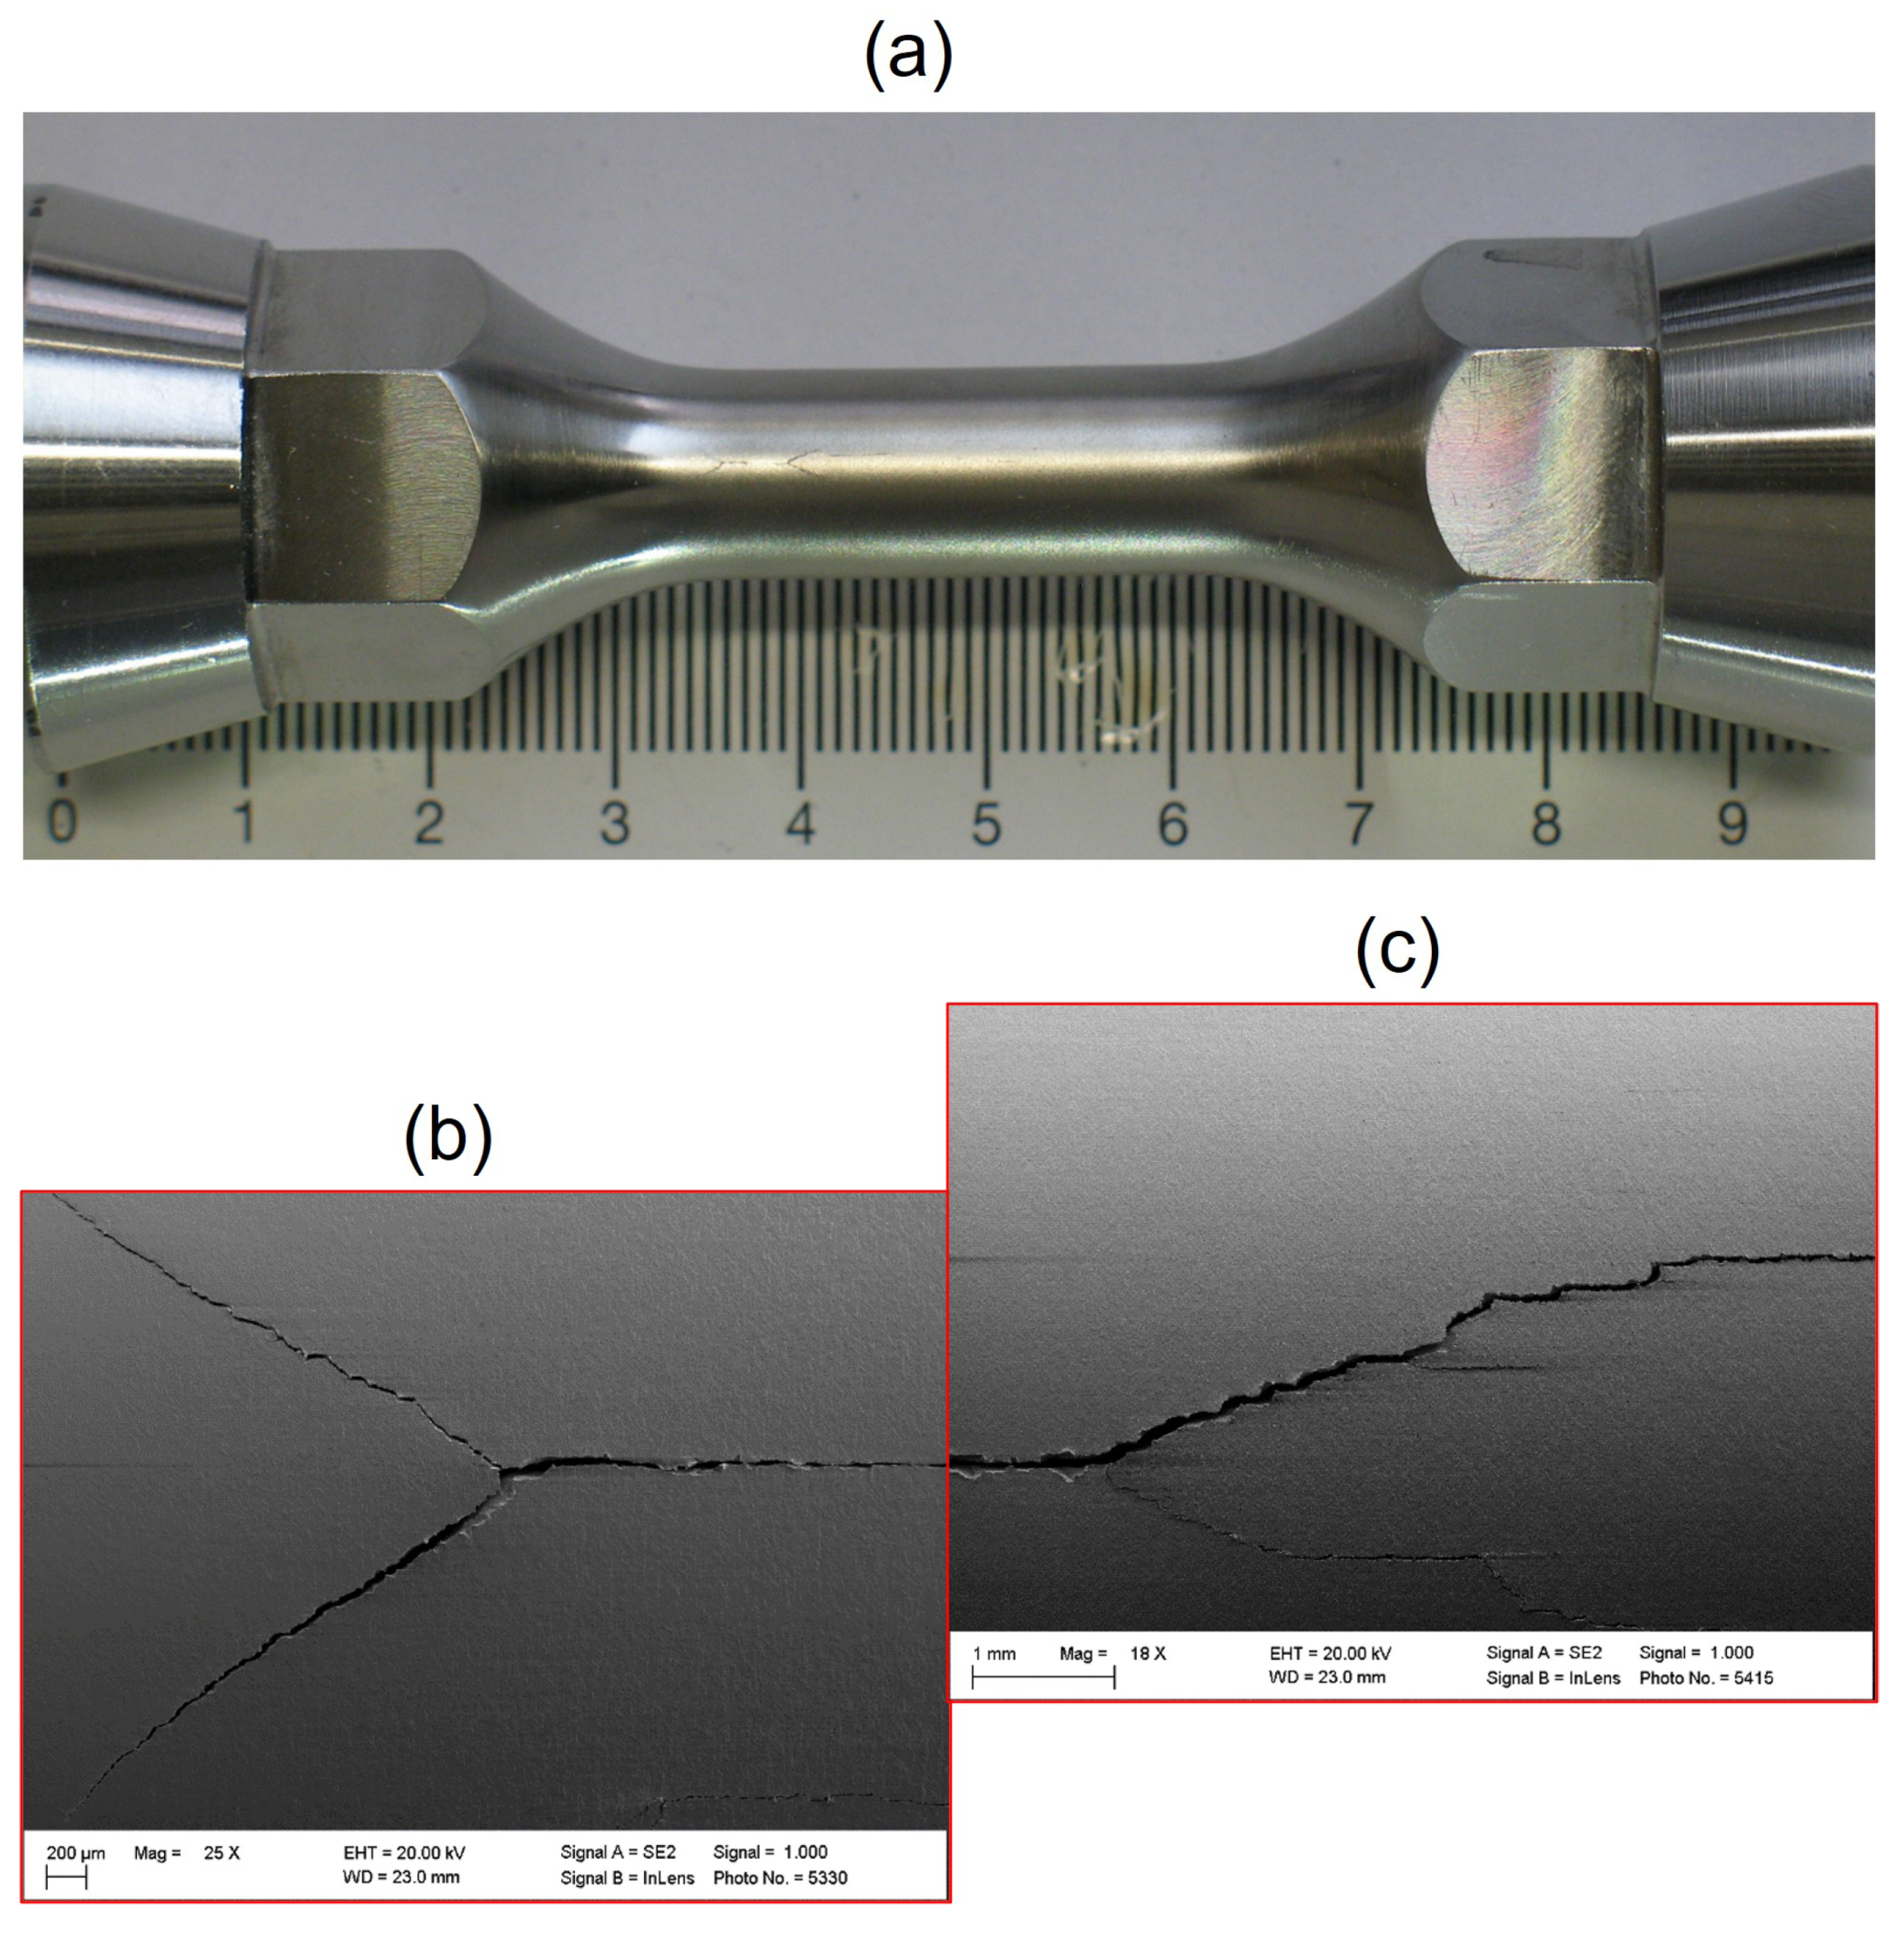
During the tests a rough surface forms on the previously polished samples due to plastic deformation of the material close to the outer surface. Most cracks observed on the outside of the specimen follow the longitudinal axis and remain within the test section. Occasionally, cracks on the sample surface branch and continue at an angle of about 20–35° to the specimen longitudinal axis (Figure 7).
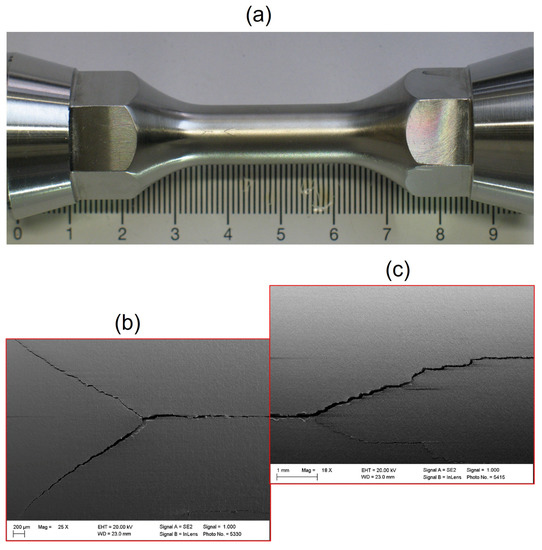
Figure 7.
Specimen after 7500 cycles at 250 MPa and max. torsional angle of 15°. (a) Test section appears dull due to surface deformation, (b) crack branching and (c) fine cracks parallel to longitudinal axis are visible.
The surface deformation and roughening is less pronounced at lower angles of torsion shown in Figure 8. The sample essentially retains its polished surface.
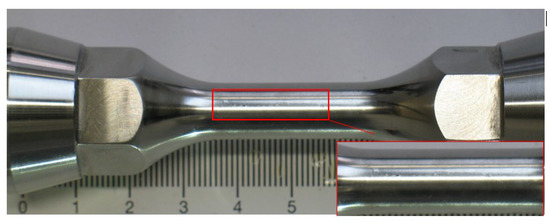
Figure 8.
Specimen after 350,000 cycles at 250 MPa and max. torsional angle of 7.5°. Test section appears shiny and fine cracks parallel to longitudinal axis are present (though not very visible).
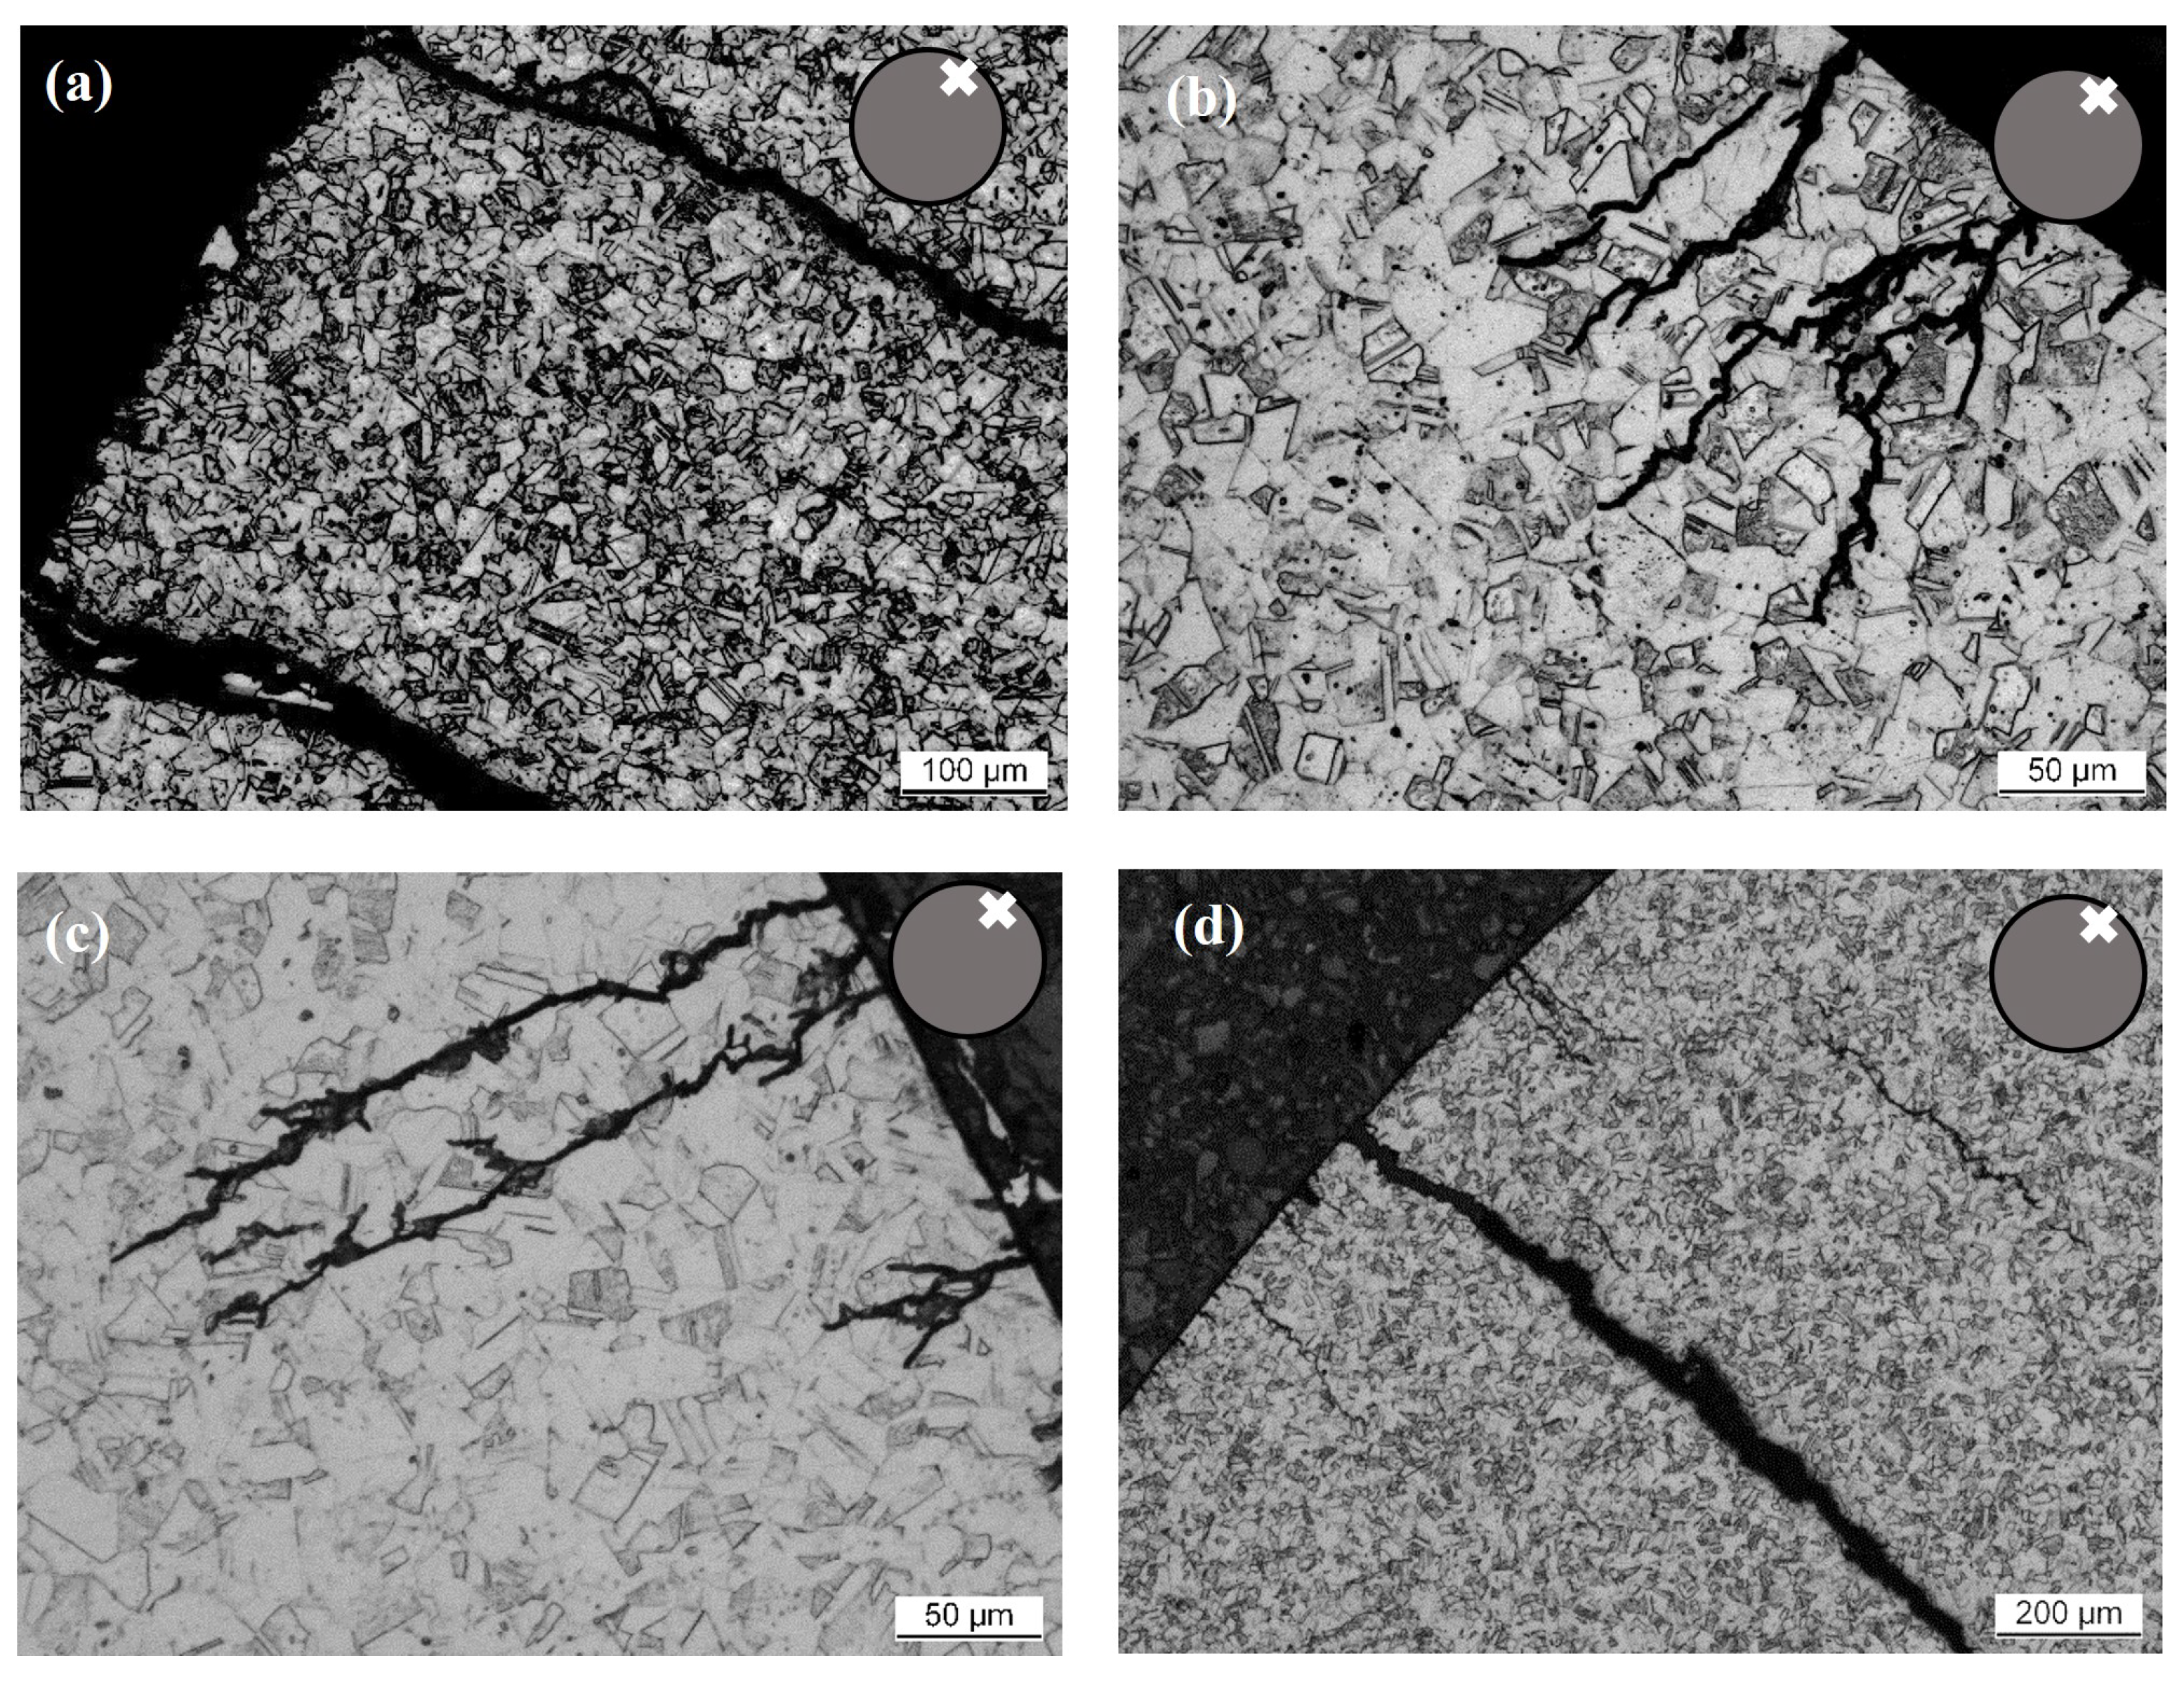
Figure 9 shows light microscopy images of cross sections prepared through the middle of the test section perpendicular to the longitudinal axis of specimen loaded at 250 MPa and various torsional angles. Images were taken close to the specimen outer surface as shown by the X inside the schematic at the top right corner of every image. While all cracks observed in the cross sections follow predominantly the radial direction, they all display branching and secondary cracks deviating from the main crack. Occasionally, cracks not connected to the sample surface are also observed (Figure 9d), which may have initiated at the surface out of the cross-sectional plane, or below the surface. Observing a multitude of images, it appears that cracks tend to be longer in those specimens loaded with low torsional angles and for longer test times (i.e., higher numbers of cycles). Comparing the cross sections displayed in Figure 9, cracks were observed at a maximum length of ≈530 m for 15°, ≈175 m for 12.5°, ≈275 m for 10° and ≈1100 m for 7.5°. In Figure 9b,c, it can be observed that crack propagation predominantly occurs in a trans-crystalline manner.
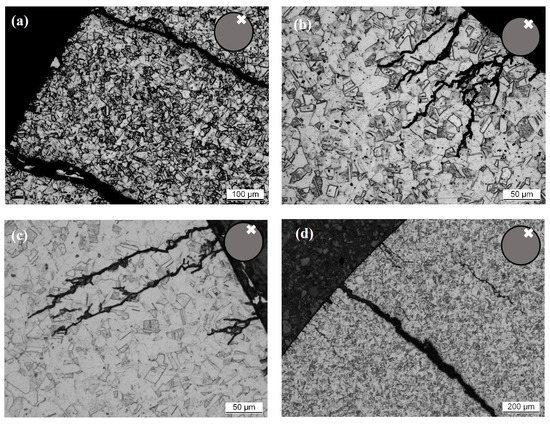
Figure 9.
Light microscopic images of cross sections perpendicular to longitudinal axis through specimen loaded at 250 MPa and torsional angles of (a) 15°, (b) 12.5°, (c) 10° and (d) 7.5°. Cracks in radial direction branching inside the specimen are visible in all samples. Note the different magnifications.
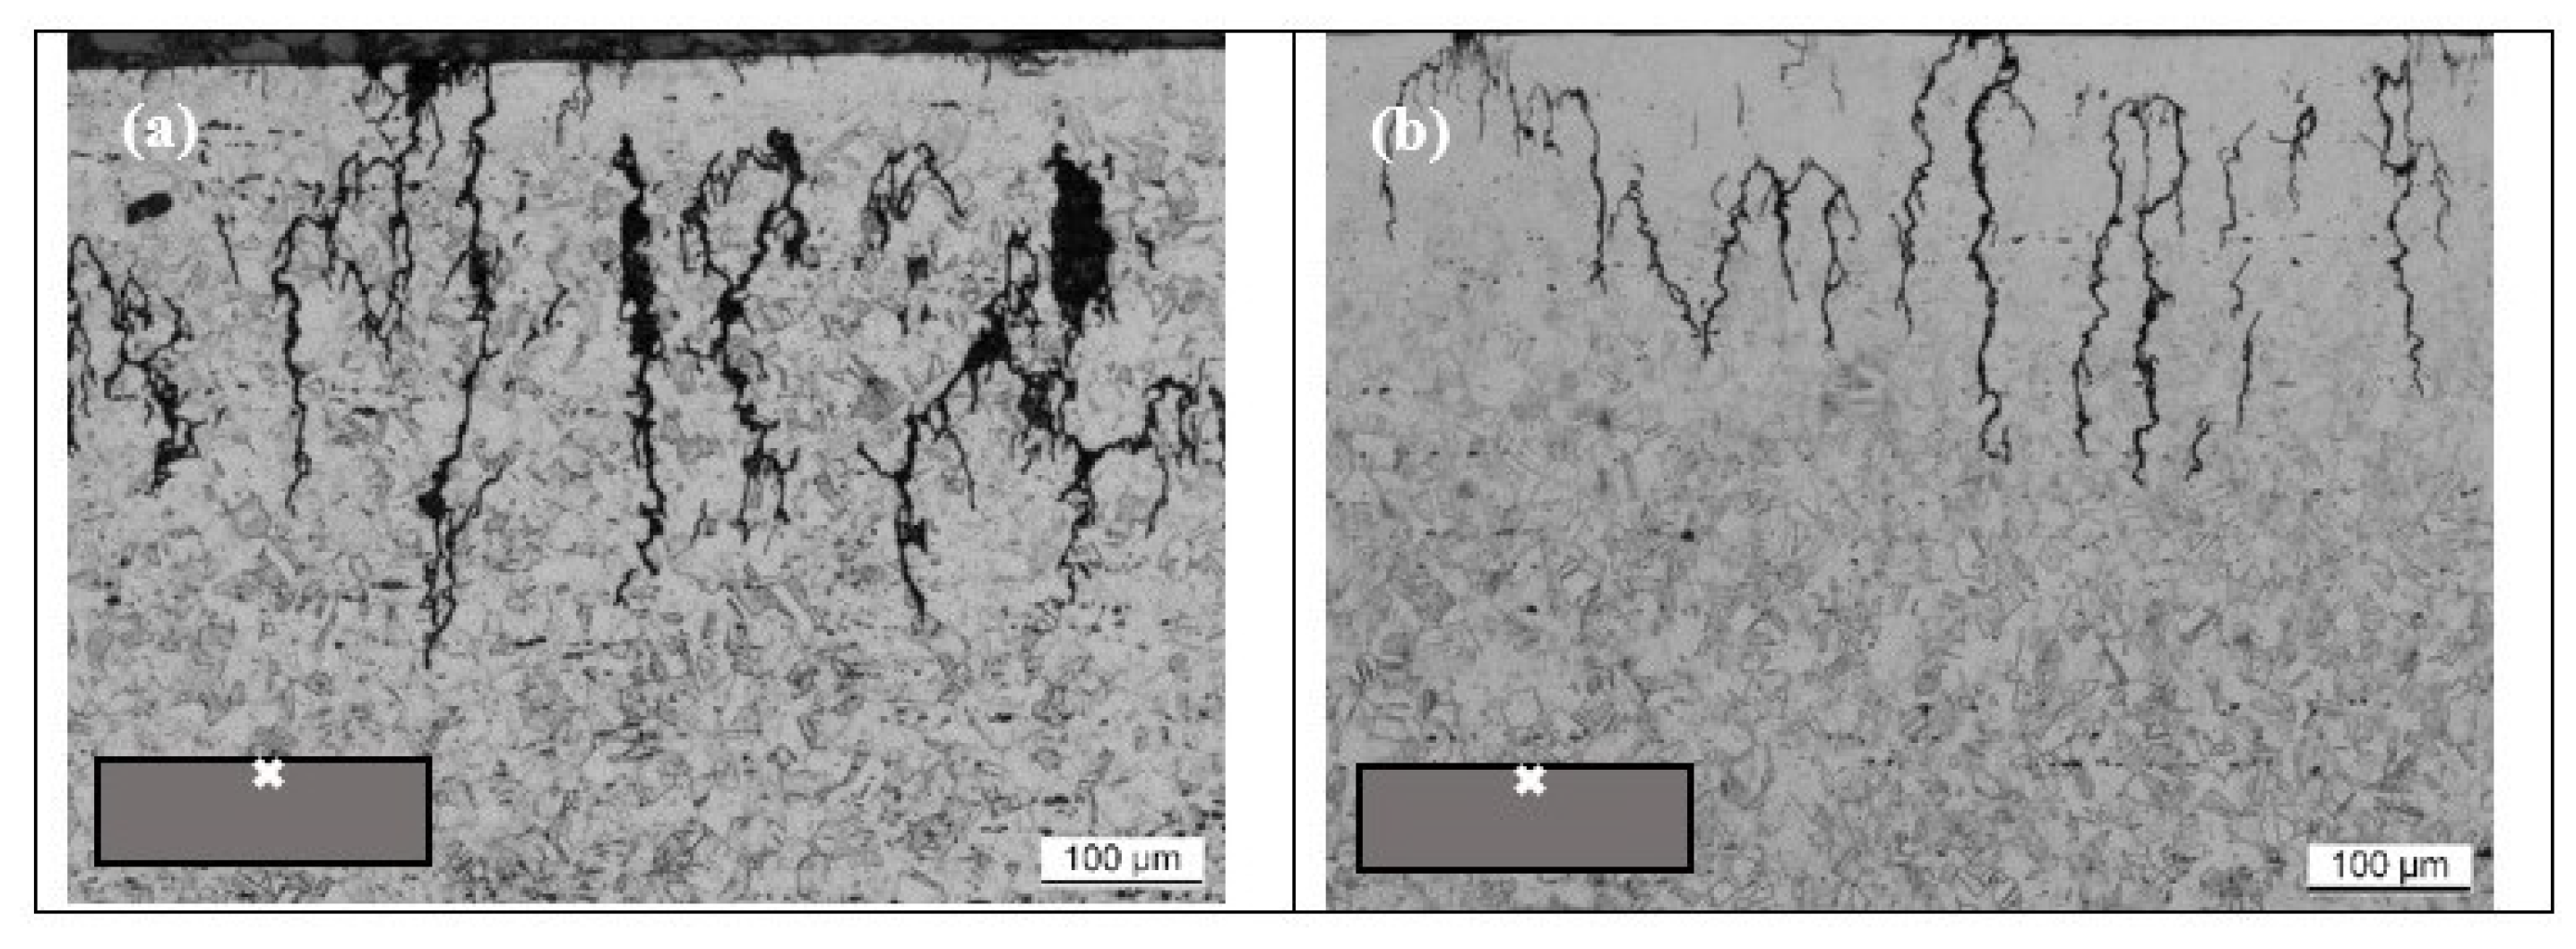
Perpendicular cross sections of two specimen tested at 350 MPa compressive stress are displayed in Figure 10. Cracks deviating slightly from radial direction with pronounced branching inside the specimen are visible. At the higher compressive stress, the main crack propagation direction appears to deviate slightly from the radial direction and crack branching is more pronounced. Cross sections cut through the test section in axial direction along the center of the specimen are presented in Figure 10. Cuts were made adjacent to the main cracks running parallel to the specimen longitudinal axis (compare Figure 7 and Figure 8), thus showing the branches deviating “sideways” from the main crack propagation direction. The branching cracks frequently meet below the specimen surface yielding material regions partially detached from the bulk specimen after sample cutting. Locally such material volumes were removed from the cross section during metallographic preparation, leaving the hollow areas appearing dark in Figure 11a. The appearance of cracks in axial sections depends on the cutting location. In other locations the sample may also fall apart, when cutting close to the main crack in longitudinal direction (not shown here). This generally means that while cracks on the sample outer surface are mostly oriented parallel to the samples’ longitudinal axis, below the surface locally also cracks with fracture faces parallel to the radial section exist.
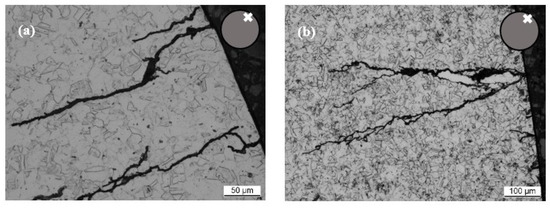
Figure 10.
Light microscopic images of cross sections perpendicular to longitudinal axis through specimen loaded at 350 MPa and torsional angles of (a) 12.5° and (b) 7.5°. Note the different magnifications.
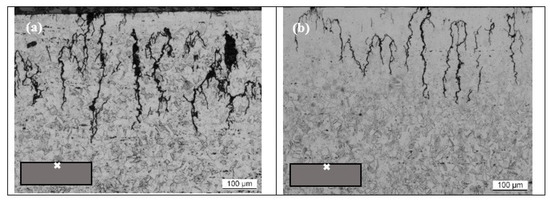
Figure 11.
Light microscopic images of cross sections parallel to longitudinal axis through specimen loaded at 250 MPa and torsional angle of 10° (a) and 350 MPa and 7.5° (b). Branches of main cracks are visible, propagating in radial direction below the surface.
4. Discussion
While the two applied compressive stresses lie well below the yield limit of the material, the superposition of the torsional rotation yields significantly higher von Mises effective stresses, which for two experiments even exceed the tensile strength when torsion approaches high angles close to the reversal points. This is relevant, e.g., for a case reported in [18], where an Aesculap stem of an artificial hip joint for the human body made of stainless steel with an asymmetrical cross section was found to initiate fracture at the thinner side of the stem even though the tensile stress is higher at the lateral side. This is a case of multiaxial fatigue in the most common area of application of REX 734, which demonstrates that von Mises stresses should not be used alone to determine effective stresses in multiaxial stress conditions. Further, with the higher compressive stress, also the torque required to achieve the max torsional angle increases—obviously the multiaxial loading provokes a higher resistance in the material against the torsional deformation. At the same time, plastic flow in the material is induced, both in torsional and in axial direction. This is first easily observed by the axial strain, i.e., the shortening of the samples during the test. This is not a monotonous deformation, but it occurs over several 100 or even 1000 cycles, depending on test conditions. This behaviour can be considered as a type of ratcheting, in which with every cycle of the torsional load the axial strain increases. This occurs at a higher rate in the beginning and slows down over the course of the experiment, assuming a quite stable strain rate of continuous increase. As was observed by Kang et al. [19], this ratcheting behaviour (a progressive accumulation of strains) mainly appears in axial direction due to the non-zero mean axial stress. The authors also noted that the torsional ratcheting was very small, while the axial ratcheting strain had an apparent dependence on the axial mean stress history.
The evolution of axial strain accumulation (see Figure 5) indicates that the material undergoes initial strain hardening before assuming a steady behaviour. The compressive strain is very small at 5° max. angle, but it increases with increasing angle and higher compressive stress.
The evolution of shear stresses over test duration on the other hand displays initially cyclic softening, followed by very mild hardening or a stable shear stress up until crack formation. The fact that compressive strain accumulation slows down in approximately the same period during experiments in which shear stresses become smaller appears somewhat contradictory. It is believed that some non-proportional hardening is in play since even when the sample turns back to zero angle position, the constant static compression stress is always acting on the sample. This non-proportional strain hardening can be attributed to multiaxial load histories that induce variable principal stress/strain directions, activating cross-slip bands in several directions, due to the associated rotation of the maximum shear planes [20]. This effect is greater as compared to proportional loading (those with fixed principal directions), and even more pronounced for materials with low stacking fault energy (SFE), such as austenitic stainless steels. On the contrary, for materials with higher SFE, such as aluminum, negligible non-proportional hardening is noted. However, recent research [21,22,23,24] demonstrated that in cases when there is minimal additional hardening effect, considerable fatigue life reduction under non-proportional loading occurs, implying that not just one mechanism is responsible for non-proportional fatigue damage. Still, the largest part of the compressive strain is accumulated in the period, in which the torsional shear stress decreases in the beginning of the experiment. Possibly, strain hardening under the axial material flow occurs at the same time as shear softening yielding lower shear stresses.
Furthermore, it must be considered that in the presented experiments full cylindrical samples are used. Therefore, there is a gradient in shear stress and strain across the samples’ radial cross section, as displayed in Figure 4. The compressive strain on the other hand acts across the full sample cross section. Therefore, hardening and softening mechanisms may vary between the sample center and the material close to the outer surface, while of course an average behaviour is depicted by the stress and strain curves. Nevertheless, even for hollow specimens, it was reported [25] that retrieving the shear stress from the measured torque by means of normal solid mechanic equations would lead to inaccurate results when plasticity occurs. In fact, in the case of inelastic deformation, the shear stress distribution is not linear along the radius of the specimen.
The plastic flow in torsional direction is clearly recognizable from the shift of the mean shear stress within the first cycle (not recognizable in the graphs). Only for the 5° experiment, the shift does not proceed completely to a zero mean stress. What appears to be hardening in max shear stress values towards the negative angle in Figure 6a, is really a result of the ongoing shift of the mean stress by plastic flow, i.e., a type of fast ratcheting in torsional direction. Still, the upper and lower values of the shear stress remain “asymmetric” for this experiment only.
With increasing torsional angle and higher compressive stress both the max shear stresses and the compressive strain reach higher values and the number of cycles to crack formation decreases. Aside from that, the general behaviour of all experiments follows the same progression.
Crack formation takes place in a comparable manner for all samples. Only the experiment with 5° was stopped before cracks formed, so no statement can be made about cracks here. From the outside of the sample, cracks are visible predominantly aligned to the samples’ longitudinal axis, partially with branches at the ends at angles of approximately 30°. Such cracks are not typical for torsional loading of a ductile material, for which microcrack growth along the plane of maximum shear stress (Mode II), followed by macrocrack growth along the plane of maximum tensile stress (Mode I) are expected [26]. However, investigations on the nature of short fatigue cracks show that initiation and propagation of short cracks depends on many factors such as material strength, loading condition, microstructure, stress amplitude, and environment [12,27]. In case any of these parameters is varied, different fatigue crack growth behaviour may result. It can be hypothesized that for the austenitic steel studied, crack formation at the outer surface of the sample is dominated by the compressive strain, which results in tensile stresses in the sample surface. Below the sample surface, the cyclic loading and repeated changes in loading direction and multiaxiality lead to pronounced branching in this very ductile steel. Even cracks proceeding perpendicular to those observed on the outside of the samples are observed.
5. Summary and Conclusions
Solid cylindrical samples are exposed to monotonous compressive stress at ≈1/3 of tensile strength and cyclic torsional loading to high angles of up to 15°. They display pronounced axial compressive strains, induced by ratcheting mainly in the initial phase of experiments through the cyclic superposition of the torsional stress to the constant compressive stress. This ratcheting in longitudinal direction causes crack formation in the samples, yielding mainly longitudinal cracks under compression. Below the sample surface, multiple branching and cracks also in perpendicular direction to the surface ones are observed, indicative of the varying multiaxial stress states acting in different locations across the samples’ cross section. Strain hardening seems to occur under the compressive strain, while at the same time cyclic softening is observable in the torsional shear stresses, indicating that microstructural alterations causing hardening and softening act differently in the material for the two stress directions at the same time. This study presents one example for the complex stress–strain behaviour of ductile high interstitial steels under multiaxial loading. While the solid samples complicate the interpretation of results, compared to hollow tube-type samples frequently used to achieve a plane stress state in comparable experiments, the present situation is realistic to occur in applications and cannot be neglected. Future work will elucidate local differences in strain accumulation and deformation mechanisms in the microstructure, as well as include a more detailed analysis of the cyclic stress states, to explain the current findings in more detail.
Author Contributions
Conceptualization, S.H.; Data curation, T.N., D.K. and A.K.; Formal analysis, T.N., D.K. and A.K.; Funding acquisition, T.N. and S.H.; Investigation, T.N., D.K. and A.K.; Methodology, T.N., D.K. and A.K.; Project administration, S.H.; Supervision, S.H.; Validation, T.N. and S.H.; Writing—original draft, T.N., D.K., A.K. and S.H.; Writing—review and editing, T.N., D.K., A.K. and S.H. All authors have read and agreed to the published version of the manuscript.
Funding
Parts of this work are funded by the German Research Foundation (Deutsche Forschungsgemeinschaft DFG) under the project number DFG 441180620. Timothy Ngigi Ngeru further received funding by the German Academic Exchange Service DAAD in the Kenyan-German Postgraduate Training Programme. The authors gratefully acknowledge the support by both institutions. Furthermore, we acknowledge support by the Open Access Publication Fund of the University of Duisburg-Essen.
Institutional Review Board Statement
Not applicable.
Informed Consent Statement
Not applicable.
Data Availability Statement
The data that support the findings of this study are available on request from the corresponding author.
Conflicts of Interest
The authors declare no conflict of interest.
References
- Janssens, K. Proportionally and non-proportionally perturbed fatigue of stainless steel. Int. J. Fatigue 2017, 110, 42–48. [Google Scholar] [CrossRef]
- Mei, J.; Dong, P. A new path-dependent fatigue damage model for non-proportional multiaxial loading. Int. J. Fatigue 2016, 90, 210–221. [Google Scholar] [CrossRef]
- Wang, C.H.; Brown, M.W. A Path-independent Parameter for Fatigue under Proportional and Non-proportional Loading. Fatigue Fract. Eng. Mater. Struct. 1993, 16, 1285–1297. [Google Scholar] [CrossRef]
- Li, J.; Qiu, Y.Y. A path-dependent multiaxial fatigue life estimation criterion for metals under various loading conditions. Int. J. Fatigue 2021, 149, 106300. [Google Scholar] [CrossRef]
- Gates, N.; Fatemi, A. Multiaxial variable amplitude fatigue life analysis including notch effects. Int. J. Fatigue 2016, 91 Pt 2, 337–351. [Google Scholar] [CrossRef]
- Itoh, T.; Sakane, M.; Ohnami, M.; Socie, D.F. Nonproportional Low Cycle Fatigue Criterion for Type 304 Stainless Steel. ASME J. Eng. Mater. Technol. 1995, 117, 285–295. [Google Scholar] [CrossRef]
- Bemfica, C.; Mamiya, E.; Castro, F. Axial-torsional fatigue and cyclic deformation of 304L stainless steel at room temperature. MATEC Web Conf. 2019, 300, 08004. [Google Scholar] [CrossRef] [Green Version]
- Fatemi, A.; Socie, D.F. A Critical Plane Approach to multiaxial Fatigue Damage Including Out-of-phase Loading. Fatigue Fract. Eng. Mater. Struct. 1988, 11, 149–165. [Google Scholar] [CrossRef]
- Murakami, Y. Multiaxial Fatigue Testing, Mechanical Testing and Evaluation. In Mechanical Testing and Evaluation; Kuhn, H., Medlin, D., Eds.; ASM International: Almere, The Netherlands, 2000; pp. 779–785. [Google Scholar] [CrossRef]
- Alaswad, A.; Benyounis, K.; Olabi, A.G. Optimization Techniques in Material Processing. In Reference Module in Materials Science and Materials Engineering; Elsevier B.V.: Amsterdam, The Netherlands, 2015. [Google Scholar] [CrossRef]
- Forsyth, P.J.E. A two stage process of fatigue crack growth. Proc. Crack Propag. Symp. 1962, 1, 76–94. [Google Scholar]
- Zhang, W.; Akid, R. Mechanisms and fatigue performance of two steels in cyclic torsion with axial static tension/compression. Fatigue Fract. Eng. Mater. Struct. 2007, 20, 547–557. [Google Scholar] [CrossRef]
- Močilnik, V.; Gubeljak, N.N.; Predan, J. The influence of a static constant normal stress level on the fatigue resistance of high strength spring steel. Theor. Appl. Fract. Mech. 2017, 91, 139–147. [Google Scholar] [CrossRef]
- Li, Y.; Aubin, V.; Rey, C.; Bompard, P. Microstructural modeling of fatigue crack initiation in austenitic steel 304. Procedia Eng. 2012, 31, 541–549. [Google Scholar] [CrossRef]
- Rodak, K.; Pawlicki, J. Efficiency of the compression with oscillatory torsion method in grain refinement in Al. Arch. Civ. Mech. Eng. 2016, 16, 805–812. [Google Scholar] [CrossRef]
- Shanina, B.; Tyshchenko, A.; Glavatskyy, I.; Runov, V.; Petrov, Y.; Berns, H.; Gavriljuk, V. Chemical nano-scale homogeneity of austenitic CrMnCN steels in relation to electronic and magnetic properties. J. Mater. Sci. 2011, 46, 7725–7736. [Google Scholar] [CrossRef]
- Zuber, M. Implantatlegierung mit hohen Anforderungen an Korrosions- und Ermüdungsbeständigkeit. Available online: https://www.hempel-metals.com/de/werkstoffe/sonderwerkstoffe/rex-734/ (accessed on 24 December 2021).
- Griza, S.; Santos, S.; Ueki, M.; Bertoni, F.; Strohaecker, T. Case study and analysis of a fatigue failure in a THA stem. Eng. Fail. Anal. 2013, 28, 166–175. [Google Scholar] [CrossRef]
- Kang, G.; Gao, Q.; Lx, C.; Sun, Y. Experimental study on uniaxial and nonproportionally multiaxial ratcheting of SS304 stainless steel at room and high temperatures. Nucl. Eng. Des. 2002, 216, 13–26. [Google Scholar] [CrossRef]
- Meggiolaro, M.A.; Castro, J.T.P. Evaluation of multiaxial stress-strain models and fatigue life prediction methods under proportional loading. In Mechanics of Solids in Brazil 2009; da Costas Mattos, H.S., Alves, M., Eds.; Brazilian Society of Mechanical Science and Engineering: Rio de Janeiro, Brazil, 2009; pp. 365–384. [Google Scholar]
- Razmjoo, G. Fatigue of load-carrying fillet welded joints under multiaxial loading. In Proceedings of the 5th International Conference on Biaxial/multiaxial Fatigue & Fracture, Cracow, Poland, 8–12 September 1997; pp. 53–70. [Google Scholar]
- Pejkowski, Ł.; Skibicki, D.; Sempruch, J. High-Cycle Fatigue Behavior of Austenitic Steel and Pure Copper under Uniaxial, Proportional and Non-Proportional Loading. J. Mech. Eng. 2014, 60, 549–560. [Google Scholar] [CrossRef]
- Yousefi, F.; Witt, M.; Zenner, H. Fatigue strength of welded joints under multiaxial loading: Experiments and calculations. Fatigue Fract. Eng. Mater. Struct. 2001, 24, 339–355. [Google Scholar] [CrossRef]
- Siljander, A.; Kurath, P.; Lawrence, F. Nonproportional fatigue of welded structures. In Advances in Fatigue Lifetime Predictive Techniques; ASTM International: West Conshohocken, PA, USA, 1992. [Google Scholar]
- Facheris, G.; Janssens, K.; Foletti, S. Multiaxial fatigue behavior of AISI 316L subjected to strain-controlled and ratcheting paths. Int. J. Fatigue 2014, 68, 195–208. [Google Scholar] [CrossRef]
- Chaves, V.; Navarro, A.M.; Madrigal, C. Stage I crack directions under in-phase axial–torsion fatigue loading for AISI 304L stainless steel. Int. J. Fatigue 2015, 80, 10–21. [Google Scholar] [CrossRef]
- Suresh, S.; Ritchie, R.O. Propagation of short fatigue cracks. Int. Mater. Rev. 1984, 29, 445–475. [Google Scholar] [CrossRef]


Publisher’s Note: MDPI stays neutral with regard to jurisdictional claims in published maps and institutional affiliations. |
© 2022 by the authors. Licensee MDPI, Basel, Switzerland. This article is an open access article distributed under the terms and conditions of the Creative Commons Attribution (CC BY) license (https://creativecommons.org/licenses/by/4.0/).