Article

Effect of Fe/SiO2 Ratio and Fe2O3 on the Viscosity and Slag Structure of Copper-Smelting Slags

1
Key Laboratory for Ecological Metallurgy of Multimetallic Mineral (Ministry of Education), Northeastern University, Shenyang 110819, China
2
School of Metallurgy, Northeastern University, Shenyang 110819, China
*
Author to whom correspondence should be addressed.
Metals 2022, 12(1), 24; https://doi.org/10.3390/met12010024
Submission received: 8 October 2021 / Revised: 14 December 2021 / Accepted: 16 December 2021 / Published: 23 December 2021

Abstract

:
Secondary copper smelting is an effective means of treating waste resources. During the smelting process, the viscous behavior of the smelting slags is essential for smooth operation. Therefore, the effects of Fe/SiO2 ratio and Fe2O3 contents on the viscous behavior of the FeO−Fe2O3−SiO2−8 wt%CaO−3 wt%MgO−3 wt%Al2O3 slag system were investigated. The slag viscosity and activation energy for viscous flow decrease with increasing Fe/SiO2 from 0.8 to 1.2, and increase as the Fe2O3 content increases from 4 wt% to 16 wt% at Fe/SiO2 ratio of 1.2. However, under the conditions of Fe/SiO2 of 0.8 and 1.0, the viscosity and activation energy for viscous flow show a minimum value at Fe2O3 content of 12 wt%. Fe2O3 exhibits amphoteric properties. In addition, the increase in Fe2O3 content raises the breaking temperature of the slag, while the Fe/SiO2 ratio has the opposite effect. Fourier transform infrared spectroscopy (FTIR) and Raman spectroscopy show that increases in Fe/SiO2 ratio lead to simplification of the silicate network structure, while increases in Fe2O3 content improves the formability of the network. This study provides theoretical support for the related research and application of secondary copper smelting.

1. Introduction

The mixed feed containing primary and secondary raw materials is and has long been a standard operating procedure in the copper-smelting industry. In particular, in the production practice of oxygen-enriched bottom-blow smelting, the separation of copper matte from slag is achieved by mixing gold concentrate, copper concentrate, flux, and secondary resources for smelting. As the copper matte is an excellent solvent for gold and silver, most of the precious metals are dissolved into the copper matte, thus realizing the recovery of gold and silver [1,2]. Secondary copper resources generally include industrial residues, sludge, and domestic waste rich in copper or precious metals. Secondary resources can be reduced and rendered harmless and simultaneously multimetal (copper, gold, silver, etc.) components can be recovered together by dispensing secondary resources into the smelter.
As a by-product of the secondary copper smelting process, iron–silicate–based slag (usually this slag contains significant amounts of Fe2O3 and traces of CaO and Al2O3) is formed in the smelter that must be tapped out at the end of the process. It has been reported that the fayalite phase precipitates formed in iron–silicate slag at approximately 1473 K increases slag viscosity [3]. At a comparatively low slag temperature of approximately 1370 K, silicate phases containing iron and calcium precipitate that increase slag viscosity even further [4]. When the iron content in the slag is high, the magnetite phase also precipitates in the slag, existing as a fine and diffuse suspended solid in the high-temperature melt [4]. The viscosity of slag is critical to the smooth operation of the process because high viscosity causes several issues, including high copper losses and reduced metallurgical reaction rates, which are common in the secondary copper smelting, particularly for slags with high Fe2O3 content. Therefore, an in-depth understanding of the physical properties of slags containing Fe2O3 and the role of iron oxides with different valences, in particular, is critical for optimizing the smelting process.
At present, studies on the role of iron oxides in the melt mainly focus on typical calcium–silicate−based slag systems, such as CaO−SiO2−Al2O3−FexO [5], CaO−SiO2−Al2O3−MgO−FeO [6,7,8], CaO−SiO2−Al2O3−MgO−FeTO−P2O5 [9], and CaO−SiO2−FeO−ZnO−Al2O3 [10], which are characterized by a high calcium–silica ratio. In comparison, less research has been performed on iron–silicate–based slags to date. The viscosity of iron–silicate slags is primarily measured under iron-saturated conditions [3,11,12,13,14]. As a result, almost all iron oxides present in the slag are in the form of divalent iron, and the role of trivalent iron in the slag is rarely reported. According to the literature [6,7,10], FeO is a network modifier with regular octahedral coordination, which decomposes to produce free oxygen. This depolymerizes the silicate network structure and reduces the slag viscosity. The role of Fe2O3 in the silicate structure, on the other hand, is still being debated [15]. In slag, Fe3+, similar to Al3+ and Ti4+, is an amphoteric ion capable of forming tetrahedral and octahedral structures [16,17,18]. Saito et al. [19] and Wright et al. [20] investigated the effect of Fe2O3 on the viscosity of 40 wt%CaO−40 wt%SiO2−20 wt%Al2O3 slag and iron–silicate slag, respectively, and found that the slag viscosity decreased with Fe2O3 addition. Mysen et al. [21] also reached the same conclusion in CaO−SiO2−Fe−O system; they observed that the viscosity decreased distinctly as the Fe2O3 content reached 5 wt% compared to iron-free melts. In addition, Sasaki et al. [22] discovered that the role of Fe3+ ions in sodium silicate melts (Na2O–SiO2–FeO–Fe2O3), which increased viscosity. Similarly, Viswanathan et al. [23] found that when the Fe2O3 content exceeds 7% in the 68%FexO−32%SiO2 slag system, the viscosity increases sharply. Furthermore, the slag’s Fe/SiO2 ratio is a critical indicator in determining slag viscosity. In the decreasing order of importance, the homogeneous liquid slag viscosity of iron–silicate metallurgical slag is affected by various factors: Fe/SiO2 ratio > temperature > alternative oxides, such as Al2O3, CaO, MgO, and Cu2O > Fe3+/Fe2+ ratio. Park et al. [24] explored the viscous behavior of copper-smelting slag and found that an increase in Fe/SiO2 ratio decreases the slag viscosity. Ducret et al. [12] observed that the FeO−Fe2O3−SiO2−CaO−MgO slag viscosity decreases significantly as the Fe/SiO2 ratio increases from 1.30 to 2.00. However, the extent to which factors affect the viscosity varies across slag systems and slag compositions. Therefore, it is necessary to conduct a systematic investigation on the viscous behaviors of the FeO−Fe2O3−SiO2−CaO−MgO−Al2O3 slags.
In this paper, the viscosity of the FeO−Fe2O3−SiO2−CaO−MgO−Al2O3 slag system was measured using the rotating spindle method. The breaking temperature, viscosity and activation energy for viscous flow was analyzed under high-temperature conditions with different Fe/SiO2 ratios (0.8−1.2) and Fe2O3 contents (4−16 wt%). In addition, the relationship between slag structure and viscosity was studied via FTIR and Raman spectroscopy. This paper will be of significance in the smelting treatment of secondary resources in the processes of copper industry.

2. Experimental

2.1. Sample Preparation

All chemicals, including SiO2, Fe2O3, MgO, Al2O3, CaO, and Fe powder, were of analytical reagent grade purity. Except the Fe powder, all reagents were preroasted at 1273 K for 2 h to remove any volatile impurities. The reagents were then precisely weighed and uniformly mixed according to the predetermined composition listed in Table 1. The composition of “FeO” was achieved by mixing Fe and Fe2O3 powder, where the molar ratio of Fe and Fe2O3 was set to 1.0. On this basis, additional Fe2O3 was added to investigate the effect of Fe2O3 on the viscous behavior. The Fe/SiO2 ratio in sample slags is defined as the ratio of total Fe (sum of divalent and trivalent iron) to SiO2 content. The finely mixed samples were held in a molybdenum crucible and premelted at 1673 K for approximately 2 h under sufficient purging with 0.4 L/min Ar atmosphere. Subsequently, the liquid melt was poured into water for rapid quenching, and the bulk slag was then dried, crushed, and ground into powder for the next experiments.

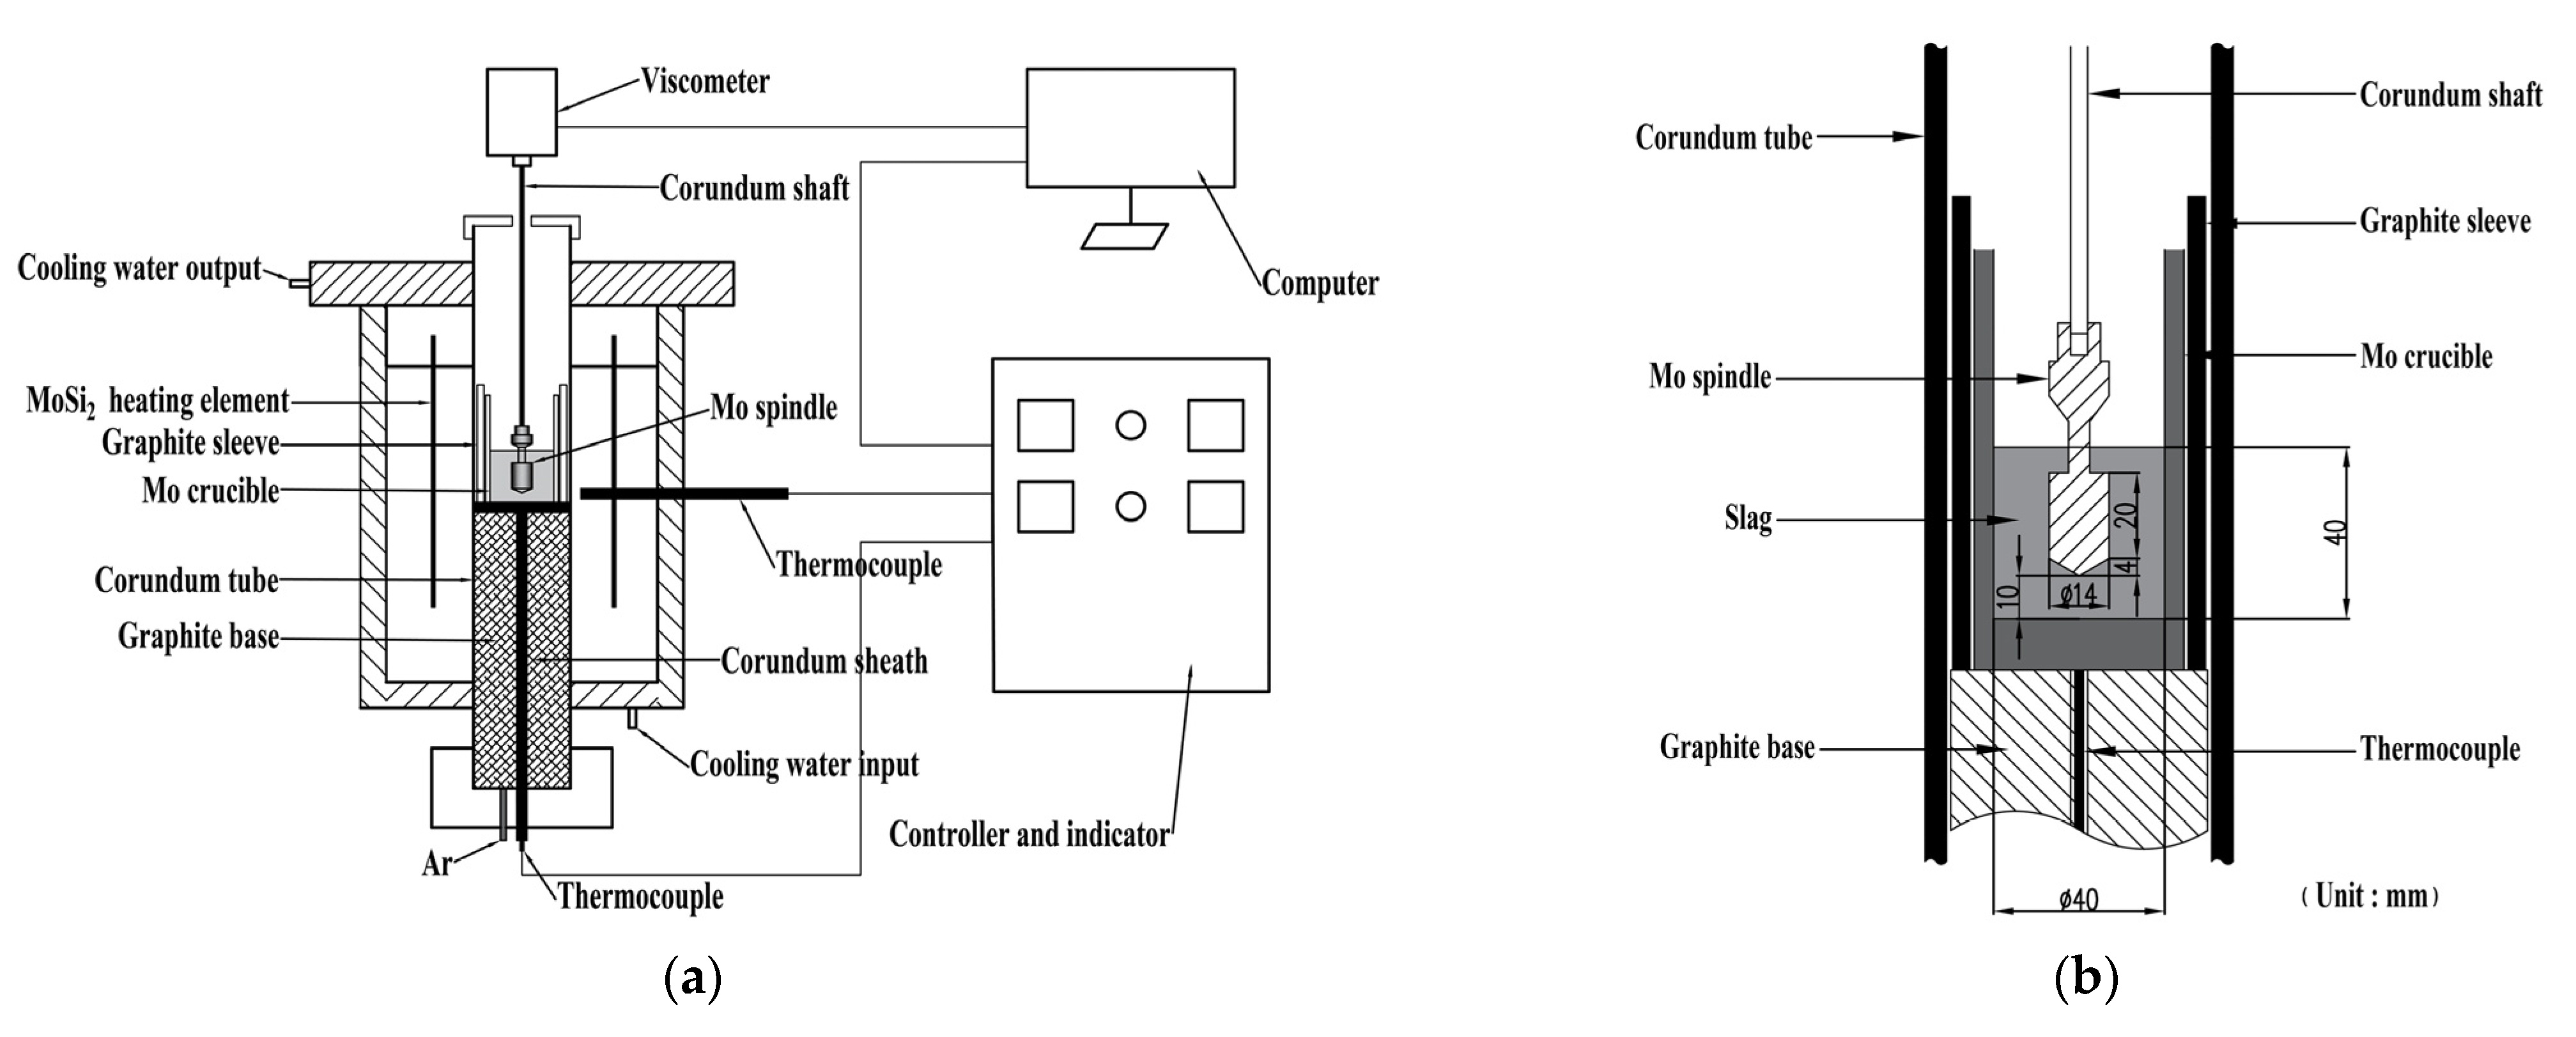
2.2. Experimental Apparatus

In this paper, we used the rotating column method to determine viscosity. Figure 1a,b show the experimental equipment and the sizes of the molybdenum crucible and spindle, respectively. The molybdenum spindle can be rotated using a corundum shaft attached to a digital viscometer (DV2TRV, Brookfield Engineering Labs., Inc., Middleborough, MA, USA), which was mounted on a lift, allowing the spindle to be submerged and removed from the slag. To prevent slag’s oxidation at high temperatures, a high purity graphite sleeve was placed between the corundum tube and molybdenum crucible. The slags were melted in a vertical resistance furnace with six U-shaped MoSi2 heating rods. A type B thermocouple (Pt−10 wt% Rh/Pt−13 wt% Rh) enclosed in a corundum sheath was placed directly below the crucible’s bottom and maintained within ±3 K of the target temperature in real-time using a PID controller. Before measurements, the viscometer was calibrated at room temperature with standard castor oils of varying concentrations.

2.3. Process for Viscosity Determination

For viscosity experiments, 170 g premelted slag was compacted and charged into a molybdenum crucible, which was placed on a graphite base in the uniform temperature zone of the furnace. The furnace was procedurally heated to 1673 K and held there for approximately 60 min. During the holding period, a fine molybdenum wire was inserted into the slag and stirred to accelerate the homogenization of the slag. Simultaneously, the molybdenum wire was further lowered to the bottom of the crucible and then immediately removed to confirm if the melt pool depth is approximately 40 mm. If not, an additional sample was added to ensure that the depth is appropriate. After the holding time, the spindle was gently dipped into the melt pool, eventually resting 10 mm above the crucible’s base. Then, the spindle is rotated to further mix and homogenize the slag. Throughout the experiment, 0.4 L/min of Ar was introduced into the furnace to prevent the slag’s oxidation.
In general, viscosity measurements were performed using a fixed-point test, i.e., holding the slag for a time at each temperature to obtain a uniform and stable slag [17,25,26]. In order to reduce the oxidation of Fe2+, shorten measurement time and obtain the relationship between viscosity and temperature over a wide range of intervals, viscosity measurements were conducted under continuous cooling cycles. Some other literature has also used continuous cooling methods for viscosity testing [10,27,28]. In the viscosity determination experiments, the resistance furnace was ramped up to 1673 K and then cooled with a rate of 3 K·min−1. The viscosity was measured at a maximum temperature of 1673 K with different spindle speeds before the cooling procedure. The findings demonstrate that the viscosity varies by 2% with different rotational speeds, confirming that slag at high temperatures exhibits Newtonian viscous behavior. Thus, a constant rotational speed of 12 r min−1 was chosen to measure the viscosity. The spindle rotation was stopped when the viscosity suddenly increased or reached the limit value of the instrument. In order to verify the reproducibility of the experiments, we selected samples numbered 1, 7, and 11 for repeat testing, and the results showed that the experiment was reproducible with an error of no more than 2%. After completing the viscosity test, the furnace was reheated to the initial maximum temperature of 1673 K. At this time, the spindle was raised from the melt and the slag was poured into water for quenching.
Figure 2 shows the X-ray diffraction (XRD; D8 ADVANCE, Bruker, Rheinstetten, Germany) profile of the quenched slag, which confirms the amorphous state of the sample and represents the structure of the slag at high temperatures. According to the results presented in Table 1, the chemical composition of the quenched samples reveled by X-ray fluorescence spectroscopy (XRF, ZSX Primus II, Rigaku Corporation, Tokyo, Japan) exhibits no significant changes before and after the experiment. It should be noted that the almost negligible MoO3 content shown by XRF confirms that there is no significant chemical reaction between molybdenum and iron. Therefore, MoO3 can be ignored during the viscosity measurements. In our experiments, the maximum measurement error of XRF did not exceed 0.5%. The classical K2Cr2O7 titration method was used to determine the presence of Fe2+ in quenched slag. The Fe3+ content of the slag is calculated by subtracting the Fe2+ content from the total Fe content. In addition, the microstructure of the quenched slag was characterized through FTIR (VERTEX70, Bruker, Rheinstetten, Germany) and Raman (HR800, Jobin Yvon, Palaiseau, France) spectroscopy.

3. Results and Discussion

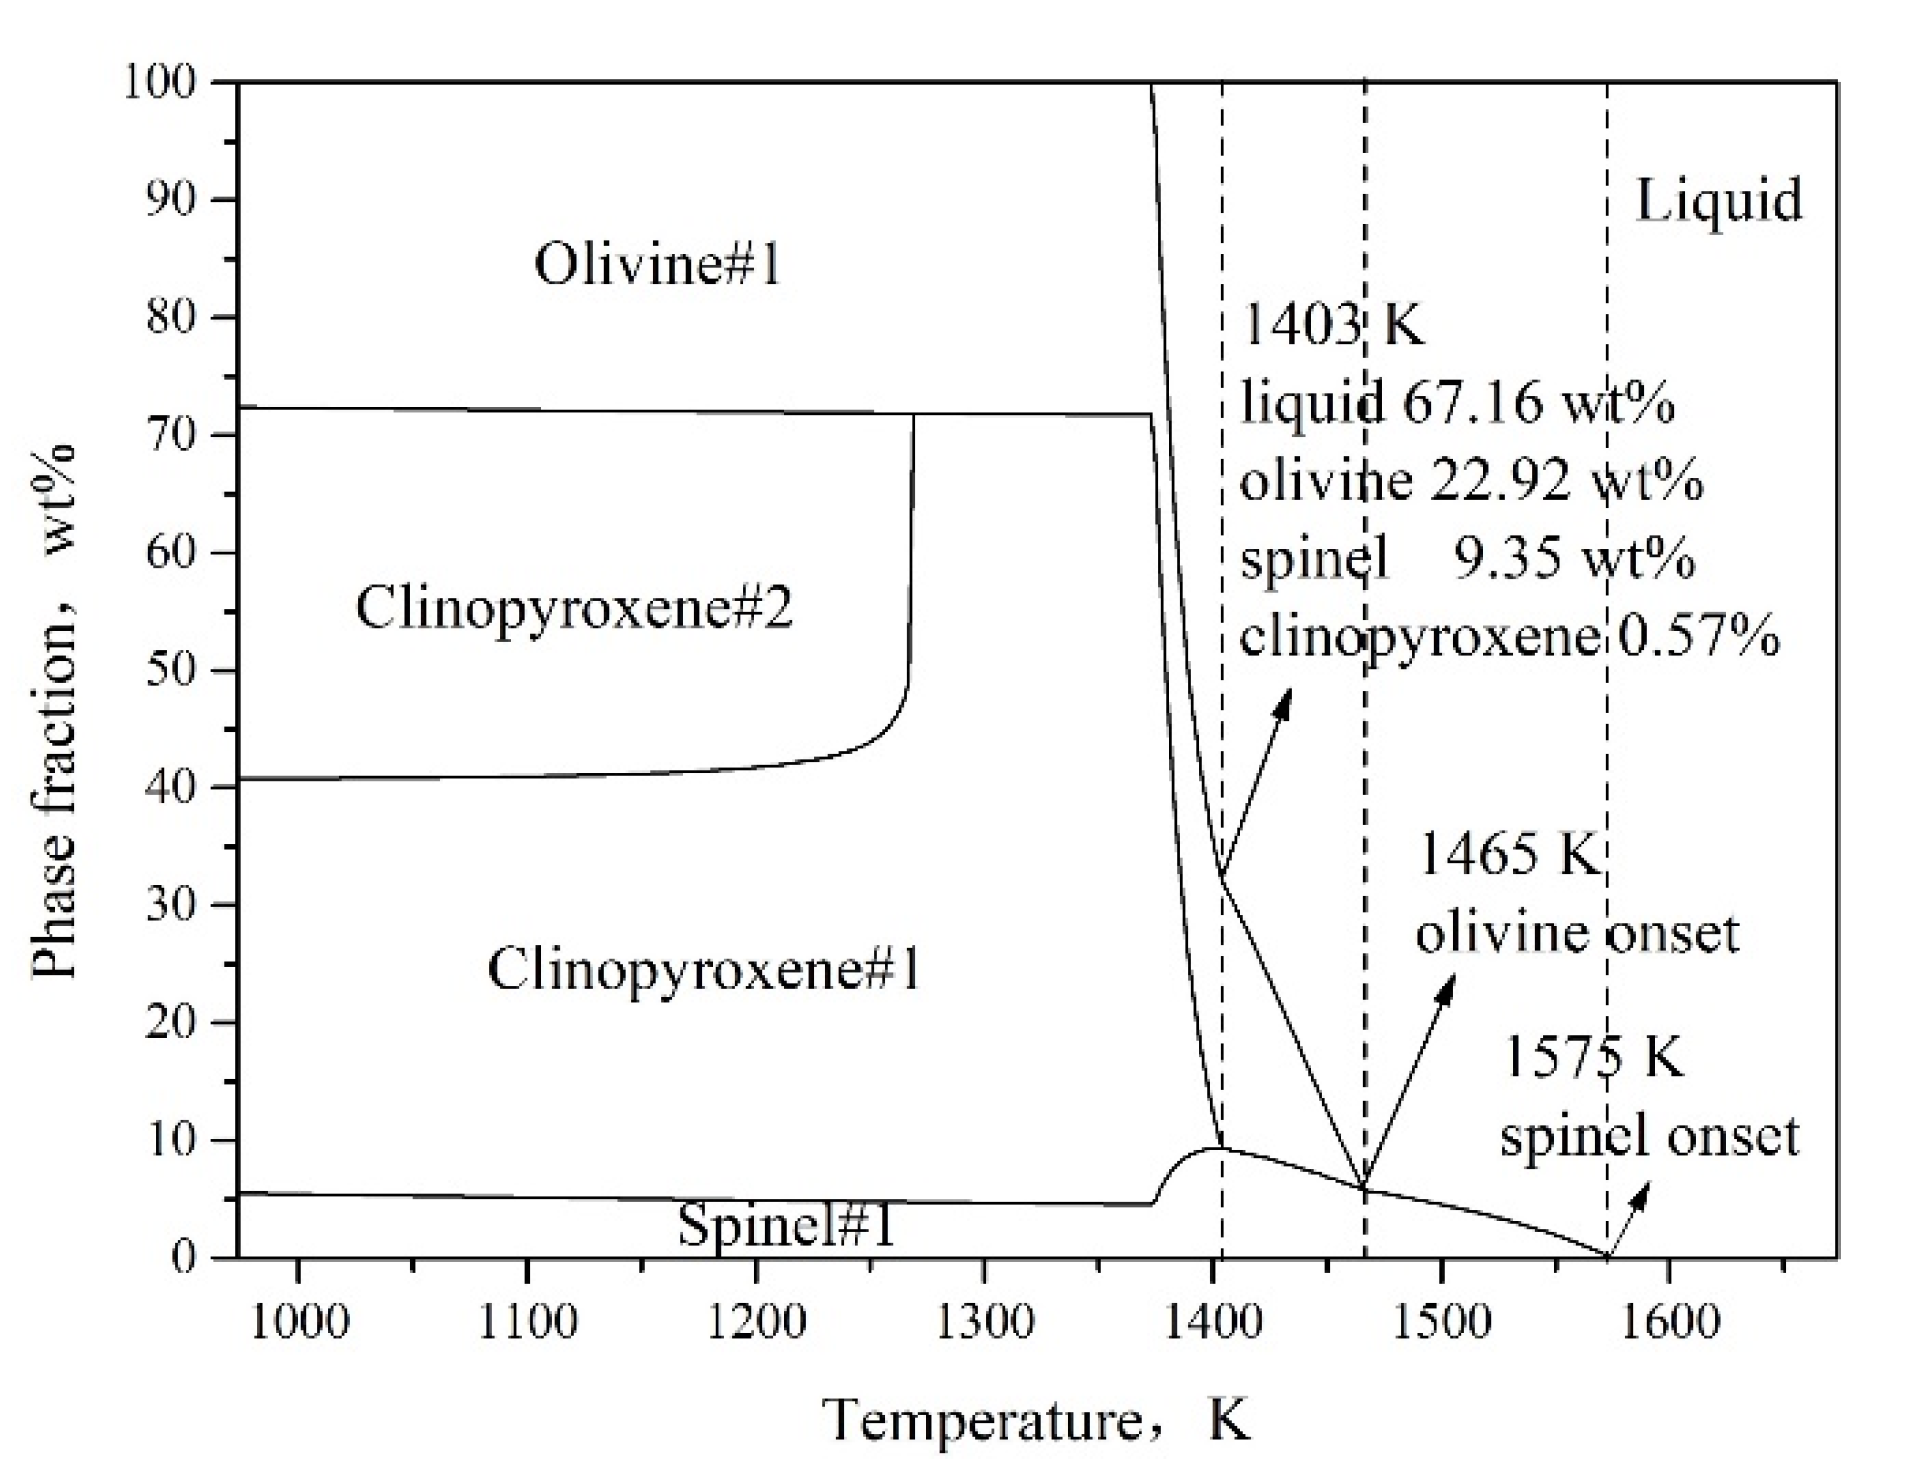
3.1. Effect of Fe/SiO2 on the Breaking Temperature

The viscosity of the FeO−Fe2O3−SiO2−CaO−MgO−Al2O3 fluxes versus temperature at fixed Fe2O3 contents for different Fe/SiO2 ratios is plotted in Figure 3. The viscosity increases slowly with decreasing temperature, as predicted. When the temperature falls below a certain threshold, the viscosity rapidly increases, and an obvious inflection point appears on the viscosity-temperature curve, namely the breaking temperature (TBk) [29,30], which has been marked in the curves of Figure 3. It is noticed that at fixed Fe2O3 contents, the TBk value gradually decreases as the Fe/SiO2 ratio increases from 0.8 to 1.2, and this trend is more pronounced at higher Fe2O3 content. This is due to the increase of Fe/SiO2 makes the absolute amount of FeO in the slag increase. Slags containing high melting point substances are said to have higher breaking temperatures as well as greater crystallization ability [25]. FeO has a lower melting temperature (1642 K) than other oxides, allowing it to expand the area of solid–liquid coexistence. In addition, FeO can combine with SiO2 to form the fayalite phase, which has a much lower melting point (1478 K). Specifically, Figure 4a–c give the results of cooling precipitation calculations for spinel, fayalite and clinopyroxene phases present in the slag at 1373–1473 K for an Fe2O3 content of 4 wt%, respectively. It can be seen that spinel, fayalite and clinopyroxene phases are present in the slag for different Fe/SiO2 ratios (0.8, 1.0 and 1.2). With the increase of Fe/SiO2 ratio, although the spinel phase slightly increases at this time, the fayalite phase with a lower melting point in the slag is the majority and gradually increases, whereas the content of clinopyroxene phase with a higher melting point gradually decreases, thus leading to the decrease of TBk.
The calculated cooling phase equilibrium of the slag at 1673–973 K (Fe/SiO2 = 1.0, Fe2O3 = 8 wt%) is given in Figure 5. According to Figure 5, with cooling, the spinel phase began to precipitate at 1575 K, accounting for 0.04%. The iron olivine phase began to precipitate at 1465 K, accounting for about 0.41%, at which time the spinel precipitation had reached 5.89%. With the continuation of cooling, the pyroxene phase began to precipitate at 1403 K, accounting for 0.57%, at which time the spinel accounted for 9.35% and the iron olivine phase accounted for 22.92%. It can be seen that with the continuous cooling, the type and quantity of solids precipitated from the slag are increasing, thus causing the slag viscosity to rise continuously.

3.2. Effect of Fe/SiO2 on the Slag Viscosity

The viscosity of the FeO−Fe2O3−SiO2−8-wt% CaO−3-wt% MgO−3-wt% Al2O3 melt concerning Fe/SiO2 ratio at 1523 and 1473 K is shown in Figure 6a. The viscosity of all slags decreases with increasing Fe/SiO2 ratio at a given temperature, and this trend is more pronounced at low temperatures and Fe/SiO2 ratios, whereas at high temperatures and Fe/SiO2 ratios, this effect becomes less significant. For example, at a low temperature of 1473 K and Fe2O3 content of 16 wt%, the viscosity decreases remarkably by 0.75 Pa·s with increase in Fe/SiO2 ratio from 0.8 to 1.0. However, when Fe/SiO2 ratio continues to increase to 1.2, viscosity decreased by only a small amount of 0.31 Pa·s. At a higher temperature of 1523 K, the viscosity decreases by 0.42 Pa·s when Fe/SiO2 increases from 0.8 to 1.0, which is weaker than that at 1473 K. Continue to increase Fe/SiO2 to 1.2, the viscosity change is 0.27 Pa·s, which also became relatively weaker.
The iron–silicate slag contains several complex silicate network structures consisting of a large number of [SiO4]4− tetrahedral units connected by bridge oxygen. As Fe/SiO2 ratio increases, the absolute amount of FeO in the slag increases. The decomposition of FeO generated a large amount of free oxygen (O2−), which will react with the bridge oxygen to produce nonbridge oxygen, causing the complex network structure to depolymerize. The disappearance of the network structure causes a reduction in slag viscosity. Conversely, as Fe/SiO2 ratio increases, the absolute content of SiO2 in the melt decreases, and the majority of the complex network structure simplify. As a result, a subsequent increase of the Fe/SiO2 exhibits a weakened effect in reducing the viscosity. In addition, high temperatures can destroy the slag network structure because excess heat can supply sufficient energy to destroy the remaining complex network structure and thus, reduce the viscosity [31]. Therefore, at a high temperature of 1523 K, the increase in Fe/SiO2 has no obvious effect on the depolymerization because, more silica–oxygen tetrahedral network structures are depolymerized relative to 1473 K.
Figure 6b shows the effect of Fe/SiO2 ratio on the viscosity of the studied melt system, as calculated by Factsage 7.3. The predicted results are consistent with the variation trend of the measured results. As Fe/SiO2 ratio increases, the viscosity decreases. However, the measured viscosity value is slightly higher than the predicted value, which may be due to the difference in oxygen potential, where some Fe2+ oxidizes to Fe3+ during the cooling process. According to the literature [18,19], Fe3+ is an amphoteric ion that can form both tetrahedral and octahedral structures; the tetrahedral structure is predominant and exists as a network polymer. When Fe2+ is oxidized to Fe3+, their coordination structure in the slag shifts from octahedral to tetrahedral, and the slag’s local cohesion increases, increasing the viscosity [32].

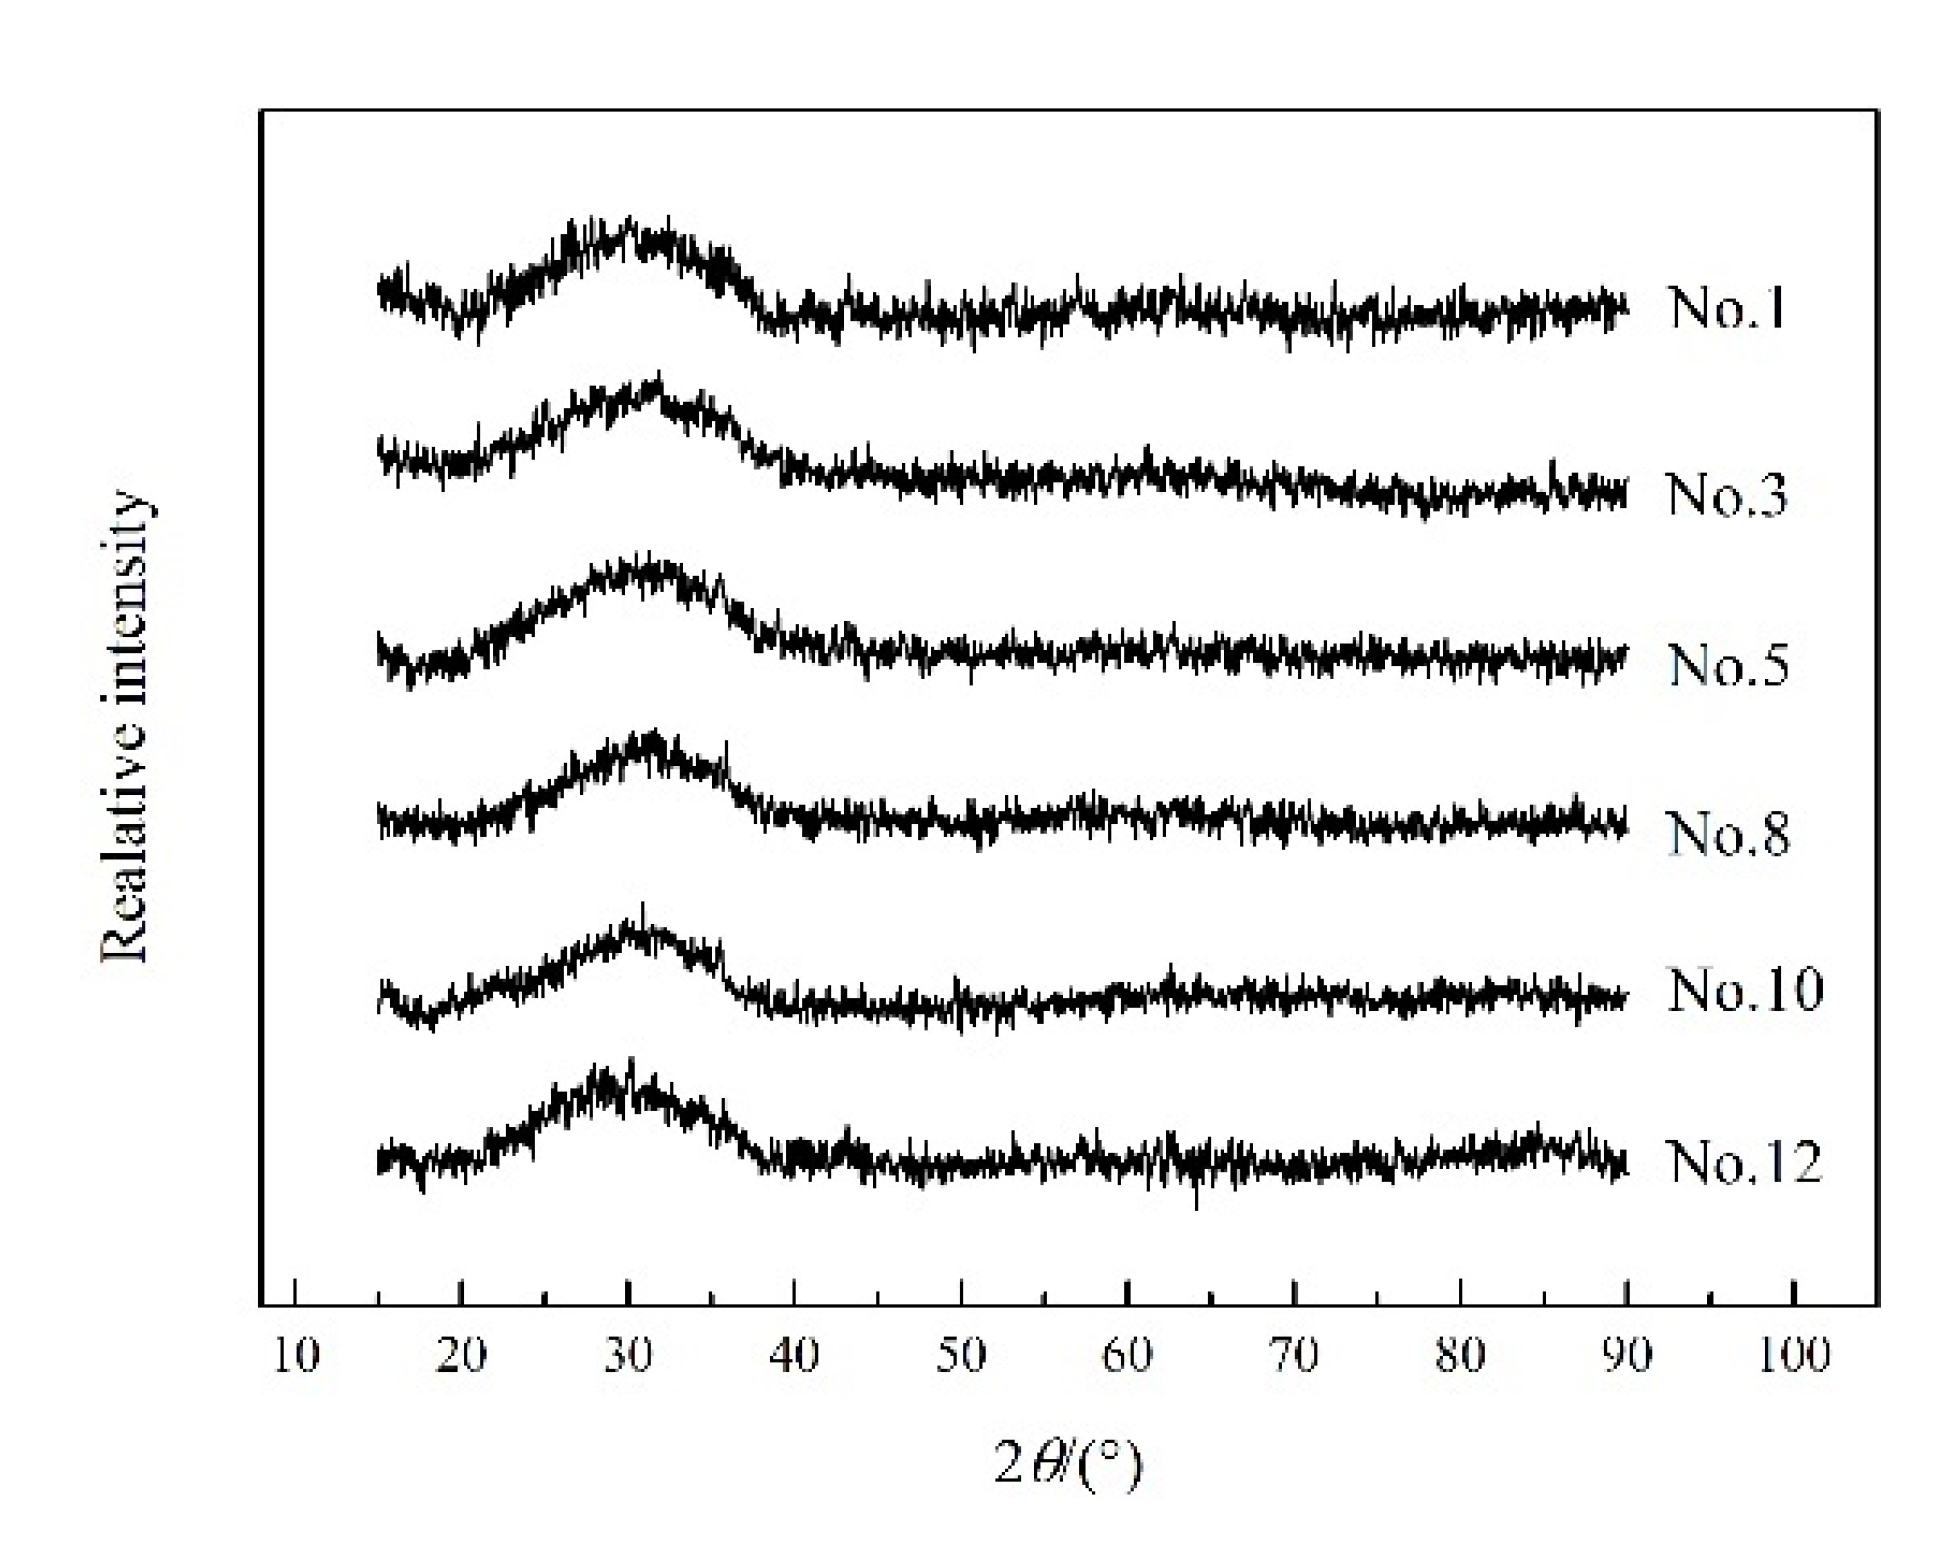
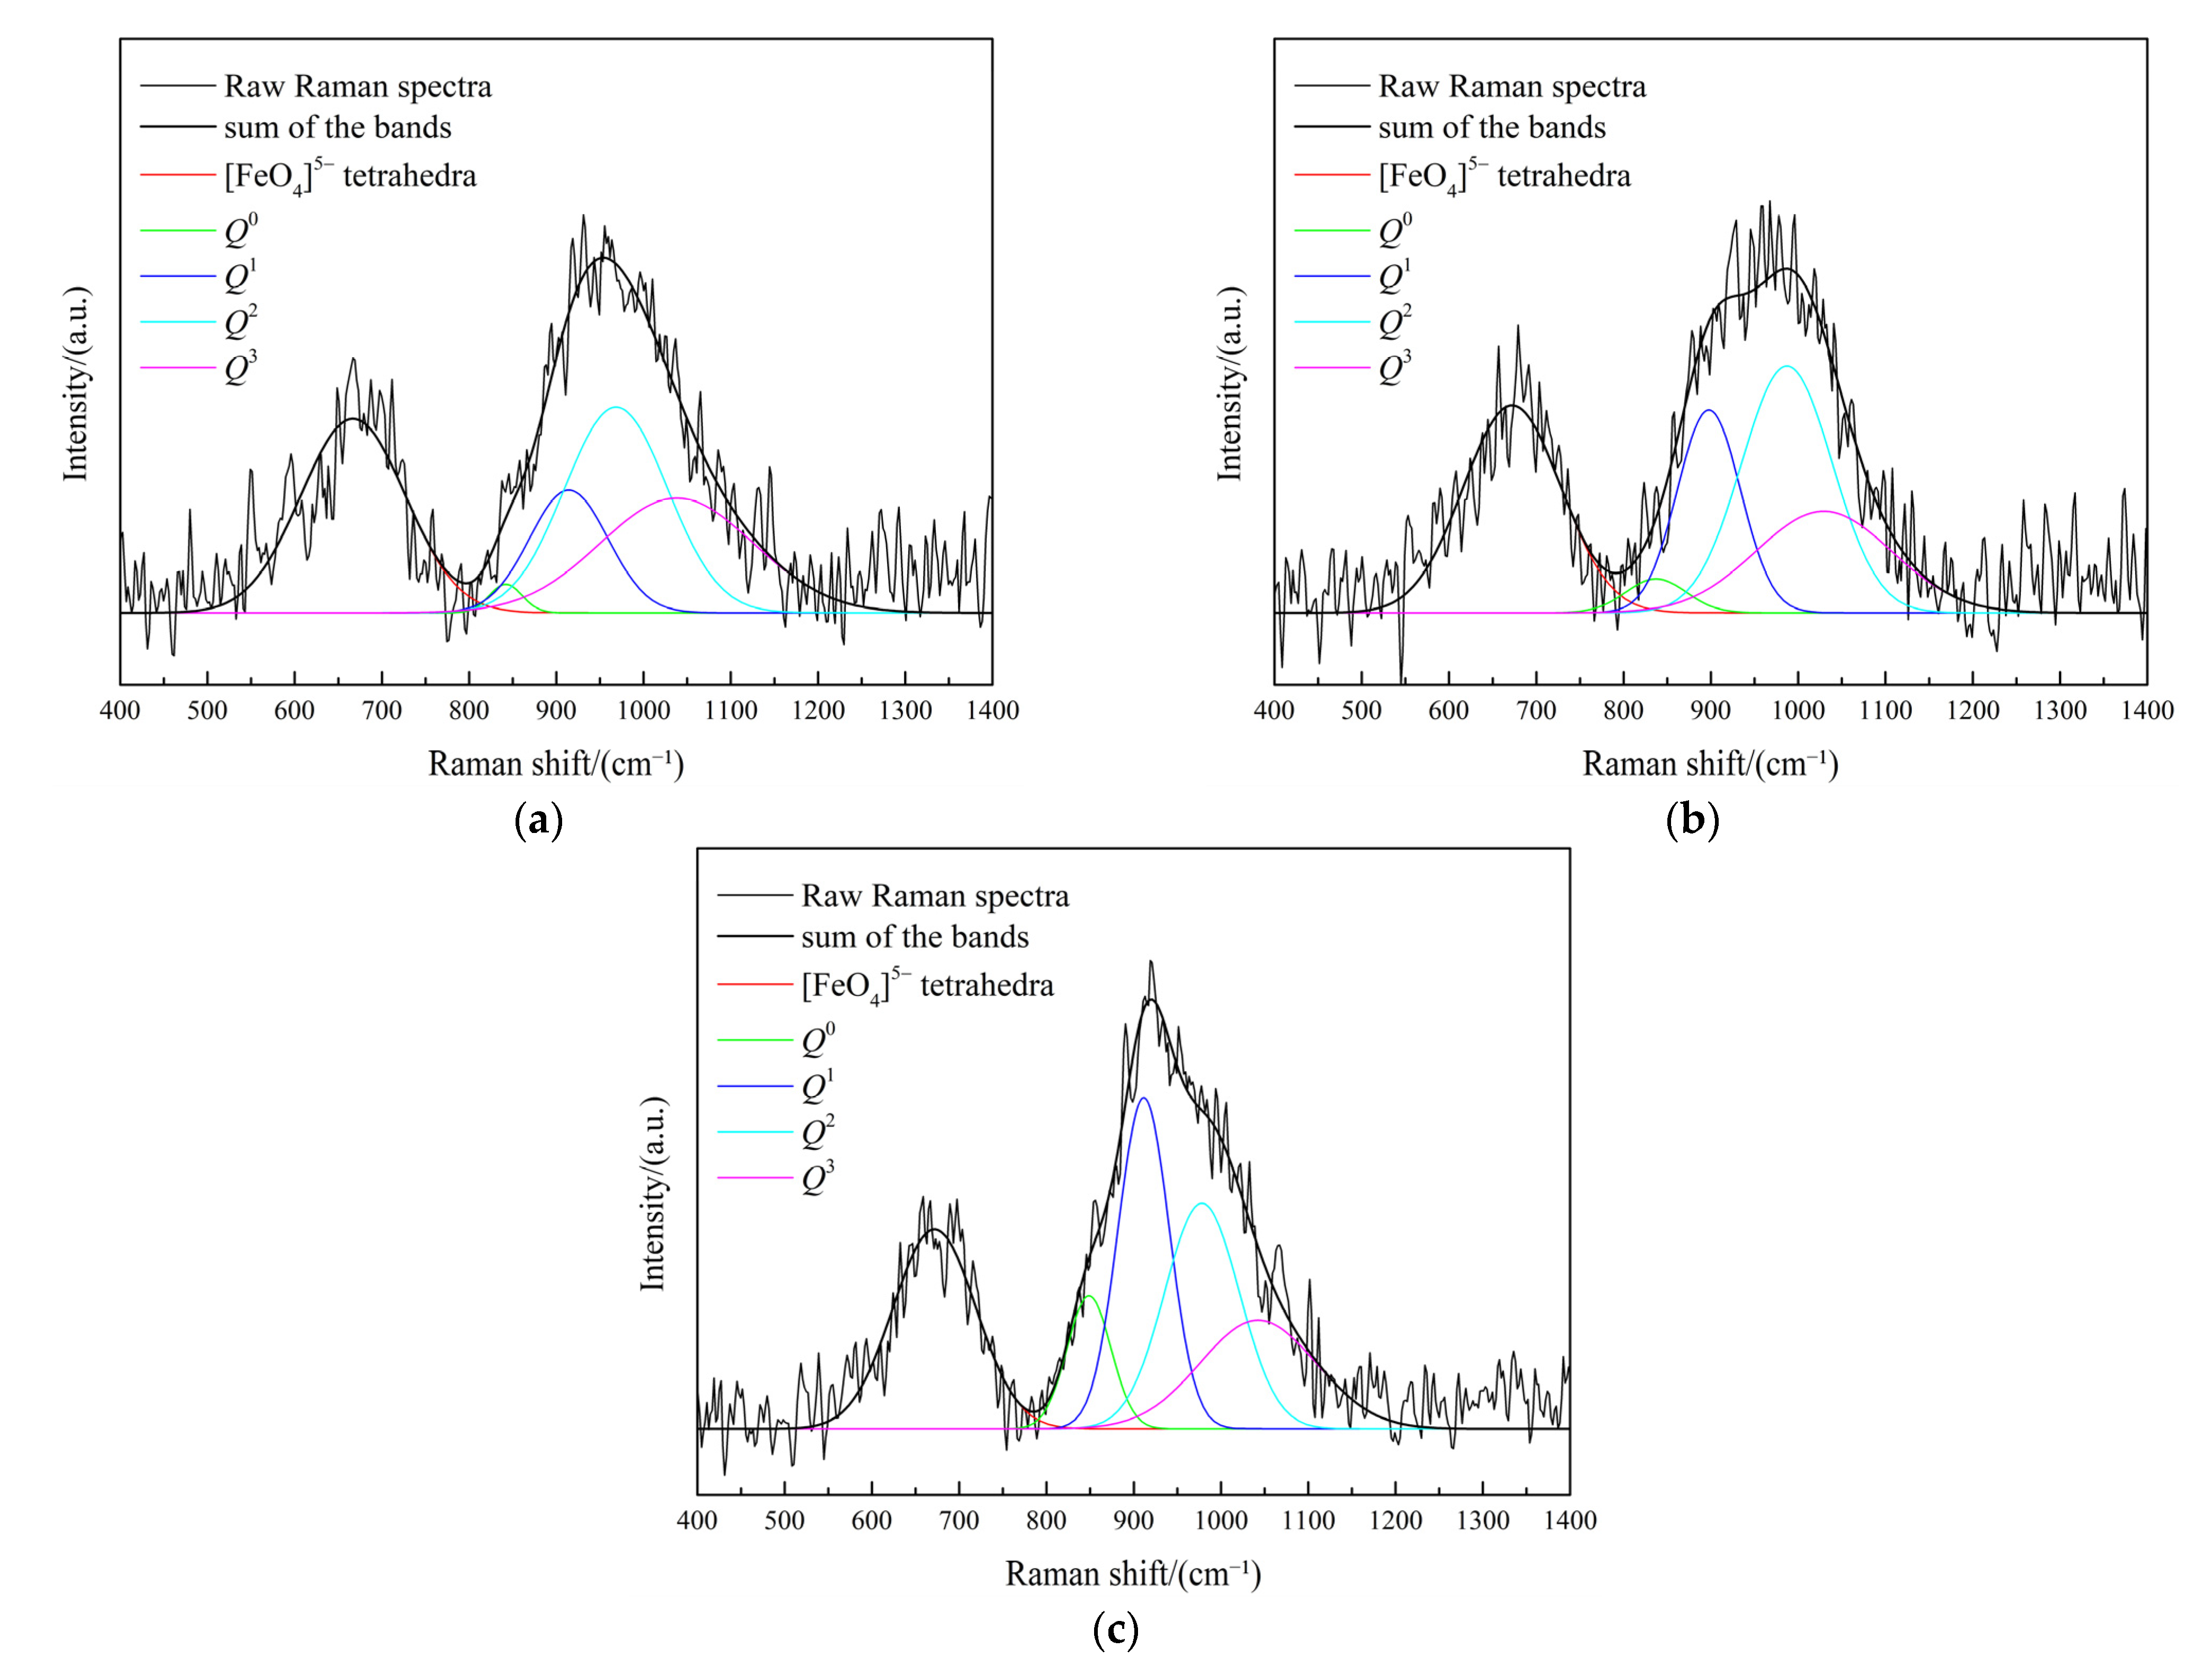
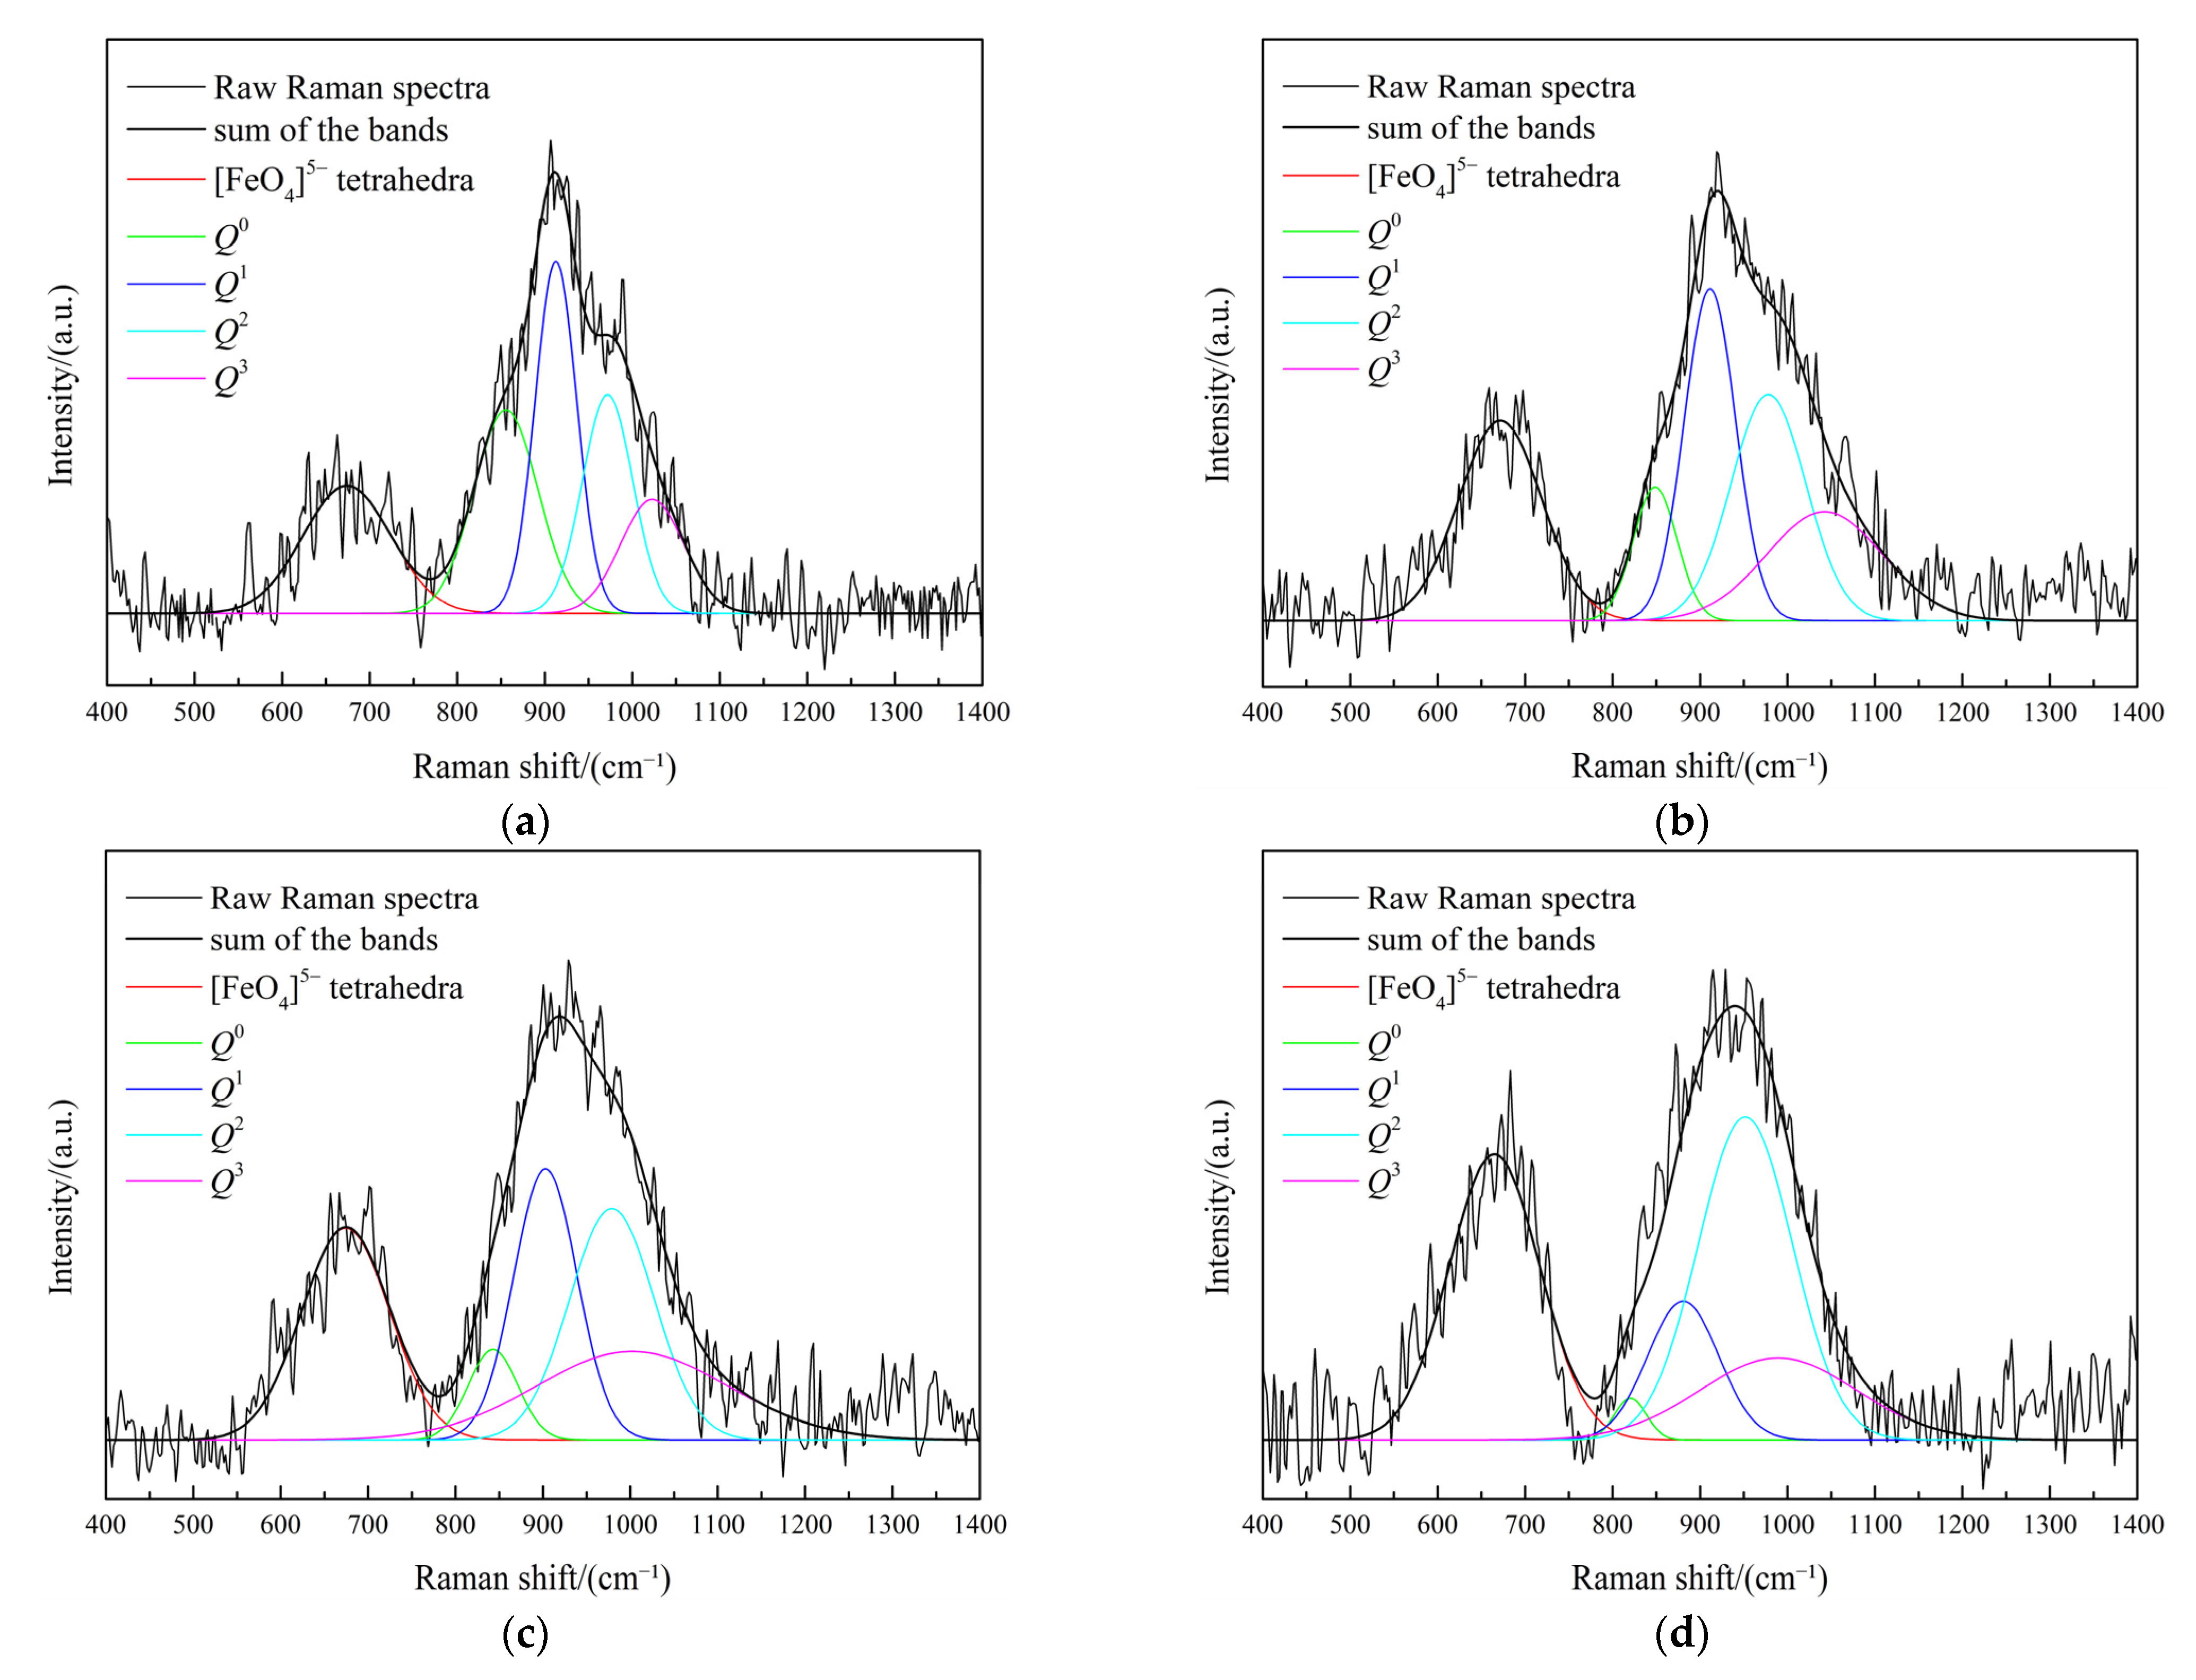
3.3. Effect of Fe/SiO2 on the Slag Structure

In this section, FTIR and Raman spectra was analyzed to characterize the quenched slag structure. Figure 7a,b show the effects of Fe/SiO2 ratio on the FTIR spectrum of the studied slag system with a fixed Fe2O3 content of 12 and 16 wt%, respectively. The FTIR spectrum of silicate slag typically falls between 1200 and 400 cm−1. The [SiO4]4− tetrahedron has a symmetrical stretching vibrational band in the 1200–750 cm−1 range [33]. The asymmetric stretching vibration band of the [AlO4]5− tetrahedral has been identified at around 620 cm−1 [10]. The characteristic vibrational band at approximately 500 cm−1 belongs to the Si−O symmetric bending vibration [24,31].
As visible in Figure 7a, the lower limit of the characteristic symmetric stretching vibration band of [SiO4]4− tetrahedra shifts from 778 to 755 cm−1 with increasing Fe/SiO2 ratio from 0.8 to 1.2 at 12 wt% of Fe2O3. In particular, the convoluted band’s width widens and intensity decreases, implying an increase in the spacing of Si and O in the [SiO4]4− structure and depolymerization of the slag structure. Furthermore, as Fe/SiO2 increases, the groove depth of the Si−O vibration band at approximately 500 cm−1 becomes shallower, revealing the disappearance of the complex silicate structure.
It is noteworthy that as Fe2O3 content increases, the position of the characteristic symmetric stretching vibration band of [SiO4]4− tetrahedra in Figure 7b shifts left (toward large wave number) relative to Figure 7a, i.e., the variation range of the lower limit of the band shifts from 778−755 cm−1 at 12 wt% Fe2O3 to 790−764 cm−1 at 16 wt% Fe2O3, indicating that Fe2O3 behaves as an acidic oxide and Fe3+ exists as a network former with tetrahedral coordination, making the silicate network structure more complex. Furthermore, there are no observable changes in the vibration bands of the [AlO4]5− tetrahedra at approximately 620 cm−1 or the vibration band of the [FeO4]5− tetrahedra at approximately 690 cm−1.
Raman spectra were obtained to further investigate the complex anionic silicate structures in slags. The deconvoluted peak plots of the Raman spectra are shown in Figure 8, and the results are listed in Table 2. The silicate structural vibration peak can be seen as a large hump between 800 and 1200 cm−1. The high content of Fe3+ in the slag allows the appearance of [FeO4]5− tetrahedral stretching vibration band at approximately 690 cm−1 [34]. With reference to the research by Mysen et al. [35,36], the original Raman spectrum was processed using the Gaussian-deconvolution method with the minimum correlation coefficient r2 ≥ 0.99. In this study, the concept of Qn is adopted to represent the structural unit of the symmetric stretching band of [SiO4]4− tetrahedra, where n represents the number of bridging oxygen present in each [SiO4]4− tetrahedron. Qn is generally available in silicate structures as Q0, Q1, Q2, and Q3 forms, which exists in the shape of monomers ([SiO4]4−), dimers ([Si2O7]6−), chains ([SiO3]2−), and sheets ([Si2O5]2−), respectively [37,38]. The integrated area of the Qn can be used to calculate the number of structural units remaining in the melt. Changes in the average number of nonbridging oxygen (NBO/Si) can indicate variations in the silicate structure, and NBO/Si can be calculated roughly by multiplying the area fraction of Qn by the amount of nonbridging oxygen present in Qn, as shown in Formulae (1) and (2) [25,38,39]:
X Q i = A Q i / i = 0 4 A Q i
N B O / S i = 4 X Q 0 + 3 X Q 1 + 2 X Q 2 + X Q 3
where X Q i is the molar fraction of Qi, A Q i is the integrated area of Gaussian peak corresponding to Qi, and NBO/Si is the average number of non-bridging oxygen per silicon.
It is speculated from Figure 8 and Table 2 that as Fe/SiO2 ratios increases from 0.8 to 1.2 in the slag, the fractions of Q0 and Q1 structural units increase and Q2 and Q3 decrease. Similarly, the [FeO4]5− stretching vibrational band located at approximately 690 cm−1 decreases with increasing Fe/SiO2 ratio. Additionally, the number of NBO/Si increases with increasing Fe/SiO2 ratio as shown in Table 2. These results show that as Fe/SiO2 ratio increases, the degree of polymerization of the silicate network structure becomes more simplified, which is consistent with the changes in viscosity and FTIR results.

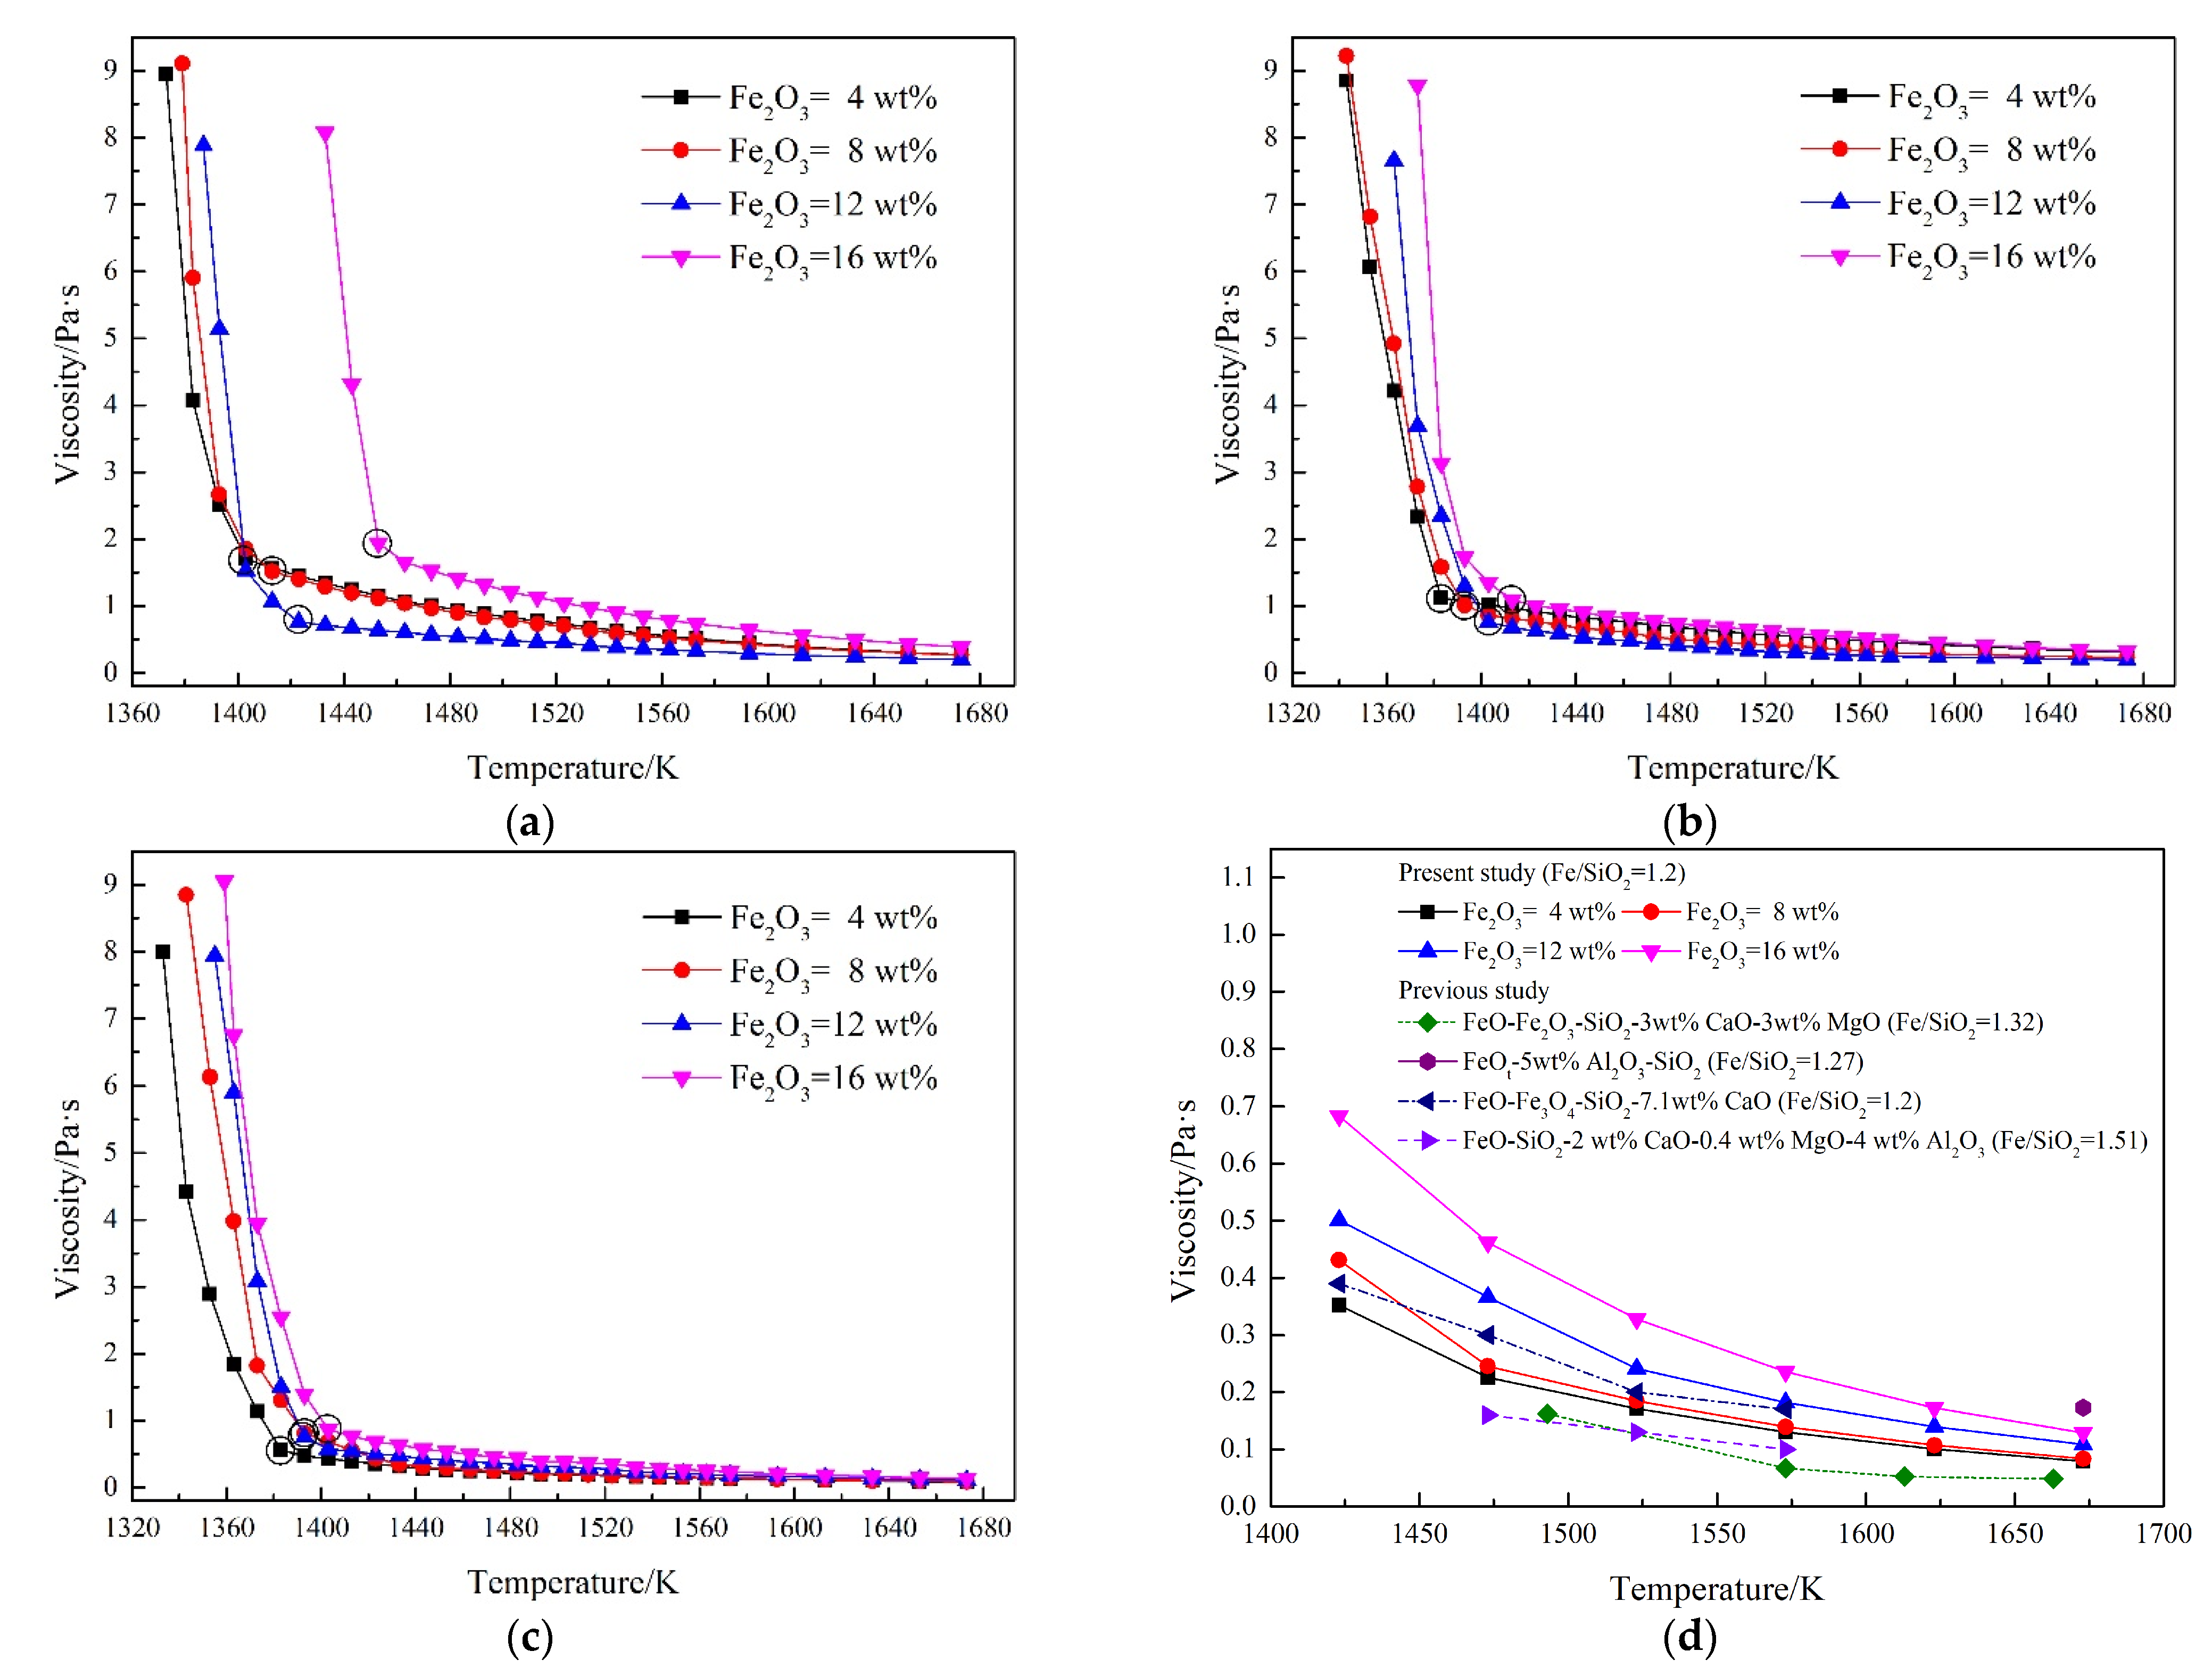
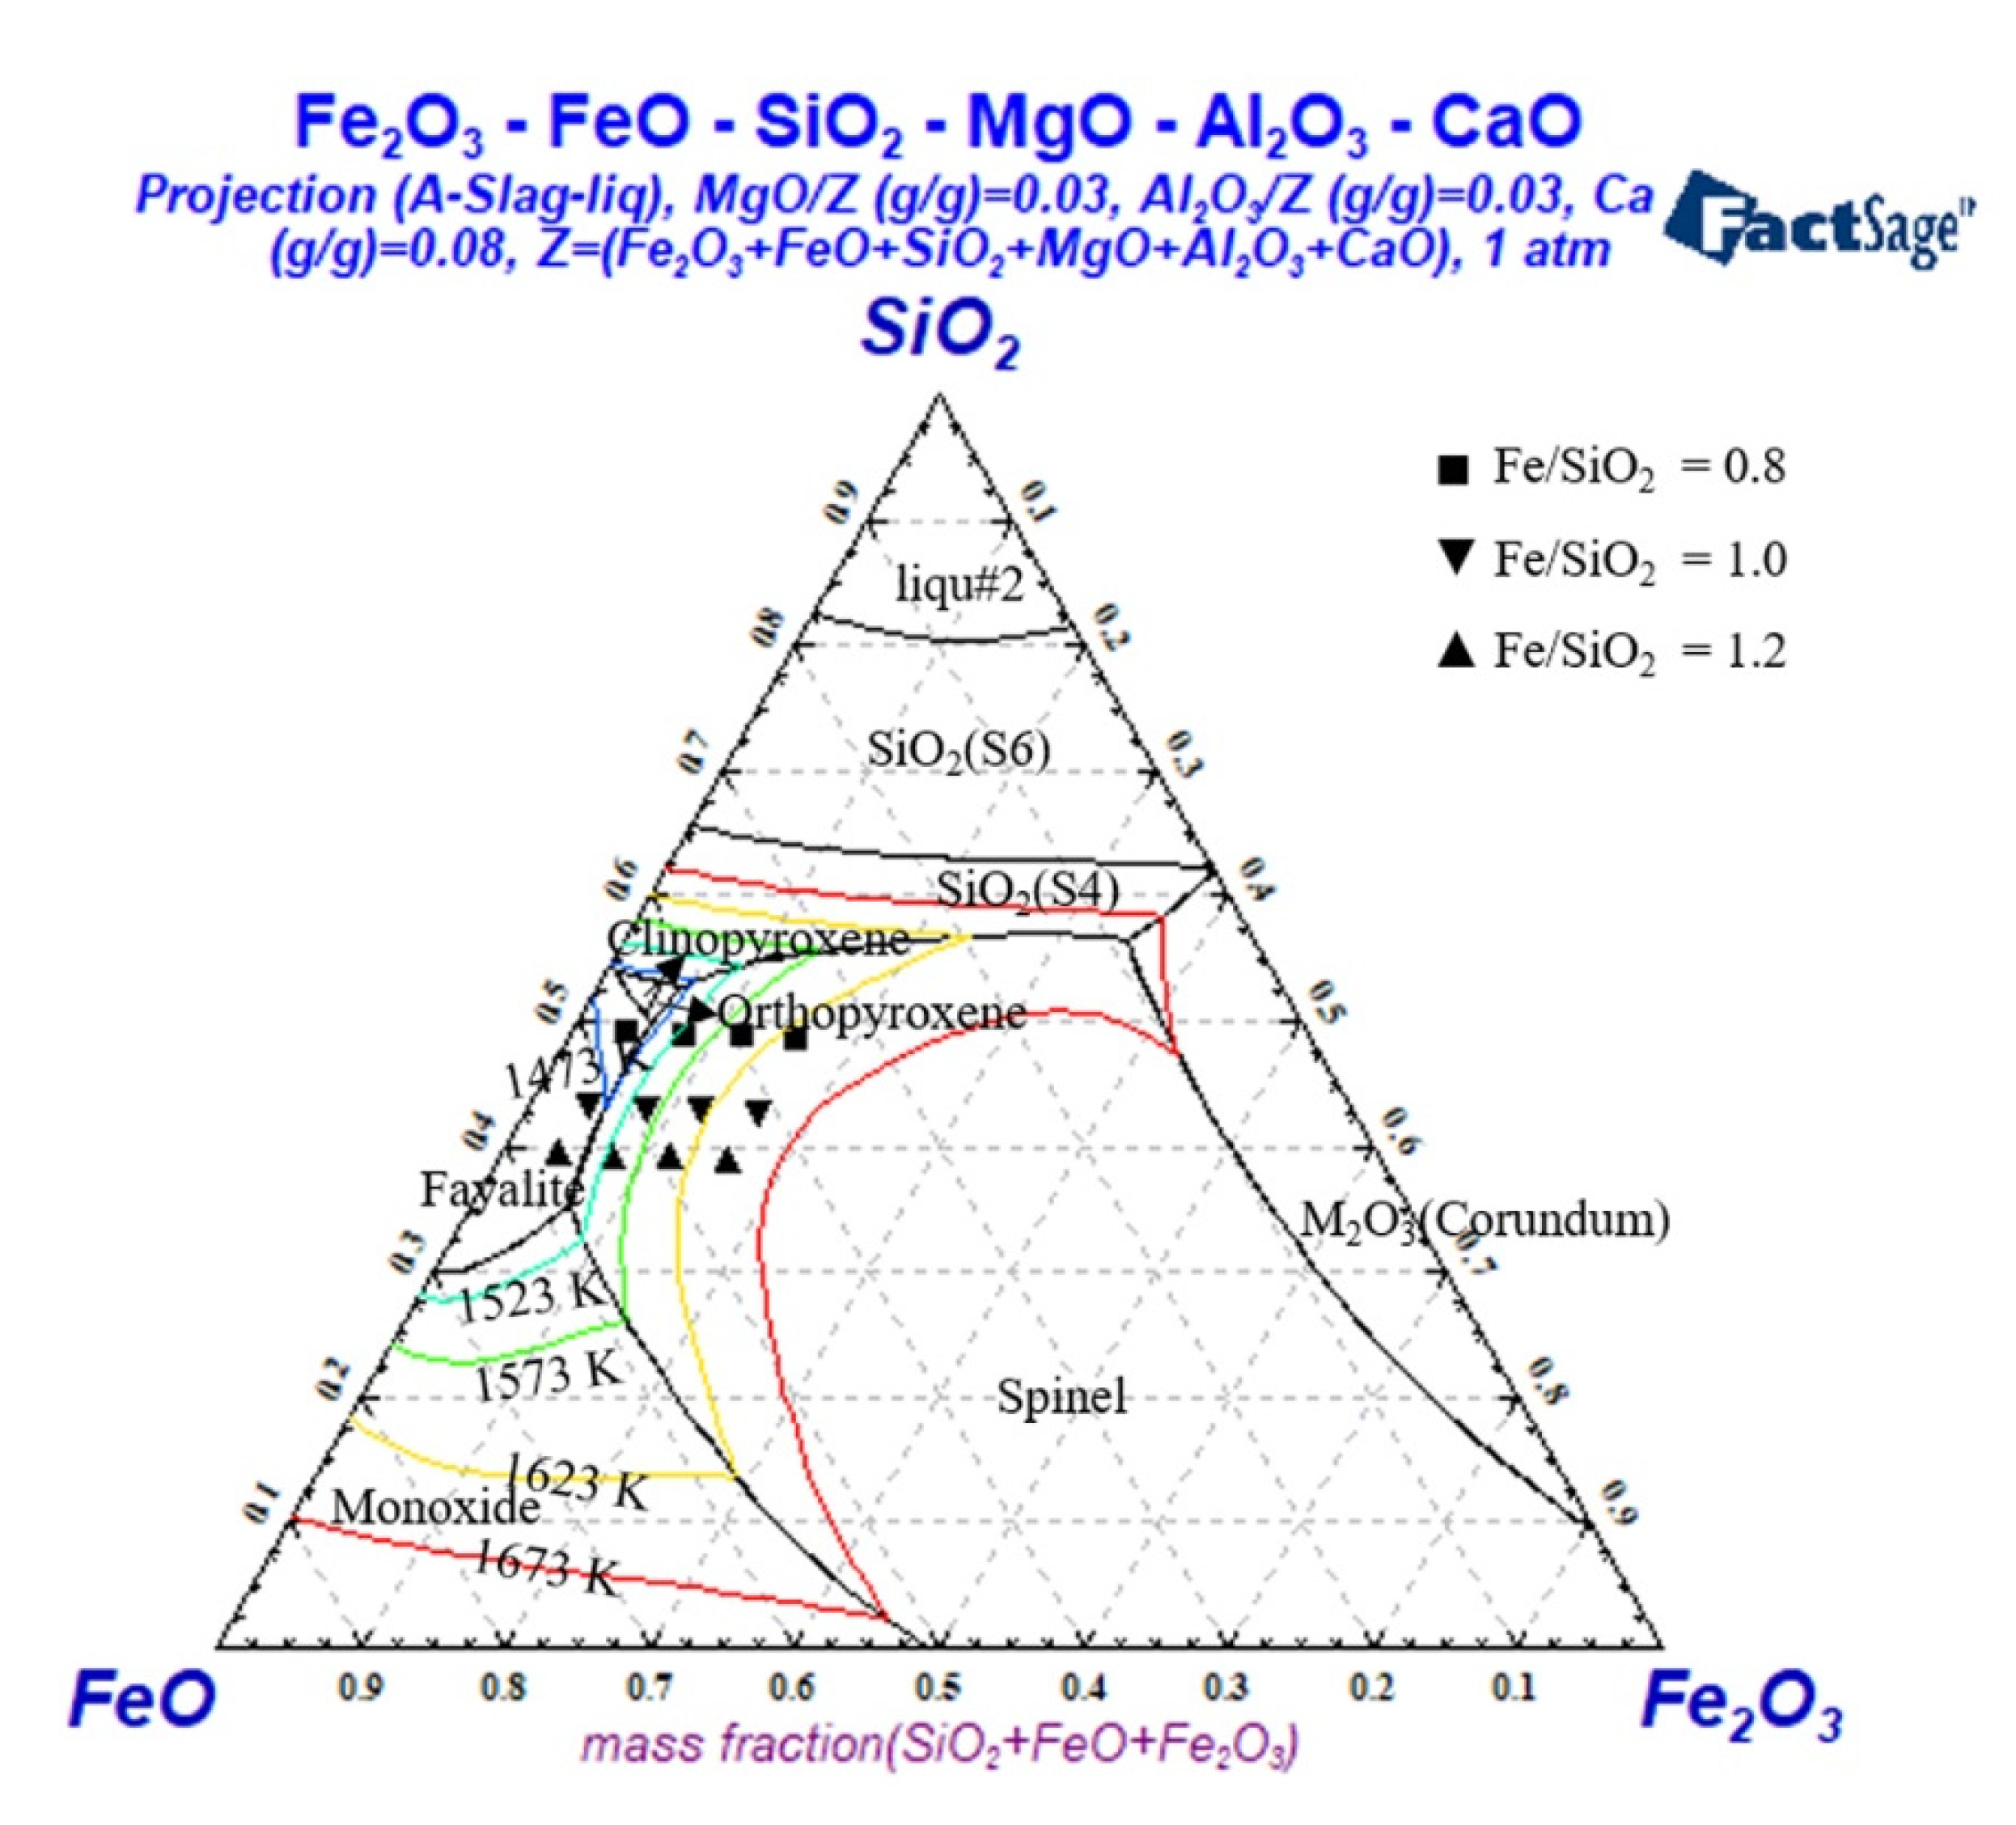
3.4. Effect of Fe2O3 on the Breaking Temperature

The variation of viscosity with temperature in the FeO−Fe2O3−SiO2−8-wt% CaO−3-wt% MgO−3-wt% Al2O3 slag system at different Fe2O3 contents is given in Figure 9. The findings demonstrate that viscosity changes at different Fe2O3 contents follow a similar pattern and viscosity increases smoothly as temperature decreases. As previously stated, the slag’s viscosity varies significantly at low Fe/SiO2 ratios, as shown in Figure 7. The previously reported viscosity data [12,24,40,41] for iron-silicate based slags are also given in Figure 9d. It can be seen that the data obtained in this study are in good agreement with those in the literatures. Since this study is a six-membered system of FeO−Fe2O3−SiO2−8 wt% CaO−3 wt% MgO−3 wt% Al2O3, it is bound to differ from the results in the literature. In addition, the viscosity measurement is also related to parameters such as the material shape of the spindle and crucible. Therefore, the data in this study can be considered as reasonably reliable. Meanwhile, the TBk of the slag gradually increased with increasing Fe2O3 content at fixed Fe/SiO2 ratios. The phase diagram of the FeO−Fe2O3−SiO2−8 wt% CaO−3 wt% MgO−3 wt% Al2O3 slag system calculated by Factsage 7.3 is given in Figure 10, along with isotherms between 1473 K and 1673 K. According to the phase diagram, the studied slag components are in the crystalline region of the fayalite and spinel phase. With increasing Fe2O3 content, the initial crystalline phase of the slag gradually shifts from the low-temperature fayalite phase to the high-temperature spinel phase. Therefore, the TBk of the slag gradually increases with the addition of Fe2O3 content.

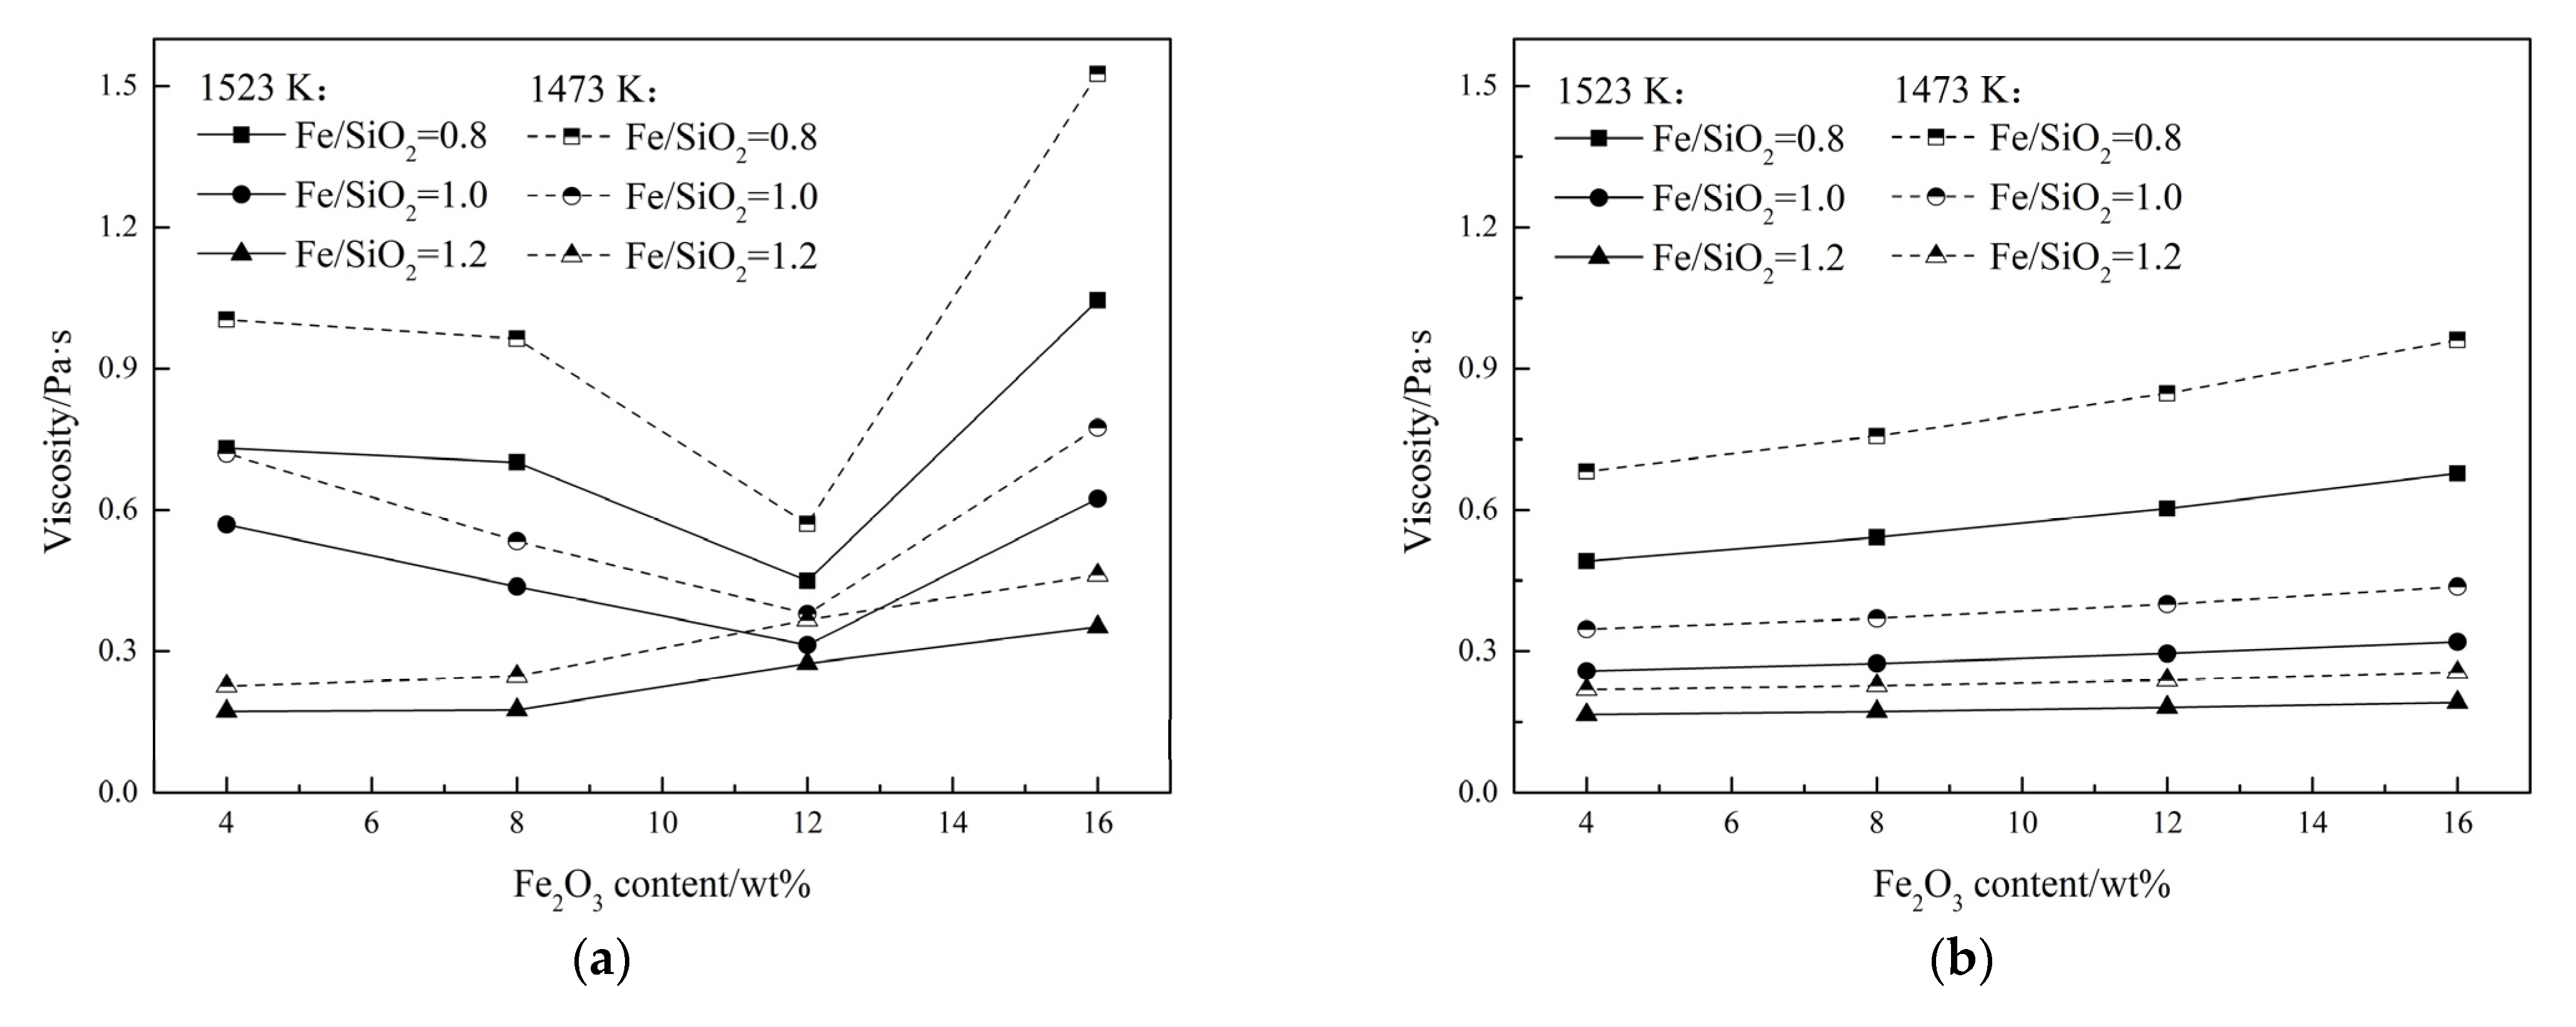
3.5. Effect of Fe2O3 on the Slag Viscosity

Figure 11a depicts the effect of Fe2O3 content on slag viscosity at various temperatures and fixed Fe/SiO2 ratios. It can be seen that for Fe/SiO2 ratios of 0.8 and 1.0, the slag viscosity shows a minimum value with the increase of Fe2O3 content. For example, at a Fe/SiO2 ratio of 0.8, the viscosity decreases from 0.73 to 0.45 Pa·s as the Fe2O3 content increases from 4 to 12 wt%, and increases sharply to 1.04 Pa·s as the Fe2O3 content continues to increase to 16 wt%. Moreover, as Fe/SiO2 ratio rises to 1.2, the slag viscosity follows a different trend, i.e., it increases with the addition of Fe2O3. This can be attributed to the amphoteric behavior of Fe2O3.When the Fe/SiO2 ratio is relatively low, Fe2O3 behaves similarly to other basic oxides, which can decompose network-modifying O2 at high temperatures and react with the bridge oxygen in the slag; thus, depolymerizing the slag and lowering the slag viscosity. When Fe/SiO2 ratio is high, Fe2O3 exhibits the properties of acidic oxides, such as SiO2, and the [FeO4]5− tetrahedra forms a more complex network structure with the [SiO4]4− tetrahedra, making the slag more aggregated with increased slag viscosity.
In addition, for low Fe/SiO2 ratio, the absolute amount of SiO2 in the slag is high and the slag structure is relatively complicated. At this time, Ca2+ acts as a charge compensator particularly when Ca2+ is near [FeO4]5− tetrahedra which are not fully supplied for slags at low basicity due to the scarcity of Ca2+. Consequently, more [FeO6]9− octahedra would be formed to replace Ca2+ as the network modifier, depolymerizing the silicate structure and lowering slag viscosity. Moreover, the bond energy of the Fe−O bond is lower than that of the Si−O bond. Therefore, even if Fe3+ exists in the form of tetrahedra, the bond energy of the entire system will decrease with the increase of Fe2O3. At the low Fe/SiO2 ratio, when the Fe2O3 content exceeds 12 wt%, the slag viscosity increases. This is due to the relatively high melting point of Fe2O3, which improves the crystallization ability of the slag and increases the slag viscosity. In addition, analogous to the action of Fe/SiO2 ratio, the effect of Fe2O3 on viscosity becomes weak at high temperatures.
Figure 11b shows the slag viscosity predicted using Factsage 7.3, which is consistent with the experiments at high Fe/SiO2 ratio. However, no amphoteric behavior of Fe2O3 was observed at low Fe/SiO2 ratios according to the software calculations, which may be due to the deviation of the viscosity model used by the software from the actual measurement results.

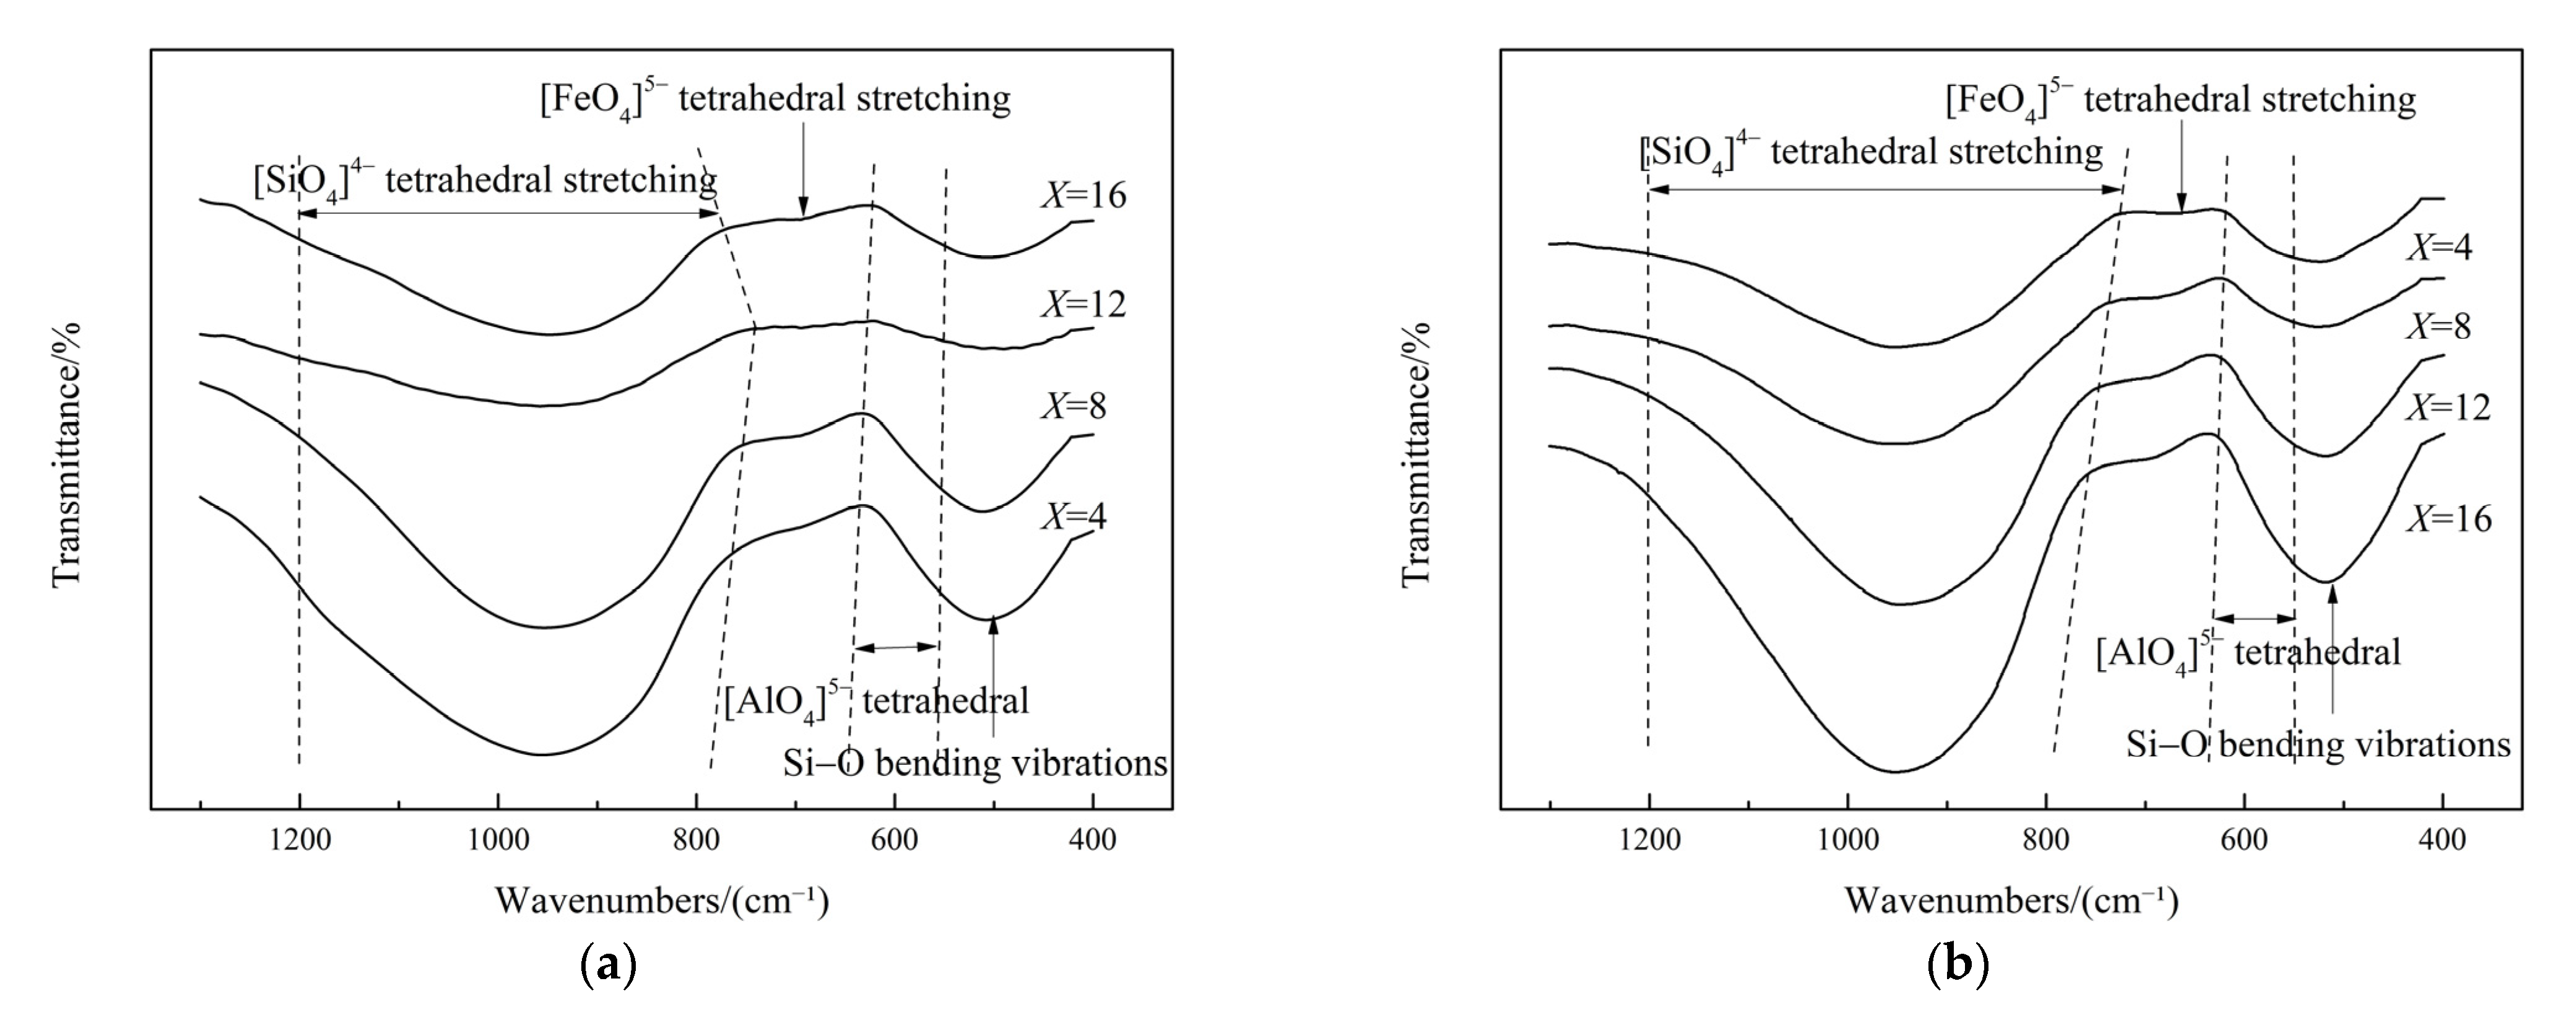
3.6. Effect of Fe2O3 on the Slag Structure

Figure 12a,b show the FTIR spectra at different Fe2O3 contents for fixed Fe/SiO2 ratios of 0.8 and 1.2, respectively. It illustrates that the vibrational band of the silicate tetrahedra becomes wider firstly and then narrower with the increase of Fe2O3 content at an Fe/SiO2 ratio of 0.8, and the depth of the corresponding convolution band becomes shallower and then deeper, and this result is consistent with the change of viscosity. Similarly, the same trend is observed for the height of the Si−O bending vibration band. For the slag with Fe/SiO2 ratio of 1.2, the width of the vibrational band of [SiO4]4− tetrahedra gradually narrows and the height of the groove increases with increasing Fe2O3 content, and the symmetric Si–O bending vibration band also becomes pronounced with Fe2O3 addition, which is consistent with the viscosity measurement results. Moreover, similar to the effect of Fe/SiO2 ratio, the variation of [AlO4]5− tetrahedral vibration band and [FeO4]5− with the Fe2O3 content is not significant.
Figure 13 depicts the deconvolution results of Raman spectra with characteristic structural unit vibrations in an iron–silicate slag system at various Fe2O3 contents and a fixed Fe/SiO2 ratio of 1.2. It is suggested that with the addition of Fe2O3, the Q0 and Q1 units decrease and the Q2 and Q3 units increase, as indicated by the variation of the peak heights in the Raman spectra. Similarly, as Fe2O3 content increases, the stretching vibration band of [FeO4]5− at 690 cm−1 increases, suggesting that with the addition of Fe2O3, a gradual polymerization occurred within the silicate network, which is in consonance with the FTIR and viscosity measurements.

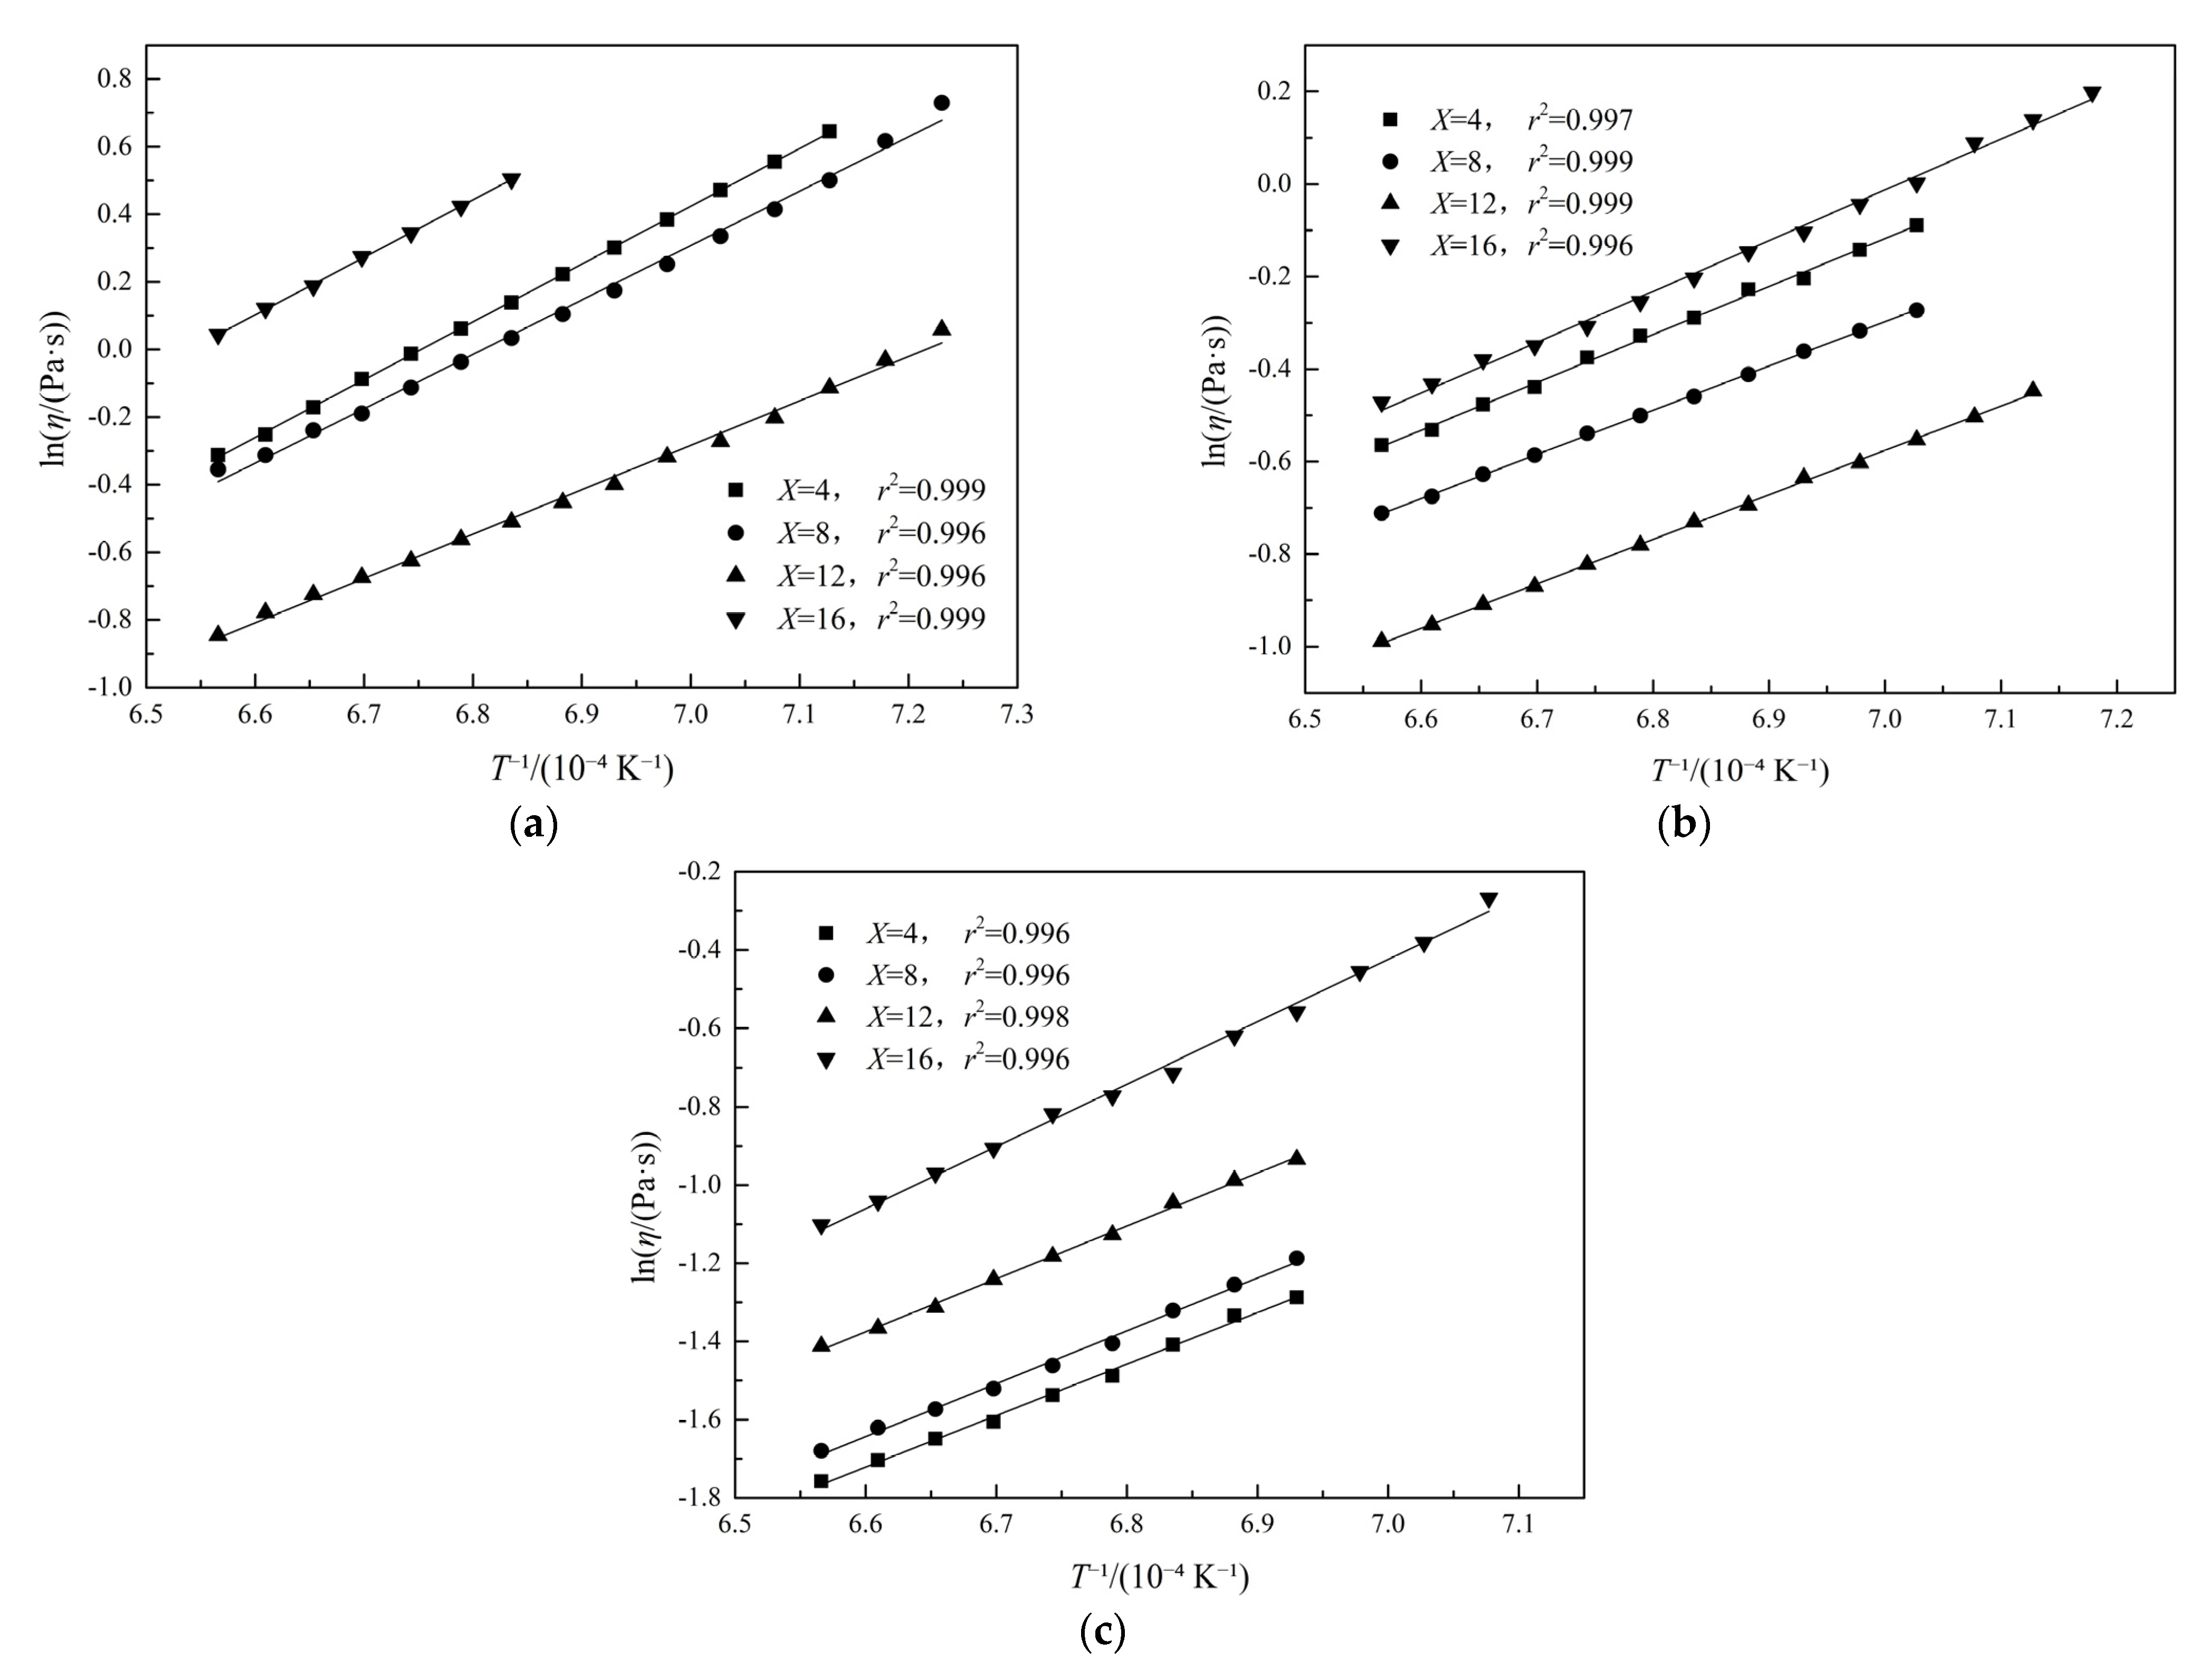
3.7. Activation Energy for Viscous Flow

The temperature dependence of the slag viscosity can be expressed by the Arrhenius equation as shown in Formula (3):
η = A exp ( E η R T )
where η is the viscosity, Pa·s; A is the pre-exponential constant; Eη is the activation energy for viscous flow, J·mol−1; R is the universal gas constant, 8.314 J·(mol·K)−1, and T is the absolute temperature, K. The changes in Eη can provide a reference for variation in friction of viscous flow and can express the slag structure changes [42].
Figure 14 depicts plots of the natural logarithm of viscosity (lnη) versus the inverse of temperature (1/T) of all slags above the breaking temperature with varying Fe2O3 contents and Fe/SiO2 ratios. It is evident that for all studied compositions, lnη and 1/T are linearly correlated with a linear correlation coefficient r2 > 0.99, indicating that molten slags follow the Arrhenius behaviors. Thus, the Eη values are derived from the slopes of the lines using the Arrhenius formula and are shown in Table 3. It should be noted that the viscous activation energies derived in the experiments were obtained at a rate of cooling of 3 K/min. As expected, the activation energy decreases with increasing Fe/SiO2 ratio from 0.8 to 1.2 at a fixed Fe2O3 content and increases with increasing Fe2O3 contents at the Fe/SiO2 ratio of 1.2. Moreover, the changes in Eη with Fe2O3 additions to the slag system at fixed Fe/SiO2 ratios of 0.8 and 1.0 revealed a distinctive V-shaped pattern. The variation tendency of the Eη is consistent with the measured viscosity values and is supported by changes in slag structure, i.e., the smaller the Eη, the simpler the silicate structure of the slag. The values of the activation energy are similar to the results reported by Park et al. [24] who investigated the FeOt−SiO2−Al2O3 copper-smelting slags, where the Eη is 118 and 129 kJ/mol with the addition of Al2O3 is 0 and 5 mass pct, respectively, at a fixed Fe/SiO2 ratio of 1.27.

4. Conclusions

The viscous behaviors of FeO−Fe2O3−SiO2−8 wt%CaO−3 wt%MgO−3 wt%Al2O3 slag system were investigated by the rotating spindle method. The slag structure with different Fe/SiO2 ratio and Fe2O3 content was explored by FTIR and Raman analysis. The main conclusions obtained are shown below:
(1) The slag viscosity and activation energy for viscous flow decreased with increasing Fe/SiO2 ratios (0.8–1.2) and increased with increasing Fe2O3 contents (4–16 wt%) at the Fe/SiO2 ratio of 1.2. Slag viscosity at low Fe/SiO2 ratio (0.8 and 1.0) exhibited a minimum value by increasing Fe2O3 content in slag. Fe2O3 shows the amphoteric behaviors in slag system.
(2) The TBk of the slag decreased with increasing Fe/SiO2 ratios. With the addition of Fe2O3 content, the primary crystalline phase of the slag gradually changes from the low-temperature fayalite phase to the high-temperature spinel phase, resulting in an increase in the TBk of the slag.
(3) The degree of polymerization of present slags decreases with increasing Fe/SiO2 ratio and increases with the addition of Fe2O3 content at the Fe/SiO2 ratio of 1.2. A decrease in Fe/SiO2 ratio or increase in Fe2O3 content promoted the formation of [FeO4]5− tetrahedra, which further complicates the silicate network structure.

Author Contributions

Conceptualization, B.W. and Z.J.; methodology, B.W. and Z.L.; software, B.W. and Z.L.; validation, B.W., M.Z. and Z.L.; formal analysis, B.W. and Z.J.; investigation, B.W. and Z.L.; resources, Z.J. and H.Y.; data curation, B.W. and M.Z.; writing—original draft preparation, B.W.; writing—review and editing, B.W. and Z.J.; supervision, Z.J. and H.Y.; project administration, Z.J. and H.Y.; funding acquisition, Z.J. and H.Y. All authors have read and agreed to the published version of the manuscript.

Funding

This work was supported by the National Key R&D Program of China (2018YFC1902004) and the Special Fund for the National Natural Science Foundation of China (U1608254).

Institutional Review Board Statement

Not applicable.

Informed Consent Statement

Not applicable.

Data Availability Statement

Not applicable.

Conflicts of Interest

The authors declare no conflict of interest.

References

  1. Hou, J.G.; Dong, F.S.; Zhao, J.W.; Xue, S.B.; Jian, L.L. Treatment of complex gold concentrates by made matte. Gold 2013, 34, 60–62. (In Chinese) [Google Scholar] [CrossRef]
  2. Qu, S.L.; Dong, Z.Q.; Chen, T. Study on gold collection in matte with oxygen enriched bottom blowing smelting process. Nonferrous Met. (Extr. Metall.) 2013, 6, 40–42. (In Chinese) [Google Scholar] [CrossRef]
  3. Kucharski, M.; Stubina, N.M.; Toguri, J.M. Viscosity measurements of molten Fe–O–SiO2, Fe–O–CaO–SiO2, and Fe–O–MgO–SiO2 slags. Can. Metall. Q. 1989, 28, 7–11. [Google Scholar] [CrossRef]
  4. Goel, R.P.; Kellogg, H.H.; Rrain, J.L. Mathematical description of the thermodynamic properties of the systems Fe-O and Fe-O-SiO2. Metall. Mater. Trans. B 1980, 11, 107–117. [Google Scholar] [CrossRef]
  5. Nowok, J.W. Viscosity and Structural State of Iron in Coal Ash Slags under Gasification Conditions. Energy Fuels 1995, 9, 534–539. [Google Scholar] [CrossRef]
  6. Lee, S.; Min, D.J. Viscous Behavior of FeO-Bearing Slag Melts Considering Structure of Slag. Steel Res. Int. 2018, 89, 1800055. [Google Scholar] [CrossRef]
  7. Lee, Y.S.; Min, D.J.; Jung, S.M.; Yi, S.H. Influence of basicity and FeO content on viscosity of blast furnace type slags containing FeO. ISIJ Int. 2004, 44, 1283–1290. [Google Scholar] [CrossRef] [Green Version]
  8. Kim, J.R.; Lee, Y.S.; Min, D.J.; Jung, S.M.; Yi, S.H. Influence of MgO and Al2O3 Contents on Viscosity of Blast Furnace Type Slags Containing FeO. ISIJ Int. 2004, 44, 1291–1297. [Google Scholar] [CrossRef]
  9. Wang, Z.J.; Shu, Q.F.; Sridhar, S.; Zhang, M.; Guo, M.; Zhang, Z.T. Effect of P2O5 and FetO on the Viscosity and Slag Structure in Steelmaking Slags. Met. Mater. Trans. A 2015, 46, 758–765. [Google Scholar] [CrossRef]
  10. Lv, J.F.; Jin, Z.N.; Yang, H.Y.; Tong, L.L.; Chen, G.B.; Xiao, F.X. Effect of the CaO/SiO2 mass ratio and FeO content on the viscosity of CaO−SiO2−“FeO”−12 wt%ZnO−3 wt%Al2O3 slags. Int. J. Miner. Metall. Mater. 2017, 24, 756–767. [Google Scholar] [CrossRef]
  11. Chen, M.; Raghunath, S.; Zhao, B.J. Viscosity measurements of “FeO”−SiO2 slag in equilibrium with metallic Fe. Metall. Mater. Trans. B 2013, 44, 506. [Google Scholar] [CrossRef]
  12. Ducret, A.C.; Rankin, W.J. Liquidus temperatures and viscosities of FeO−Fe2O3−SiO2−CaO−MgO slags at compositions rele-vant to nickel matte smelting. Scand. J. Metall. 2002, 31, 59–67. [Google Scholar] [CrossRef] [Green Version]
  13. Ji, F.Z.; Sichen, D.; Seetharaman, S. Experimental studies of the viscosities in the CaO−FenO−SiO2 Slags. Metall. Mater. Trans. B 1997, 28, 827–834. [Google Scholar] [CrossRef]
  14. Chen, M.; Raghunath, S.; Zhao, B.J. Viscosity of SiO2−“FeO”−Al2O3 system in equilibrium with metallic Fe. Metall. Mater. Trans. B 2013, 44, 820–827. [Google Scholar] [CrossRef]
  15. Osugi, T.; Sukenaga, S.; Inatomi, Y.; Gonda, Y.; Saito, N.; Nakashima, K. Effect of Oxidation State of Iron Ions on the Viscosity of Alkali Silicate Melts. ISIJ Int. 2013, 53, 185–190. [Google Scholar] [CrossRef]
  16. Hayashi, M.; Horita, K.; Endo, R.; Watanabe, T.; Susa, M. Effect of coordination structure of iron ions on iron oxide activities in Na2O−SiO2−FeO−Fe2O3 melts. ISIJ Int. 2019, 59, 1744–1751. [Google Scholar] [CrossRef]
  17. Wang, Z.; Sun, Y.; Sridhar, S.; Zhang, M.; Guo, M.; Zhang, Z. Effect of Al2O3 on the Viscosity and Structure of CaO-SiO2-MgO-Al2O3-FetO Slags. Met. Mater. Trans. A 2015, 46, 537–541. [Google Scholar] [CrossRef]
  18. Dingwell, D.B.; Virgo, D. The effect of oxidation state on the viscosity of melts in the system Na2O-FeO-Fe2O3-SiO2. Geochim. Cosmochim. Acta 1987, 51, 195–205. [Google Scholar] [CrossRef] [Green Version]
  19. Saito, N.; Hori, N.; Nakashima, K.; Mori, K. Viscosity of blast furnace type slags. Met. Mater. Trans. A 2003, 34, 509–516. [Google Scholar] [CrossRef]
  20. Wright, S.; Zhang, L. The Influence of Fe3+/Fe2+ ratio on the viscosity of iron silicate slags. In VII International Conference on Molten Slags Fluxes and Salts; South African Institute of Mining and Metallurgy: Cape Town, South Africa, 2004; pp. 231–236. [Google Scholar]
  21. Mysen, B.O.; Virgo, D.; Scarfe, C.M.; Cronin, D.J. Viscosity and structure of iron-bearing and aluminum-bearing calcium sili-cate melts at 1-atm. Am. Mineral. 1985, 70, 487–498. [Google Scholar]
  22. Sasaki, Y.; Mohri, M.; Suyama, K.; Ishii, K. The Effect of Fe3+ Ions on the Anionic Structure of Iron-bearing Sodium Silicate Melts. ISIJ Int. 2000, 40, 1181–1187. [Google Scholar] [CrossRef]
  23. Viswanathan, N.N.; Ji, F.-Z.; Sichen, D.; Seetharaman, S. Viscosity Measurements on Some Fayalite Slags. ISIJ Int. 2001, 41, 722–727. [Google Scholar] [CrossRef] [Green Version]
  24. Park, H.-S.; Park, S.S.; Sohn, I. The Viscous Behavior of FeOt-Al2O3-SiO2 Copper Smelting Slags. Metall. Mater. Trans. A 2011, 42, 692–699. [Google Scholar] [CrossRef]
  25. Li, T.L.; Sun, C.Y.; Song, S.; Wang, Q. Influences of Al2O3 and TiO2 content on viscosity and structure of CaO−8%MgO−Al2O3−SiO2−TiO2−5%FeO blast furnace primary slag. Metals 2019, 9, 743. [Google Scholar] [CrossRef] [Green Version]
  26. Zheng, K.; Zhang, Z.; Liu, L.; Wang, X. Investigation of the Viscosity and Structural Properties of CaO-SiO2-TiO2 Slags. Met. Mater. Trans. A 2014, 45, 1389–1397. [Google Scholar] [CrossRef]
  27. Feng, C.; Chu, M.S.; Tang, J.; Tang, Y.T.; Liu, Z.G. Effect of CaO/SiO2 and Al2O3 on viscous behaviors of the Titani-um-bearing blast furnace slag. Steel Res. Int. 2016, 87, 1274–1283. [Google Scholar] [CrossRef]
  28. Wu, L.; Gran, J.; Sichen, D. The Effect of Calcium Fluoride on Slag Viscosity. Met. Mater. Trans. A 2011, 42, 928–931. [Google Scholar] [CrossRef]
  29. Kim, H.; Sohn, I. Effect of CaF2 and Li2O additives on the viscosity of CaO−SiO2−Na2O slags. ISIJ Int. 2011, 51, 1–8. [Google Scholar] [CrossRef] [Green Version]
  30. Sridhar, S.; Mills, K.C.; Afrange, O.D.C.; Lörz, H.P.; Carli, R. Break Temperatures of mould fluxes and their relevance to con-tinuous casting. Ironmak. Steelmak. 2000, 27, 238–242. [Google Scholar] [CrossRef]
  31. Kim, H.; Matsuura, H.; Tsukihashi, F.; Wang, W.L.; Min, D.J.; Sohn, I. Effect of Al2O3 and CaO/SiO2 on the viscosity of cal-cium-silicate-based slags containing 10 mass pct MgO. Metall. Mater. Trans. B 2013, 44, 5–12. [Google Scholar] [CrossRef]
  32. Yu, J.P.; Wang, L.J.; Wang, Y.X.; Liu, Y.Q.; Zhou, G.Z. Effect of Fe2+ and Fe3+ on the properties of melts containing FeOx. J. Iron Steel Res. 2014, 26, 1–8. [Google Scholar] [CrossRef]
  33. Park, H.; Park, J.-Y.; Kim, G.H.; Sohn, I. Effect of TiO2 on the Viscosity and Slag Structure in Blast Furnace Type Slags. Steel Res. Int. 2012, 83, 150–156. [Google Scholar] [CrossRef]
  34. Lucazeau, G.; Sergent, N.; Pagnier, T.; Shaula, A.; Kharton, V.; Marques, F.M.B. Raman spectra of apatites: La10x Si6y (Al, Fe)y O26 ± δ. J. Raman Spectrosc. 2007, 38, 21–33. [Google Scholar] [CrossRef]
  35. Mysen, B.O.; Finger, L.W.; Virgo, D.; Seifert, F.A. Curve-fitting of Raman spectra of silicate glasses. Am. Mineral. 1982, 67, 686–695. [Google Scholar] [CrossRef]
  36. Mysen, B.O.; Virgo, D.; Scarfe, C.M. Relations between the anionic structure and viscosity of silicate melts—A Raman spectro-scopic study. Am. Mineral. 1980, 65, 690–710. [Google Scholar] [CrossRef] [Green Version]
  37. Jin, Z.N.; Yang, H.Y.; Lv, J.F.; Tong, L.L.; Chen, G.B.; Zhang, Q. Effect of ZnO on viscosity and structure of CaO−SiO2−ZnO−FeO−Al2O3 slags. JOM 2018, 70, 1430–1436. [Google Scholar] [CrossRef]
  38. Wang, L.; Zhang, C.; Cai, D.; Zhang, J.; Sasaki, Y.; Ostrovski, O. Effects of CaO/SiO2 Ratio and Na2O Content on Melting Properties and Viscosity of SiO2-CaO-Al2O3-B2O3-Na2O Mold Fluxes. Met. Mater. Trans. A 2017, 48, 516–526. [Google Scholar] [CrossRef]
  39. Talapaneni, T.; Yedla, N.; Pal, S.; Sarkar, S. Experimental and Theoretical Studies on the Viscosity–Structure Correlation for High Alumina-Silicate Melts. Met. Mater. Trans. B 2017, 48, 1450–1462. [Google Scholar] [CrossRef]
  40. Zhang, H.W.; Sun, F.; Shi, X.Y.; Zhang, B.; Hong, X. The viscous and conductivity behavior of melts containing iron oxide in the FeOt−SiO2−CaO−Cu2O system for copper smelting slags. Metall. Mater. Trans. B 2012, 43, 1046–1053. [Google Scholar] [CrossRef]
  41. Zhao, B.J.; Font, J.; Moyano, A.; Jak, E.; Hayes, P.C. Viscosity and electric conductivity of copper slag at controlled oxygen potential. In Proceedings of the VIII International Conference on Molten Slags, Fluxes and Salts, Santiago, Chile, 18–21 January 2009; pp. 225–235. [Google Scholar]
  42. Urbain, G.; Bottinga, Y.; Richet, P. Viscosity of liquid silica, silicates and alumino-silicates. Geochim. Cosmochim. Acta 1982, 46, 1061–1072. [Google Scholar] [CrossRef]
Figure 1. Schematic diagram of experiments device (a) and sizes of crucible and spindle (b).
Metals 12 00024 g001
Figure 2. XRD patterns of quenched samples.
Metals 12 00024 g002
Figure 3. Viscosity changes versus temperature for varying Fe/SiO2 ratios of the FeO−Fe2O3−SiO2−8 wt%CaO−3 wt%MgO−3 wt%Al2O3 system at fixed Fe2O3 contents of (a) 4 wt%; (b) 8 wt%; (c) 12 wt%; (d) 16 wt%.
Metals 12 00024 g003aMetals 12 00024 g003b
Figure 4. Effect of Fe/SiO2 ratio on the cooling precipitation of crystalline phase at 1373–1473 K for 4 wt% Fe2O3 content of (a) spinel; (b) fayalite; (c) clinopyroxene.
Metals 12 00024 g004
Figure 5. Calculated cooling phase equilibrium at 973–1673 K (Fe/SiO2 = 1.0, Fe2O3 = 8 wt%).
Metals 12 00024 g005
Figure 6. Effect of Fe/SiO2 on the viscosity of the FeO−X wt%Fe2O3−SiO2−8 wt% CaO−3 wt%MgO−3 wt%Al2O3 slag system at fixed temperatures with different Fe2O3 content: (a) results of experimental tests; (b) results of simulation tests by Factsage 7.3.
Metals 12 00024 g006
Figure 7. FTIR spectra of quenched samples at different Fe/SiO2 ratios with Fe2O3 content of (a) 12 wt% and (b) 16 wt%.
Metals 12 00024 g007
Figure 8. Deconvolution schematic of Raman spectrum of quenched samples at Fe2O3 content of 8 wt% with various Fe/SiO2 ratios of (a) 0.8; (b) 1.0 and (c) 1.2.
Metals 12 00024 g008
Figure 9. Viscosity changes versus temperature of the FeO−Fe2O3−SiO2−8 wt%CaO−3 wt%MgO−3 wt%Al2O3 system at different Fe2O3 content and fixed Fe/SiO2 ratios of (a) 0.8; (b) 1.0; (c) 1.2; (d) comparison with other studies (Fe/SiO2 = 1.32 data from [12], Fe/SiO2 = 1.27 data from [24], Fe/SiO2 = 1.2 data from [40], Fe/SiO2 = 1.51 data from [41]).
Metals 12 00024 g009
Figure 10. Phase diagram of FeO−Fe2O3−SiO2−8 wt% CaO−3 wt% MgO−3 wt% Al2O3 slag system with crystalline phase regions and various liquid isotherms (1473–1673 K) calculated by Factsage.
Metals 12 00024 g010
Figure 11. Effect of Fe2O3 on the FeO−Fe2O3−SiO2−8 wt%CaO−3 wt%MgO−3 wt%Al2O3 slag viscosity at fixed temperatures and Fe/SiO2 ratios: (a) results of experimental tests; (b) results of simulation tests by Factsage 7.3.
Metals 12 00024 g011
Figure 12. FTIR results with various Fe2O3 content in the FeO−X wt%Fe2O3−SiO2−8 wt%CaO−3 wt%MgO−3 wt%Al2O3 melts at Fe/SiO2 of (a) 0.8 and (b) 1.2.
Metals 12 00024 g012
Figure 13. Deconvolution of Raman spectra of quenched slags at fixed Fe/SiO2 ratio of 1.2 with various Fe2O3 levels of (a) 4 wt%; (b) 8 wt%; (c) 12 wt%; (d) 16 wt%.
Metals 12 00024 g013
Figure 14. The lnη and 1/T fitting results of the FeO−X wt%Fe2O3−SiO2−8 wt%CaO−3 wt%MgO−3 wt%Al2O3 slag systems at various Fe2O3 contents and at a fixed Fe/SiO2 ratio of (a) 0.8; (b) 1.0 and (c) 1.2.
Metals 12 00024 g014
Table 1. Chemical compositions of samples in viscosity determination experiments (wt%).
No.Designed Composition (wt%)Analyzed Composition (wt%)
Fe/SiO2Fe2O3SiO2FeOMgOAl2O3CaOFe/SiO2Fe2O3SiO2FeOMgOAl2O3CaO
10.8442.1839.823380.824.641.439.52.83.28.0
20.8841.9936.013380.828.541.035.63.13.38.0
30.81241.7932.213380.8212.640.931.83.03.28.0
40.81641.5928.413380.8216.640.527.93.13.17.8
51.0437.4444.563381.024.636.944.12.93.18.0
61.0837.2640.743381.028.536.340.23.03.08.0
71.01237.0936.913381.0012.537.036.42.93.27.8
81.01636.9133.093381.0216.536.033.02.93.18.1
91.2433.6548.353381.224.633.047.83.03.28.1
101.2833.4944.513381.248.932.743.93.13.27.7
111.21233.3340.673381.2412.832.139.93.12.97.9
121.21633.1836.823381.2416.732.035.83.03.18.2
Table 2. Deconvolution results of the characteristic peaks of Raman spectra of samples with varying Fe/SiO2 ratios at Fe2O3 content of 8 wt%.
No.Fe/SiO2Q0Q1Q2Q3NBO/Si
10.80.020.190.430.361.87
21.00.040.260.430.272.07
31.20.120.320.320.242.32
Table 3. Eη values at different Fe/SiO2 ratios and Fe2O3 contents.
Fe/SiO2 RatioFe2O3 Content/wt%Activation Energy/(kJ·mol−1)
0.84142.16
8136.77
12131.79
16141.51
1.04138.14
8129.56
12127.97
16136.25
1.24109.47
8112.39
12112.63
16132.18
Publisher’s Note: MDPI stays neutral with regard to jurisdictional claims in published maps and institutional affiliations.

