Article

Morphology and Crystallography Analyses of HSLA Steels with Hardenability Enhanced by Tailored C–Ni Collocation

1
Collaborative Innovation Center of Steel Technology, University of Science and Technology Beijing, Beijing 100083, China
2
Yantai Institute of Industrial Technology, University of Science and Technology Beijing, Yantai 264003, China
3
Yangjiang Branch, Guangdong Laboratory for Materials Science and Technology (Yangjiang Advanced Alloys Laboratory), Yangjiang 529500, China
*
Author to whom correspondence should be addressed.
First authors.
Metals 2022, 12(1), 32; https://doi.org/10.3390/met12010032
Submission received: 2 December 2021 / Revised: 20 December 2021 / Accepted: 21 December 2021 / Published: 24 December 2021
(This article belongs to the Special Issue Microstructural Characterization of Metallic Materials)

Abstract

:
High hardenability is of great importance to ultra-heavy steel plates and can be achieved by tailoring the composition of steel. In this study, the continuous cooling transformation (CCT) curves of two high-strength low-alloy (HSLA) steels (0.16C-0.92Ni steel and 0.12C-1.86Ni steel) were elucidated to reveal the significance of C–Ni collocation on hardenability from the perspective of morphology and crystallography. At a low cooling rate (0.5 °C/s), the 0.12C-1.86Ni steel showed higher microhardness than 0.16C-0.92Ni steel. The microstructure in 0.16C-0.92Ni steel was mainly granular bainite with block-shaped martensite/austenite islands (M/A islands), while that in 0.12C-1.86Ni steel was typically lath bainite with film-shaped M/A islands, denoting that the 0.12C-1.86Ni steel is of higher hardenability. Moreover, the 0.12C-1.86Ni steel exhibited a higher density of block boundaries, especially V1/V2 boundaries. The higher density of block boundaries resulted from the weakened variant selection due to the larger transformation driving force and more self-accommodation of transformation strain induced by the reduced carbon and increased nickel content.

1. Introduction

For conventional high-strength low-alloy ultra-heavy plates, a matrix structure with sufficiently high strength, such as lath martensite/bainite is obtained by quenching, which is subsequently tempered to improve toughness [1,2,3,4]. However, it is usually impossible to avoid the low cooling rate in the center of the ultra-heavy plates during cooling, causing inhomogeneous microstructure and mechanical properties across the thickness direction, which highlights the need to enhance the hardenability of the alloy [5,6,7]. Granular bainite/ferrites may be formed at lower cooling rates in the center of the plates with low hardenability [8,9]. On one side, this leads to the existence of incompletely transformed martensite–austenite islands (M/A islands), which are often a factor in launching cracks, and on the other side, there are fewer high-angle grain boundaries (HAGBs) to impede crack propagation effectively [10,11]. How to improve the hardenability of low-alloy steel to obtain a high-strength matrix structure at low cooling rates in the center of the ultra-heavy plates is the focus of this study.
A convenient way to improve the hardenability of low-alloy steels is through increasing the concentration of carbon and alloying elements [12,13,14,15,16]. Generally, carbon is the element most commonly used to improve hardenability, and the hardenability of alloy steels increases with increasing carbon content (<0.77 wt. %) [17]. However, the dramatic loss in toughness and weldability associating with increasing carbon content limits its use in the enhancement of hardenability [18,19]. Nickel (Ni) is an element that can improve hardenability, which is also usually added to the heavy plates to improve the toughness [20,21]. To ensure hardenability without a significant decrease in toughness and weldability, we attempted to reduce the carbon content whilst increasing the Ni to improve the hardenability. In this study, the effect of different C–Ni combinations on the phase products and hardenability of two HSLA steels from the perspective of morphology and crystallography was elucidated to clarify the mechanism of C–Ni collocation that improves the hardenability.

2. Materials and Methods

The chemical composition of the two experimental steels used in the present work is listed in Table 1. Alloys were melted in a 25 kg vacuum induction furnace and rolled into thick plates with a thickness of 50 mm. Cylindrical samples of 10 mm in length and 4 mm in diameter were machined parallel to the rolling direction (RD) from the center, and heat treated in a Bähr DIL 805 A dilatometer to obtain the CCT diagrams of the steels. The samples were heated to 1000 °C at a heating rate of 10 °C/s and held for 15 min, and then cooled to room temperature at cooling rates of 0.5, 1, 3, 5, 10, 30 and 50 °C/s. Vickers microhardness tests of heat-treated specimens were performed on an HVS-1000ZDT Micro-hardness Tester (SIOM, Shanghai, China) with a load of 1 kg for 15 s, and the average hardness of each sample was determined by making five indentations at 5 μm intervals.
After mechanical grinding and polishing, specimens were etched with 4% nital for scanning electron microscopy (SEM) observations using a TESCAN MIRA3 LMH (TESCAN, Brno, Czech Republic) field emission scanning electron microscopy (FE-SEM) operating at 10 kV. The specimens were electropolished using a solution containing 85% alcohol, 10% perchloric acid and 5% glycerol for electron backscatter diffraction (EBSD) examination. The EBSD analysis was performed with TESCAN MIRA 3 LMH FE-SEM equipped with an Oxford Symmetry EBSD detector (Oxford Instruments, Oxford, United Kingdom) at an acceleration voltage of 20 kV, a working distance of 16 mm, tilt angle of 70 deg and a step size of 0.2 μm. The crystallographic orientation data were post-processed with the CHANNEL 5 software from Oxford-HKL (Oxford Instruments, Oxford, United Kingdom), and the orientation relationship (OR) and grain boundary length was calculated quantitatively using MATLAB® software (MathWorks, Natick, MA, USA).

3. Results and Discussion

3.1. CCT and Vickers Hardness

The CCT diagrams of the two steels with different C–Ni contents after holding at 1000 °C are shown in Figure 1. It can be seen that the phase transformation onset temperature of the two steels tended to be about 432 °C when the cooling rate was greater than 5 °C/s, which can be regarded as the martensite start transformation temperature (Ms). However, when the cooling rate was decreased, the transformation behavior of the two steels changed significantly. The transformation starting temperature (Ts) of 0.12C-1.86Ni steel was lower than that of 0.16C-0.92Ni steel, especially in the sample cooled at 0.5 °C/s where the transformation starting temperature of the former was 483 °C, while that of the latter steel was 525 °C.
The Vickers hardness values of the samples cooled at the rates corresponding to that in the CCT diagram are shown in Table 2. For 0.16C-0.92Ni steel, the hardness decreased by 24% when the cooling rate was reduced from 50 °C/s to 0.5 °C/s, which means that the hardness at a cooling rate of 0.5 °C/s was only 76% of that at a cooling rate of 50 °C/s. In contrast, the hardness of 0.12C-1.86Ni steel at low cooling rates was 91% of that at high cooling rates, and the hardness of 0.12C-1.86Ni steel (365.0 HV1) was significantly greater than that of 0.16C-0.92Ni steel (333.6 HV1) at the lowest cooling rate (0.5 °C/s). Considering both the phase transformation temperature and hardness, it was concluded that decreasing the C content by 0.04% and increasing the Ni content by 0.94% improves the hardenability.

3.2. Morphological and Crystallographic Features

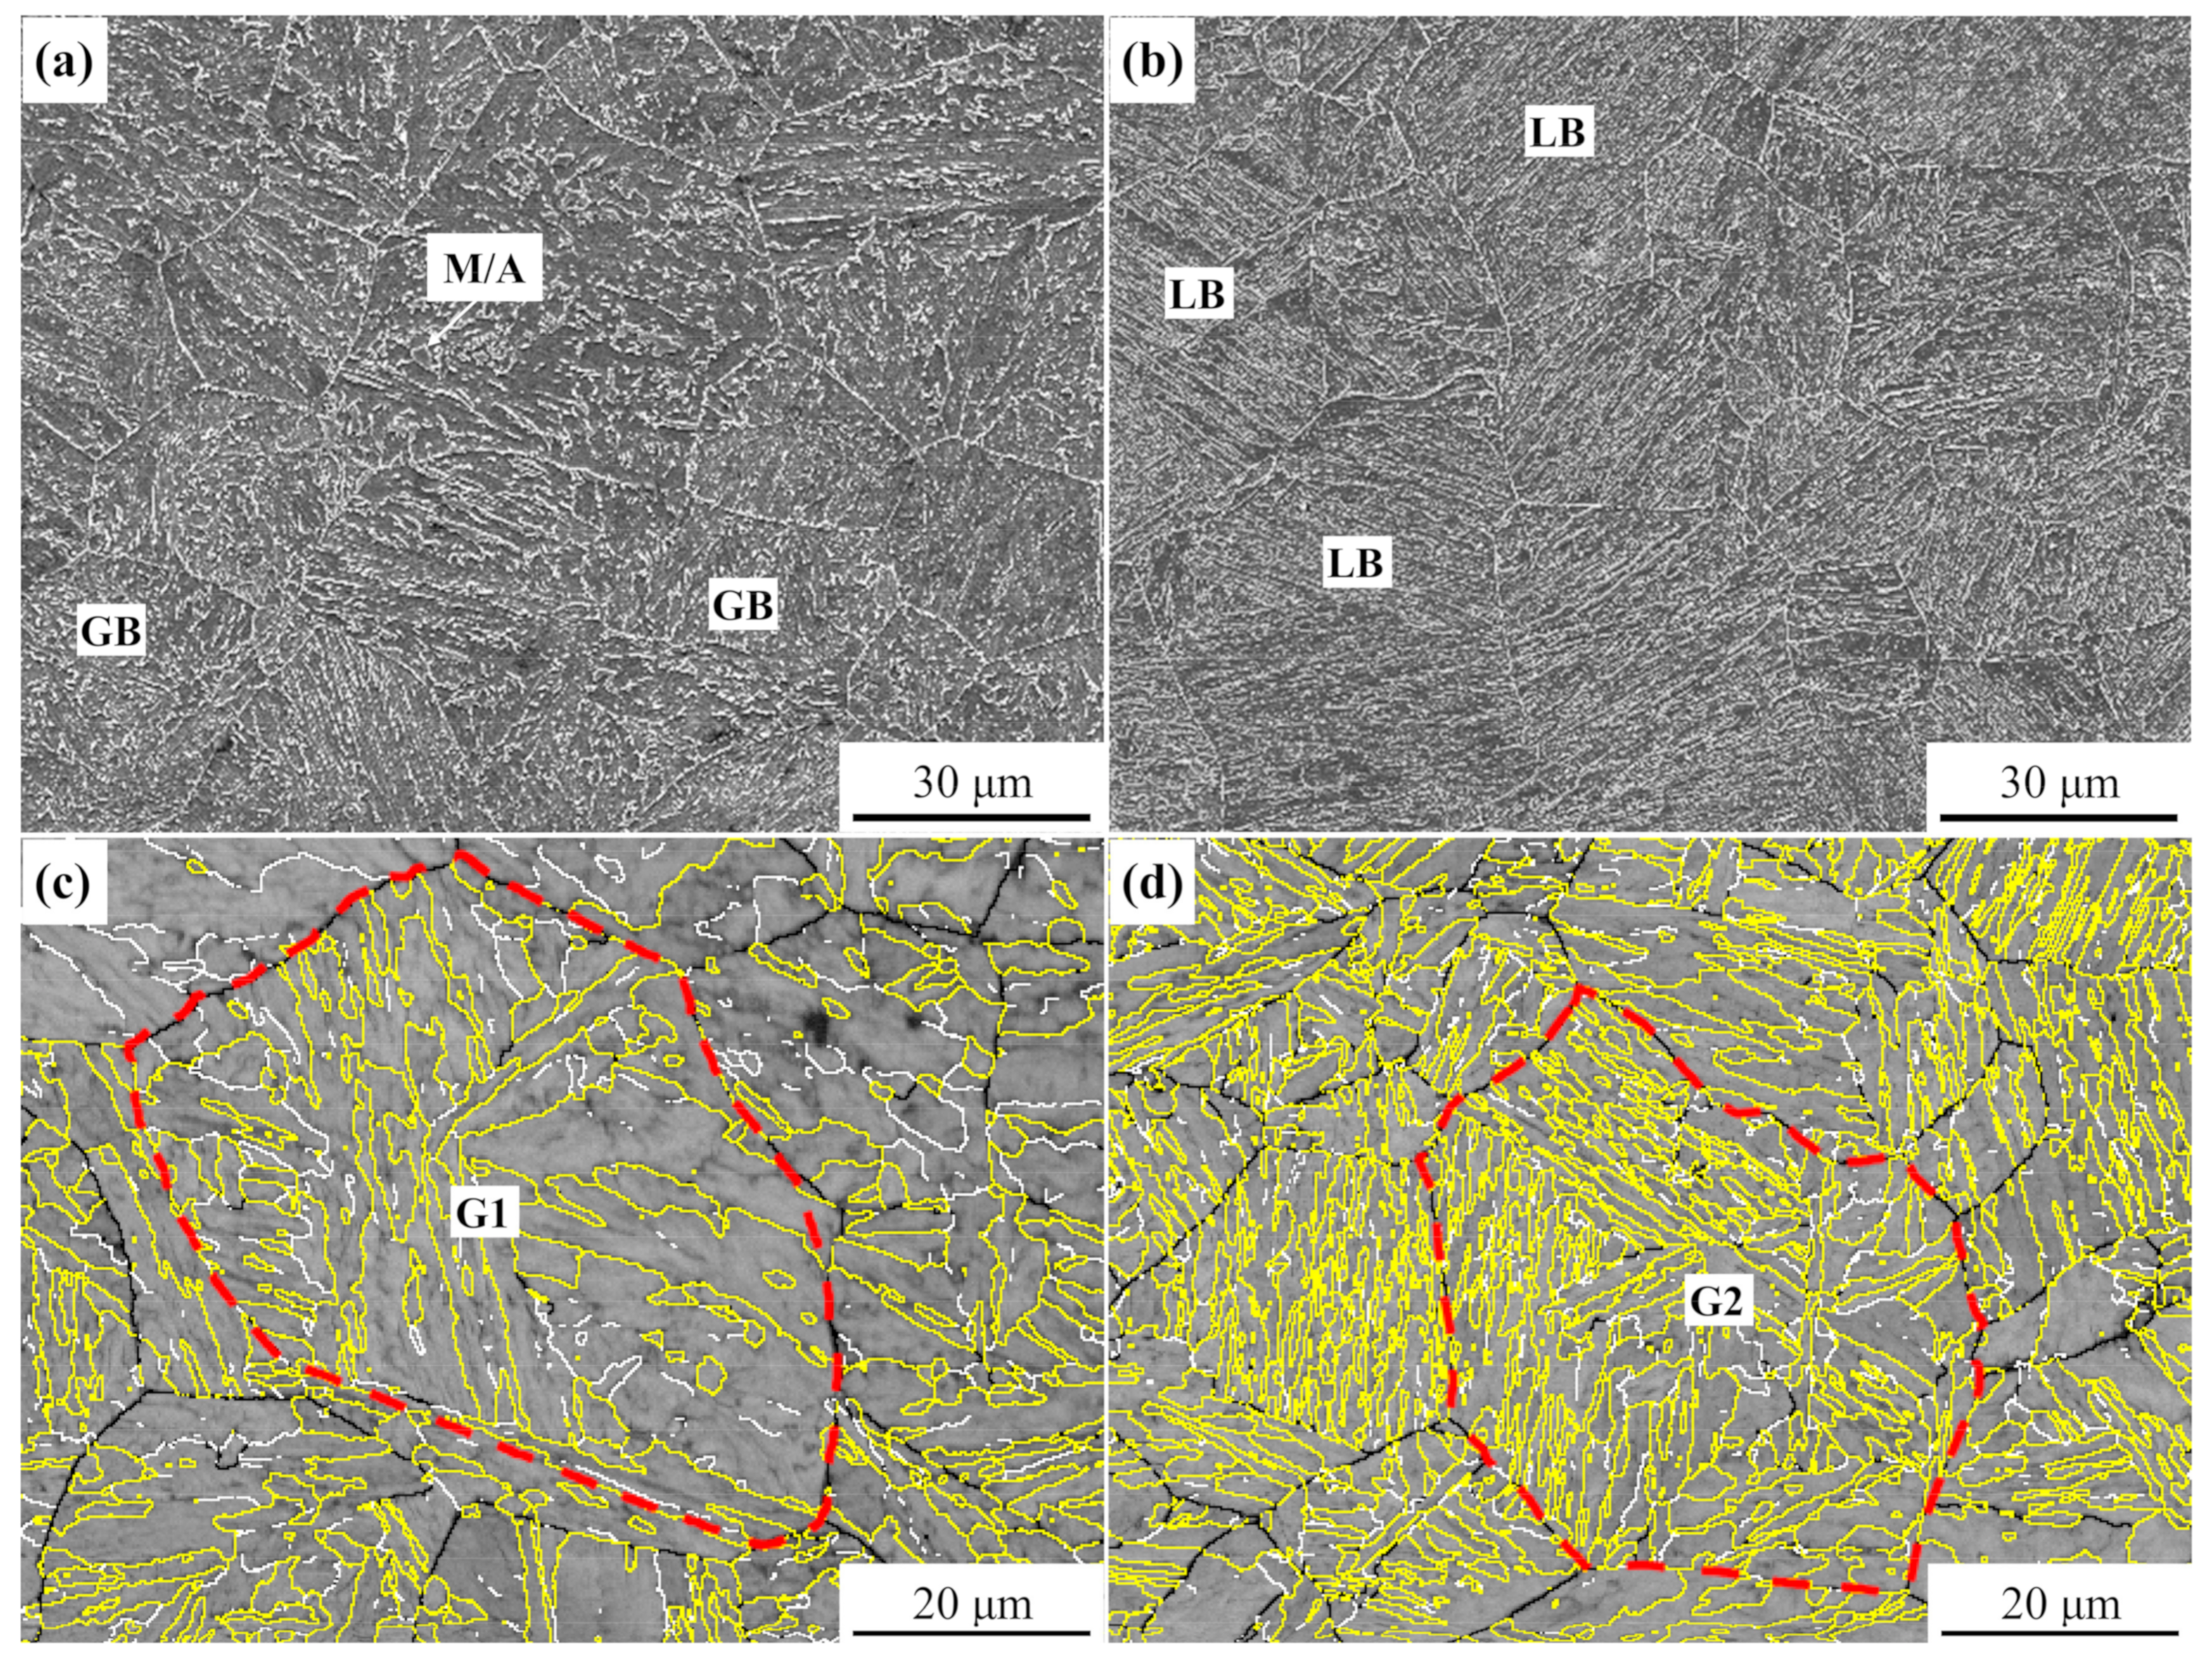
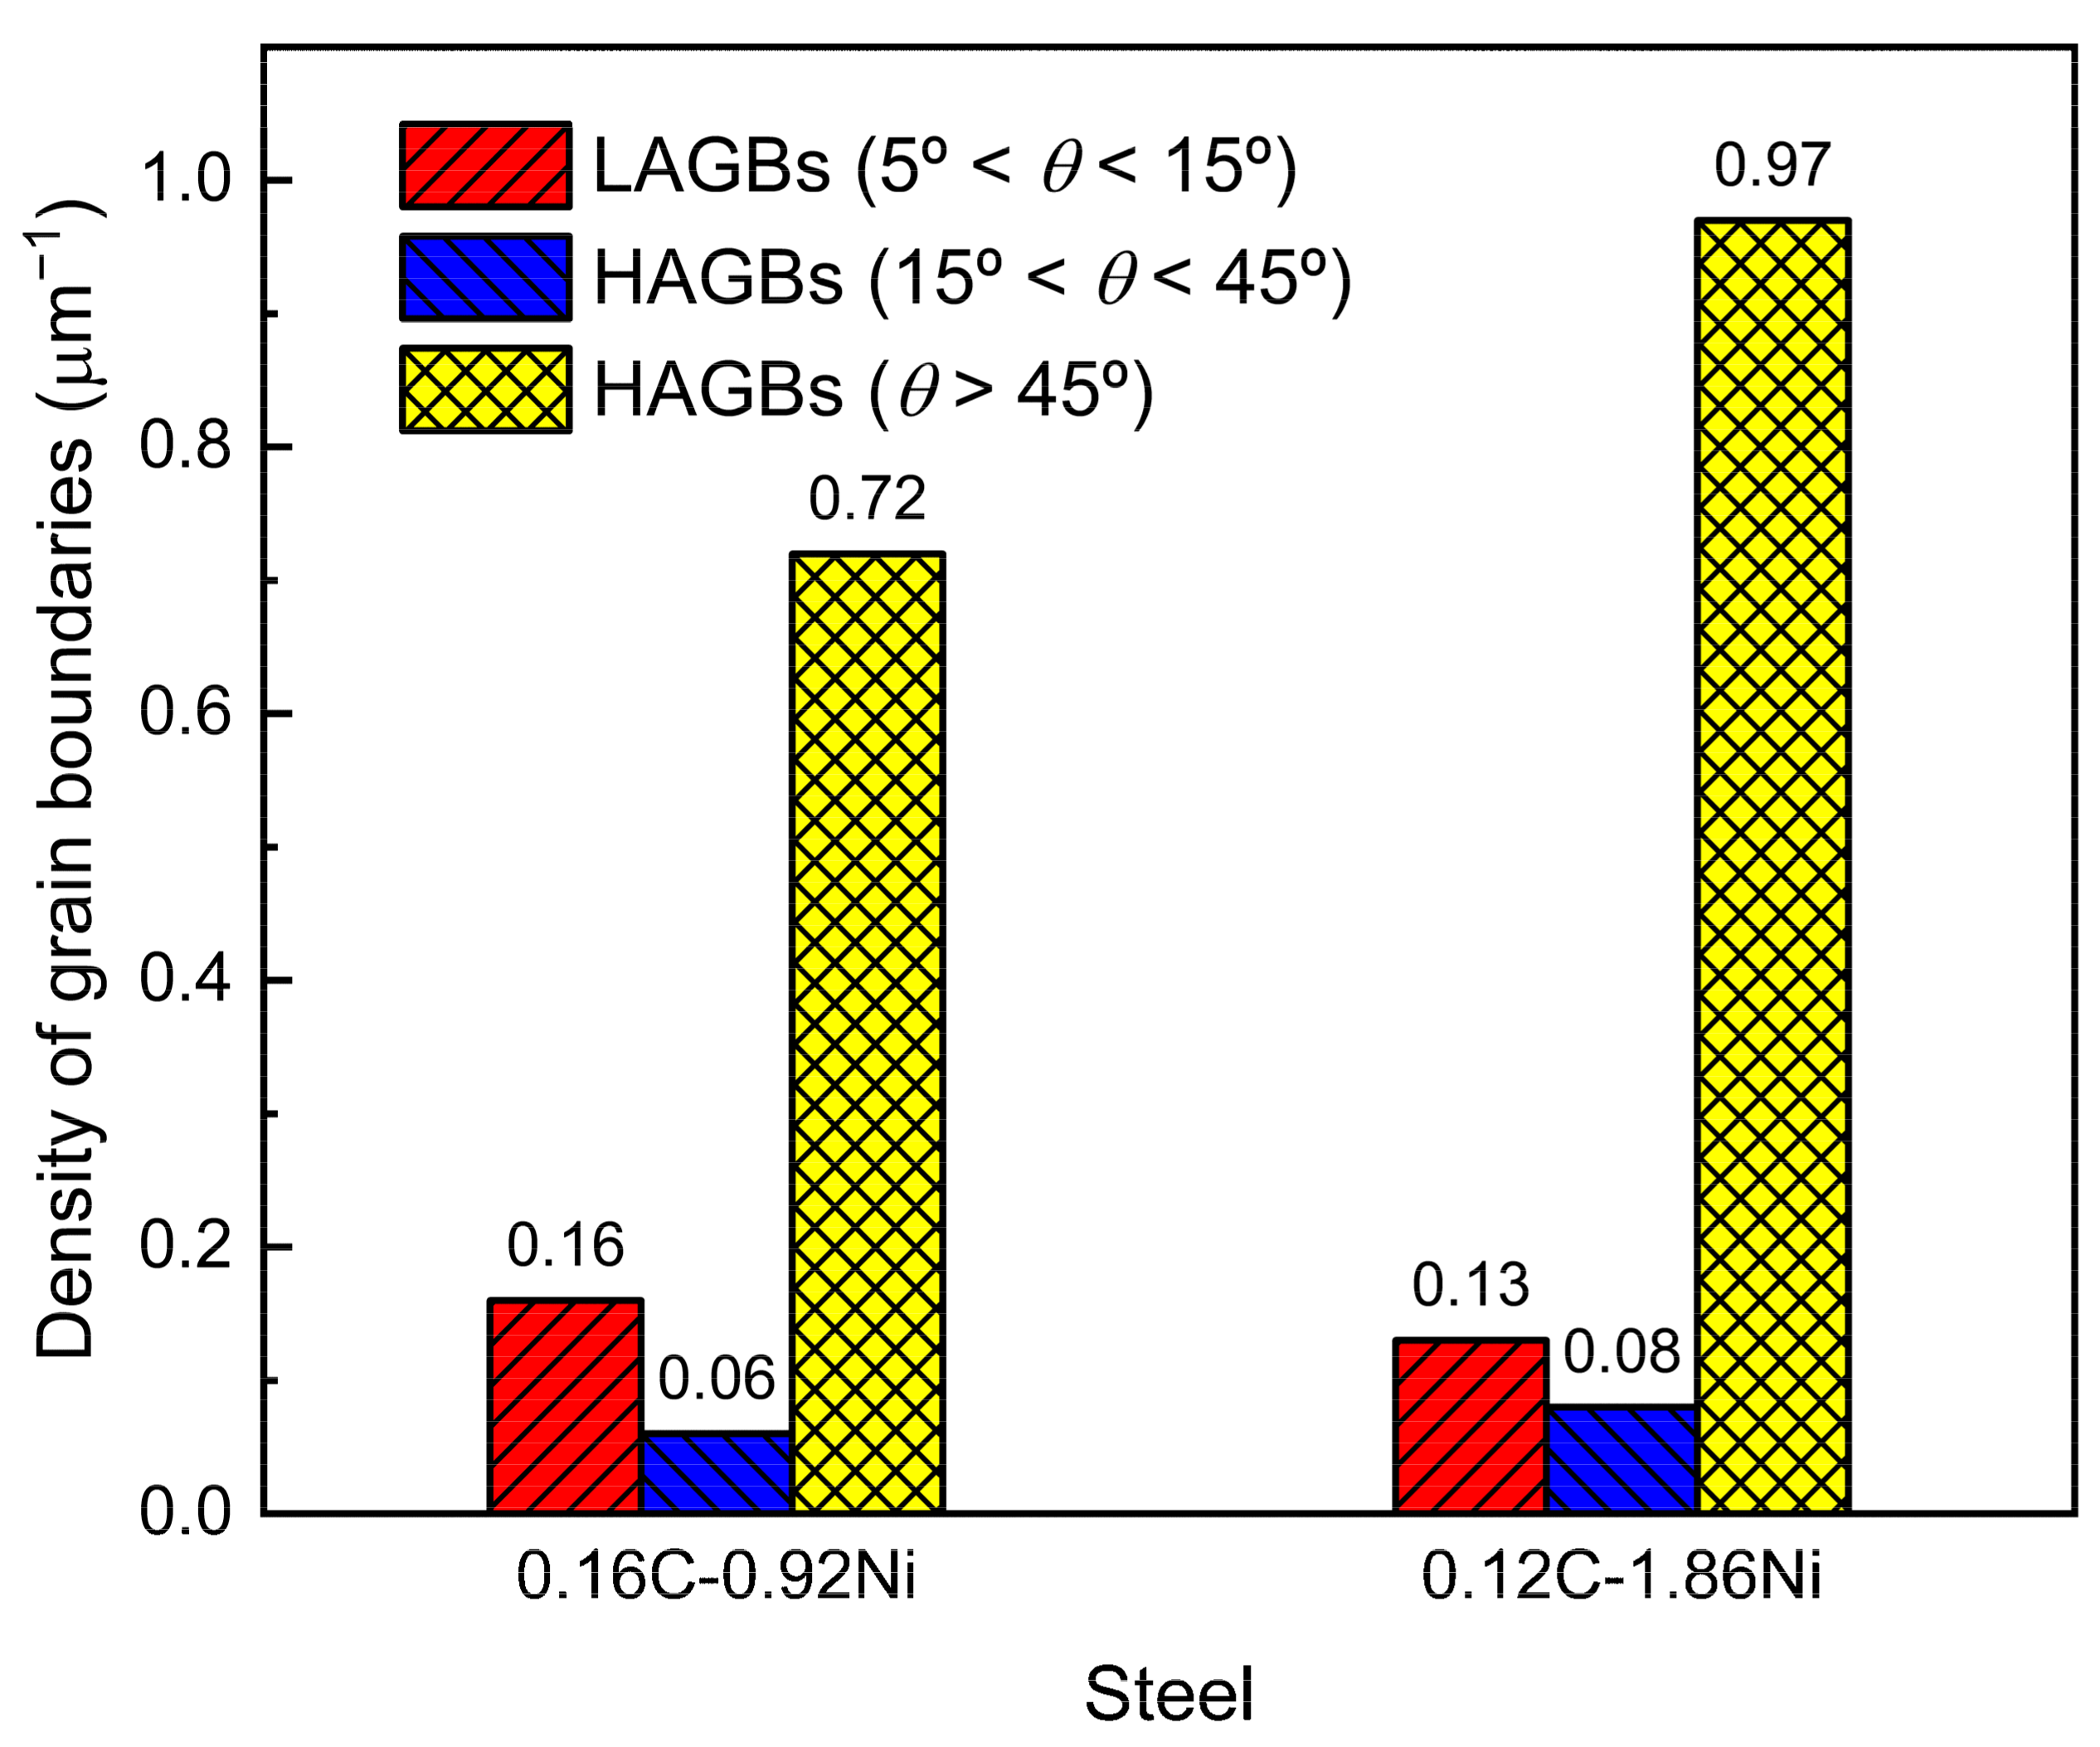
Figure 2 shows the SEM and EBSD results for both steels at a cooling rate of 0.5 °C/s. The microstructure of 0.16C-0.92Ni steel was mainly characterized by granular bainite, while that of 0.12C-1.86Ni steel exhibited typical lath bainite (Figure 2a,b). In addition, the morphology of M/A changed from block-shaped in 0.16C-0.92Ni steel to film-shaped with a smaller size in 0.12C-1.86Ni steel. The difference in morphology is also well reflected by the fact that the hardenability of 0.12C-1.86Ni steel was higher than that of 0.16C-0.92Ni steel. The low- and high-angle grain boundaries (LAGBs and HAGBs) are highlighted with white (5° < θ < 15°), black (15° < θ < 45°), or yellow (θ > 45°) lines in band contrast maps (Figure 2c,d). It can be seen that 0.16C-0.92Ni steel has more LAGBs with the distribution of HAGBs in a disordered and irregular pattern, while 0.12C-1.86Ni steel was dominated by HAGBs arranged in parallel, interspersed with a small number of LAGBs, and the density of HAGBs of 0.12C-1.86Ni steel was significantly greater than that of 0.16C-0.92Ni steel, especially the HAGBs with θ > 45°. A quantitative comparison of the grain boundary density is shown in Figure 3. It is shown that the density of the LAGBs and HAGBs is 0.16 and 0.78 μm−1 for 0.16C-0.92Ni steel, and 0.13 and 1.05 μm−1 for 0.12C-1.86Ni steel, respectively.

3.3. Variant Analysis: Digitization and Visualization

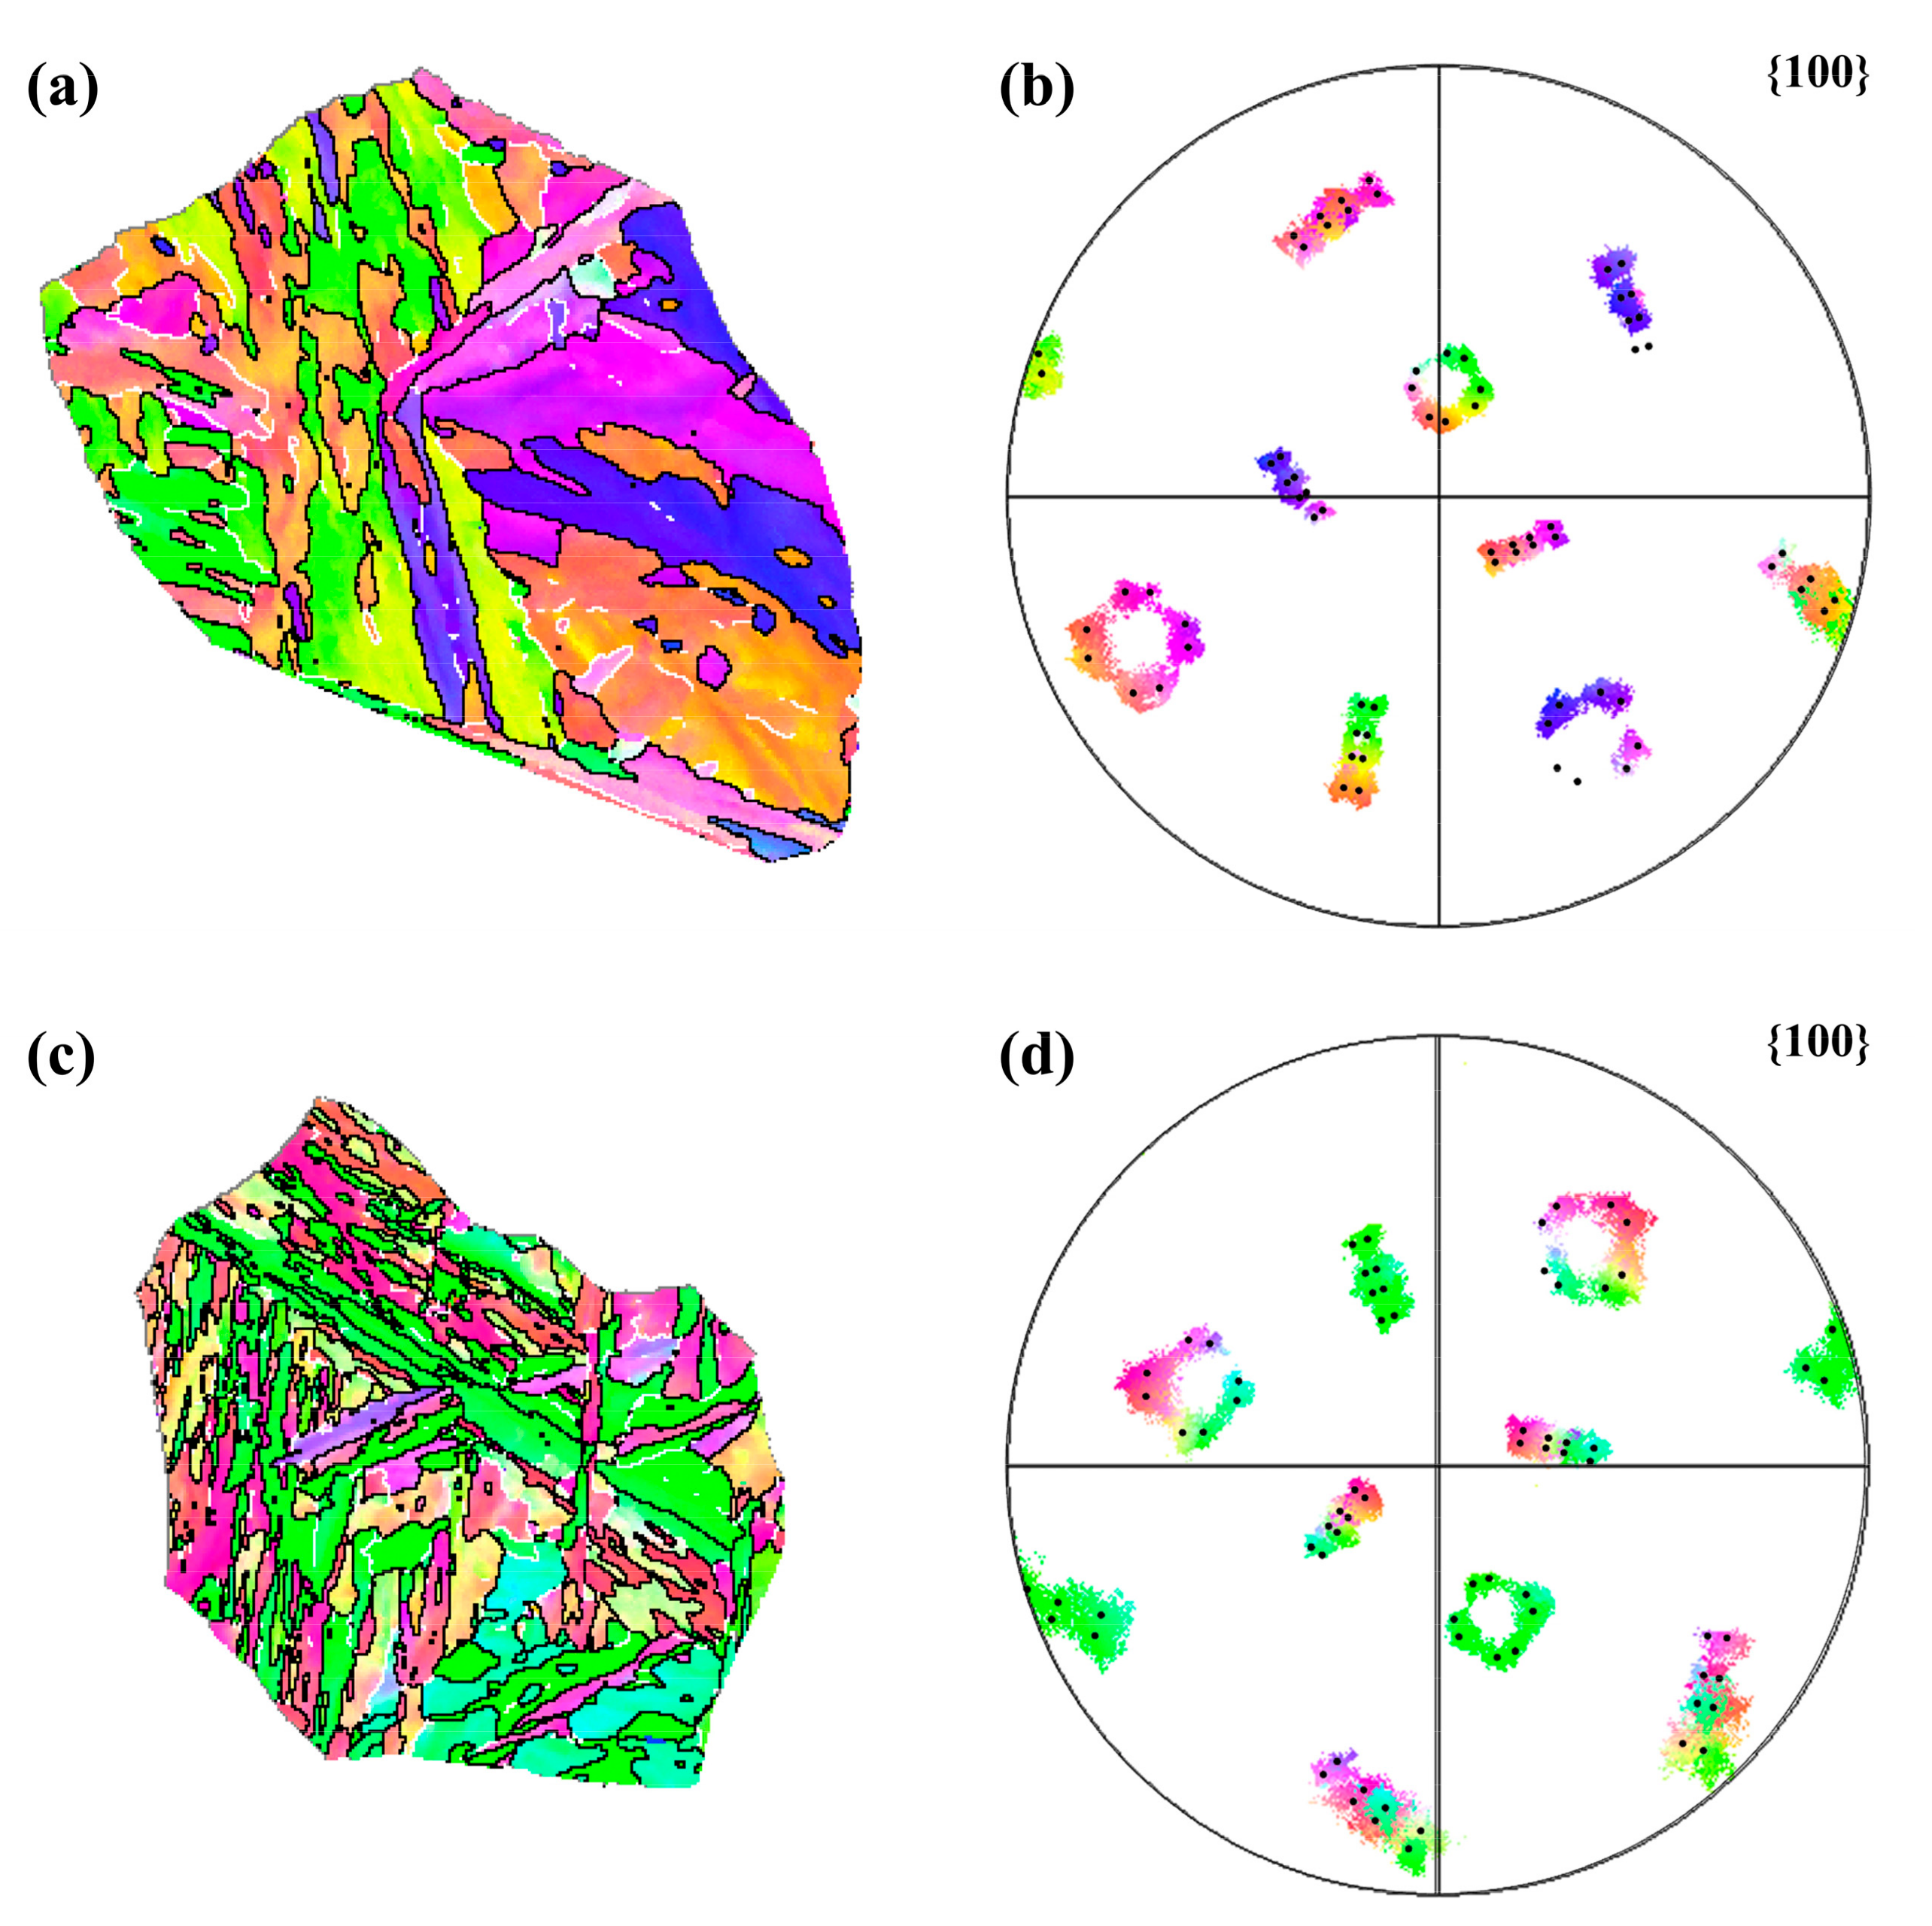
To clarify the origin of HAGBs in the two steels, a further inspection of the visualization and digitization of the crystallographic features was carried out. Figure 4 and Figure 5 depict the inner structure of representative grains, which are highlighted by red dotted lines in Figure 2c,d. The different colors in Figure 4 represent different orientations. The boundaries of the block structure in the inverse pole figure (IPF) correspond to the HAGBs, and thus the appearance of the high density of HAGBs is mainly due to the formation of many blocks. In addition, the pole figure (PF) shows that the experimental pole figure (colored graphs) coincides with the theoretical pole figure (black dotted graphs) based on the Kurdjumov–Sachs (K–S) orientation relationship, indicating that the variants in both G1 and G2 grains maintain a K–S relationship with the prior austenite [22,23].
As seen in the grain boundary maps, the G2 grain of 0.12C-1.86Ni steel exhibited a higher HAGB density (θ > 45°) and a finer structure compared to the G1 grain of 0.16C-0.92Ni steel. In general, there are 24 variants in low-carbon steels transformed from a single austenite grain, which can be divided into four CP (closed-packed plane) groups and three Bain groups [24]. The red, yellow and blue colors in the Bain group maps represent Bain1, Bain2 and Bain3, respectively, while the red, yellow, blue and green colors in the CP group maps represent CP1, CP2, CP3 and CP4, respectively. By combining the GB and Bain maps, it can be found that there were LAGBs between variants belonging to the same Bain group, and HAGBs between those belonging to different Bain groups. Previous studies show that Bain grouping of variants will occur when one Bain region includes distinct CP groups, and CP grouping of variants will emerge as one CP region consists of different Bain groups [20,25,26]. Hence, the transformation dominated by CP grouping would contribute to a high density of HAGBs. Both G1 and G2 grains were in the form of CP regions consisting of different Bain groups, but the Bain group width of the G2 grain was much finer. Therefore, the finer Bain groups facilitate the formation of denser HAGBs, which is the reason why the density of HAGBs in 0.12C-1.86Ni steel was higher than that in 0.16C-0.92Ni steel. The structural differences between the two steels are related to the variant selection. A report by Wang et al. suggested that granular bainite formed at a low cooling rate exhibited stronger variant selection in comparison with lath bainite formed at a high cooling rate [10]. Obviously, the variant selection in 0.12C-1.86Ni steel was weaker than that in 0.16C-0.92Ni steel, which promoted the formation of different variants, consistent with the results in [23].
In the austenite to martensite/bainite transformation, 24 variants are generally formed to maintain an approximate K–S orientation relationship with the parent austenite phase, and the variant selection affects the orientation, morphology, and mechanical properties of the transformation products [17,25,26,27,28,29]. Thus, it is necessary to analyze the crystallographic information quantitatively to elucidate the effect of lowering C and increasing Ni on variant selection. According to the crystallographic orientation data collected by EBSD, the average orientation relationship (OR) between parent austenite and product variants for two steels at a cooling rate of 0.5 °C/s was calculated through a MATLAB regression program. The mean OR (φ1, Φ, φ2) was obtained from the average of the five prior austenite grains, and the actual ORs of the two steels compared with the exact K–S ORs are listed in Table 3. Additionally, in order to clarify the variant pairing rules caused by lowering C and increasing Ni, the rotation angles/axes between V1 and the other variants for the two steels were calculated based on actual OR and Euler angle data from EBSD and summarized in Table 4, as well as the length density of the inter-variant boundaries calculated by this method. The actual OR is inconsistent with the exact K–S OR since there exists accommodation of transformation strain during martensite or bainite transformation [24]. It seems that there was a bigger deviation between the K—S OR and the actual OR of those variants within the Bain1 group (i.e., V1/V4, V8, V11, V13, V16, V21 and V24).
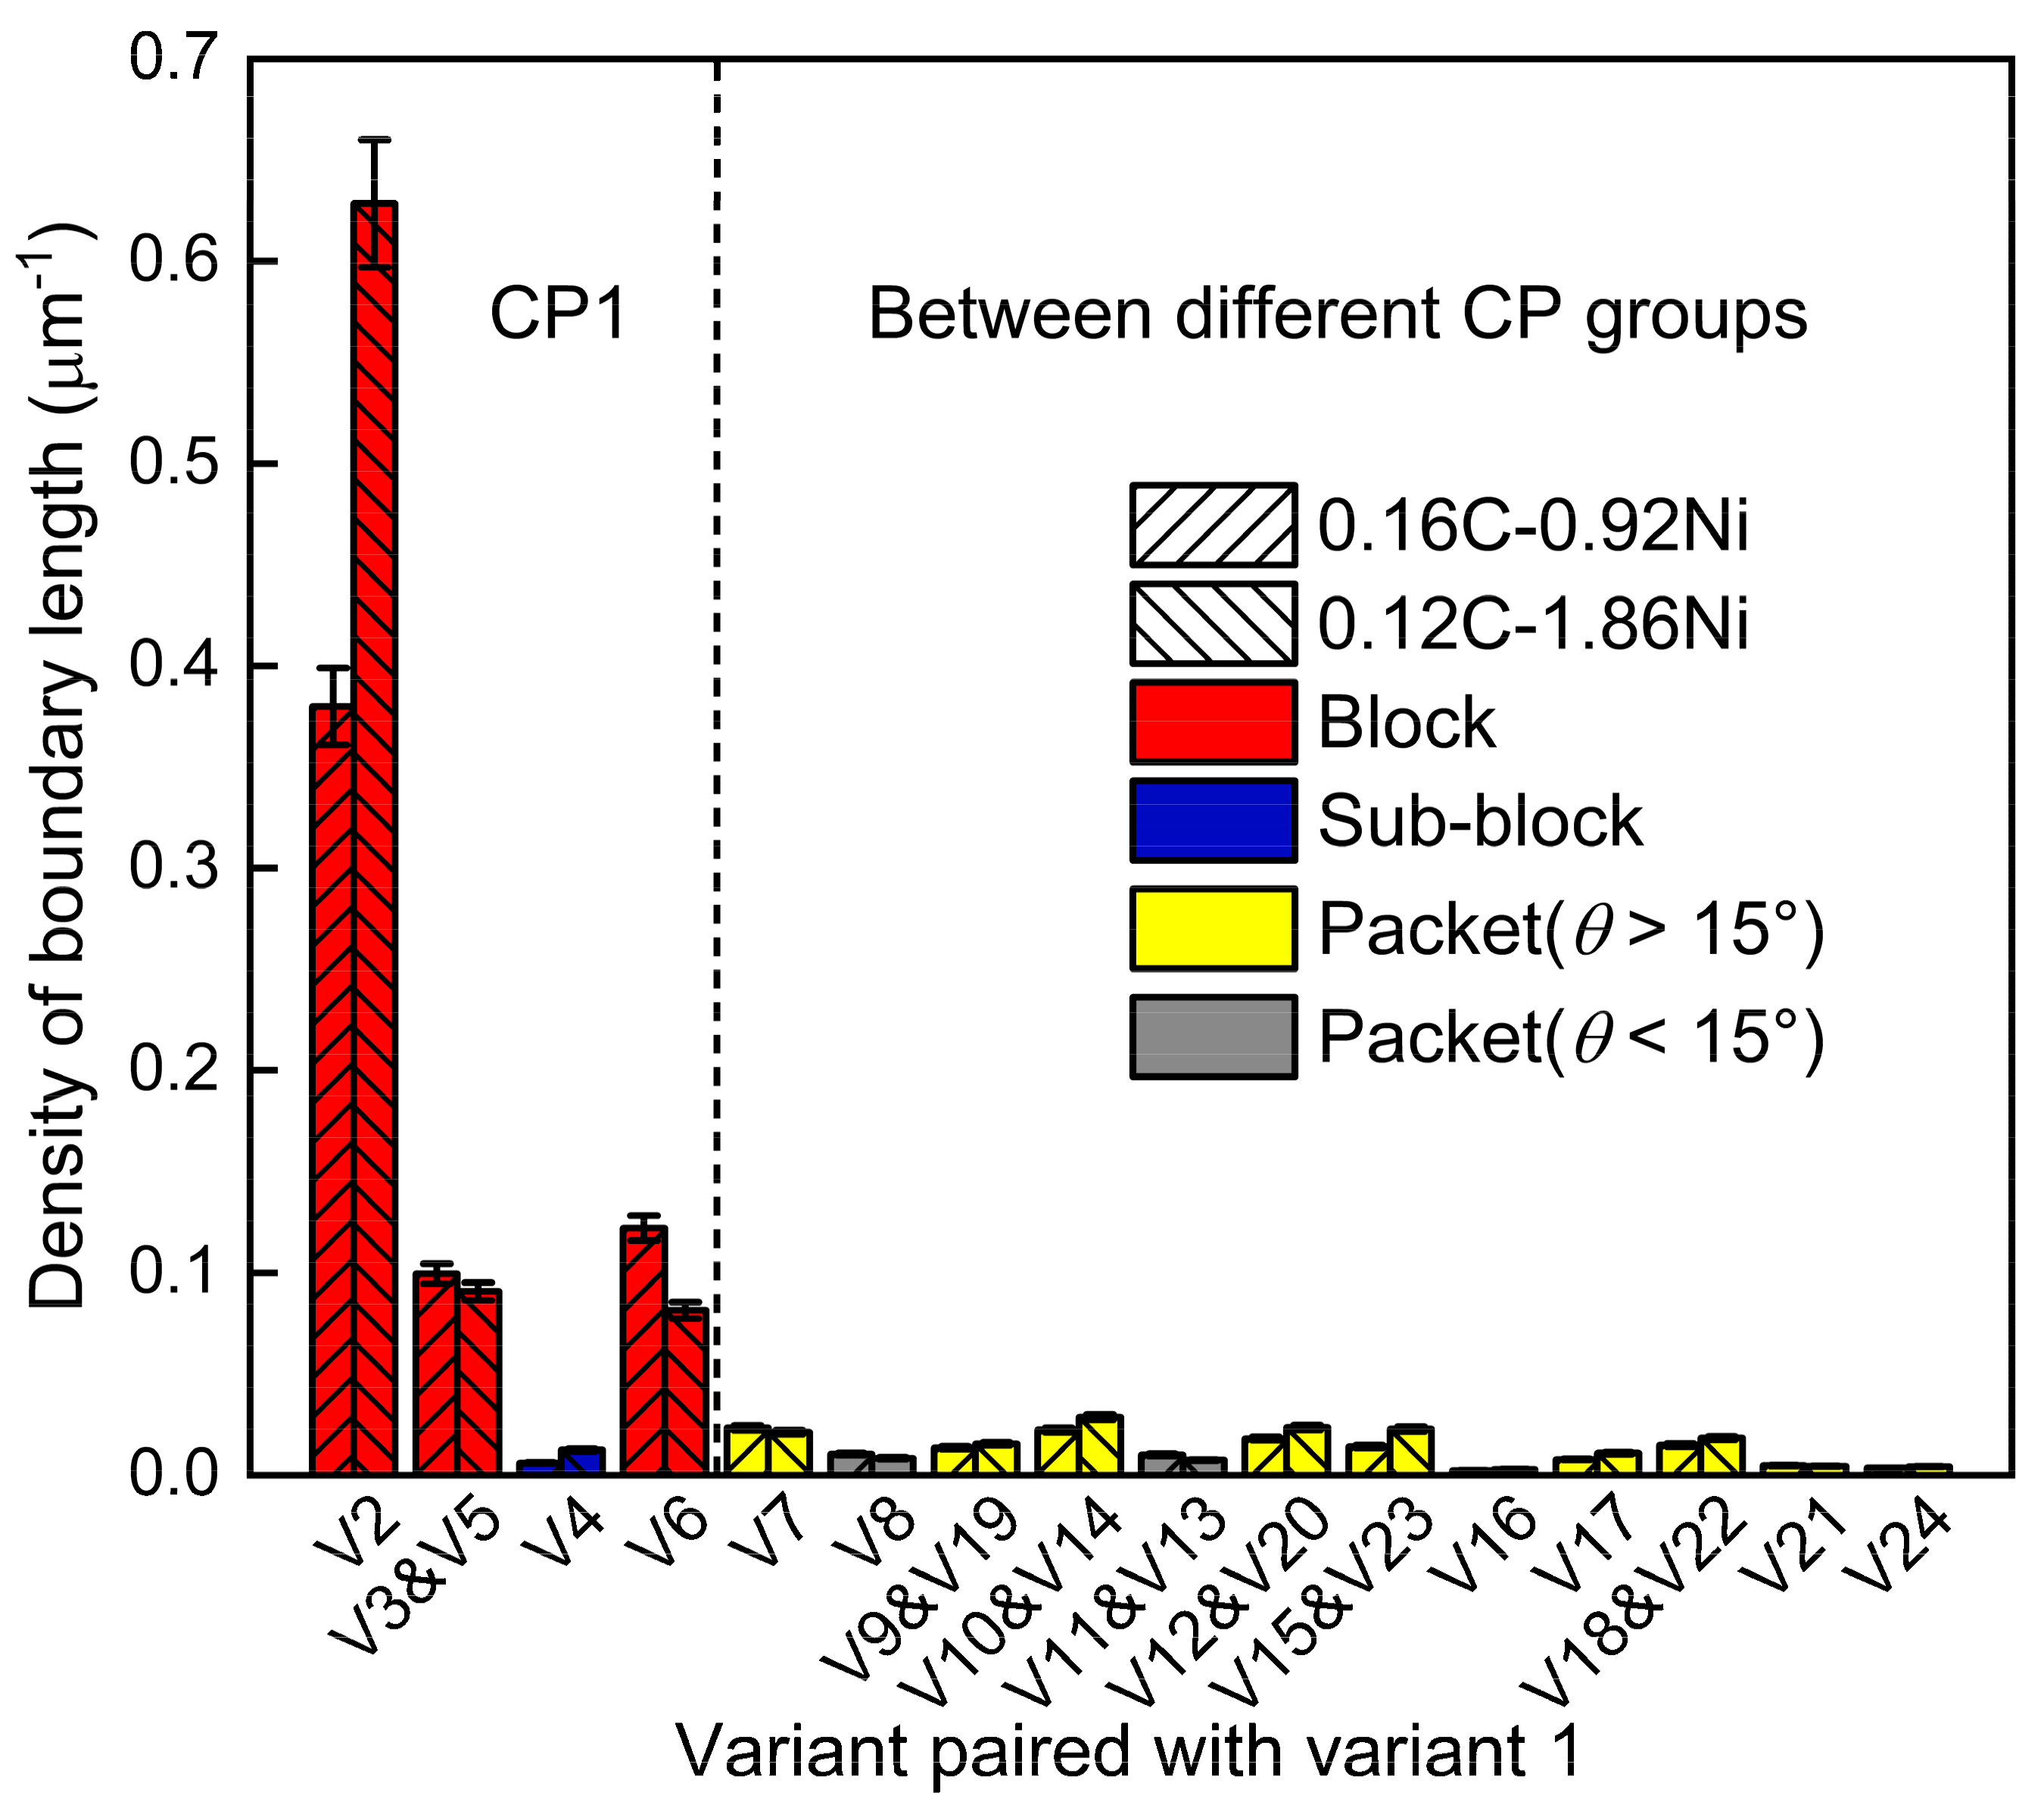
As listed in Table 4, the inter-variant boundaries from V1/V2-V6 variant pairs belonging to the same CP group are block boundaries, except for the V1/V4 variant pair whose boundary type is a sub-block boundary, while the other inter-variant boundaries are packet boundaries. Figure 6 quantitatively depicts the length density of inter-variant boundaries of the two steels at 0.5 °C/s cooling rate. It can be seen that the length density of the V1/V2, V1/V3 (and V5) and V1/V6 variant pairs was significantly higher than that of the other variant pairs, especially the V1/V2 variant pair. The total length density of block boundaries in 0.12C-1.86Ni steel was much higher than that in 0.16C-0.92Ni steel. In addition, the length density of the V1/V2 boundary in 0.12C-1.86Ni steel was significantly higher, and the length density of the V1/V6 boundary was slightly lower compared with 0.16C-0.92Ni steel. Clearly, the difference in the density of block boundaries between the two steels is mainly attributed to the V1/V2 boundary. Previous studies showed that the lower the bainite transformation temperature, the more V1/V2 variant pairs are formed [20,24,26,31]. In this work, the transformation starting temperature of 0.12C-1.86Ni steel was lower than that of 0.16C-0.92Ni steel, resulting in the formation of more V1/V2 variant pairs.
The transformation driving force and self-accommodation of transformation strain determine the variant selection [23,24,27]. Since 0.12C-1.86Ni steel has a lower transformation starting temperature than 0.16C-0.92Ni steel, its transformation driving force was higher. In addition, at the lower transformation temperature, the strength of the austenite was higher and thus more self-accommodation was needed. The larger driving forces and more self-accommodation will lead to the refinement of packets and blocks. As a result, the density of block boundaries was higher in 0.12C-1.86Ni steel. Moreover, more V1/V2 variant pairs were formed in 0.12C-1.86Ni steels because they provide the most efficient accommodation of transformation strain at lower temperatures [24,32,33].

3.4. Correlation of Crystallographic Structure and Hardness

The inter-variant boundaries were further categorized into block, sub-block and packet boundaries according to the boundary types [24]. The total density of these three crystallographic structures is illustrated in Figure 7, together with the Vickers hardness. Obviously, the density of block boundaries in 0.12C-1.86Ni steel was higher compared with that in 0.16C-0.92Ni steel, while the other boundary density did not differ much. It can be seen that hardness is related to the block-boundary density, and high-density block boundaries are beneficial to improve hardness, which is consistent with the results of previous studies [17,26]. This also indicates that the difference in hardness between the two steels is due to the density of HAGBs, that is, the higher the density of the HAGBs, the higher the hardness. According to the Hall–Petch relationship [34,35], it is known that the hardness is related to the effective grain size, not only the original austenite grain size, but also its complex internal structure size (e.g., packets, blocks and laths); the finer the effective grain size, the higher the hardness. A higher density of HAGBs means finer effective grain, which contributes to a higher hardness. It is inferred that the phase transformation product with a high density of HAGBs facilitates the increase in hardness.

4. Summary

Lowering C by 0.04% and increasing Ni by 0.94% ensures the weldability of ultra-heavy plates while maintaining high hardenability. The effect of lowering C and increasing Ni on the microstructure evolution and hardness at low cooling rates was analyzed by characterizing the morphology and crystallography, and the main findings can be summarized as follows.
At a low cooling rate of 0.5 °C/s, lowering C and increasing Ni reduced the bainite transformation temperature. The hardness of 0.12C-1.86Ni steel was higher than that of 0.16C-0.92Ni steel. It was observed that the 0.16C-0.92Ni steel was mainly dominated by granular bainite with a block-shaped M/A, while 0.12C-1.86Ni steel retained typical lath bainite with a film-shaped M/A structure at the low cooling rate. Although both steels exhibited the CP group containing different Bain groups, the 0.12C-1.86Ni steel has more and finer Bain groups compared with the 0.16C-0.92Ni steel. In addition, the density of the V1/V2 boundary in the 0.12C-1.86Ni steel was significantly higher. By lowering C and increasing Ni, the steel has smaller packets and blocks, higher density of block boundaries, and more V1/V2 variant pairs, which enhances the hardness at low cooling rates.

Author Contributions

Conceptualization, Z.L. and Y.Y.; methodology, J.Y.; software, Z.W.; validation, Z.L., Y.Y. and J.Y.; formal analysis, Z.L. and Y.Y.; investigation, J.Y.; resources, H.G.; data curation, Z.L. and J.Y.; writing—original draft preparation, Z.L.; writing—review and editing, Y.Y. and H.G.; visualization, Z.L.; supervision, H.G.; project administration, H.G. and C.S.; funding acquisition, H.G. and C.S. All authors have read and agreed to the published version of the manuscript.

Funding

This research was funded by the Key Research and Development Program of Shandong Province, China (No. 2019JZZY020238) and the National Natural Science Foundation of China (No. 51371001).

Institutional Review Board Statement

Not applicable.

Informed Consent Statement

Not applicable.

Data Availability Statement

Data are contained within the article.

Acknowledgments

The authors sincerely thank Yaohui Jin for providing materials in this study.

Conflicts of Interest

The authors declare no conflict of interest.

References

  1. Xie, Z.J.; Fang, Y.P.; Han, G.; Guo, H.; Misra, R.D.K.; Shang, C.J. Structure–property relationship in a 960 MPa grade ultrahigh strength low carbon niobium–vanadium microalloyed steel: The significance of high frequency induction tempering. Mater. Sci. Eng. A 2014, 618, 112–117. [Google Scholar] [CrossRef]
  2. Yu, Y.S.; Hu, B.; Gao, M.L.; Xie, Z.J.; Rong, X.Q.; Han, G.; Guo, H.; Shang, C.J. Determining role of heterogeneous microstructure in lowering yield ratio and enhancing impact toughness in high-strength low-alloy steel. Int. J. Miner. Metall. Mater. 2021, 28, 816–825. [Google Scholar] [CrossRef]
  3. Capdevila, C.; García-Mateo, C.; Chao, J.; Caballero, F.G. Advanced vanadium alloyed steel for heavy product applications. Mater. Sci. Technol. 2009, 25, 1383–1386. [Google Scholar] [CrossRef] [Green Version]
  4. An, F.C.; Zhao, S.X.; Xue, X.K.; Wang, J.J.; Yuan, G.; Liu, C.M. Incompleteness of bainite transformation in quenched and tempered steel under continuous cooling conditions. J. Mater. Res. Technol. 2020, 9, 8985–8996. [Google Scholar] [CrossRef]
  5. Pan, T.; Wang, X.; Su, H.; Yang, C. Effect of alloying element Al on hardenability and mechanical properties of micro-B treated ultra-heavy plate steels. Acta Metall. Sin. 2014, 50, 431–438. [Google Scholar] [CrossRef]
  6. Zhou, T.; Yu, H.; Wang, S.Y. Microstructural characterization and mechanical properties across thickness of ultra-heavy steel plate. Steel Res. Int. 2017, 88, 1700132. [Google Scholar] [CrossRef]
  7. Al Hajeri, K.F.; Garcia, C.I.; Hua, M.; Deardo, A.J. Particle-stimulated nucleation of ferrite in heavy steel sections. ISIJ Int. 2006, 46, 1233–1240. [Google Scholar] [CrossRef] [Green Version]
  8. Li, W.; Cao, R.; Zhu, W.; Guo, X.; Jiang, Y.; Chen, J. Microstructure evolution and impact toughness variation for high strength steel multi-pass weld metals with various cooling rates. J. Manuf. Processes 2021, 65, 245–257. [Google Scholar] [CrossRef]
  9. Kong, X.; Lan, L. Optimization of mechanical properties of low carbon bainitic steel using TMCP and accelerated cooling. Procedia Eng. 2014, 81, 114–119. [Google Scholar] [CrossRef] [Green Version]
  10. Wang, X.L.; Wang, Z.Q.; Dong, L.L.; Shang, C.J.; Ma, X.P.; Subramanian, S.V. New insights into the mechanism of cooling rate on the impact toughness of coarse grained heat affected zone from the aspect of variant selection. Mater. Sci. Eng. A 2017, 704, 448–458. [Google Scholar] [CrossRef]
  11. Wang, X.L.; Ma, X.P.; Wang, Z.Q.; Subramanian, S.V.; Xie, Z.J.; Shang, C.J.; Li, X.C. Carbon microalloying effect of base material on variant selection in coarse grained heat affected zone of X80 pipeline steel. Mater. Charact. 2019, 149, 26–33. [Google Scholar] [CrossRef]
  12. Asahi, H. Effects of Mo addition and austenitizing temperature on hardenability of low alloy B-added steels. ISIJ Int. 2002, 42, 1150–1155. [Google Scholar] [CrossRef]
  13. Hara, T.; Asahi, H.; Uemori, R.; Tamehiro, H. Role of combined addition of niobium and boron and of molybdenum and boron on hardnenability in low carbon steels. ISIJ Int. 2004, 44, 1431–1440. [Google Scholar] [CrossRef]
  14. Han, F.; Hwang, B.; Suh, D.W.; Wang, Z.; Lee, D.L.; Kim, S.J. Effect of molybdenum and chromium on hardenability of low-carbon boron-added steels. Met. Mater. Int. 2008, 14, 667–672. [Google Scholar] [CrossRef]
  15. Li, Y.J.; Ponge, D.; Choi, P.; Raabe, D. Atomic scale investigation of non-equilibrium segregation of boron in a quenched Mo-free martensitic steel. Ultramicroscopy 2015, 159, 240–247. [Google Scholar] [CrossRef]
  16. Takahashi, J.; Ishikawa, K.; Kawakami, K.; Fujioka, M.; Kubota, N. Atomic-scale study on segregation behavior at austenite grain boundaries in boron- and molybdenum-added steels. Acta Mater. 2017, 133, 41–54. [Google Scholar] [CrossRef]
  17. Huang, S.; Wu, B.B.; Wang, Z.Q.; Yu, Y.S.; Wang, C.S.; Yan, L.; Li, X.C.; Shang, C.J.; Misra, R.D.K. EBSD study on the significance of carbon content on hardenability. Mater. Lett. 2019, 254, 412–414. [Google Scholar] [CrossRef]
  18. Dossett, J.L.; Totten, G.E. ASM Handbook Volume 4A: Steel Heat Treating Fundamentals and Processes; ASM International: Materials Park, OI, USA, 2013. [Google Scholar]
  19. Chung, Y.D.; Fujii, H.; Ueji, R.; Tsuji, N. Friction stir welding of high carbon steel with excellent toughness and ductility. Scripta Mater. 2010, 63, 223–226. [Google Scholar] [CrossRef]
  20. Huang, S.; Yu, Y.S.; Wang, Z.Q.; Su, S.; Chen, K.; Yuan, S.F.; Xie, Z.J.; Shang, C.J. Crystallographic insights into the role of nickel on hardenability of wear-resistant steels. Mater. Lett. 2022, 306, 130961. [Google Scholar] [CrossRef]
  21. Huang, G.; Wan, X.; Wu, K.; Zhao, H.; Misra, R.D. Effects of small Ni addition on the microstructure and toughness of coarse-grained heat-affected zone of high-strength low-alloy steel. Metals 2018, 8, 718. [Google Scholar] [CrossRef] [Green Version]
  22. Miyamoto, G.; Hori, R.; Poorganji, B.; Furuhara, T. Crystallographic analysis of proeutectoid ferrite/austenite interface and interphase precipitation of vanadium carbide in medium-carbon steel. Metall. Mater. Trans. A 2013, 44, 3436–3443. [Google Scholar] [CrossRef] [Green Version]
  23. Kawata, H.; Sakamoto, K.; Moritani, T.; Morito, S.; Furuhara, T.; Maki, T. Crystallography of ausformed upper bainite structure in Fe-9Ni-C alloys. Mater. Sci. Eng. A 2006, 438–440, 140–144. [Google Scholar] [CrossRef]
  24. Takayama, N.; Miyamoto, G.; Furuhara, T. Effects of transformation temperature on variant pairing of bainitic ferrite in low carbon steel. Acta Mater. 2012, 60, 2387–2396. [Google Scholar] [CrossRef]
  25. Yu, Y.-S.; Wang, Z.-Q.; Wu, B.-B.; Zhao, J.-X.; Wang, X.-L.; Guo, H.; Shang, C.-J. Tailoring variant pairing to enhance impact toughness in high-strength low-alloy steels via trace carbon addition. Acta Metall. Sin. (Engl. Lett.) 2021, 34, 755–764. [Google Scholar] [CrossRef]
  26. Yu, Y.S.; Wang, Z.Q.; Wu, B.B.; Rong, X.Q.; Wei, L.J.; Yuan, S.F.; Guo, H.; Shang, C.J. New insight into the hardenability of high strength low alloy steel from the perspective of crystallography. Mater. Lett. 2021, 292, 129624. [Google Scholar] [CrossRef]
  27. Furuhara, T.; Chiba, T.; Kaneshita, T.; Wu, H.; Miyamoto, G. Crystallography and interphase boundary of martensite and bainite in steels. Metall. Mater. Trans. A 2017, 48, 2739–2752. [Google Scholar] [CrossRef]
  28. Miyamoto, G.; Iwata, N.; Takayama, N.; Furuhara, T. Variant selection of lath martensite and bainite transformation in low carbon steel by ausforming. J. Alloys Compd. 2013, 577, S528–S532. [Google Scholar] [CrossRef]
  29. Chiba, T.; Miyamoto, G.; Furuhara, T. Comparison of variant selection between lenticular and lath martensite transformed from deformed austenite. ISIJ Int. 2013, 53, 915–919. [Google Scholar] [CrossRef] [Green Version]
  30. Morito, S.; Tanaka, H.; Konishi, R.; Furuhara, T.; Maki, T. The morphology and crystallography of lath martensite in Fe-C alloys. Acta Mater. 2003, 51, 1789–1799. [Google Scholar] [CrossRef]
  31. Wu, B.B.; Wang, Z.Q.; Yu, Y.S.; Wang, X.L.; Shang, C.J.; Misra, R.D.K. Thermodynamic basis of twin-related variant pair in high strength low alloy steel. Scripta Mater. 2019, 170, 43–47. [Google Scholar] [CrossRef]
  32. Filippov, S.A.; Zolotorevsky, N.Y. Orientation relationship and variant pairing in bainite of low carbon steels depending on thermomechanical treatment. Mater. Lett. 2018, 214, 130–133. [Google Scholar] [CrossRef]
  33. Lambert-Perlade, A.; Gourgues, A.F.; Pineau, A. Austenite to bainite phase transformation in the heat-affected zone of a high strength low alloy steel. Acta Mater. 2004, 52, 2337–2348. [Google Scholar] [CrossRef]
  34. Morris, J.W.; Lee, C.S.; Guo, Z. The nature and consequences of coherent transformations in steel. ISIJ Int. 2003, 43, 410–419. [Google Scholar] [CrossRef]
  35. Guo, Z.; Lee, C.S.; Morris, J.W. On coherent transformations in steel. Acta Mater. 2004, 52, 5511–5518. [Google Scholar] [CrossRef]
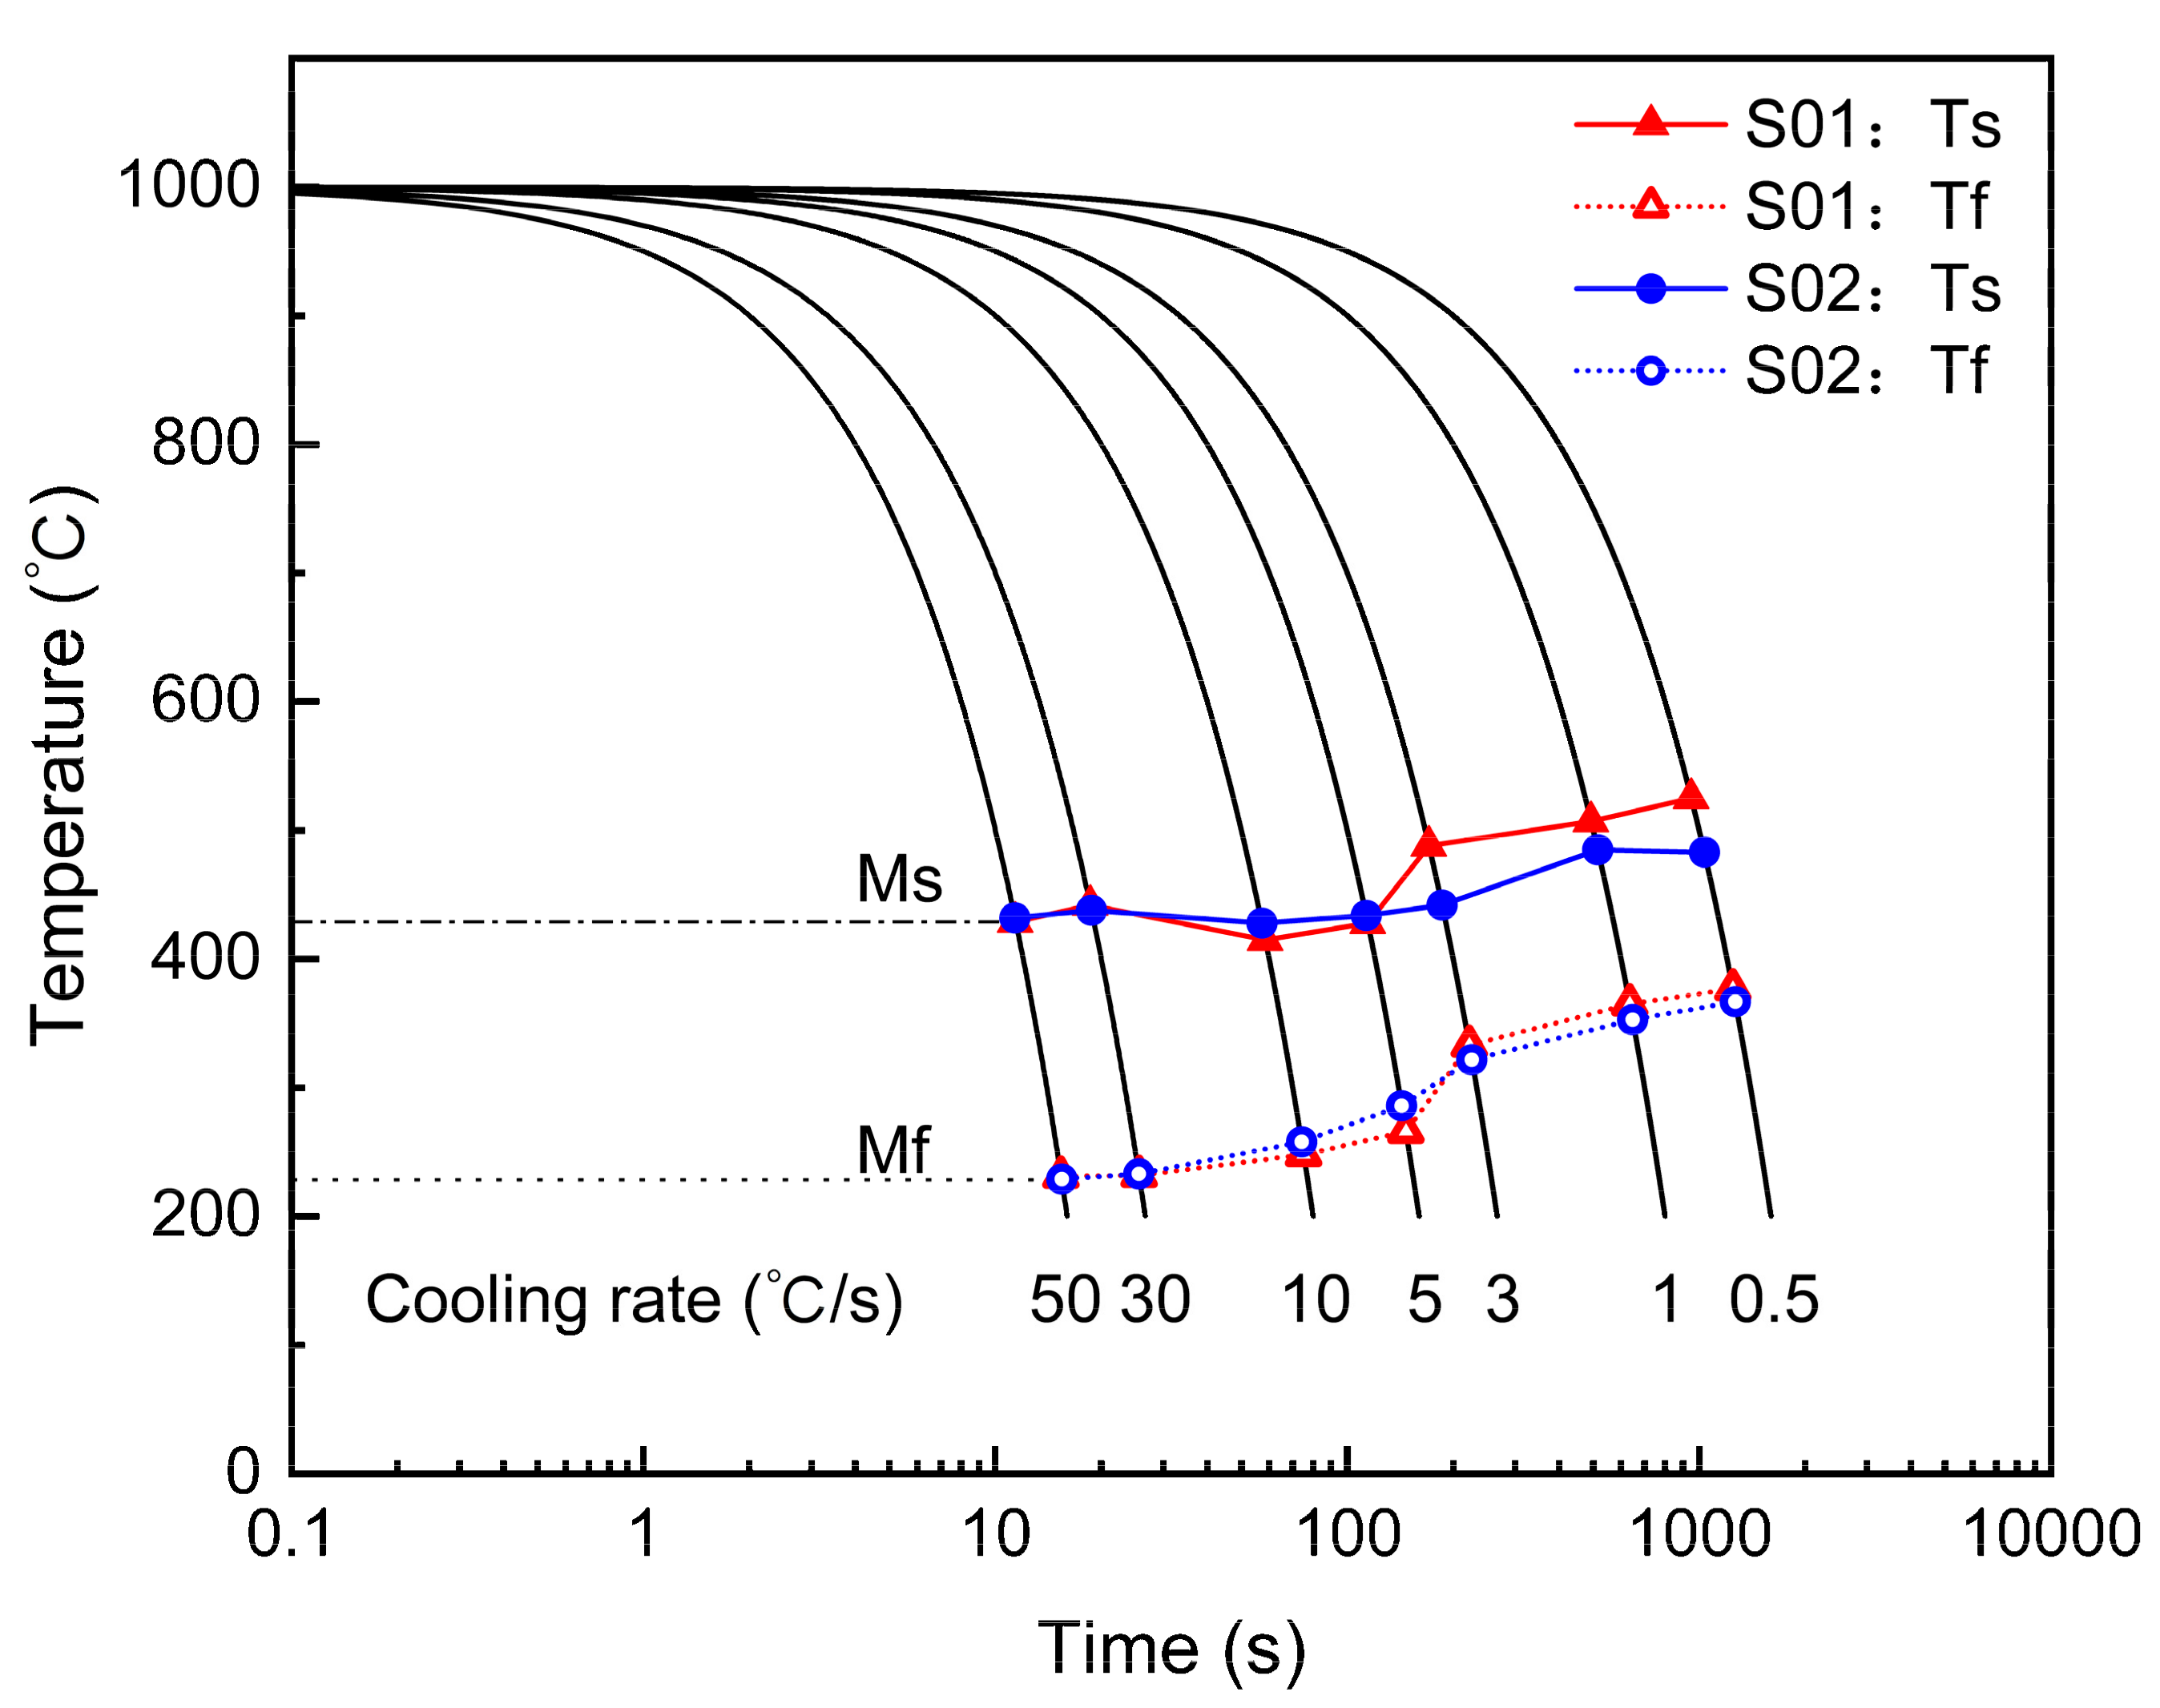
Figure 1. CCT diagrams of two steels at different cooling rates (S01: 0.16C-0.92Ni steel, S02: 0.12C-1.86Ni, Ts/Ms: starting temperature of phase transformation, Tf/Mf: finishing temperature of phase transformation).
Metals 12 00032 g001
Figure 2. SEM micrographs and band contrast (BC) maps depicting the boundary distribution of two steels cooled at 0.5 °C/s: (a,c) 0.16C-0.92Ni steel; (b,d) 0.12C-1.86Ni steel. (GB: granular bainite, LB: lath bainite; G1 and G2: representative grains of two steels; white line: 5° < θ < 15°, black line: 15° < θ < 45°, yellow line: θ > 45°; θ-misorientation).
Metals 12 00032 g002
Figure 3. Grain boundary density of two steels at 0.5 °C/s cooling rate.
Metals 12 00032 g003
Figure 4. Inverse pole figure (IPF) and pole figure (PF) of representative grains of two steels cooled at 0.5 °C/s: (a,b) G1 of 0.16C-0.92Ni steel and (c,d) G2 of 0.12C-1.86Ni steel. (Black dotted graphs: theoretical polar plot based on K–S relationship; colored graphs: experimental pole figure).
Metals 12 00032 g004
Figure 5. Grain boundary (GB), CP group and Bain group maps depicting the microstructure of representative grains of two steels cooled at 0.5 °C/s.
Metals 12 00032 g005
Figure 6. Length density of inter-variant boundaries in two steels cooled at 0.5 °C/s.
Metals 12 00032 g006
Figure 7. Boundary density and Vickers hardness of the steels cooled at 0.5 °C/s.
Metals 12 00032 g007
Table 1. Chemical composition of the studied steels (wt.%).
SteelCSiMnNiCr + MoV + TiBSP
0.16C-0.92Ni0.160.381.010.921.1070.0980.00150.00820.0171
0.12C-1.86Ni0.120.401.031.861.1090.0960.00140.00810.0172
Table 2. Vickers hardness of two steels at different cooling rate (HV1).
SteelCooling Rate (°C/s)
0.5135103050
0.16C-0.92Ni333.6359.4385.8419.6421.2425.6439.4
0.12C-1.86Ni365.0365.6380.8383.0395.0399.8399.4
Table 3. Orientation relationship (OR) of two steels at 0.5 °C/s cooling rate.
ORSteelEuler Angle
φ1 (°)Φ (°)φ2 (°)
Exact K–S OR 114.210.5204.2
Actual OR0.16C-0.92Ni120.68.6195.6
0.12C-1.86Ni122.39.3194.2
Table 4. Misorientation axes and angles between V1 and the other variants calculated from the experimentally determined OR (actual OR), and the inter-variant boundary characteristics [24,30].
VariantPlane ParallelDirection ParallelRotation Angle/Axis from V1CP GroupBain GroupBoundary Type
Exact K-S OR0.16C-0.92Ni0.12C-1.86Ni
V1(111)γ//(011)α[−101]γ//[−1−11]αCP1B1
V2[−101]γ//[−11−1]α60.0°/[1,1,−1]60.3°60.2°B2Block
V3[01−1]γ//[−1−11]α60.0°/[0,1,1]60.0°60.0°B3Block
V4[01−1]γ//[−11−1]α10.5°/[0,−1,−1]5.0°5.3°B1Sub-block
V5[1−10]γ//[−1−11]α60.0°/[0,−1,−1]60.0°60.0°B2Block
V6[1−10]γ//[−11−1]α49.5°/[0,1,1]55.2°54.7°B3Block
V7(1−11)γ//(011)α[10−1]γ//[−1−11]α49.5°/[−1,−1,1]52.2°50.8°CP2B2Packet
V8[10−1]γ//[−11−1]α10.5°/[1,1,−1]8.9°10.2°B1Packet
V9[−1−10]γ//[−1−11]α50.5°/[−10,3,−13]53.1°52.5°B3Packet
V10[−1−10]γ//[−11−1]α50.5°/[−7,−5,5]51.9°51.0°B2Packet
V11[011]γ//[−1−11]α14.9°/[13,5,1]12.1°13.1°B1Packet
V12[011]γ//[−11−1]α57.2°/[−3,5,6]57.9°57.7°B3Packet
V13(−111)γ//(011)α[0−11]γ//[−1−11]α14.9°/[5,−13,−1]12.1°13.1°CP3B1Packet
V14[0−11]γ//[−11−1]α50.5°/[−5,5,−7]51.9°51.0°B3Packet
V15[−10−1]γ//[−1−11]α57.2°/[−6,−2,5]57.0°56.2°B2Packet
V16[−10−1]γ//[−11−1]α20.6°/[11,−11,−6]15.1°16.1°B1Packet
V17[110]γ//[−1−11]α51.7°/[−11,6,−11]51.9°51.4°B3Packet
V18[110]γ//[−11−1]α47.1°/[−24,−10,21]52.3°51.1°B2Packet
V19(11−1)γ//(011)α[−110]γ//[−1−11]α50.5°/[−3,13,10]53.1°52.5°CP4B3Packet
V20[−110]γ//[−11−1]α57.2°/[3,6,−5]57.9°57.7°B2Packet
V21[0−1−1]γ//[−1−11]α20.6°/[3,0,−1]16.7°18.3°B1Packet
V22[0−1−1]γ//[−11−1]α47.1°/[−10,21,24]52.3°51.1°B3Packet
V23[101]γ//[−1−11]α57.2°/[−2,−5,−6]57.0°56.2°B2Packet
V24[101]γ//[−11−1]α21.1°/[9,−4,0]17.2°18.6°B1Packet
Publisher’s Note: MDPI stays neutral with regard to jurisdictional claims in published maps and institutional affiliations.