Article

On the Effect of Heat Input and Interpass Temperature on the Performance of Inconel 625 Alloy Deposited Using Wire Arc Additive Manufacturing–Cold Metal Transfer Process

1
School of Mechanical, Materials, Mechatronic and Biomedical Engineering, University of Wollongong, Northfields Avenue, Wollongong, NSW 2522, Australia
2
Australian Nuclear Science and Technology Organisation (ANSTO), Locked Bag 2001, Kirrawee DC, Sydney, NSW 2232, Australia
3
School of Electrical, Computer and Telecommunications Engineering, University of Wollongong, Northfields Avenue, Wollongong, NSW 2522, Australia
*
Authors to whom correspondence should be addressed.
Metals 2022, 12(1), 46; https://doi.org/10.3390/met12010046
Submission received: 30 November 2021 / Revised: 15 December 2021 / Accepted: 23 December 2021 / Published: 25 December 2021
(This article belongs to the Special Issue Wire Arc Additive Manufacturing of Metallic Components)

Abstract

:
Relatively high heat input and heat accumulation are treated as critical challenges to affect the qualities and performances of components fabricated by wire arc additive manufacturing (WAAM). In this study, various heat inputs, namely 276, 552 and 828 J/mm, were performed to fabricate three thin-wall Inconel 625 structures by cold metal transfer (CMT)-based WAAM, respectively, and active interpass cooling was conducted to limit heat accumulation. The macrostructure, microstructure and mechanical properties of the produced components by CMT were investigated. It was found that the increased heat input can deteriorate surface roughness, and the size of dendrite arm spacing increases with increasing heat input, thus leading to the deterioration of mechanical properties. Lower heat input and application of active interpass cooling can be an effective method to refine microstructure and reduce anisotropy. This study enhances the understanding of interpass temperature control and the effectiveness of heat inputs for Inconel 625 alloy by WAAM. It also provides a valuable in situ process for microstructure and mechanical properties’ refinement of WAAM-fabricated alloys and the control of heat accumulation for the fabrication of large-sized structures for future practical applications.

1. Introduction

Additive manufacturing (AM) has attracted extensive attention, due to its capability of manufacturing parts with complex geometries, as well as the advantages of cost-effectiveness and reduction in material waste. Numerous AM approaches have hitherto been developed which enabled the rapid manufacturing of organic, inorganic non-metallic and metallic materials [1]. AM can be classified into wired- and powder-based processes based on the feedstocks [2]. Wire arc additive manufacturing (WAAM) is a wired-based process which consists of gas metal arc welding (GMAW)-based, gas tungsten arc welding (GTAW)-based and plasma arc welding (PAW)-based processes. Compared with other AM technologies, WAAM has advantages of relatively high deposition efficiency, effective utilization of material, short fabricating cycle and less restriction on the size of components [3]. Cold-metal-transfer-based WAAM is one of the GMAW-based WAAM processes, especially providing competitiveness in high deposition efficiency and lower heat input.
Nickel-based superalloys refer to a series of metallic alloys with Ni as the main element and exhibiting outstanding mechanical properties, high oxidation and corrosion resistance at elevated temperatures from 650 to 1000 °C [4]. Due to their favorable material characteristics and high performance, nickel-based superalloys are widely used in energy development, chemical industry, electronics, navigation, aviation and aerospace fields [5,6]. Inconel 625 alloy is a typical solid-solution-strengthened nickel-based superalloy, with molybdenum and niobium as main strengthening elements, that exhibits excellent corrosion resistance and oxidation resistance [7]. It retains satisfied tensile properties and fatigue properties from ambient temperature to 980 °C, hence being used in manufacturing aero-engine components, aerospace structures and chemical equipment. Currently, numerous studies have been performed on microstructure evolution, mechanical properties, machinability and corrosion resistance of Inconel 625 alloy [8,9,10]. Wang et al. [11,12] studied the mechanical properties of Inconel 625 fabricated by WAAM–CMT with different torch traveling speeds and found that the micro-hardness, ultimate tensile strength (UTS), yield strength (YS) and ductility of samples increased with increasing torch traveling speed. Tanvir et al. [13,14] reported that the 980 °C heat treatment could eliminate Laves phase, but the size of MC carbide and the amount of δ phase increased with increasing heat-treatment time. Additionally, the average micro-hardness of the sample did not change significantly in correspondence to heat treatment, but the UTS gradually enhanced with the increasing heat-treatment time.
Heat input refers to the heat energy input to the weld per unit length by welding energy during welding, and the increased heat input during AM processes is prone to manufacturing defects, such as distortion [15]. Wide research found that WAAM fabricated components suffer from relatively high heat input and heat accumulation, resulting in anisotropy, a lower surface accuracy, more precipitates and deteriorated mechanical properties [16,17]. To control the heat accumulation, interpass temperature control by passive interpass dwell can be an alternative. Wang et al. [11] deposited Inconel 625 thin-wall structures under heat inputs from 216 to 270 J/mm, using CMT and controlled the interpass temperature to 400 °C via passive dwelling. However, anisotropy was still found in the as-deposited samples. Compared with passive-interpass dwell, active-interpass cooling enables an enhanced deposition rate through reduced dwelling time [18]. Moreover, the controlled and increased cooling rates potentially manipulate the microstructure evolution, such as the control of intermetallics. At the moment, very little research has been conducted to explore the effects of heat input together with active interpass cooling on WAAM-fabricated Inconel 625 alloy.
The present study aimed to fabricate and explore Inconel 625 components by CMT-based WAAM technology with a wider heat input range from ~276 to ~828 J/mm and using active interpass cooling to control the temperature of previous layer to 100 °C. In this study, the microstructure and mechanical performance were investigated by analyzing and comparing different regions of the components after deposition. The results prove that Inconel 625 components with high-quality performance can be fabricated by using the CMT process through active cooling, while the microstructure and mechanical properties of the as-deposited alloy depend on the heat input. This study contributes to an insight into the processing–microstructure–property relationship, providing valuable information for manufacturing the large-sized and defect-free Inconel 625 components with limited heat accumulation.

2. Experimental Procedure

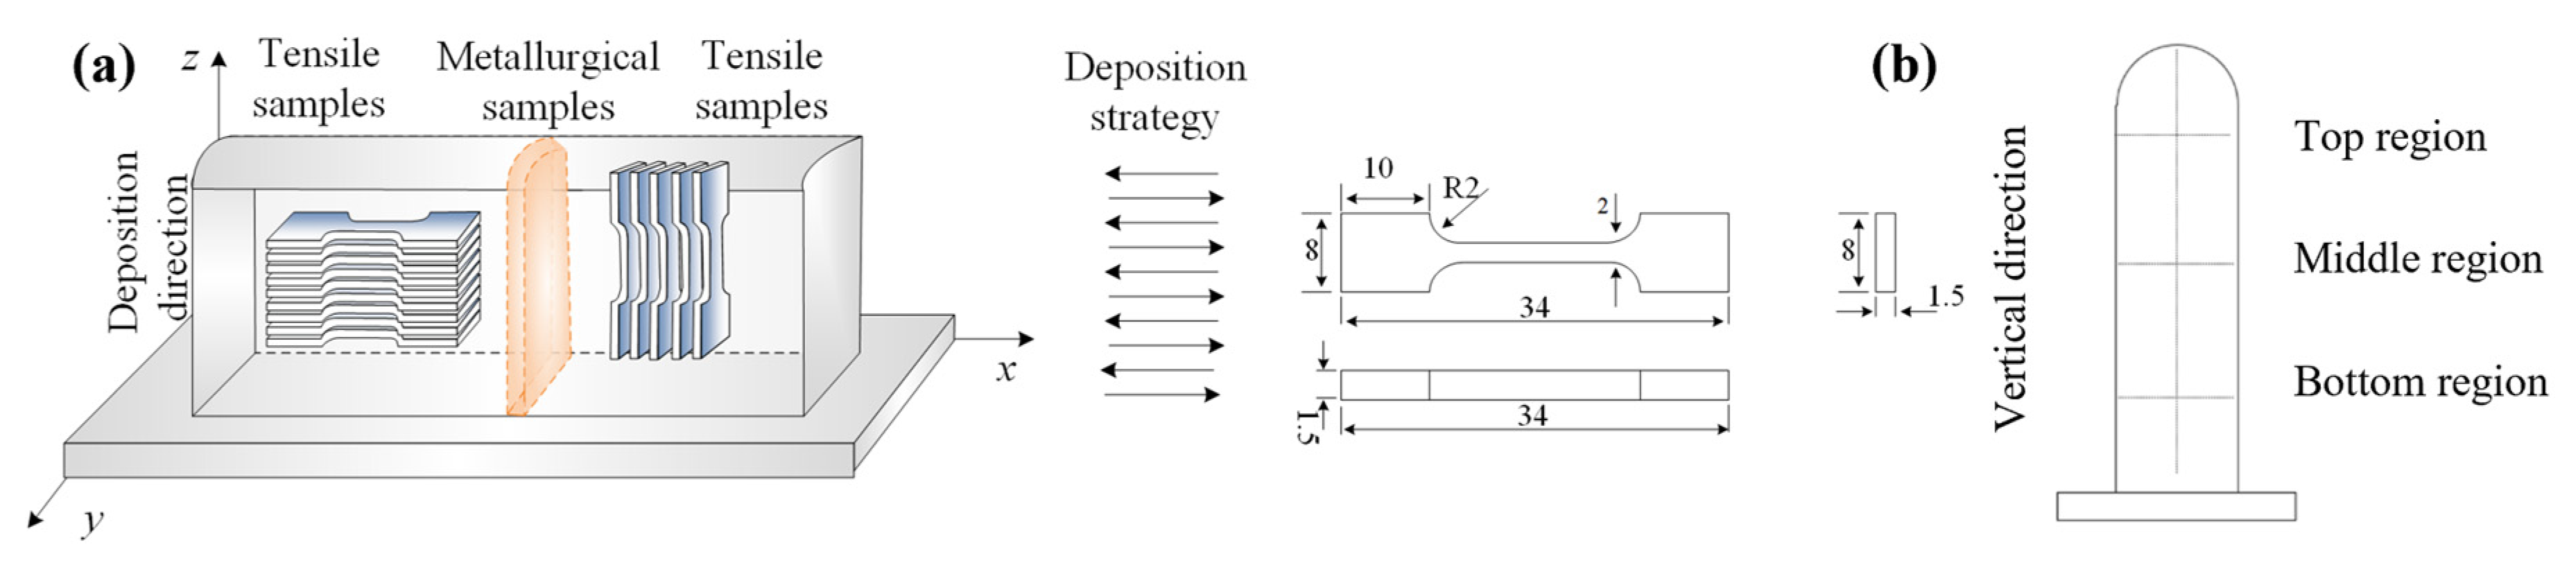
2.1. Experiment Setup

A Fronius CMT Advanced 4000R CMT–WAAM system was used in the present work for the production of Inconel 625 materials. The system consists of the power source, ABB robot, wire feeder, welding torch, substrate, shielding gas unit and welding bed. Inconel 625 wire with a diameter of 1.2 mm was used as the feedstock. The chemical composition of Inconel 625 wire used in the experiment is listed in Table 1. In the current study, the wire feed speed was fixed, while the heat input was controlled by changing the welding torch travel speed. The process parameters and dimensions of three thin-wall samples for this experiment are listed in Table 2 and Table 3, respectively. In order to eliminate potential oxidation of the deposited components during the welding process, high purity argon as the shielding gas was applied to protect the molten pool. A stainless-steel brush was then used to remove potential splashes or particles in welding fume deposits. A single-direction deposition leads to significant heat accumulation, which results in distortion of the component. In order to ensure the quality of the deposition, a zig-zag strategy was applied (Figure 1). Moreover, to control heat accumulation and to increase cooling rate, active cooling and interpass temperature were controlled to 100 °C. The compressed air was blown onto the structures after each layer’s deposition and during cooling process until the surface temperature of the previously deposited layer decreased to 100 °C. To monitor the cooling rate and interpass temperature, a FLIR A655sc thermal imaging camera (FLIR, Wilsonville, OR, USA) (infrared image-based) with a measurement range of −40 to 2000 °C and a wavelength range of 7.5 to 14 μm was used. The temperature and time during manufacturing could be observed and were recorded in the connected computer.

2.2. Material Characterization

Mechanical and metallographic specimens were extracted from the middle of the built Inconel 625 thin-wall weldment (Figure 1). Figure 1a shows the torch traveling and deposition directions, and the x–y, y–z and x–z reference planes. Considering the element diffusion from the substrate, the extraction of the test specimens started 5 layers away from the substrate. The metallographic and hardness samples were ground and polished by the standard procedures. The metallographic samples for microstructure analysis were electro-etched in a mixed solution containing 5 mg of oxalic acid and 95 mL of hydrochloric acid under a 6 V direct current at room temperature for 2 s. Optical microscope (OM) (Leica DM 2500M, Wetzlar, Germany) was used to observe the columnar dendrites and secondary phases. ImageJ software (ImageJ V 1.8.0, Bethesda, MD, USA) was then used to calculate dendrite arm spacing (DAS). Scanning Electron Microscope (SEM) (JEOL JSM-6490AL, Tokyo, Japan) equipped with Energy Dispersive Spectrometer (EDS) (JEOL JSM-6490AL, Tokyo, Japan), X-ray Diffraction (XRD) (Thermo Fisher ARL Equinox 1000, Waltham, MA, USA) with a Cu Kα radiation source (λ = 1.54056 Å ) and synchrotron XRD was used to further investigate the microstructure. Synchrotron XRD data were collected in reflection geometry by using a monochromatic X-ray beam of 18 keV (λ = 0.68877 Å ) at the Powder Diffraction beamline of the Australian synchrotron (Melbourne Australia). The Matsuzawa/Via-F automatic Vickers hardness tester (Matsuzawa/Via-F automatic, Akita, Japan) was used to examine the micro-hardness on y–z plane, as shown in Figure 1b. In the vertical direction, the spacing of the testing position is 1 mm, and 0.5 mm in the horizontal direction. The load of tester was 1.96 N, and loading time is 10 s. The difference in the tensile strength of the samples cut along the horizontal direction (x–z plane) and vertical direction (y–z plane) were also examined. The constant loading rate was 1 mm/min at room temperature, and a video extensometer was used to obtain the elongation.

3. Results and Discussion

3.1. Macrostructure

Figure 2 shows overall macro morphology and layer height distribution of three as-deposited thin-wall weldments, using the CMT–WAAM process under different heat inputs. Due to the layer-by-layer deposition, the samples have a corrugated surface. In total, 22, 17 and 14 layers were deposited for the samples with a heat input of 276, 552 and 828 J/mm, respectively, which means that the higher input requires fewer deposition layers, leading to a higher deposition efficiency. The layer height is quite uniform after the first several layers of each sample (Figure 2d). However, as shown in Figure 2a–c, the surface finish of the sample with higher heat input is less accurate. The 276 J/mm sample has the best surface finish, and this is considered to be due to the relatively high solidification rate and low overflow, attributed to the high torch-traveling speed under this heat input condition [18]. On the virtual inspection, there is no cracking, induced by the enhanced cooling from compressed air, on the surface of these three samples. Moreover, there is no cracking or pores inside of the samples from the following microscopic observation.

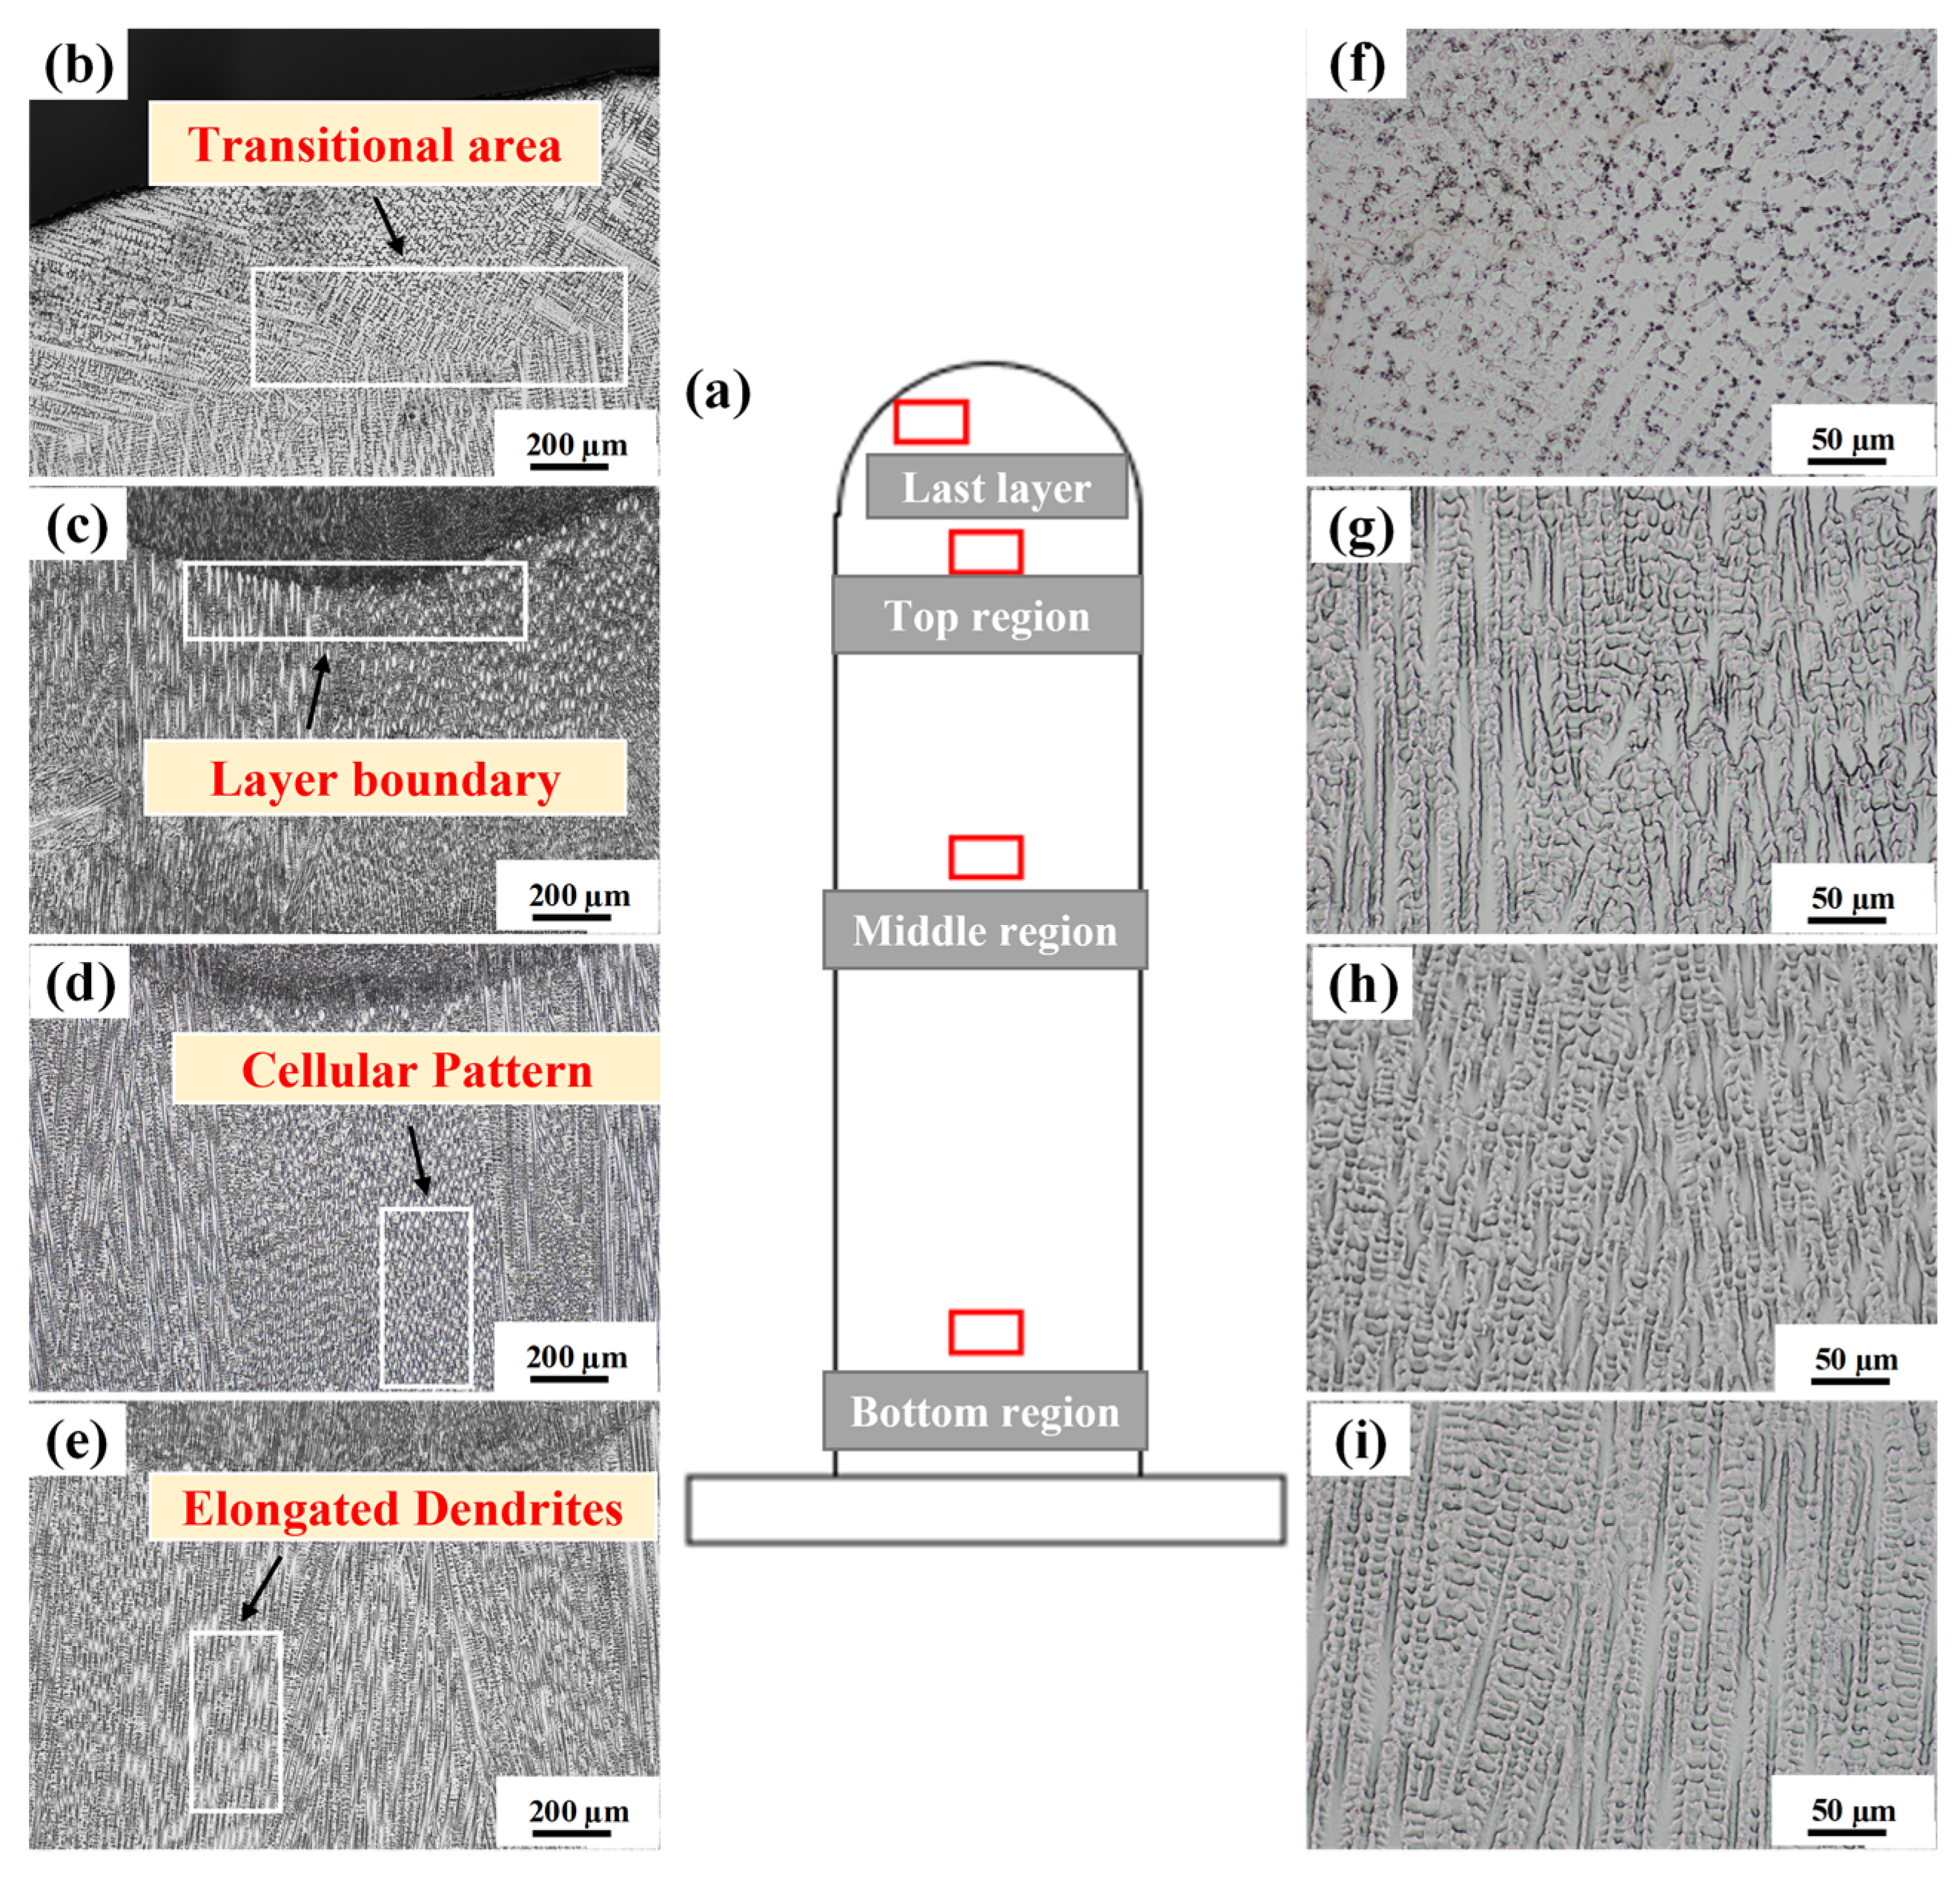
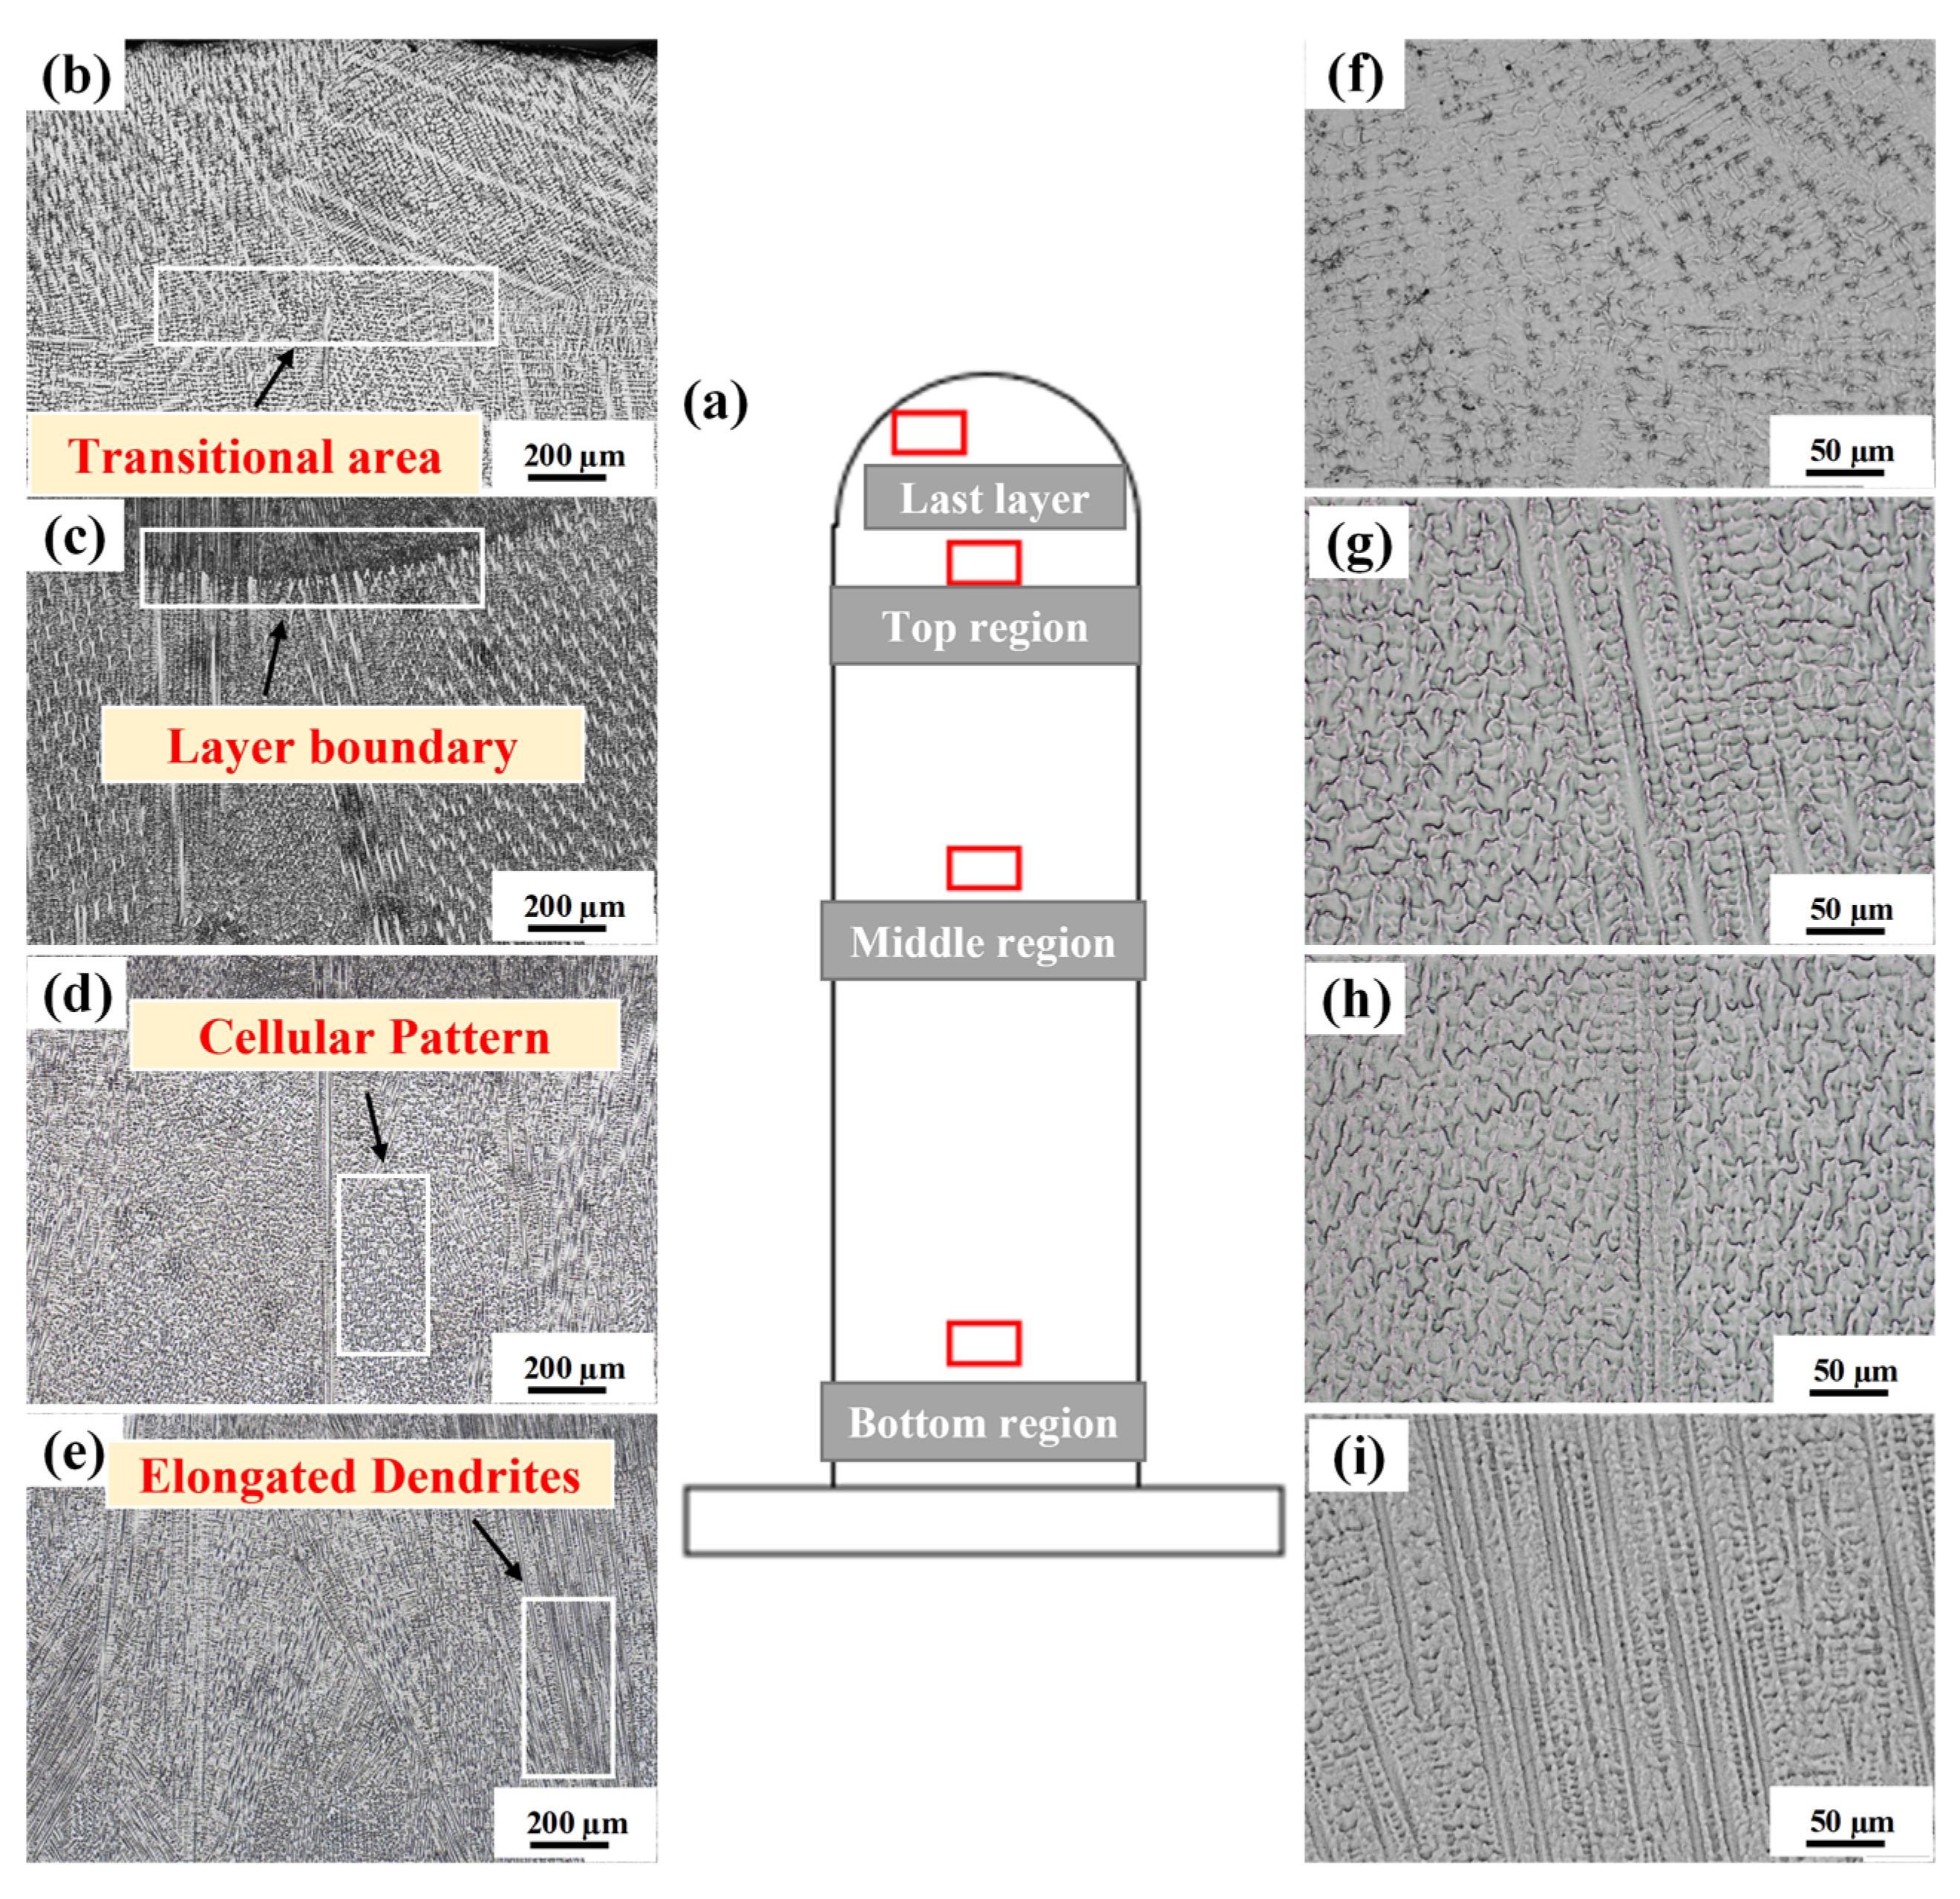
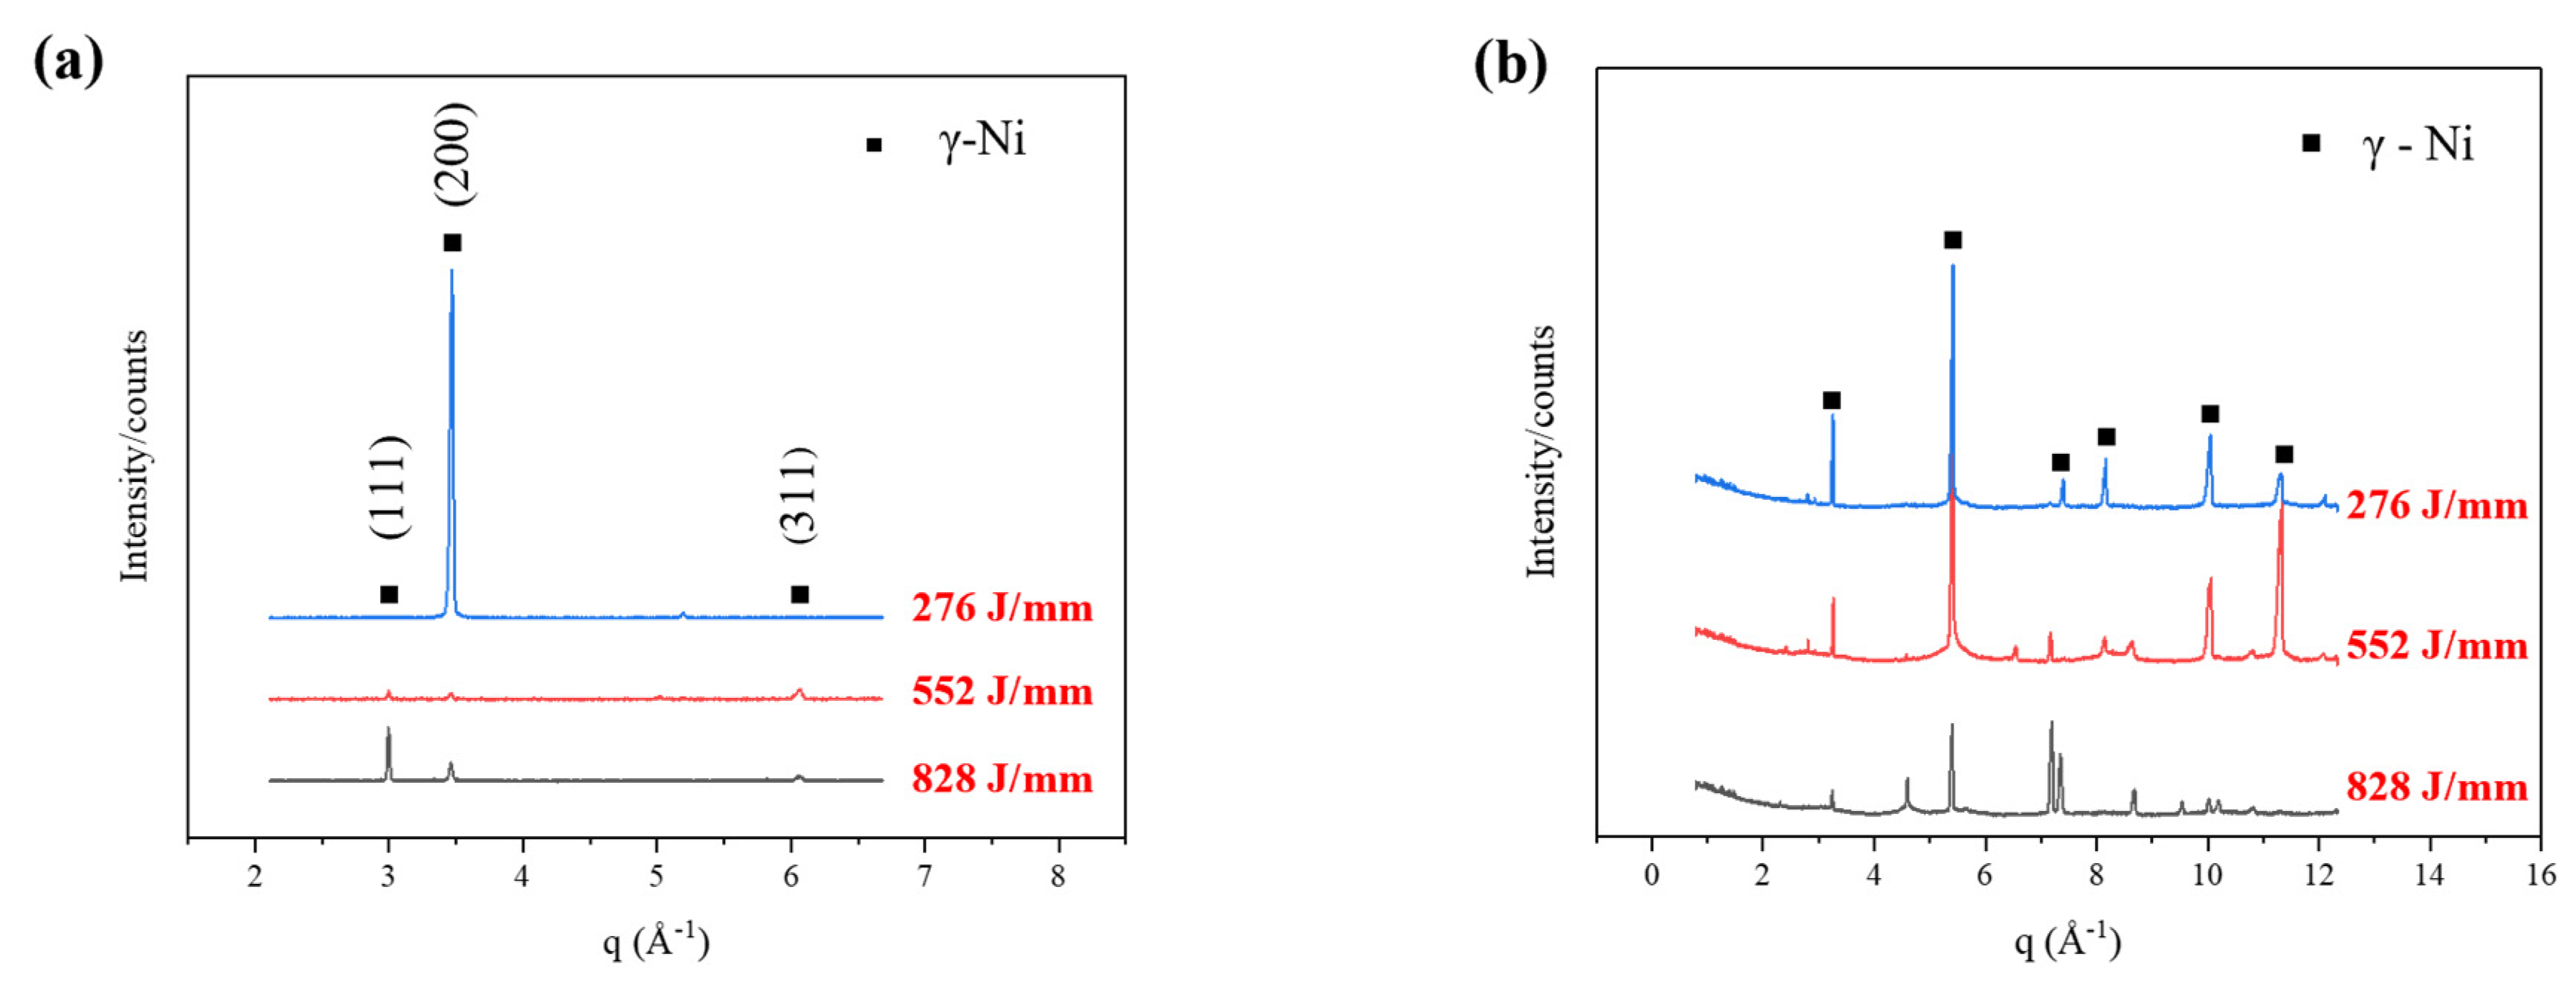
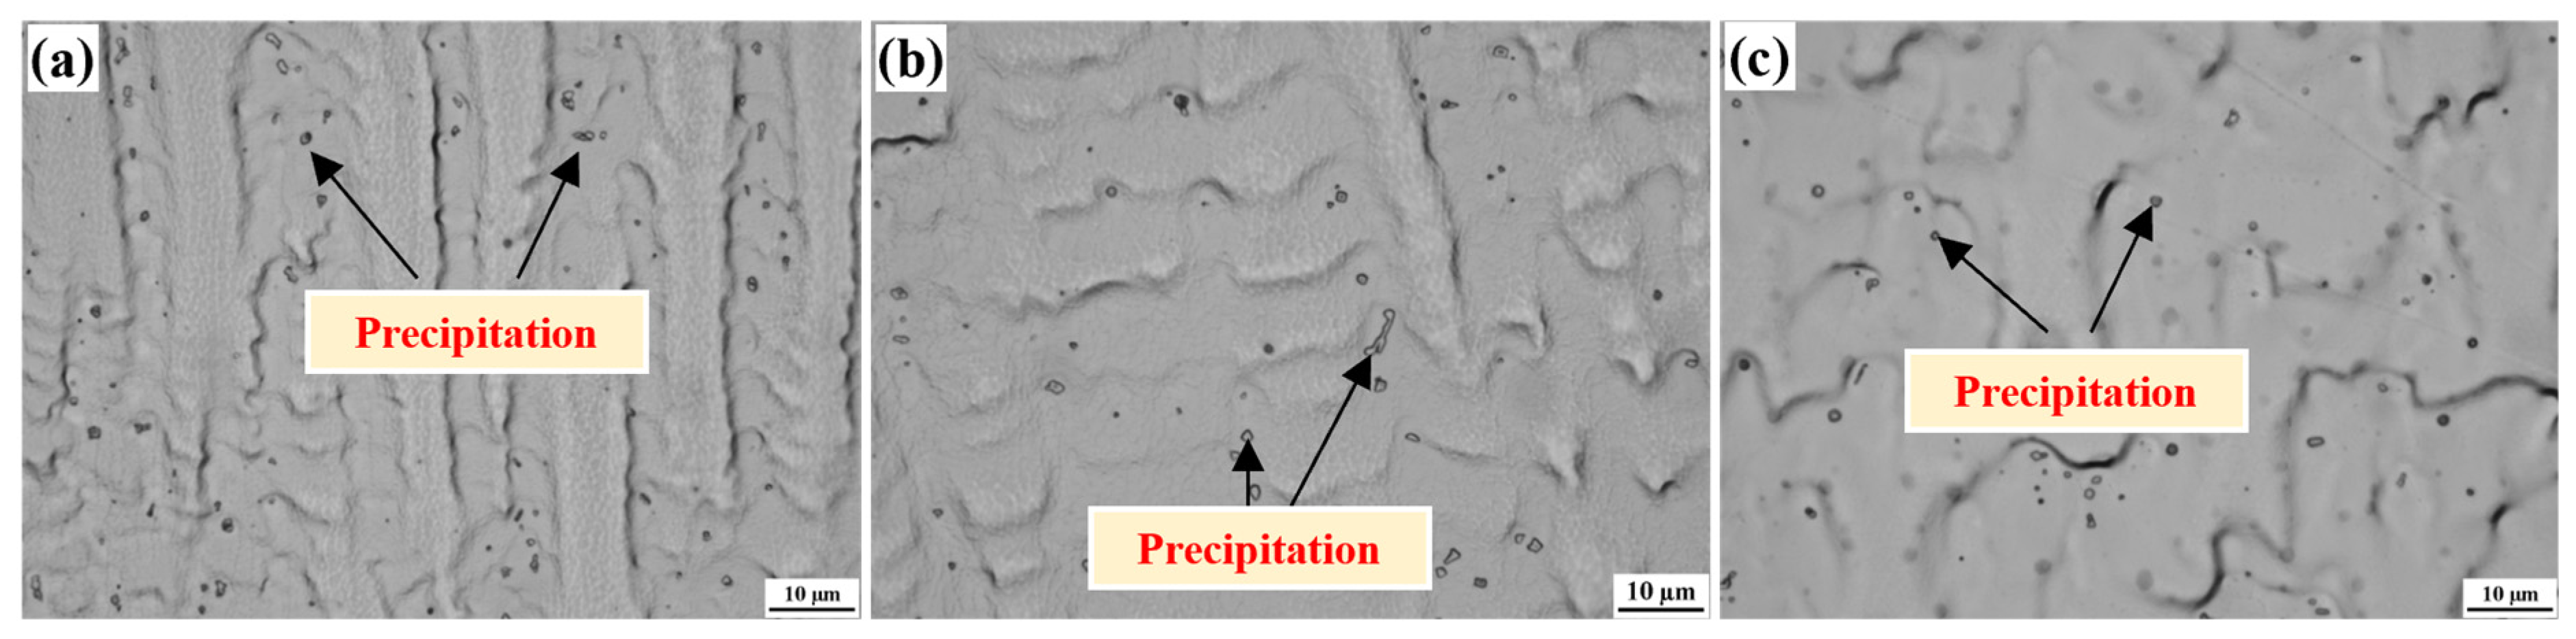
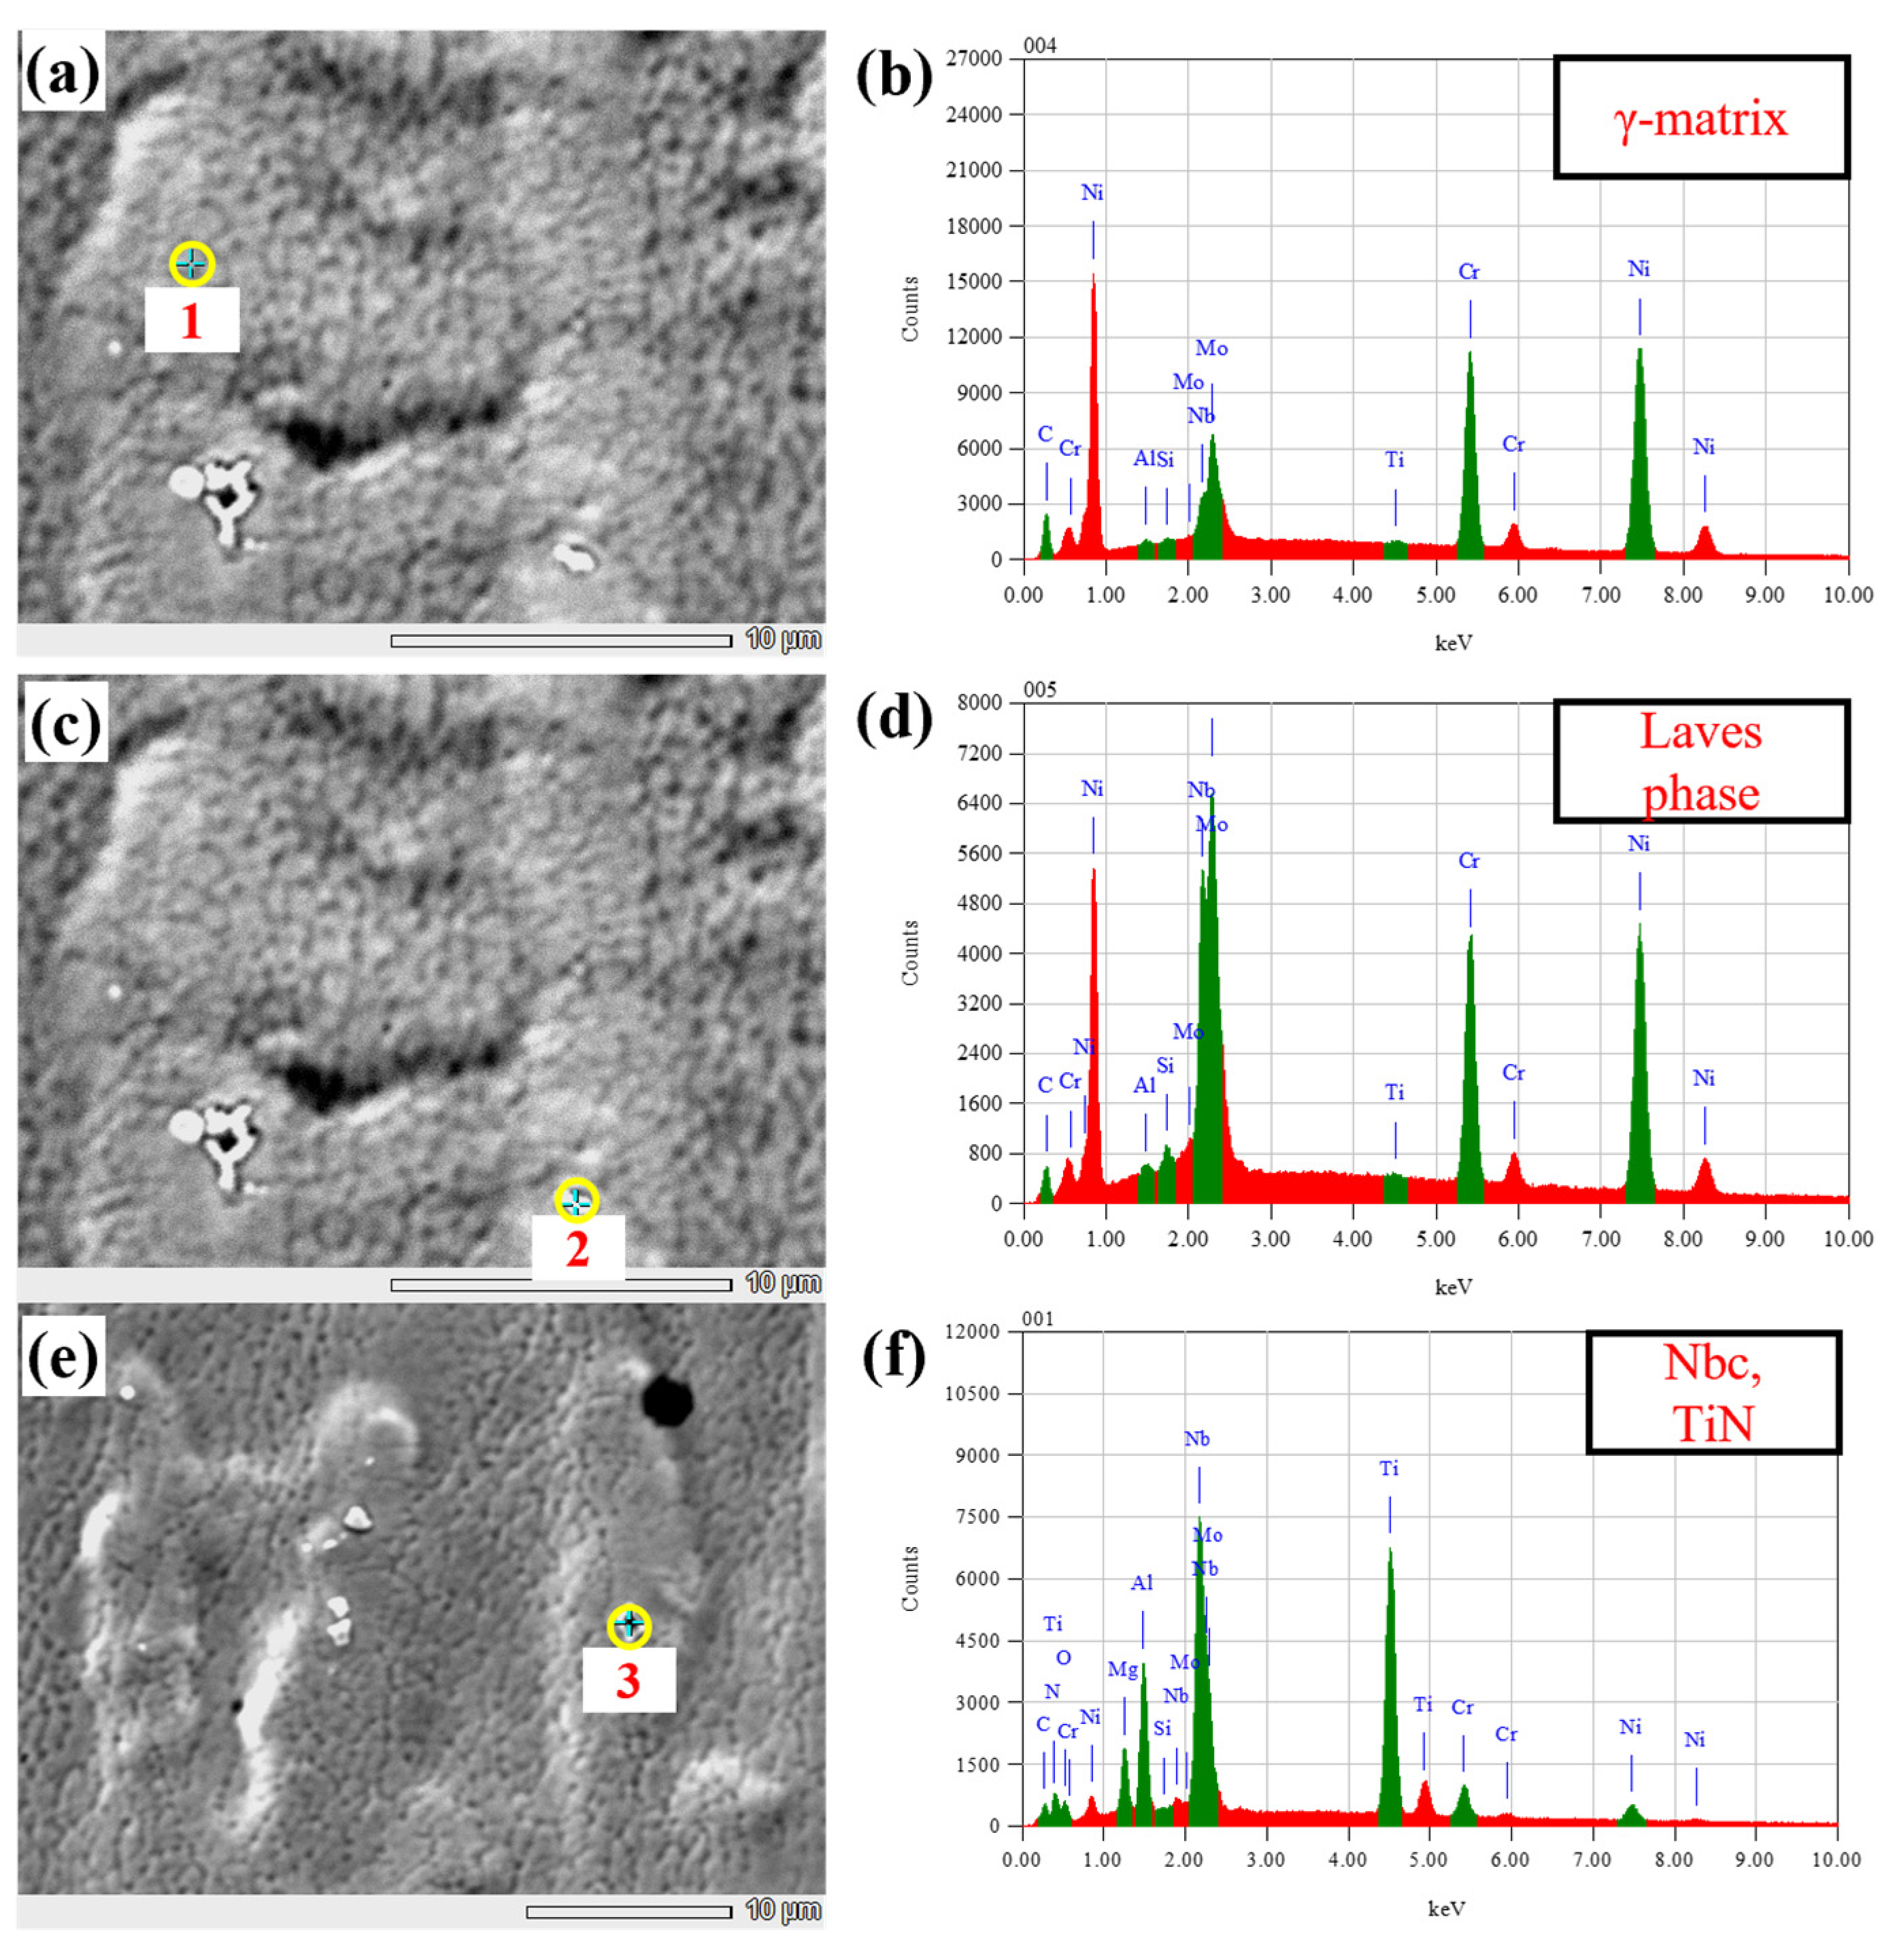
3.2. Microstructural Evolution

Figure 3, Figure 4 and Figure 5 show the typical microstructure of the as-deposited samples with different heat inputs in different regions. Generally, typical columnar grains with dendrites at elongated and cellular patterns are observed in each sample, and the microstructure of each sample in different regions is similar except for the last layer. As shown in Figure 3, Figure 4 and Figure 5, a large number of elongated dendrites grow within the deposited layers, being almost perpendicular to the substrate caused by the interpass cooling strategy [19]. During the WAAM process, the dendrites of the previously deposited layer are partially remelted by thermal cycling, forming layer bands. The layer boundaries, which are fusion interfaces between two deposited layers, can be observed. The direction of the heat flux mainly determines directions of the dendrite growth, and dendrites grow preferentially in the opposite direction of heat flux in order to follow the maximum temperature gradient [20]. Due to the interpass cooling strategy, compressed air vertically acts on the deposited layer in the deposition direction (z). This leads the previously deposited layer to a relatively cold surface and provides a large thermal gradient condition for the following new layer. When the new layer is deposited over the previous layer, dendrites grow from top to bottom in the newly deposited layer, thus contributing to the elongated dendrites almost perpendicular to the substrate. Additionally, the interpass cooling strategy can almost eliminate heat accumulation of the previously deposited layers, making the solidification rate of each deposited layer similar, leading to the similar microstructure of each deposited layer. Due to the lack of remelting in the last layer of the as-deposited components, it exhibits a transitional microstructure, from directional elongated dendrites to fine equiaxed dendrites, as shown in Figure 3b, Figure 4b and Figure 5b.
Figure 6a shows the illustration of primary dendrite arm spacing (PDAS) from the as-deposited samples. The PDAS calculates by the center-to-center distance between two adjacent dendrite cores. As shown in Figure 6b, the secondary dendrite arm spacing (SDAS) is calculated by using the following equation:
  SDAS = L N 1
where L is the center-to-center distance between the secondary dendrites arms, and N is the randomly chosen number of secondary dendrite arms [21]. The size of dendrite arm spacing was calculated by ImageJ software, and the results are shown in Table 4. The size of dendrite arm spacing (DAS) is closely related to the solidification rate [22]. Figure 7 shows the temperature–time evolution curve during cooling of three samples of a single layer, which was processed by the explored data from the thermal camera. The liquid phase temperature of Inconel 625 is 1290–1350 °C. From Figure 7, it can be found the as-deposited sample with larger heat input has a lower solidification rate, and the 276 J/mm heat input sample has the highest solidification rate (see inset in Figure 7). This contributes to the smallest size of PDAS and SDAS of this sample. That is to say, when interpass cooling strategy is applied, reducing heat input can refine the DAS. This is because the interpass temperature was controlled to 100 °C, which almost eliminates the heat influence of the previously deposited layer, and the solidification rate of three samples with the same heat input in the top, mid and bottom regions is consistent. Therefore, the size of PDAS and SDAS distributed in the top, middle and bottom regions are quite uniform.
Figure 8a shows the XRD analysis of the cross-sections to the traveling direction of as-deposited samples with different heat inputs. The XRD can only confirm that the matrix is the γ phase. The secondary phases in the matrix cannot be detected by XRD, due to their low volume fractions. The high intensity of the peaks (111), (200) and (311) indicated intense columnar dendritic growth texture, which is typical in AM-fabricated alloys [23].
Compared with the XRD, the synchrotron XRD has a profound diffraction pattern intensity, which can identify the precipitation phases with small volume fractions. In order to further explore the second phase in the deposited sample, synchrotron XRD was performed, as shown in Figure 8b. The matrix can be determined as the γ phase, which is the same as the XRD result. However, the peaks of the precipitates cannot be observed in synchrotron XRD pattern. This can be attributed to the low content of precipitates in the matrix, resulting from the high cooling rate by the application of active cooling in this work. At the same time, the dislocation distributions and the compositional gradients within the dendritic microstructure produce a corresponding variation in lattice spacing [24].
Figure 9 shows the precipitates found in the cross-sections along the traveling direction of as-deposited samples with different heat inputs. Laves phase is widely reported to be the common precipitate in Inconel 625 alloy [25], and it can be enlarged with the deposition due to heat cycling [26]. Wang et al. [27] reported that the larger Laves phase was found in the middle regions, due to heat accumulation in the AM-fabricated alloy. As shown in Figure 9, it appears that there is no significant difference in the size of precipitates in different areas in this work. Moreover, the size of these precipitates is submicron, which is much smaller than the reported size in Inconel 625 by WAAM process [11]. This is considered to be due to the enhanced cooling of each layer with the active cooling and less heat accumulation induced by interpass temperature control. These experimental conditions limited the formation and growth of the precipitate phases.
Figure 10 show the SEM images with EDS analysis of the precipitates that appear in the as-deposited samples with different heat inputs. According to the EDS result, there are Laves phase and MC carbide in the γ matrix. Due to the partitioning coefficient (k) being less than 1, the positive segregation elements, such as Nb, are prone to be segregated in the interdendritic areas where the precipitates are mainly distributed [28]. The precipitation of the Laves phase and TiN/NbC carbide was related to the ratio of the elements of niobium and carbon. Hence, the interdendritic areas where molybdenum, niobium and tungsten concentrate lead to the precipitation of MC carbide and Laves phase [29]. TiN is reported to be formed before the NbC and becomes the nucleation site of NbC carbide [30,31]. The size of the NbC carbide increases with decreasing the solidification rate [32,33], and the carbides are distributed in the interdendritic areas, leading to the anisotropy of tensile properties [34]. The Laves phase was mainly composed of the eutectic Laves phase and a small number of discontinuous island and block Laves phase [35]. The precipitation of the Laves phase proves that niobium segregation exists in the WAAM deposition process that had a relatively slow cooling rate [36]. The precipitation of the Laves phase consumes a large amount of molybdenum and niobium that provide solid solution strengthening in the matrix, thereby reducing the solid solution strengthening effect and causing deterioration of the mechanical properties [37]. In this work, from microstructure observation through OM and synchrotron XRD, it can be found that the content of precipitates is quite low, as is preferential for the practical application of the as-fabricated Inconel 625 alloy.

3.3. Mechanical Properties

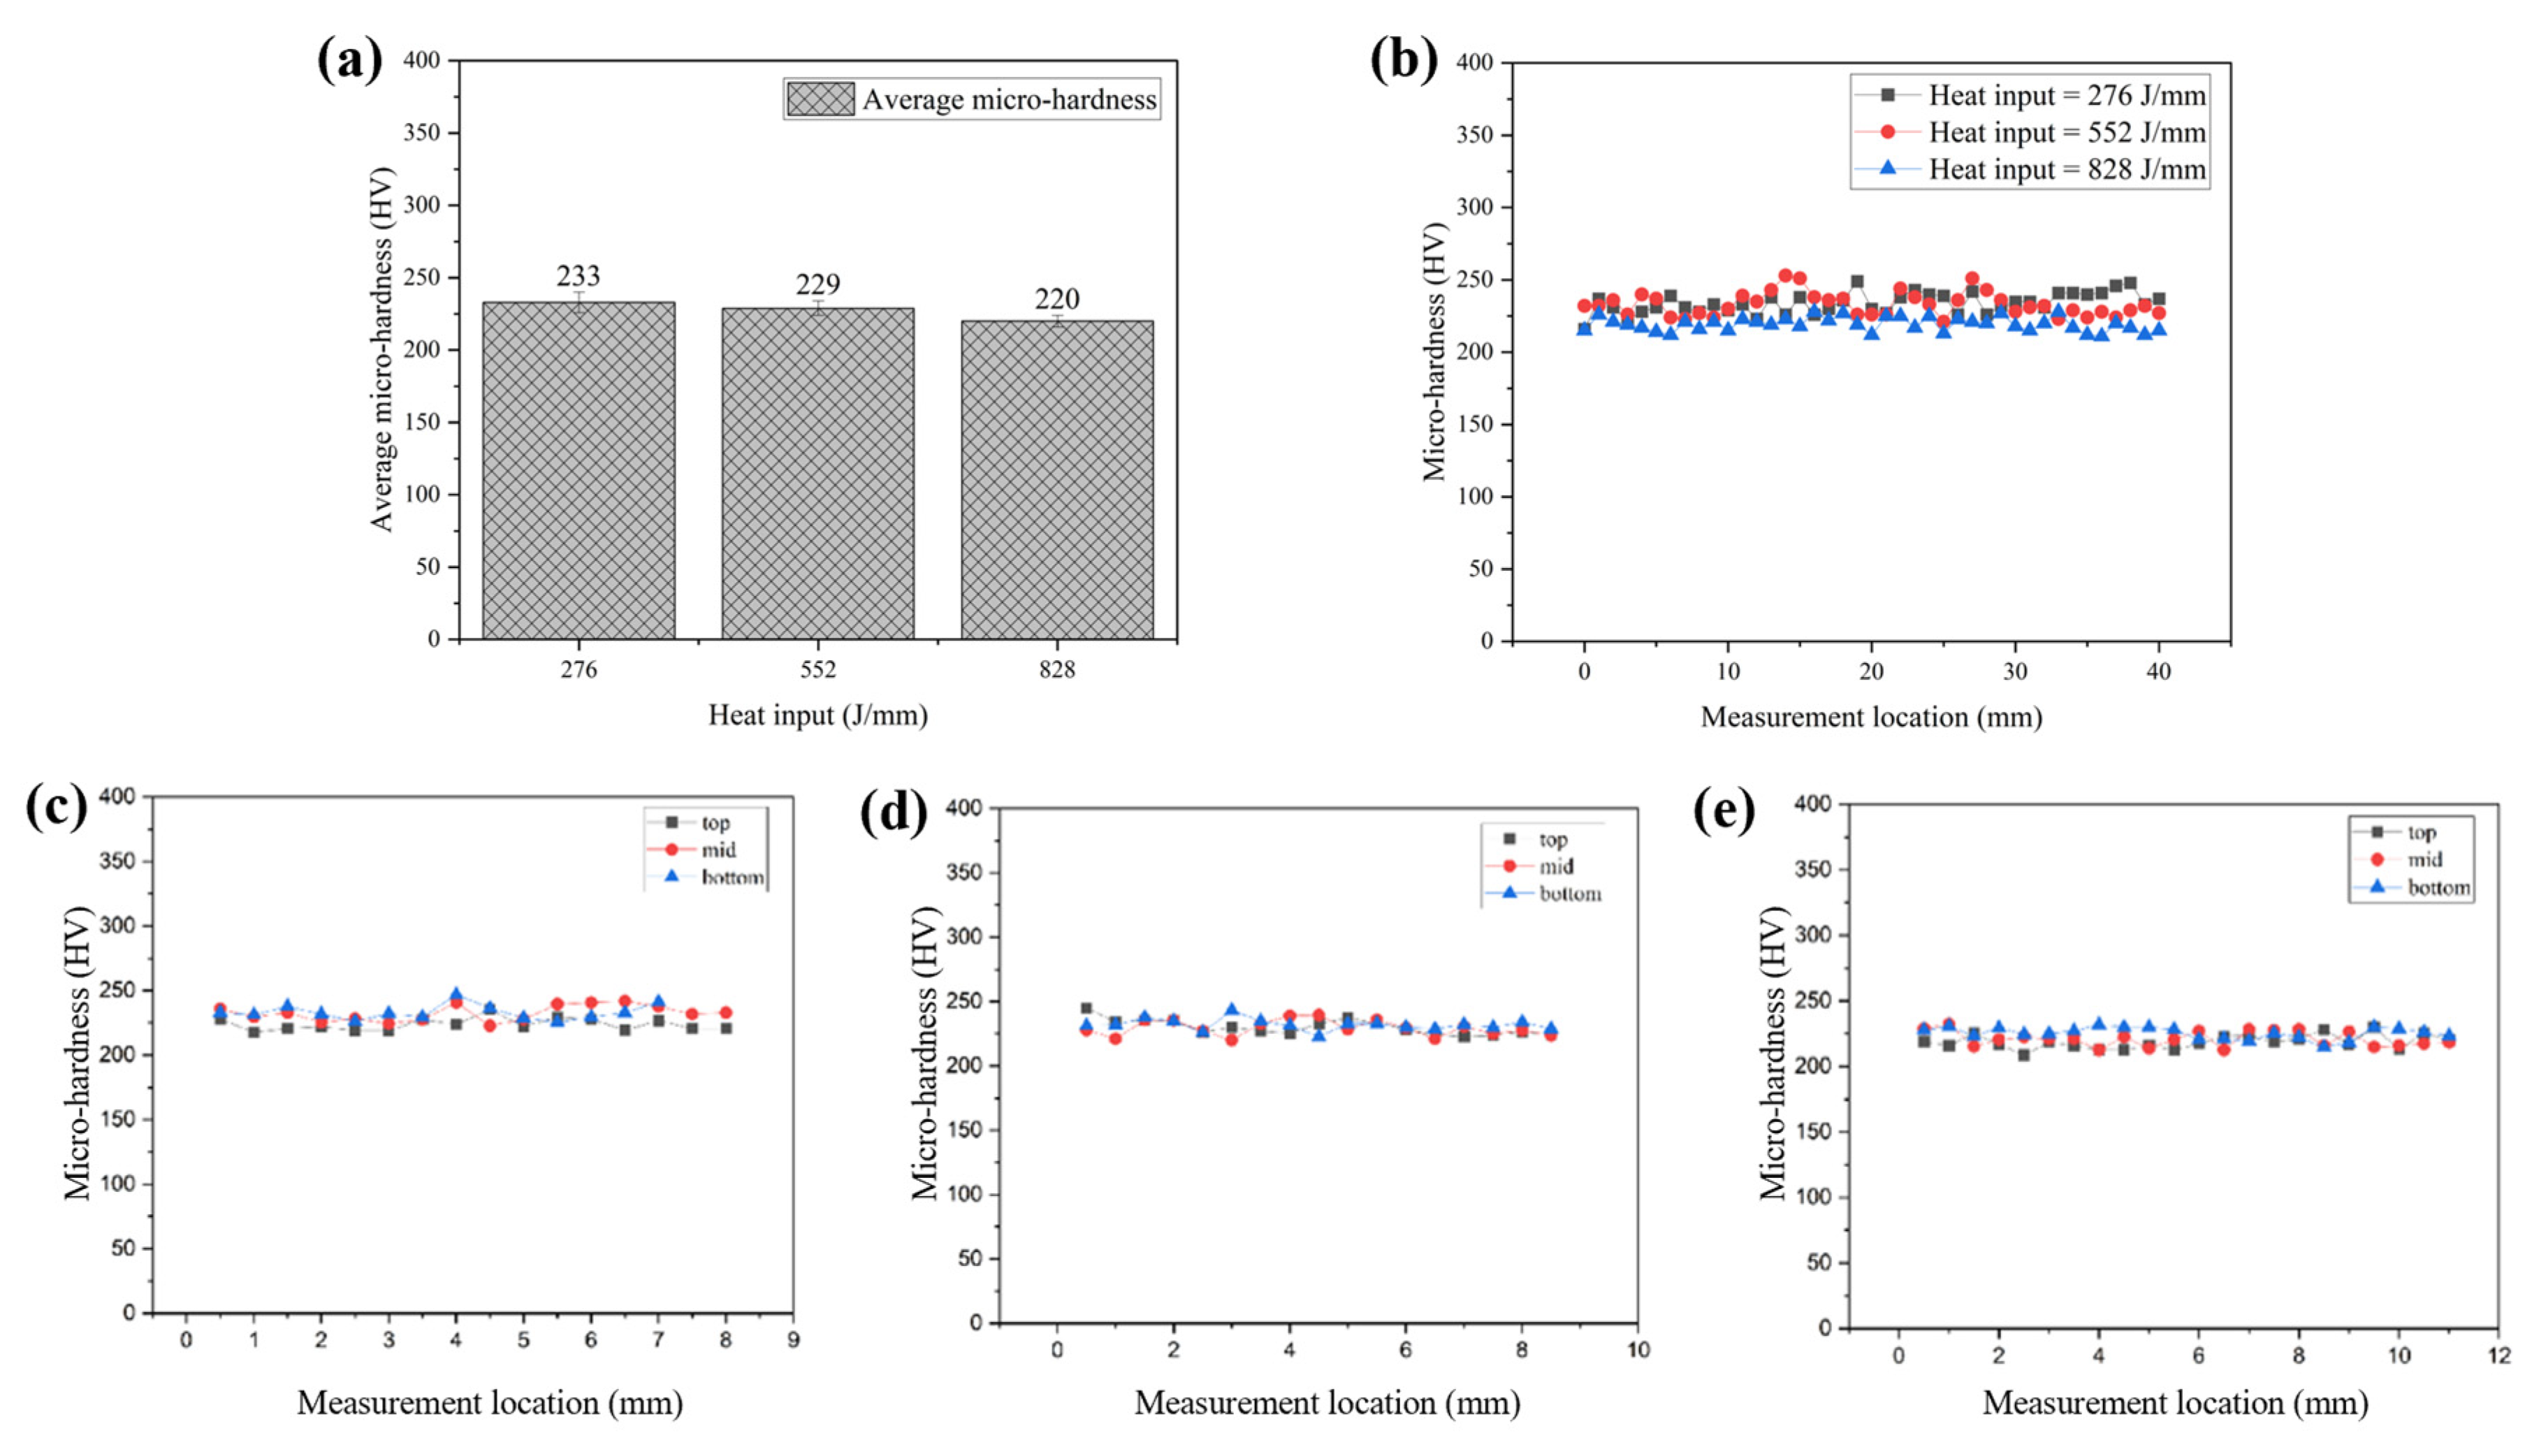
3.3.1. Micro-Hardness

Figure 11a shows the comparison of average micro-hardness of samples with different heat inputs. The average micro-hardness values are 233 ± 6 HV, 229 ± 3 HV and 220 ± 2 HV for the as-deposited sample with a heat input of 276, 552 and 828 J/mm, respectively. All the average micro-hardness values of the samples with different heat inputs were higher than the Inconel 625 alloy produced by conventional casting [38]. Additionally, it is evident that the micro-hardness decreases with increasing the heat input. This is considered to be due to the size of the dendrites increasing, as induced by the high heat input with a low solidification rate, as shown in Figure 7 [39].
Figure 11b–e shows the micro-hardness distribution in vertical direction and horizontal direction from top to bottom. In both directions, the values display a uniform state and no significant variations in different regions, due to the consistent microstructure from top to bottom region. Due to the controlled interpass temperature to a relatively low level, the consistent microstructure of each layer caused by consistent solidification rate leads to the uniform micro-hardness [11]. The consistent micro-hardness of WAAM–CMT Inconel 625 is a positive aspect of the mechanical properties.

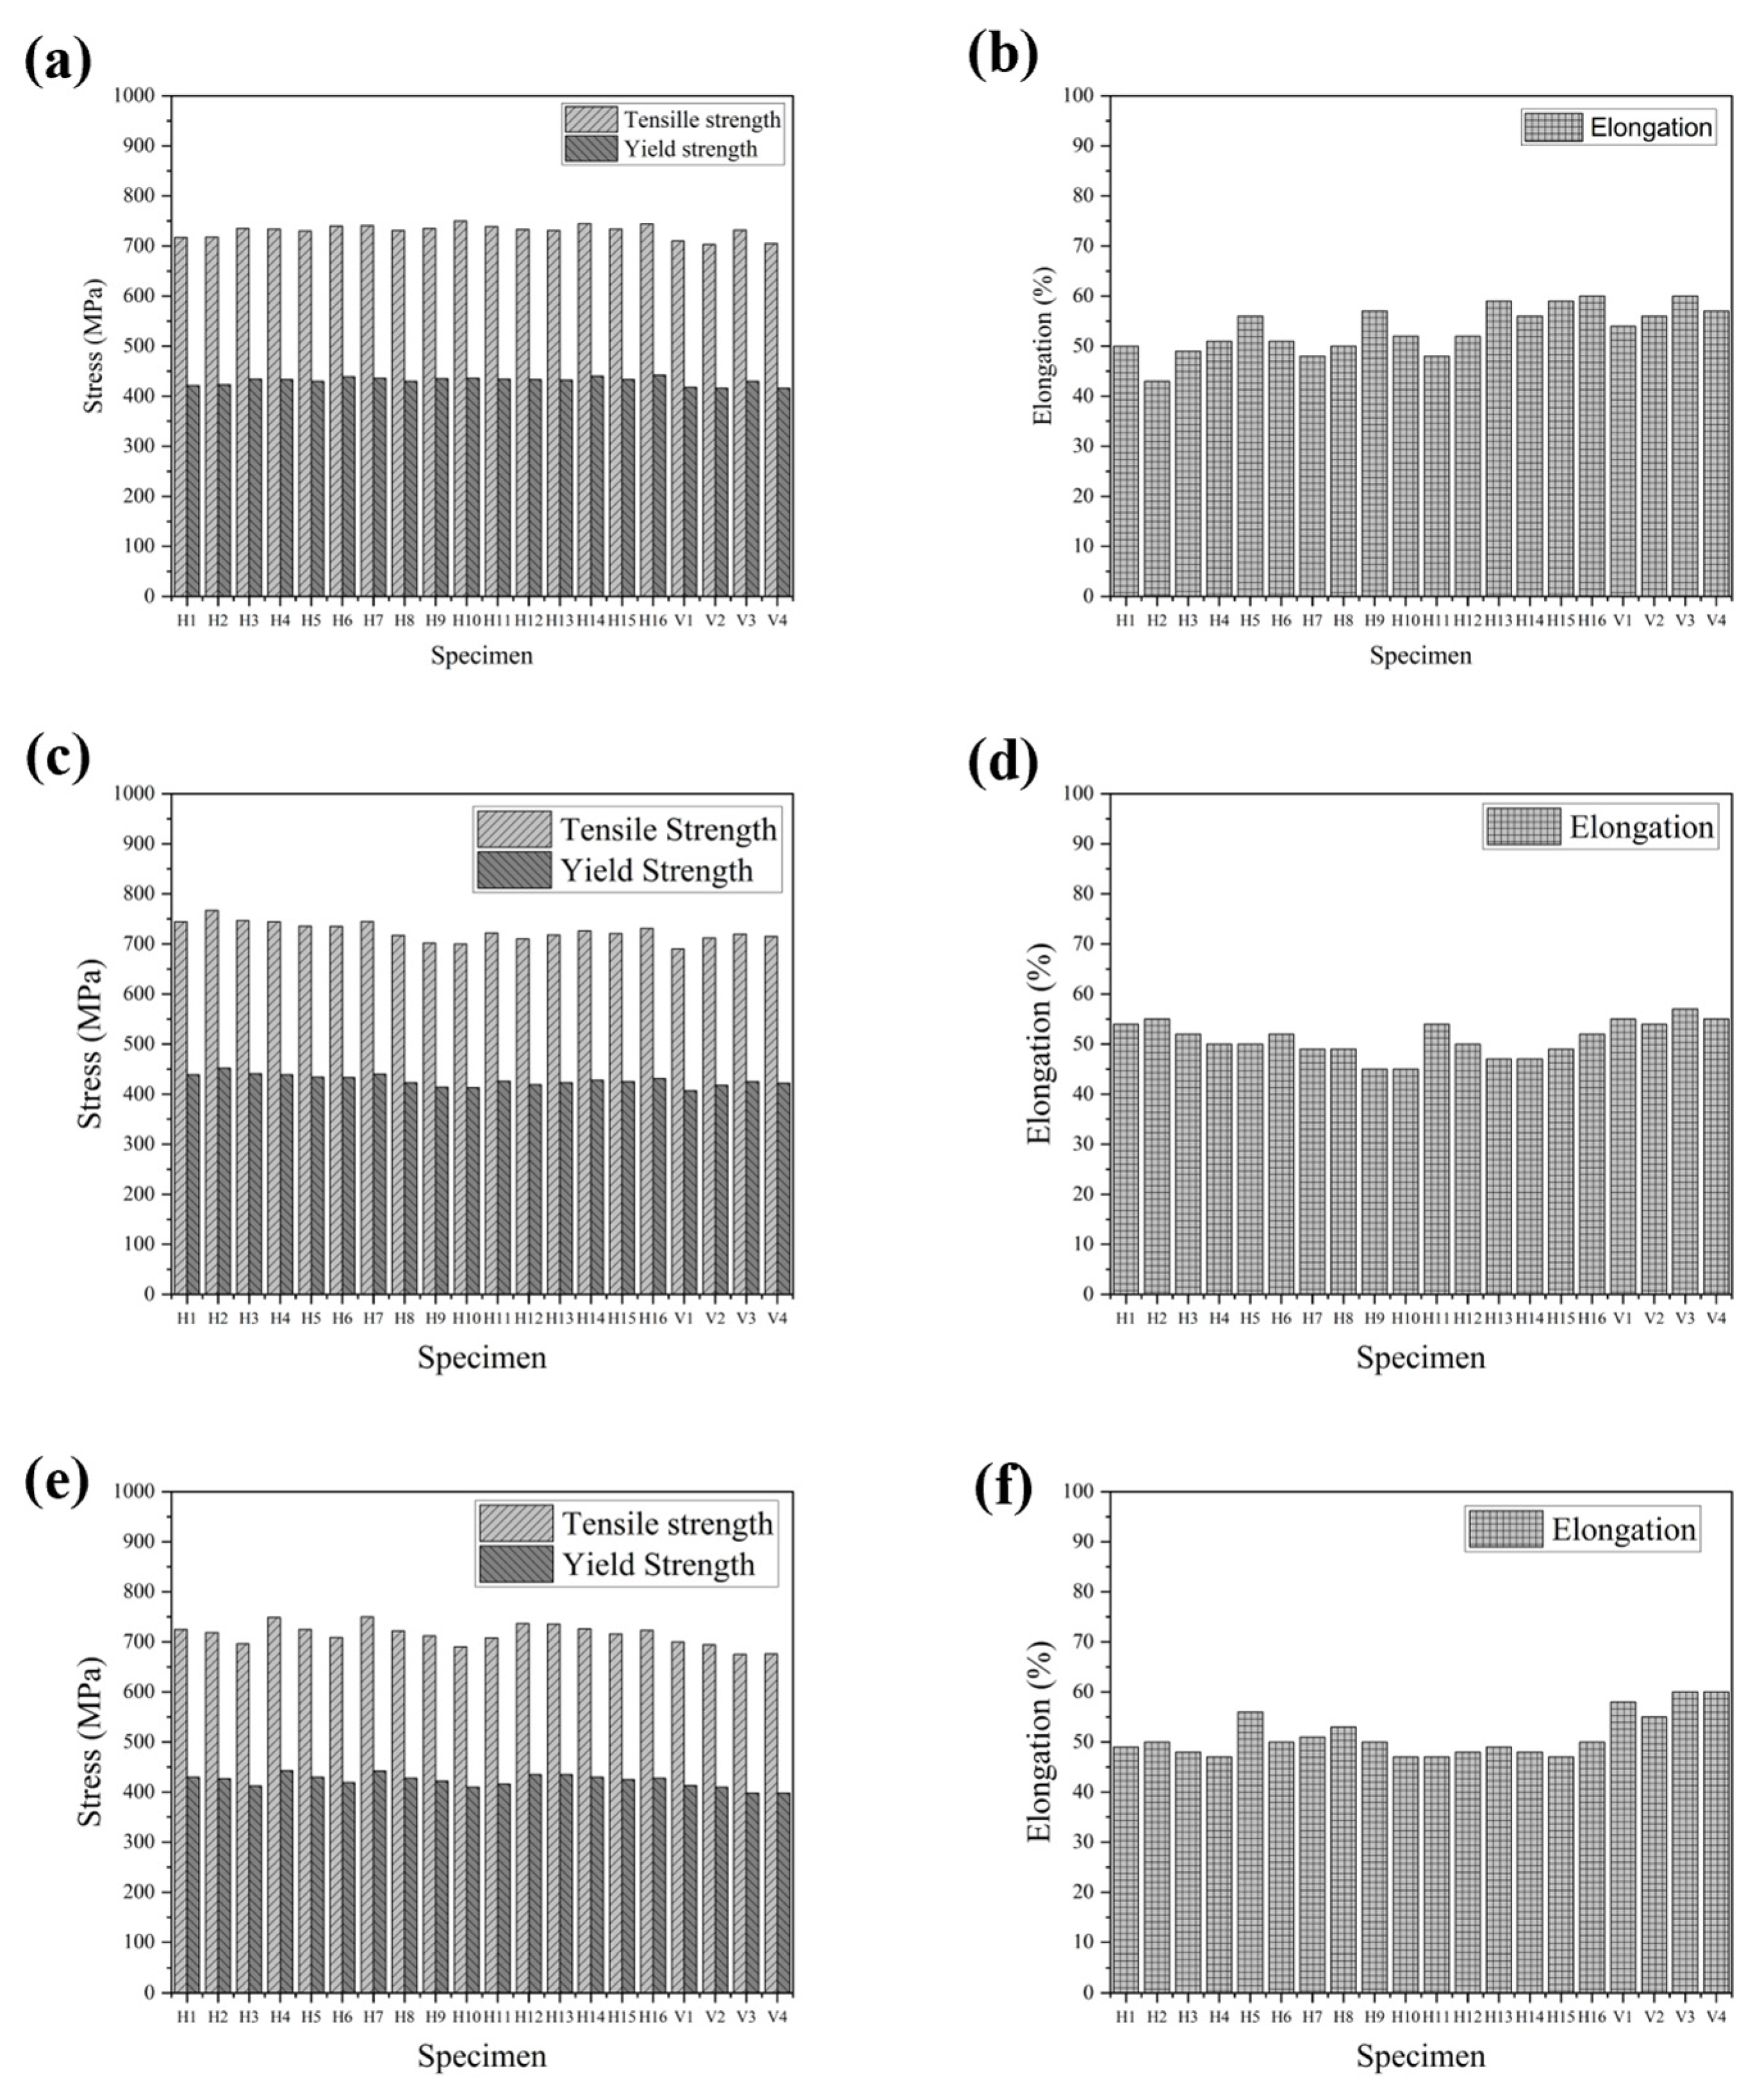
3.3.2. Tensile Strength

The tensile-tested samples were taken from both vertical direction and horizontal direction. Figure 12 shows the mechanical properties of the as-deposited samples under different heat inputs. Generally, anisotropy in tensile properties can be found in three samples. The samples cut along the horizontal direction have higher UTS and YS than those from the vertical direction, but they present lower ductility. As shown in Figure 12a, the average values of the UTS and YS for the heat inputs 276 J/mm samples in the horizontal direction (735 ± 9 MPa and 433 ± 5 MPa) are larger than those for samples (713 ± 13 MPa and 420 ± 7 MPa) in the vertical direction. The elongation present in the horizontal direction is 53 ± 5%, but there is slightly higher ductility in the vertical direction, at 57 ± 3%. This situation is the same as the other two conditions. As shown in Figure 12b, the average values of UTS and YS for the heat input 552 J/mm samples are ~20 MPa and ~12 MPa higher in the horizontal direction than for those in the vertical direction, respectively. The elongation present in the horizontal direction is 50 ± 3%, but there is slightly higher ductility in the vertical direction, at 55 ± 1%. As shown in Figure 12c, the anisotropy of tensile properties for the heat inputs 828 J/mm samples is a bit more evident. The average values of the UTS and YS in the horizontal direction are ~35 MPa and ~22 MPa higher than that in the vertical direction, and the elongation in horizontal direction is ~9% lower than that in vertical direction. The anisotropy in mechanical properties is caused by the columnar dendrites and strong texture microstructure in the AM-fabricated alloy [40]. As shown in Figure 3, Figure 4 and Figure 5, the intense upward elongated dendrites in the vertical direction appear in the samples. Due to the upward elongated dendrites and extreme strong texture induced by WAAM in the vertical direction [41], higher tensile strength but lower ductility are obtained. However, anisotropy properties in this work are much lower than those reported by Wang et al. [11] for the CMT process, but the interpass temperature was controlled at 400 °C. Moreover, the mechanical properties of the current work are better (see Table 5). Hence, it can be found that an effective interpass temperature should be controlled at a relatively low one. Moreover, the enhanced cooling highly decreased the amount and size of secondary phases that might consume the solid solution strengthening elements.
Figure 13 present the mechanical properties of samples cut along different directions of the fabricated part. H1–H16 represent the sixteen samples cut along the horizontal direction from top to bottom regions in the x–y plane, and V1–V4 are the four samples cut along the vertical direction (in the y–z plane. As shown in Figure 13, tensile strength and elongation are relatively uniform for the samples cut from different directions, and this uniformity is also attributed to the interpass cooling strategy that eliminates the difference of the microstructure in the samples cut from top to bottom regions [22].

4. Conclusions

This study focused on understanding the effects of the heat input of the CMT-based WAAM process on the development of microstructure of as-deposited Inconel 625 alloy and the mechanical properties of manufactured components with interpass temperature control via active cooling. Three heat inputs, namely 276, 552 and 828 J/mm, were used when manufacturing thin-wall test specimens. Note that the heat input was controlled by the heat torch speed, while the wire-feed speed was kept constant. The experiment results led to the following conclusions:
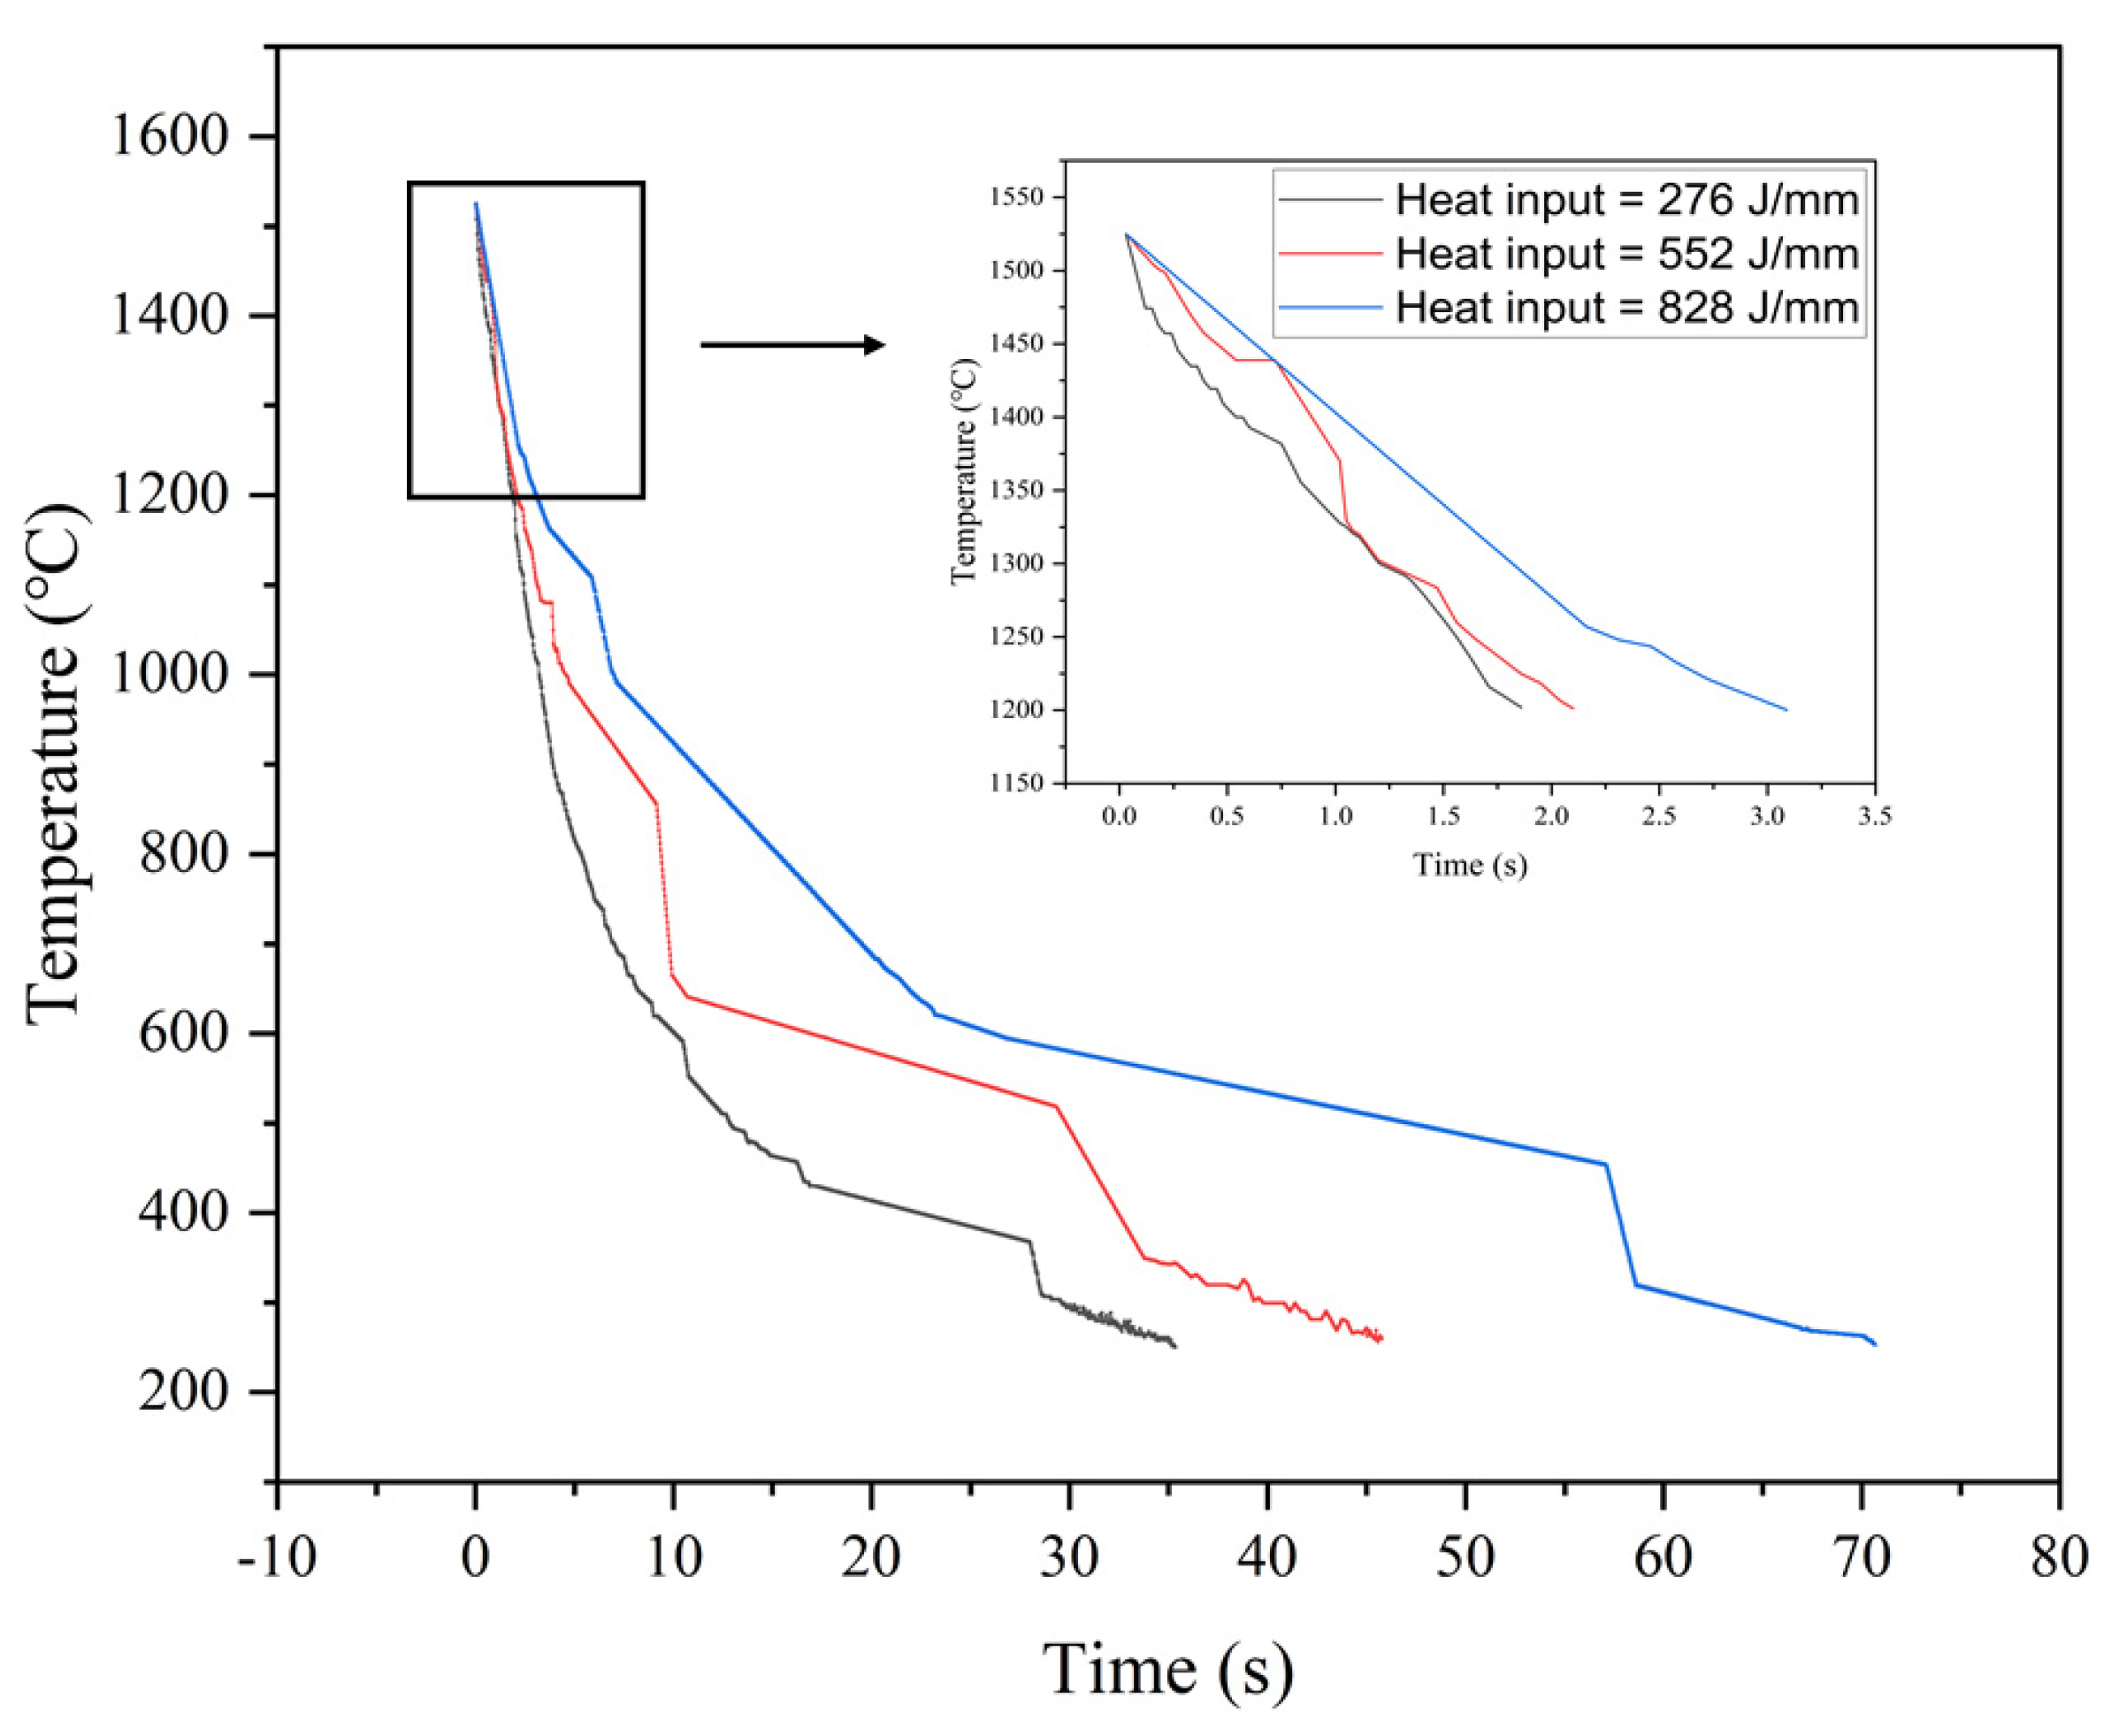
  • The macrostructure can be refined via lower heat input, and the 276 J/mm sample has the best surface finish among three heat input conditions, due to the relatively high solidification rate and low overflow.
  • Lower heat input refines the dendrite arm spacing, Laves phase and NbC carbide precipitates of the fabricated alloy by increasing the solidification rate. Due to the active cooling and temperature control between layers, the microstructure of the individual specimens is homogeneous along the height of built thin-wall structures. The current work, however, suggests that the interpass temperature should be controlled to a lower value.
  • The anisotropy in mechanical properties is highly reduced in this work. The micro-hardness and tensile properties are well-distributed in different regions of the as-deposited components, regardless of the location, and this is attributed to a rather homogeneous nature of the microstructure. This is achieved by the active control of the interpass temperature, which prevents heat accumulation in the built component during WAAM process.
  • The mechanical properties of samples decrease with increasing heat input, and this effect is considered to be due to the increased size of dendrite arm spacing. Hence, lower heat input to a reasonable value can be an effective way to enhance mechanical properties.
Although the texture and residual stress might be explored in the future, overall, the 276 J/mm heat input sample with enhanced cooling rate and interpass temperature control has the best combination of improvements in surface accuracy, dendrite refinement and enhanced mechanical properties at the present conditions.

Author Contributions

Conceptualization and methodology, C.Z., Z.Q. and H.L.; software, C.Z., Z.Q. and Z.W.; validation, Z.Q. and H.L.; Formal analysis, C.Z., Z.Q. and H.L.; investigation, C.Z.; Resources, H.Z., O.M., M.I., Z.P. and H.L.; data curation, C.Z. and Z.Q.; writing-original draft, C.Z.; Writing-Review and Editing, Z.Q., H.Z., Z.W., O.M. and M.I.; Visualization, C.Z.; supervision, H.L., J.X. and H.Z.; project administration and funding acquisition, H.Z., O.M., M.I. and H.L. All authors have read and agreed to the published version of the manuscript.

Funding

2021 UOW-ANSTO seed funding.

Institutional Review Board Statement

No applicable.

Informed Consent Statement

No applicable.

Data Availability Statement

All data included in this paper are available upon request by contact with the corresponding authors.

Acknowledgments

The authors acknowledge the provision of experimental beamtime under proposal ID M17469 by the Powder Diffraction beamline of the Australian Synchrotron (part of ANSTO). The great support of Qinfen Gu for the synchrotron experiment is appreciated.

Conflicts of Interest

The authors declare no conflict of interest.

References

  1. Frazier, W.E. Metal additive manufacturing: A review. J. Mater. Eng. Perform. 2014, 23, 1917–1928. [Google Scholar] [CrossRef]
  2. Herzog, D.; Seyda, V.; Wycisk, E.; Emmelmann, C. Additive manufacturing of metals. Acta Mater. 2016, 117, 371–392. [Google Scholar] [CrossRef]
  3. Ding, D.; Pan, Z.; Cuiuri, D.; Li, H. Wire-feed additive manufacturing of metal components: Technologies, developments and future interests. Int. J. Adv. Manuf. Technol. 2015, 81, 465–481. [Google Scholar] [CrossRef]
  4. Wang, Z.; Guan, K.; Gao, M.; Li, X.; Chen, X.; Zeng, X. The microstructure and mechanical properties of deposited-IN718 by selective laser melting. J. Alloy. 2012, 513, 518–523. [Google Scholar] [CrossRef]
  5. Henderson, M.; Arrell, D.; Larsson, R.; Heobel, M.; Marchant, G. Nickel based superalloy welding practices for industrial gas turbine applications. Sci. Technol. Weld. Join. 2004, 9, 13–21. [Google Scholar] [CrossRef]
  6. Chapman, L. Application of high temperature DSC technique to nickel based superalloys. J. Mater. Sci. 2004, 39, 7229–7236. [Google Scholar] [CrossRef]
  7. Dinda, G.; Dasgupta, A.; Mazumder, J. Laser aided direct metal deposition of Inconel 625 superalloy: Microstructural evolution and thermal stability. Mater. Sci. 2009, 509, 98–104. [Google Scholar] [CrossRef]
  8. Parida, A.K.; Maity, K. Comparison the machinability of Inconel 718, Inconel 625 and Monel 400 in hot turning operation. Eng. Sci. Technol. Int. J. 2018, 21, 364–370. [Google Scholar] [CrossRef]
  9. Shankar, V.; Rao, K.B.S.; Mannan, S. Microstructure and mechanical properties of Inconel 625 superalloy. J. Nucl. Mater. 2001, 288, 222–232. [Google Scholar] [CrossRef]
  10. Abioye, T.; McCartney, D.; Clare, A. Laser cladding of Inconel 625 wire for corrosion protection. J. Mater. Process. Technol. 2015, 217, 232–240. [Google Scholar] [CrossRef] [Green Version]
  11. Wang, Y.; Chen, X.; Su, C. Microstructure and mechanical properties of Inconel 625 fabricated by wire-arc additive manufacturing. Surf. Coat. Technol. 2019, 374, 116–123. [Google Scholar]
  12. Wang, Y.; Chen, X.; Shen, Q.; Su, C.; Zhang, Y.; Jayalakshmi, S.; Singh, R.A. Effect of magnetic Field on the microstructure and mechanical properties of inconel 625 superalloy fabricated by wire arc additive manufacturing. J. Manuf. Processes 2021, 64, 10–19. [Google Scholar] [CrossRef]
  13. Tanvir, A.; Ahsan, M.R.; Ji, C.; Hawkins, W.; Bates, B.; Kim, D.B. Heat treatment effects on Inconel 625 components fabricated by wire+ arc additive manufacturing (WAAM)—Part 1: Microstructural characterization. Int. J. Adv. Manuf. Technol. 2019, 103, 3785–3798. [Google Scholar] [CrossRef]
  14. Tanvir, A.; Ahsan, M.R.; Seo, G.; Kim, J.-D.; Ji, C.; Bates, B.; Lee, Y.; Kim, D.B. Heat treatment effects on Inconel 625 components fabricated by wire+ arc additively manufacturing (WAAM)—Part 2: Mechanical properties. Int. J. Adv. Manuf. Technol. 2020, 110, 1709–1721. [Google Scholar] [CrossRef]
  15. Rosli, N.A.; Alkahari, M.R.; Abdollah, M.F.; Maidin, S.; Ramli, F.R. Review on effect of heat input for wire arc additive manufacturing process. J. Mater. Res. Technol. 2021, 11, 2127–2145. [Google Scholar] [CrossRef]
  16. Su, C.; Chen, X.; Gao, C.; Wang, Y. Effect of heat input on microstructure and mechanical properties of Al-Mg alloys fabricated by WAAM. Appl. Surf. Sci. 2019, 486, 431–440. [Google Scholar] [CrossRef]
  17. Wang, S.; Gu, H.; Wang, W.; Li, C.; Ren, L.; Wang, Z.; Zhai, Y.; Ma, P. The Influence of Heat Input on the Microstructure and Properties of Wire-Arc-Additive-Manufactured Al-Cu-Sn Alloy Deposits. Metals 2020, 10, 79. [Google Scholar] [CrossRef] [Green Version]
  18. Xiong, J.; Li, Y.; Li, R.; Yin, Z. Influences of process parameters on surface roughness of multi-layer single-pass thin-walled parts in GMAW-based additive manufacturing. J. Mater. Process. Technol. 2018, 252, 128–136. [Google Scholar] [CrossRef]
  19. Van, D.; Dinda, G.; Park, J.; Mazumder, J.; Lee, S.H. Enhancing hardness of Inconel 718 deposits using the aging effects of cold metal transfer-based additive manufacturing. Mater. Sci. Eng. A 2020, 776, 139005. [Google Scholar] [CrossRef]
  20. Brandl, E.; Michailov, V.; Viehweger, B.; Leyens, C. Deposition of Ti–6Al–4V using laser and wire, part I: Microstructural properties of single beads. Surf. Coat. Technol. 2011, 206, 1120–1129. [Google Scholar] [CrossRef]
  21. Vandersluis, E.; Ravindran, C. Comparison of measurement methods for secondary dendrite arm spacing. Metallogr. Microstruct. Anal. 2017, 6, 89–94. [Google Scholar] [CrossRef]
  22. Canté, M.V.; Brito, C.; Spinelli, J.E.; Garcia, A. Interrelation of cell spacing, intermetallic compounds and hardness on a directionally solidified Al–1.0 Fe–1.0 Ni alloy. Mater. Des. 2013, 51, 342–346. [Google Scholar] [CrossRef]
  23. Jiang, Q.; Zhang, P.; Yu, Z.; Shi, H.; Li, S.; Wu, D.; Yan, H.; Ye, X.; Chen, J. Microstructure and Mechanical Properties of Thick-Walled Inconel 625 Alloy Manufactured by Wire Arc Additive Manufacture with Different Torch Paths. Adv. Eng. Mater. 2021, 23, 2000728. [Google Scholar] [CrossRef]
  24. Zhang, F.; Levine, L.E.; Allen, A.J.; Stoudt, M.R.; Lindwall, G.; Lass, E.A.; Williams, M.E.; Idell, Y.; Campbell, C.E. Effect of heat treatment on the microstructural evolution of a nickel-based superalloy additive-manufactured by laser powder bed fusion. Acta Mater. 2018, 152, 200–214. [Google Scholar] [CrossRef]
  25. Xing, X.; Di, X.; Wang, B. The effect of post-weld heat treatment temperature on the microstructure of Inconel 625 deposited metal. J. Alloy Compd. 2014, 593, 110–116. [Google Scholar] [CrossRef]
  26. Xiao, H.; Li, S.; Han, X.; Mazumder, J.; Song, L. Laves phase control of Inconel 718 alloy using quasi-continuous-wave laser additive manufacturing. Mater. Des. 2017, 122, 330–339. [Google Scholar] [CrossRef]
  27. Wang, K.; Liu, Y.; Sun, Z.; Lin, J.; Lv, Y.; Xu, B. Microstructural evolution and mechanical properties of Inconel 718 superalloy thin wall fabricated by pulsed plasma arc additive manufacturing. J. Alloy Compd. 2020, 819, 152936. [Google Scholar] [CrossRef]
  28. Tinoco, J.; Fredriksson, H. Solidification of a modified Inconel 625 alloy under different cooling rates. High Temp. Mater. Processes 2004, 23, 13–24. [Google Scholar] [CrossRef]
  29. Dubiel, B.; Sieniawski, J. Precipitates in additively manufactured Inconel 625 superalloy. Mater. Des. 2019, 12, 1144. [Google Scholar] [CrossRef] [PubMed] [Green Version]
  30. Mitchell, A.; Schmalz, A.; Schvezov, C.; Cockcroft, S. The precipitation of primary carbides in alloy 718. Superalloys 1994, 718, 65–78. [Google Scholar]
  31. Cockcroft, S.; Degawa, T.; Mitchell, A.; Tripp, D.; Schmalz, A. Inclusion precipitation in superalloys. Superalloys 1992, 1992, 577–586. [Google Scholar]
  32. Antonsson, T.; Fredriksson, H. The effect of cooling rate on the solidification of INCONEL 718. Metall. Mater. Trans. B 2005, 36, 85–96. [Google Scholar] [CrossRef]
  33. Artaza, T.; Bhujangrao, T.; Suárez, A.; Veiga, F.; Lamikiz, A. Influence of heat input on the formation of laves phases and hot cracking in plasma arc welding (PAW) additive manufacturing of inconel 718. Metals 2020, 10, 771. [Google Scholar] [CrossRef]
  34. Gusev, A.I. Anisotropy of microstructure and elastic properties of niobium carbide nanopowders. Solid State Sci. 2020, 100, 106092. [Google Scholar] [CrossRef]
  35. Hsiao, Z.-W.; Kuhn, B.; Chen, D.; Singheiser, L.; Kuo, J.-C.; Lin, D.-Y. Characterization of Laves phase in Crofer 22 H stainless steel. Micron 2015, 74, 59–64. [Google Scholar] [CrossRef] [PubMed]
  36. Seow, C.E.; Coules, H.E.; Wu, G.; Khan, R.H.; Xu, X.; Williams, S. Wire+ Arc Additively Manufactured Inconel 718: Effect of post-deposition heat treatments on microstructure and tensile properties. Mater. Des. 2019, 183, 108157. [Google Scholar] [CrossRef]
  37. Højerslev, C.; Tiedje, N.; Hald, J. Segregation effects and phase developments during solidification of alloy 625. In Proceedings of the Materials Science Forum, Vancouver, BC, Canada, 4–8 July 2006; pp. 373–378. [Google Scholar]
  38. Theriault, A.; Xue, L.; Dryden, J. Fatigue behavior of laser consolidated IN-625 at room and elevated temperatures. Mater. Sci. Eng. A 2009, 516, 217–225. [Google Scholar] [CrossRef] [Green Version]
  39. Lervåg, M.; Sørensen, C.; Robertstad, A.; Brønstad, B.M.; Nyhus, B.; Eriksson, M.; Aune, R.; Ren, X.; Akselsen, O.M.; Bunaziv, I. Additive manufacturing with superduplex stainless steel wire by cmt process. Metals 2020, 10, 272. [Google Scholar] [CrossRef] [Green Version]
  40. Carroll, B.E.; Palmer, T.A.; Beese, A.M. Anisotropic tensile behavior of Ti–6Al–4V components fabricated with directed energy deposition additive manufacturing. Acta Mater. 2015, 87, 309–320. [Google Scholar] [CrossRef]
  41. Yadroitsev, I.; Thivillon, L.; Bertrand, P.; Smurov, I. Strategy of manufacturing components with designed internal structure by selective laser melting of metallic powder. Appl. Surf. Sci. 2007, 254, 980–983. [Google Scholar] [CrossRef]
  42. Wang, J.; Sun, Q.; Wang, H.; Liu, J.; Feng, J. Effect of location on microstructure and mechanical properties of additive layer manufactured Inconel 625 using gas tungsten arc welding. Mater. Sci. Eng. A 2016, 676, 395–405. [Google Scholar] [CrossRef]
Figure 1. (a) Schematics of sample extraction for metallurgical and tensile tests. (b) Illustration of micro-hardness testing position.
Metals 12 00046 g001
Figure 2. Macro-morphology of the fabricated components with heat input of (a) 276 J/mm, (b) 552 J/mm and (c) 828 J/mm; (d) layer height of different heat inputs.
Metals 12 00046 g002
Figure 3. Microstructure morphology in cross-section (y–z plane) of the as-fabricated sample with heat input 276 J/mm. (a) Illustration of microstructure observing position; (bi) are representative microstructure at low and high magnifications for different positions: (b,f) last layer, (c,g) top region, (d,h) middle region and (e,i) bottom region.
Metals 12 00046 g003
Figure 4. Microstructure morphology in cross-section (y–z plane) of the as-fabricated sample with heat input 552 J/mm. (a) Illustration of microstructure observing position. (bi) Representative microstructure at low and high magnifications for different positions: (b,f) last layer, (c,g) top region, (d,h) middle region and (e,i) bottom region.
Metals 12 00046 g004
Figure 5. Microstructure morphology in cross-section (y–z plane) of the as-fabricated sample with heat input 828 J/mm. (a) Illustration of microstructure observing position. (bi) Representative microstructure at low and high magnifications for different positions: (b,f) the last layer, (c,g) top region, (d,h) middle region and (e,i) bottom region.
Metals 12 00046 g005
Figure 6. Illustration of PDAS and SDAS structure: (a) PDAS structure; (b) SDAS structure.
Metals 12 00046 g006
Figure 7. Solidification rate of the as-deposited samples with different heat inputs.
Metals 12 00046 g007
Figure 8. XRD and synchrotron XRD analysis of the as-deposited sample with 828 J/mm heat input: (a) XRD pattern and (b) synchrotron XRD pattern.
Metals 12 00046 g008
Figure 9. Distribution of precipitates of as-deposited samples with different heat inputs: (a) 276 J/mm, (b) 552 J/mm and (c) 828 J/mm.
Metals 12 00046 g009
Figure 10. Backscattered electron image and EDS results of different phases: (a,b) matrix, (c,d) Laves phase and (e,f) MC carbide.
Metals 12 00046 g010
Figure 11. Micro-hardness of the samples with different heat inputs. (a) Average micro-hardness of each heat input. (b) Comparison of vertical micro-hardness and (ce) comparison of horizontal micro-hardness of different heat input: (c) 276 J/mm, (d) 552 J/mm and (e) 828 J/mm.
Metals 12 00046 g011
Figure 12. Tensile properties of as-deposited samples for different heat input were taken from horizontal (x–y plane) and vertical (y–z plane) directions: (a) ultimate tensile strength, (b) yield strength and (c) elongation.
Metals 12 00046 g012
Figure 13. Tensile properties of as-deposited samples for three different heat inputs were taken from horizontal (x–y plane) and vertical (y–z plane) directions: (a,b) 276 J/mm, (c,d) 552 J/mm and (e,f) 828 J/mm.
Metals 12 00046 g013
Table 1. Chemical composition of Inconel 625 wire used in this study.
ElementNiCrFeMoNb + TaCuMnAlTiSiCSP
wt%64.022.60.218.83.490.020.0010.150.180.090.10.000010.004
Table 2. Process parameters of WAAM deposition.
Sample No. Wire Feed
Speed (m/min)
Torch Travel
Speed (mm/min)
Current (A)Voltage (V)Heat Input (J/mm)
16.560015717.6276
26.530015717.6552
36.520015717.6828
Table 3. Dimensions of the samples produced by CMT–WAAM deposition.
Sample No.Length (mm)Width (mm)Height (mm)
1130840
21301240
31301440
Table 4. Size of primary dendrite arm spacing and secondary dendrite arm spacing was measured by 3 heat inputs.
Distance276 J/mm552 J/mm828 J/mm
PDAS (μm)13 ± 319 ± 425 ± 5
SDAS (μm)5 ± 17 ± 110 ± 1
Table 5. Comparison of average tensile properties of Inconel 625 fabricated by using different processes.
SampleProcessInterpass Temperature (°C) Heat Input
(J/mm)
UTS
(MPa)
YS
(MPa)
Elongation
(%)
Reference
1WAAM–CMT10027672442755-
2WAAM–CMT10055272042353-
3WAAM–CMT10082870441654-
4WAAM–CMT40021668840143[11]
5WAAM–CMT40024067639144[11]
6WAAM–CMT40027064837747[11]
7WAAM–CMT10012265837356[14]
8WAAM–TIG50-703-41[42]
Publisher’s Note: MDPI stays neutral with regard to jurisdictional claims in published maps and institutional affiliations.

