Article

Powder Particle Size Effects on Microstructure and Mechanical Properties of Mechanically Alloyed ODS Ferritic Steels

1
Department of Physics, Universidad Carlos III de Madrid, Avda. de la Universidad 30, 28911 Madrid, Spain
2
Karlsruhe Institute of Technology, Inst Appl Mat IAM-AWP, Hermann-von-Helmholtz-Platz 1, 76344 Eggenstein-Leopoldshafen, Germany
*
Author to whom correspondence should be addressed.
Metals 2022, 12(1), 69; https://doi.org/10.3390/met12010069
Submission received: 30 November 2021 / Revised: 17 December 2021 / Accepted: 23 December 2021 / Published: 30 December 2021
(This article belongs to the Special Issue New Developments in Dispersion Strengthening of Metals and Alloys)

Abstract

:
Reduced activation ferritic (RAF) steels are expected to be widely used in challenging nuclear industrial applications under severe thermo-mechanical regimes and intense neutron loads. Therefore, actual research panorama is facing the strengthening strategies necessary to maximize both performance and endurance under these conditions. Oxide dispersion strengthened (ODS) RAF steels are leader candidates as structural materials in fusion energy reactors thanks to the reinforcement obtained with a fine dispersion of nanosized oxides in their matrix. In this study, the influence of the initial powder particle size and the selected processing route on the final material has been investigated. Two RAF ODS steels coming from atomized pre-alloyed powders with nominal particle powder sizes of 70 and 30 µm and composition Fe-14Cr-2W-0.4Ti-0.3Y2O3 (wt. %) were manufactured by mechanical alloying. Alloyed powders were compacted by hot isostatic pressing, hot crossed rolled, and annealed at 1273 K. Initial powder particle size differences minimize after milling. Both steels present an almost completely recrystallized material and similar grain sizes. The same type and distributions of secondary phases, Cr-W-rich, Ti-rich, and Y-Ti oxide nanoparticles, have been also characterized by transmission electron microscopy (TEM) in both alloy samples. The strengthening effect has been confirmed by tensile and Charpy impact tests. The two alloys present similar strength values with slightly better ductile brittle transition temperature (DBTT) and ductility for the steel produced with the smaller powder size.

1. Introduction

Development of strengthening techniques on reduced activation ferritic and ferritic/martensitic (RAF and RAFM) steels for high-temperature applications represent one of the main objectives in research activities on new materials for nuclear energy applications [1,2,3]. Innovative concept designs, such as DEMO and first-generation prototypes, aim to improve reactor specifications by developing new technologies and materials that could withstand extreme operation conditions [4]. RAFM and RAF steels, reinforced with a stable dispersion of oxide nanoparticles, allow to increase the operational upper temperature limit, at least in 150 K, up to 973 K [5]. Their strengthening mechanisms result from the presence of a high density of thermally stable nano-oxides homogeneously distributed into the alloy matrix, fine grain sizes, and high dislocation densities [6,7]. Ti addition in oxide dispersion strengthened (ODS) RAF steels is essential to dissolve and refine the Y2O3 particles, as it favors precipitation of smaller complex Y-Ti-O nano-oxides, thus increasing their number density [8,9]. Nano-oxides hinder dislocation climb and glide and grain boundary migration, allowing the grain structure to be stable at high temperatures. Besides, the nanodispersoids could be stable under irradiation up to 1000 K, trapping He in fine-scale bubbles, inhibiting void swelling and fast fracture embrittlement at lower temperatures as well as creep rupture embrittlement at high temperatures [6,10].
The principal production routes for ODS RAFM and RAF steels combine alloying processes, consolidation techniques, and thermal/thermomechanical treatments [5]. During the last decades, different routes have been investigated [11,12] with the goal of optimizing material properties, maximizing the amount of material obtained, and minimizing production costs [8,13]. Each step in the process is essential to generate the beneficial strengthening mechanisms in the materials: from the nano-oxides formation and precipitation to the presence of beneficial secondary phases, together with the refinement of the matrix grains. Further work is essential to fully accomplish these objectives. The present work addresses the characterization of two ODS RAF steels, focusing on the impact of the initial powder specifications and the selected processing route on the mechanical properties and microstructure of the obtained materials.
The two ODS RAF steels were obtained from atomized pre-alloyed powders with identical nominal composition Fe-14Cr-2W-0.4Ti (wt. %) but different particle sizes. Both ODS RAF steels followed the same processing route by being mechanically alloyed with Y2O3 nanosized powder, compacted by hot isostatic pressing (HIP), and subsequently hot crossed rolled (HCR) and annealed [14,15]. The aim of this work is to assess how the initial powder characteristics, together with the processing and consolidation parameters, influence the microstructure and mechanical properties of the obtained materials.

2. Materials and Methods

Two ODS ferritic steels were manufactured following a powder metallurgy route [14] from atomized pre-alloyed powders with nominal particle sizes of ~70 and ~30 µm, from now on referred to as ODS-L and ODS-S, respectively. These pre-alloyed powders of nominal composition Fe-14Cr-2W-0.4Ti (wt. %) (Nanoval GmbH & Co. KG, Berlin, Germany) and Y2O3 nanosized powder (0.3 wt. %) 99.995% purity (SkySpring Nanomaterials Inc., Houston, TX, USA) were mechanically alloyed in a Retsch PM400 planetary mill using austenitic steel vessels, AISI 52,100 steel balls and 10:1 ball to powder ratio. The milling was performed under H2 atmosphere, which was renewed every 9 h interval; each interval consisted of 4 cycles of 2 h milling + 15 min pause. The process was completed after a total time of 27 h at 300 rpm maximum rotational speed. Particle size analysis of pre-alloyed and mechanically alloyed powders were performed via laser diffraction in a Mastersizer 2000.
The as-milled ODS powders were introduced into 304-L steel cans and degassed at 693 K for 24 h. The canned ODS powders were consolidated by HIP in Ar pressure of 175 MPa at 1373 K for 2 h. HIP parameters were selected based on previous investigations on ODS steels, where densities close to 100% of the theoretical value were achieved [16,17]. Several consolidated batches were obtained following this method and were subsequently hot cross rolled (HCR). During the HCR process, the sample was rotated 90° on the rolling plane after every pass and reheated for 5 min, thus reducing the mechanical properties’ anisotropy caused by the elongation of grains along the rolling direction [18]. The HCR temperature began at 1403–1473 K (with the batches preheated at that temperature) and gradually decreased with the consecutive passes to 1223 K. The thickness reduction after 18 to 23 passes was ~70%. A comprehensive study about the best temperature for an annealing treatment after HCR revealed that 1273 K optimized the mechanical response of the ODS material [14]. Thus, the annealing treatments were carried out on samples of both ODS-L and ODS-S steels at 1273 K for 2 h followed by air cooling. The densities were measured using a Quantachrome 1200e He ultrapycnometer.
Standard cutting, grinding, and polishing processes were used for sample preparation. Flat samples for tensile tests with gauge dimensions 15 × 3 × 1 mm3 were prepared by electroerosion parallel to the three plane orientations: Transversal-Short (TS), Longitudinal-Short (LS), and Longitudinal-Transversal (LT). Tensile tests were performed in a Shimadzu Autograph AG1 at a constant crosshead rate of 0.1 mm/min in a temperature range from 293 to 973 K; during the tensile tests above room temperature, the specimens were kept under a flow of pure Ar to minimize surface oxidation. V-notch samples for Charpy impact tests were also obtained by electroerosion parallel to the TS transverse plane, following DIN 50 115 standard with dimensions 27 × 4 × 3 mm3 and notch depth of 1 mm in V shape. Tests were carried out in a Zwick/Roell HIT50P using a 25 J pendulum energy from 77 to 473 K temperatures. Experimental points were fitted to a sigmoidal curve to obtain the DBBT; lower and upper shelf energies (LSE and USE) were calculated from the experimental mean values of the brittle and ductile regimes, respectively.
Samples for electron microscopy observations were electropolished using a solution of 5% perchloric acid in methanol (95%) around 233 K. Microstructural observations were done by scanning electron microscopy (SEM) on a Phillips XL-30 and a FESEM TENEO LoVac microscope (FEI Company, Hillsboro, OR, USA) equipped with X-ray energy dispersive spectrometers (XEDS) in secondary electrons (SE) and back-scattered electron modes (BSE). X-ray Diffraction (XRD) was performed in an X-Pert Phillips diffractometer using 40 kV, 45 mA.
The electron backscatter diffraction (EBSD) technique was employed for crystallographic orientation studies using Zeiss Merlin and Zeiss Auriga SEM instruments (Carl Zeiss AG, Oberkochen, Germany). Kikuchi-generated patterns were recorded with a high-speed EBSD Hikari XEDS camera (EDEN Instruments Inc., Alixan, France); for data processing and analysis, the OIM AnalysisTM software was used. Parameters were adjusted to a region of 18 × 18 µm2 with 0.4-µm steps. Following this, EBSD maps were obtained at 20 kV from 50 × 50 µm2 areas with 40-nm steps (1 pixel). Minimum grain size was fixed to 10 px, the confidence index (CI) to 0.1, and 5° as the tolerance angle. Low-angle grain boundaries (LAGB) were defined between the 5–15° interval and high-angle grain boundaries (HAGB) as misorientations larger than 15°. Crystallographic texture was studied on 100 × 300 µm2 areas scanned for Orientation Distribution Function (ODF) maps corresponding to the φ2 = 45° Euler space section.
Secondary phases and nanoparticles were identified via transmission electron microscopy (TEM) using a JEOL 3000F (JEOL Ltd., Tokyo, Japan) equipped with XEDS and electron energy loss spectroscopy (EELS) systems. The working voltage was stablished at 300 kV. In addition, bright field (BF) combined with XEDS and high-resolution electron microscopy (HREM) were used.

3. Results and Discussion

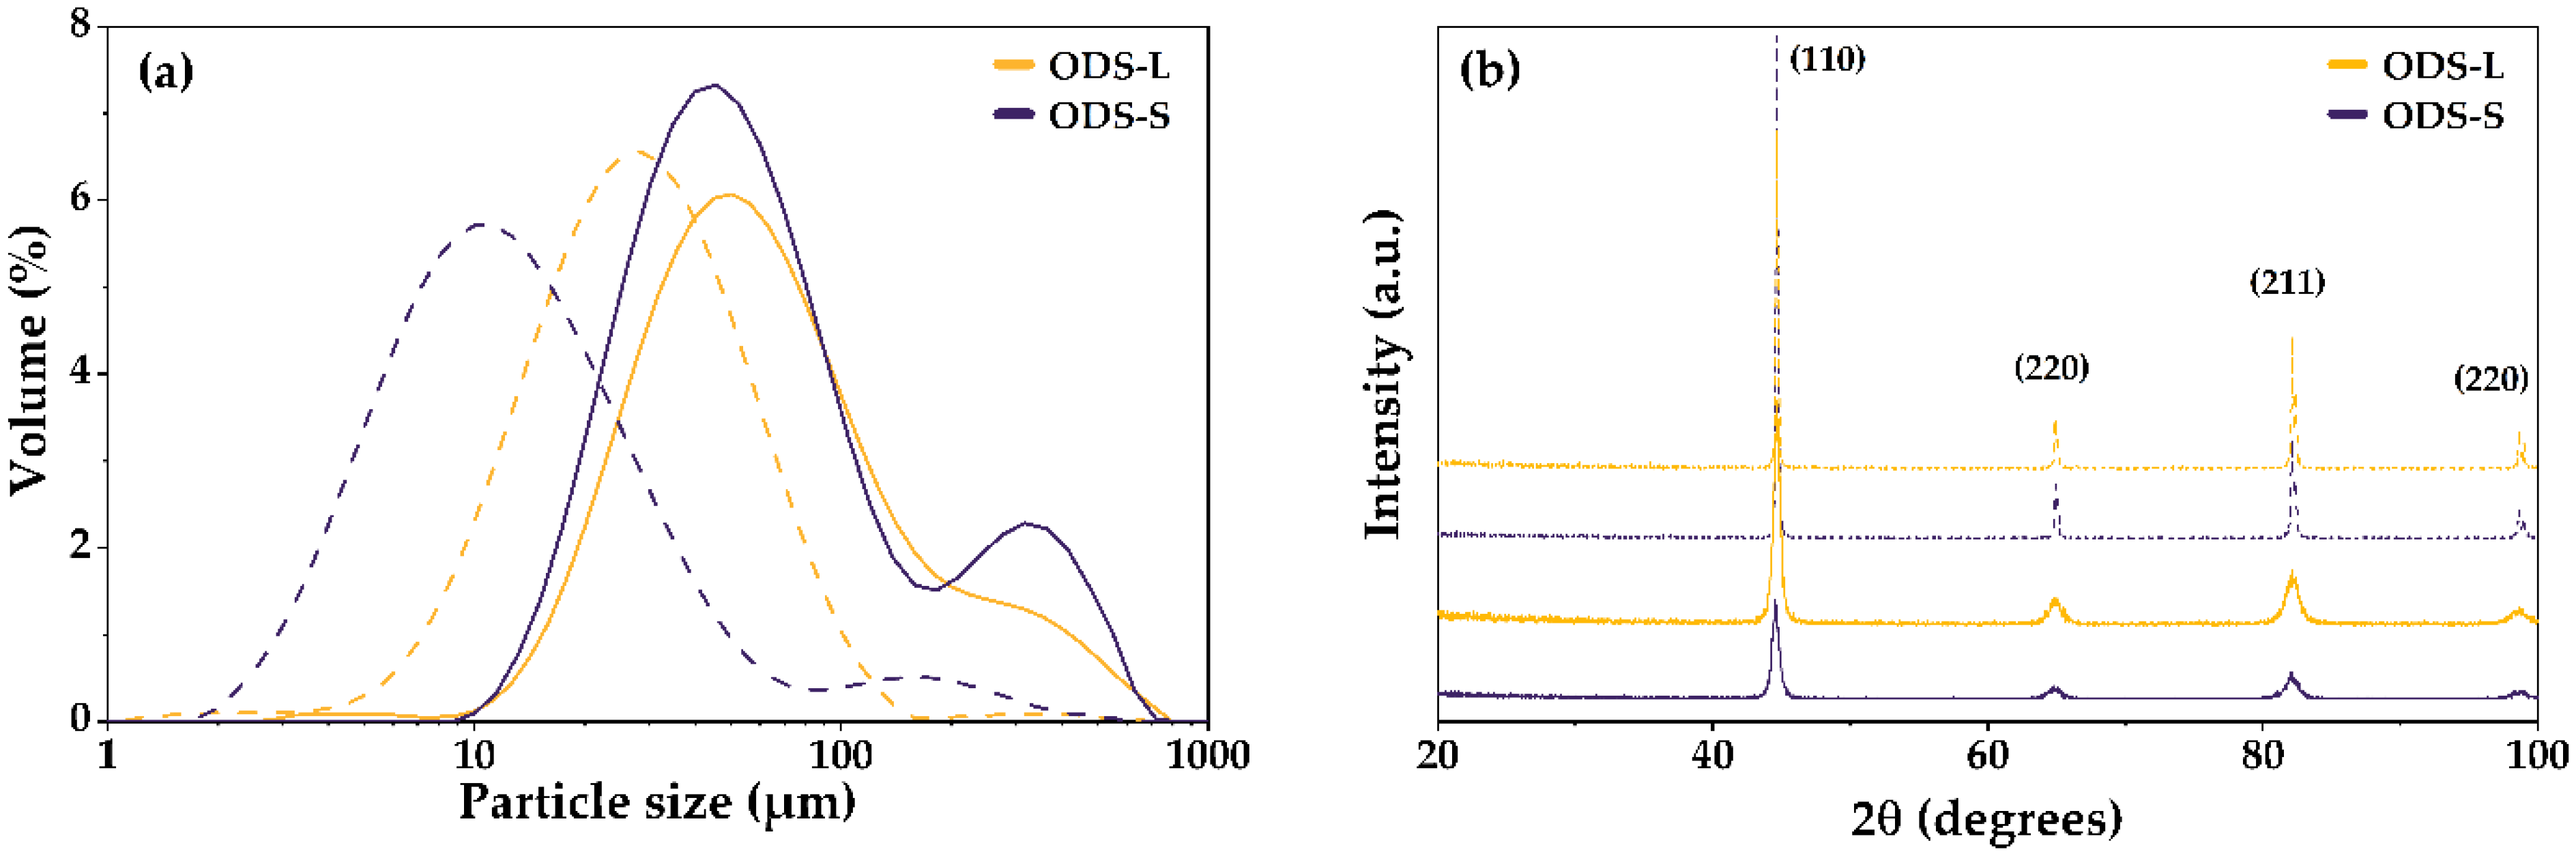
3.1. Powder Characterization

Atomized pre-alloyed powders of the two ODS ferritic steels were characterized before and after mechanical milling. Particle size measurements are depicted in Figure 1a. The ODS-L pre-alloyed powder shows a Gaussian distribution between 4 and 150 µm, centered at ~29 µm with 90% of the volume distribution below 69 µm. The ODS-S pre-alloyed powder is characterized by an incipient bimodal distribution with 90% of the volume distribution below 43 µm. Overall, 95% of the distribution lies between 2 and 80 µm, centered at 10 µm, with the remaining 5% being centered at ~159 µm. After milling, the initial differences in size between both samples diminish. Moreover, 85–90% of the particles of the milled ODS-L and ODS-S powders are smaller than 200 µm, with mode values of ~50 µm and ~44 µm, respectively, and ~335 µm and ~330 µm for the larger particles; median values are 60.5 µm for the ODS-L powder and 57.5 µm for the ODS-S powder. The original incipient bimodal distribution becomes more accentuated after milling for the ODS-S powder, with respect to the ODS-L one.
XRD results for both pre-alloyed steel powders exhibit characteristic peaks of bcc-Fe, with a calculated lattice parameter of 2.876 ± 0.003 Å, consistent with a single α-ferritic phase. The milling process broadened the characteristic peaks while lowering their intensity (Figure 1b), indicating a notable grain refinement, crystalline imperfections, and plastic deformation [19]. The lattice parameter remained stable for both samples after milling. Detailed chemical composition of the milled ODS powders is shown in Table 1.
SEM images showing the powders morphology before and after milling are displayed in Figure 2. Figure 2a,b reveals the spherical shape of the atomized pre-alloyed powders, evidencing the difference in size among them. Small satellites can scarcely be found attached to larger particles as well as very few particles with irregular morphologies. After milling, both ODS-L and ODS-S powders are equally deformed, presenting flattened and/or equiaxial shapes with uneven surfaces (Figure 2c,d). Previous size differences can no longer be appreciated in these images, as confirmed previously by particle size analysis (Figure 1a).

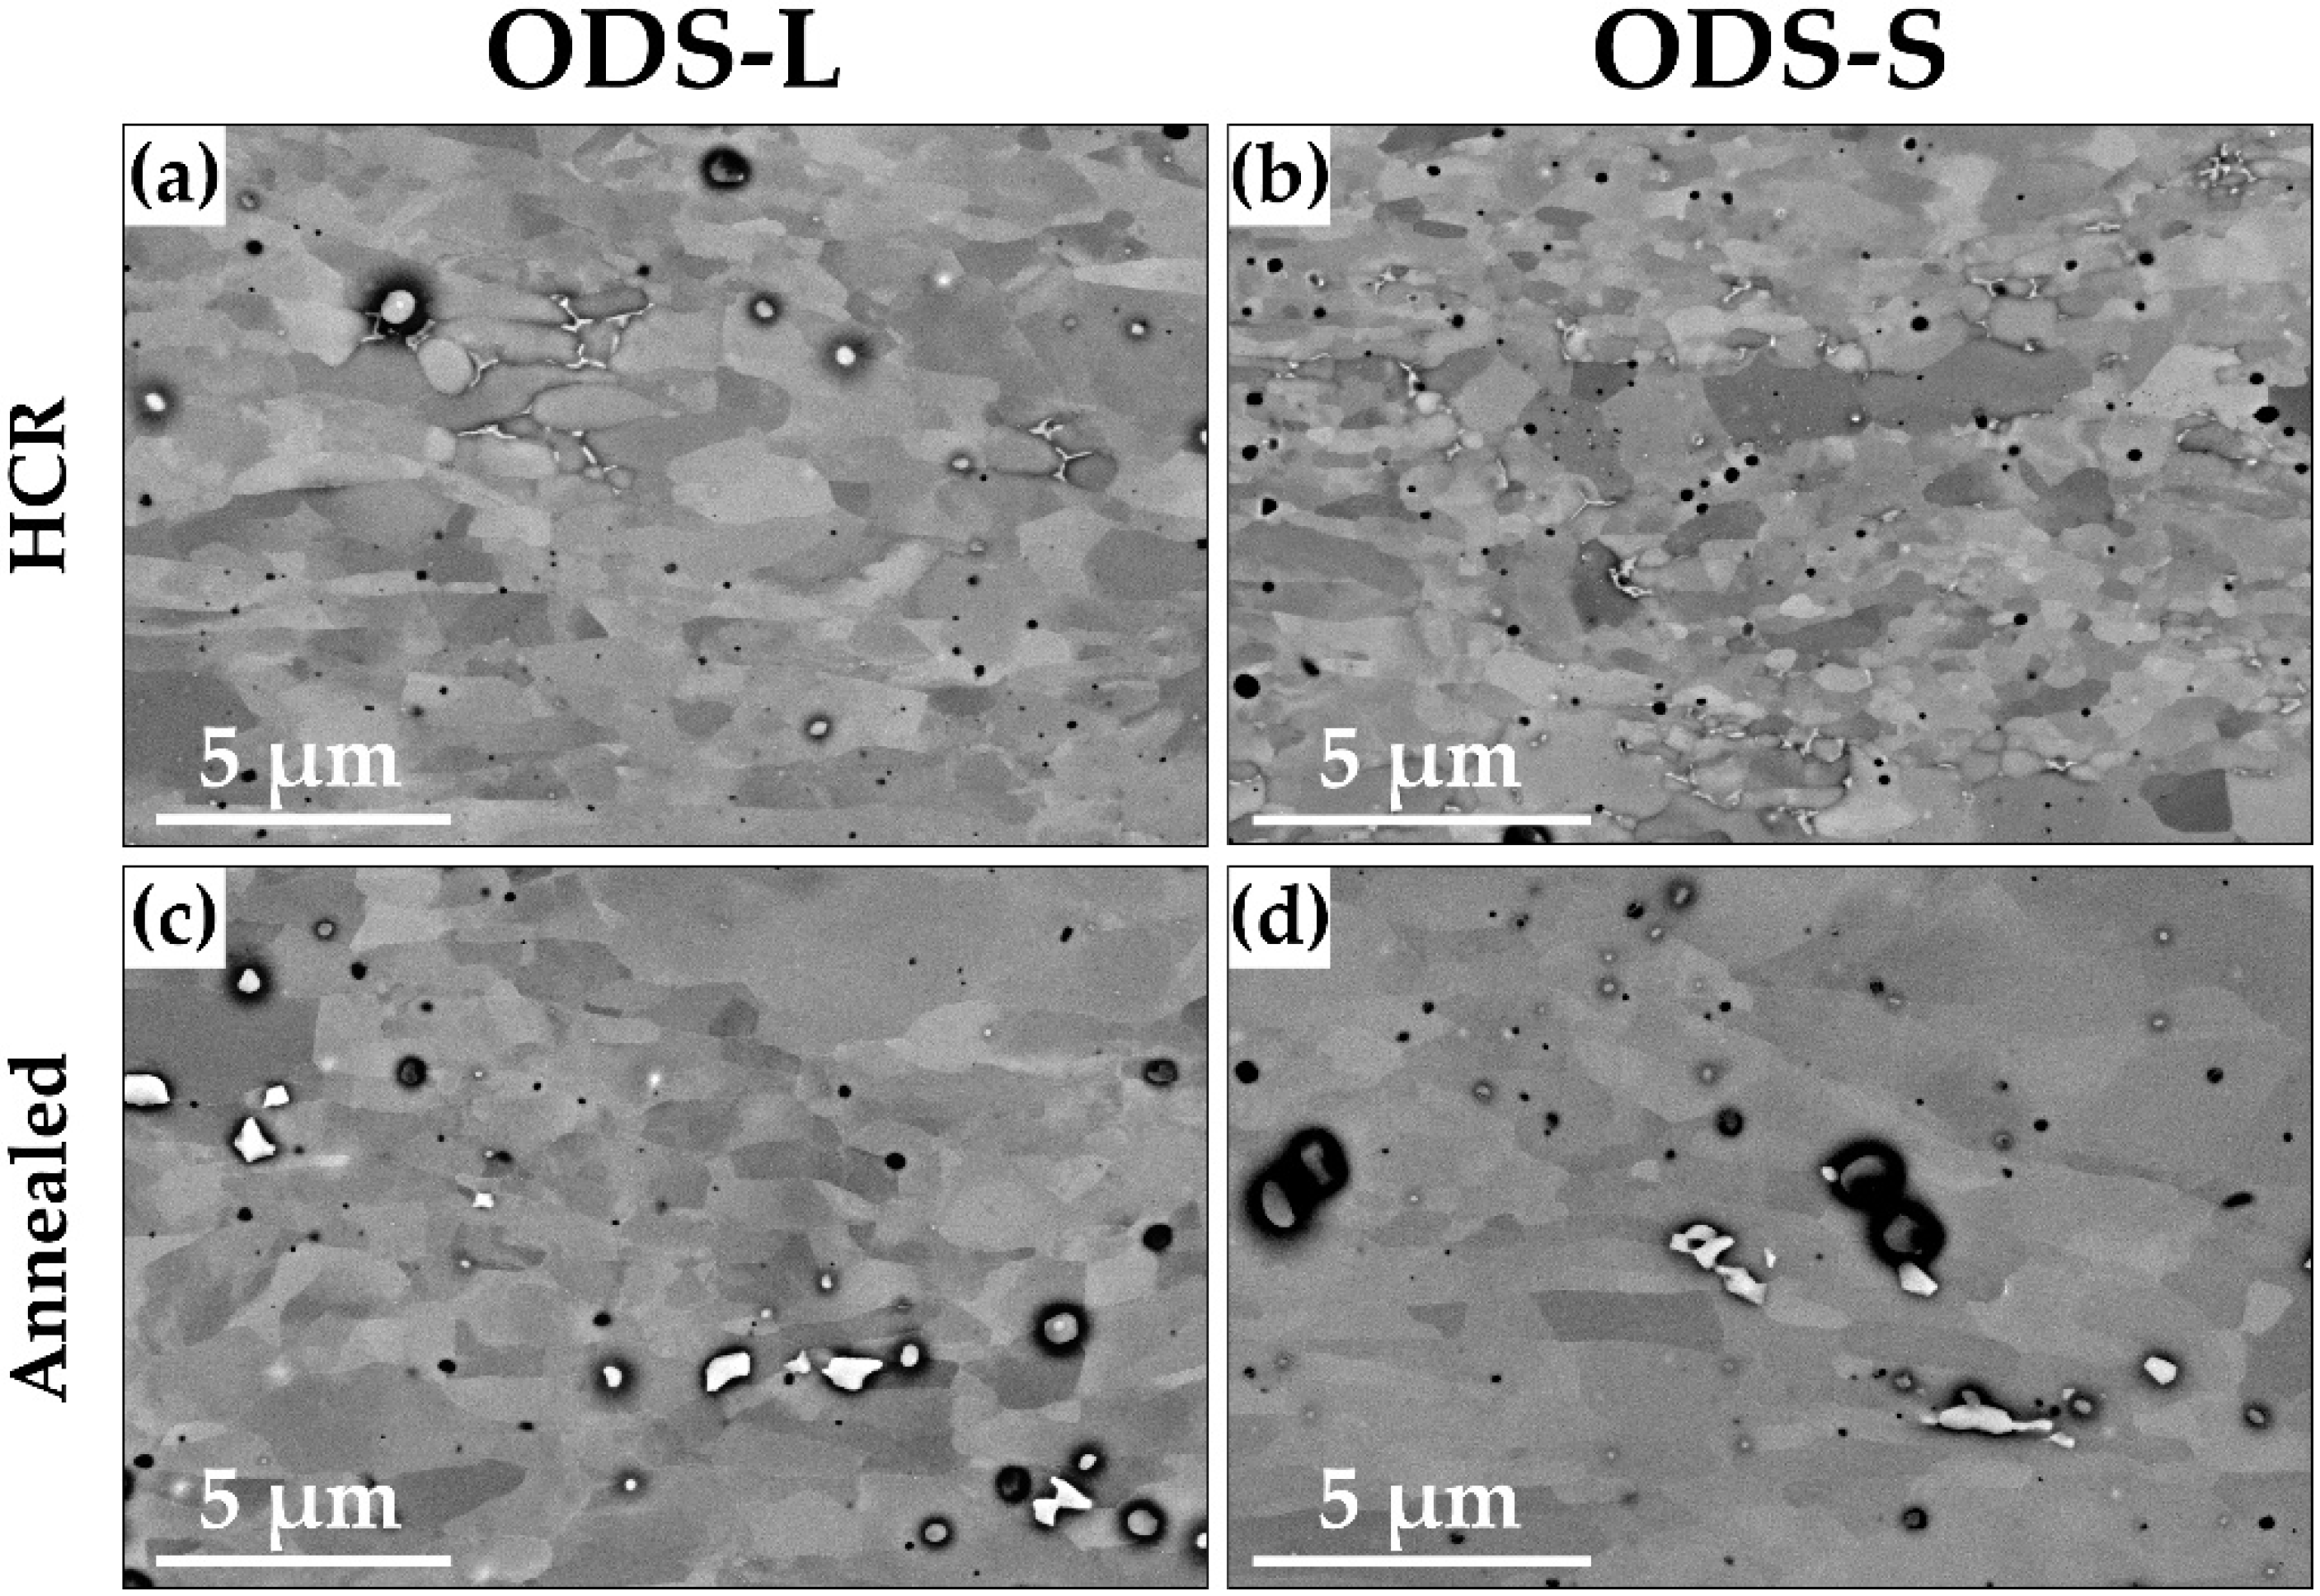
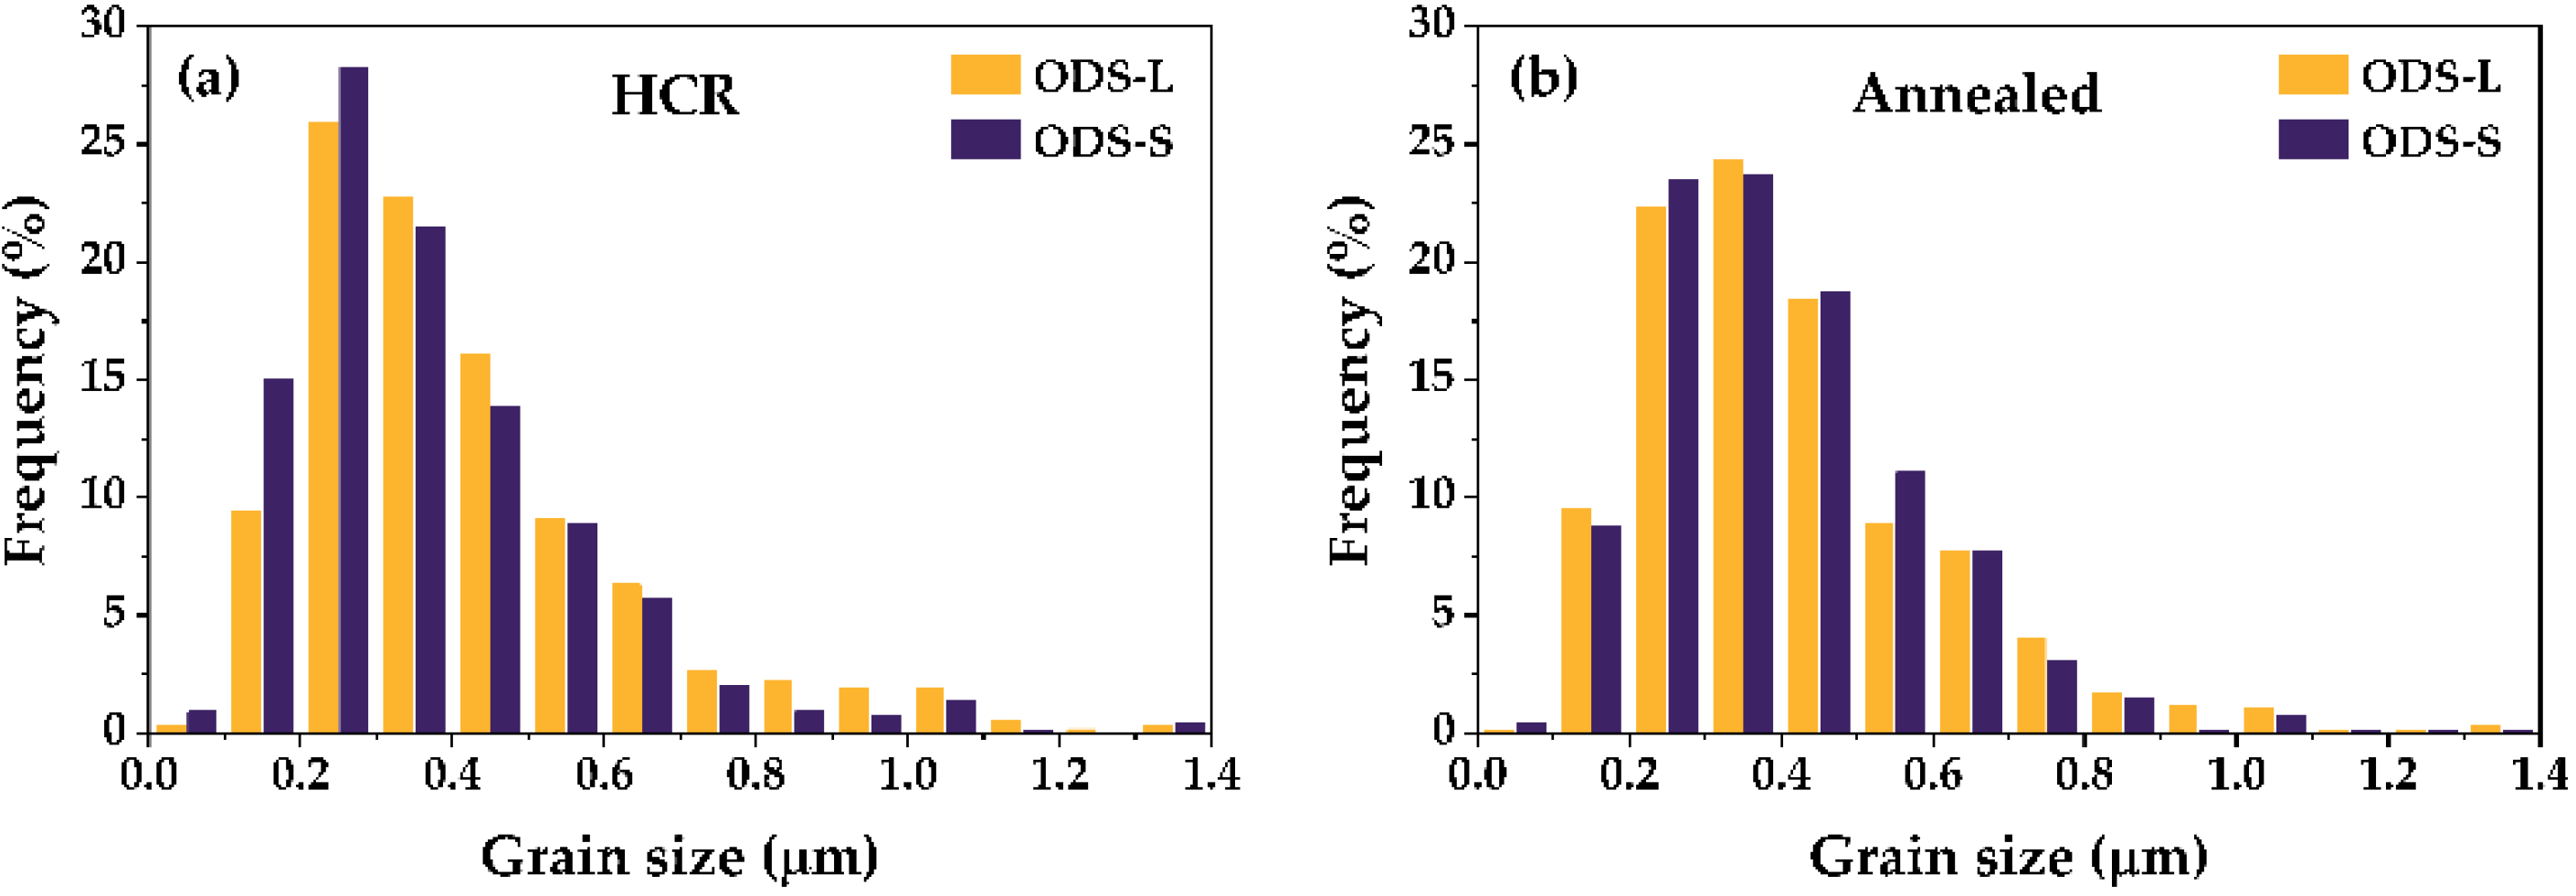
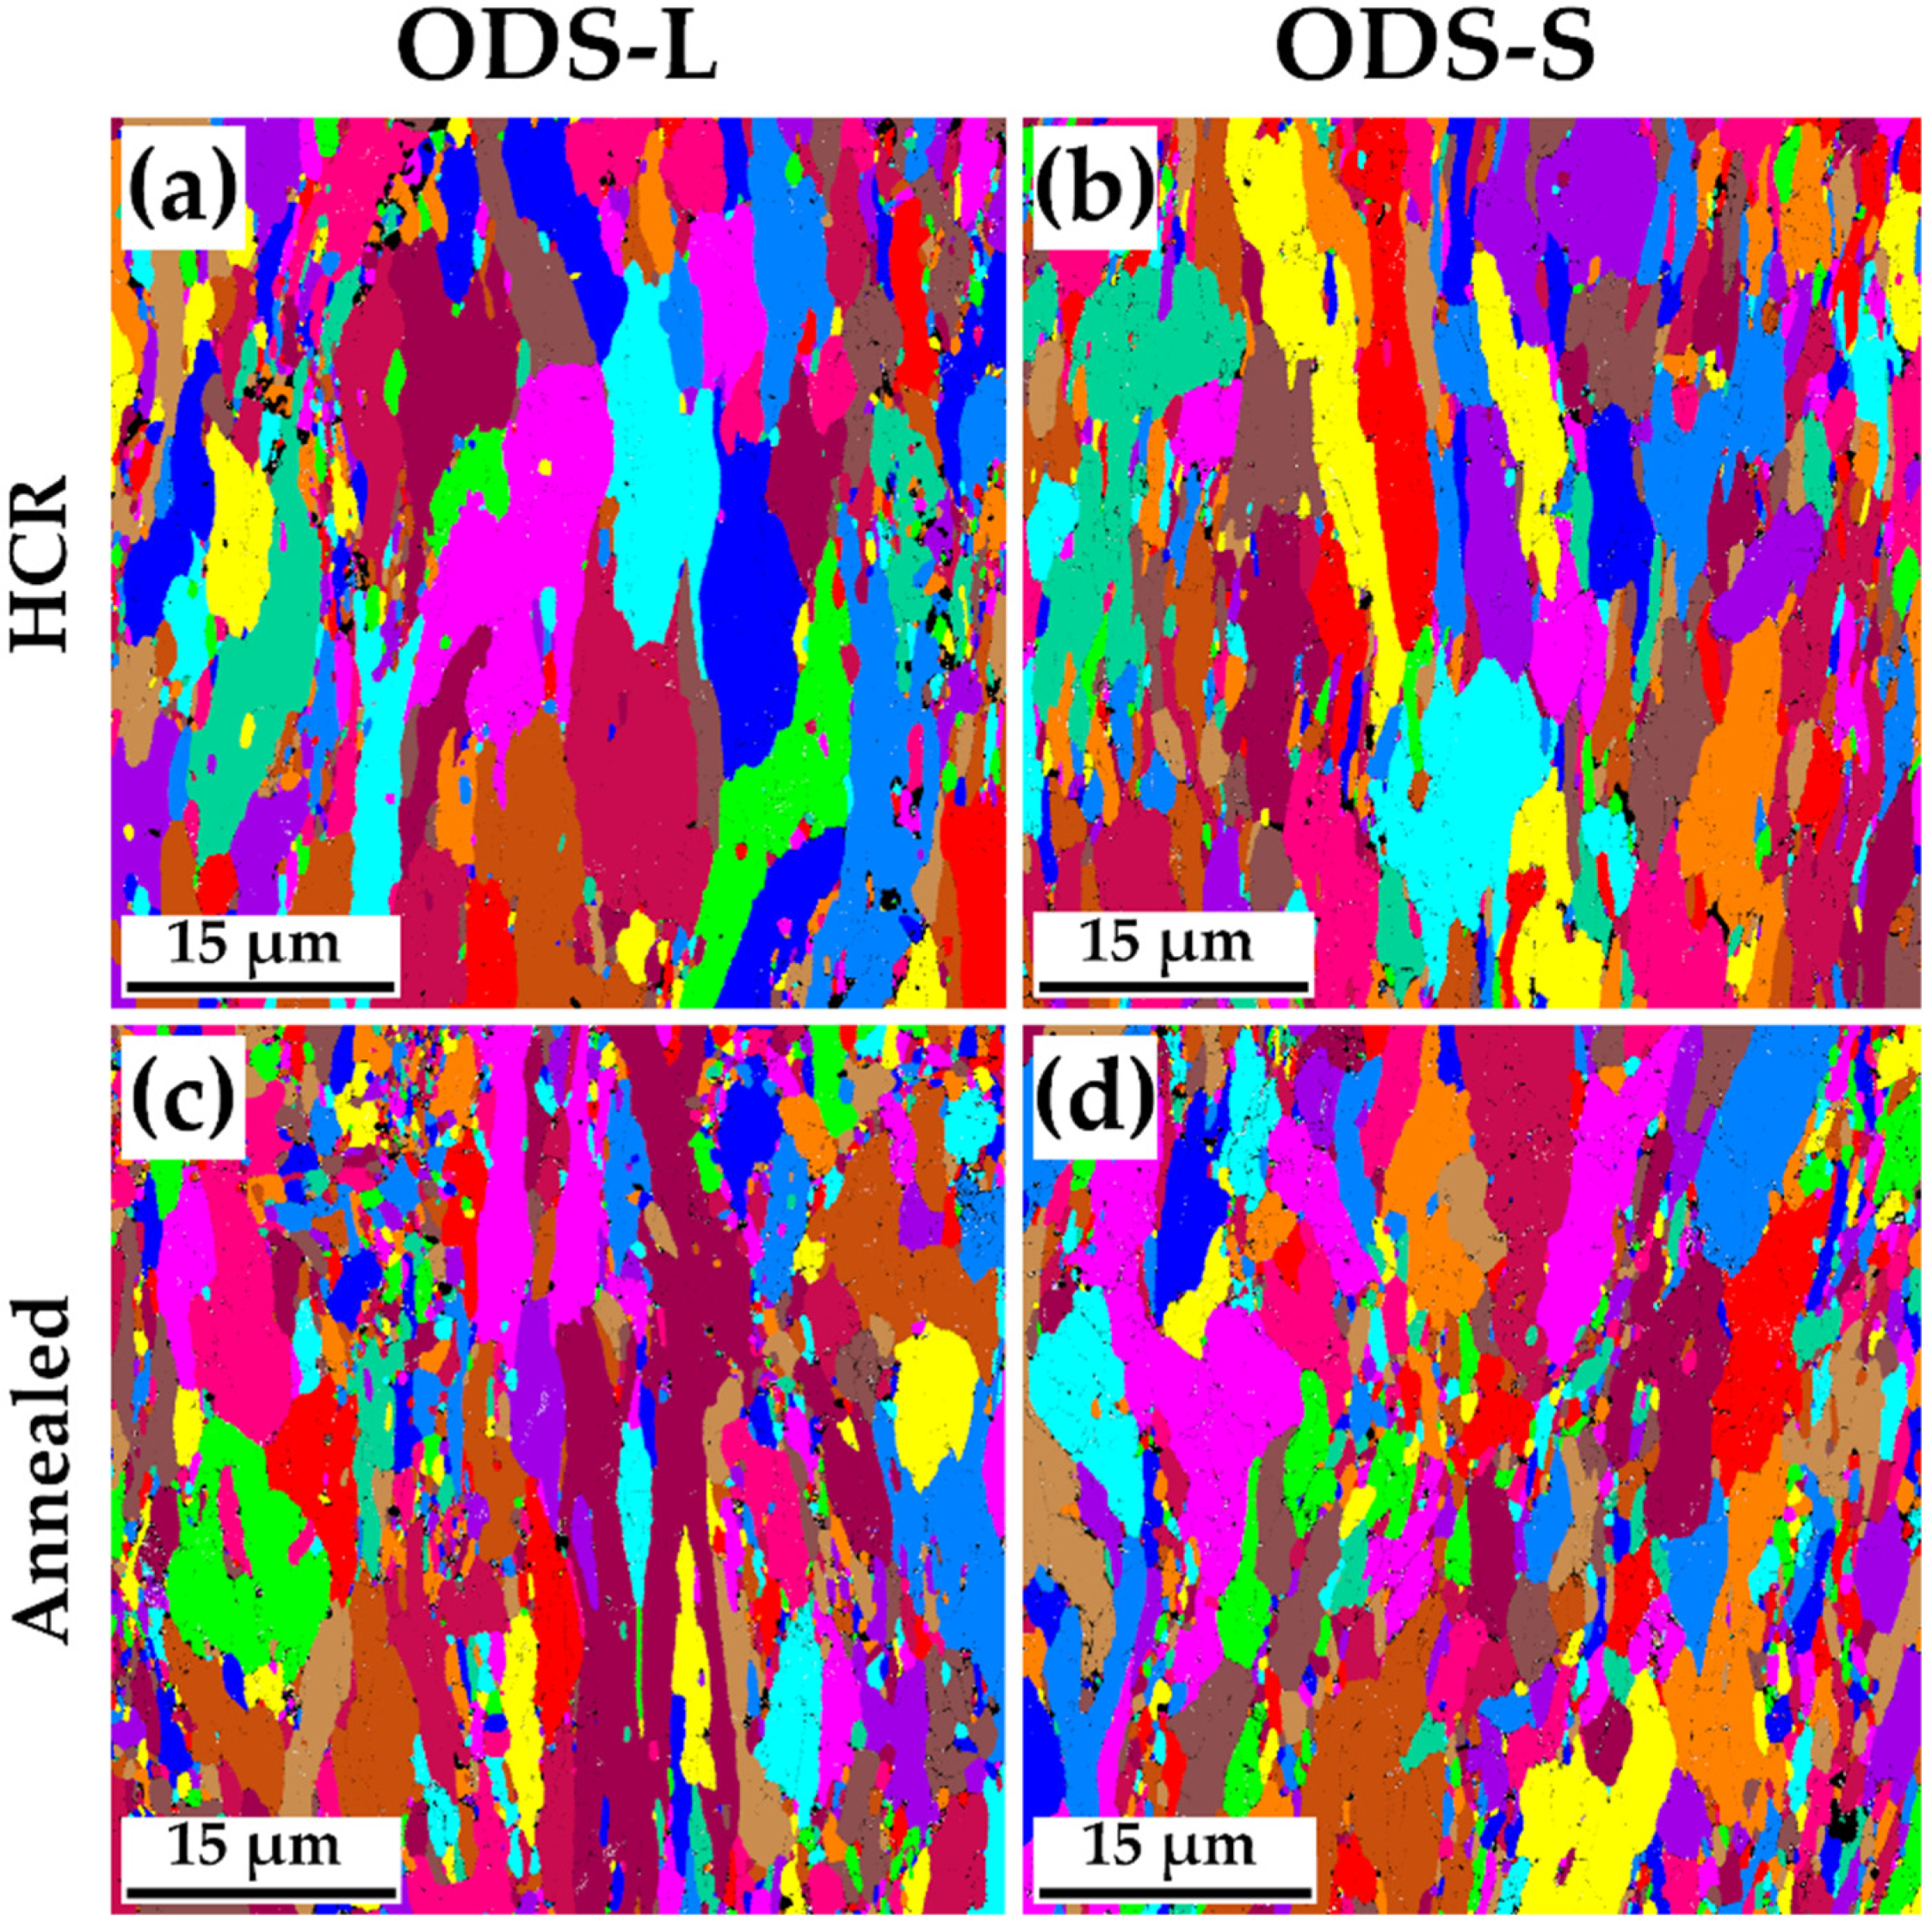
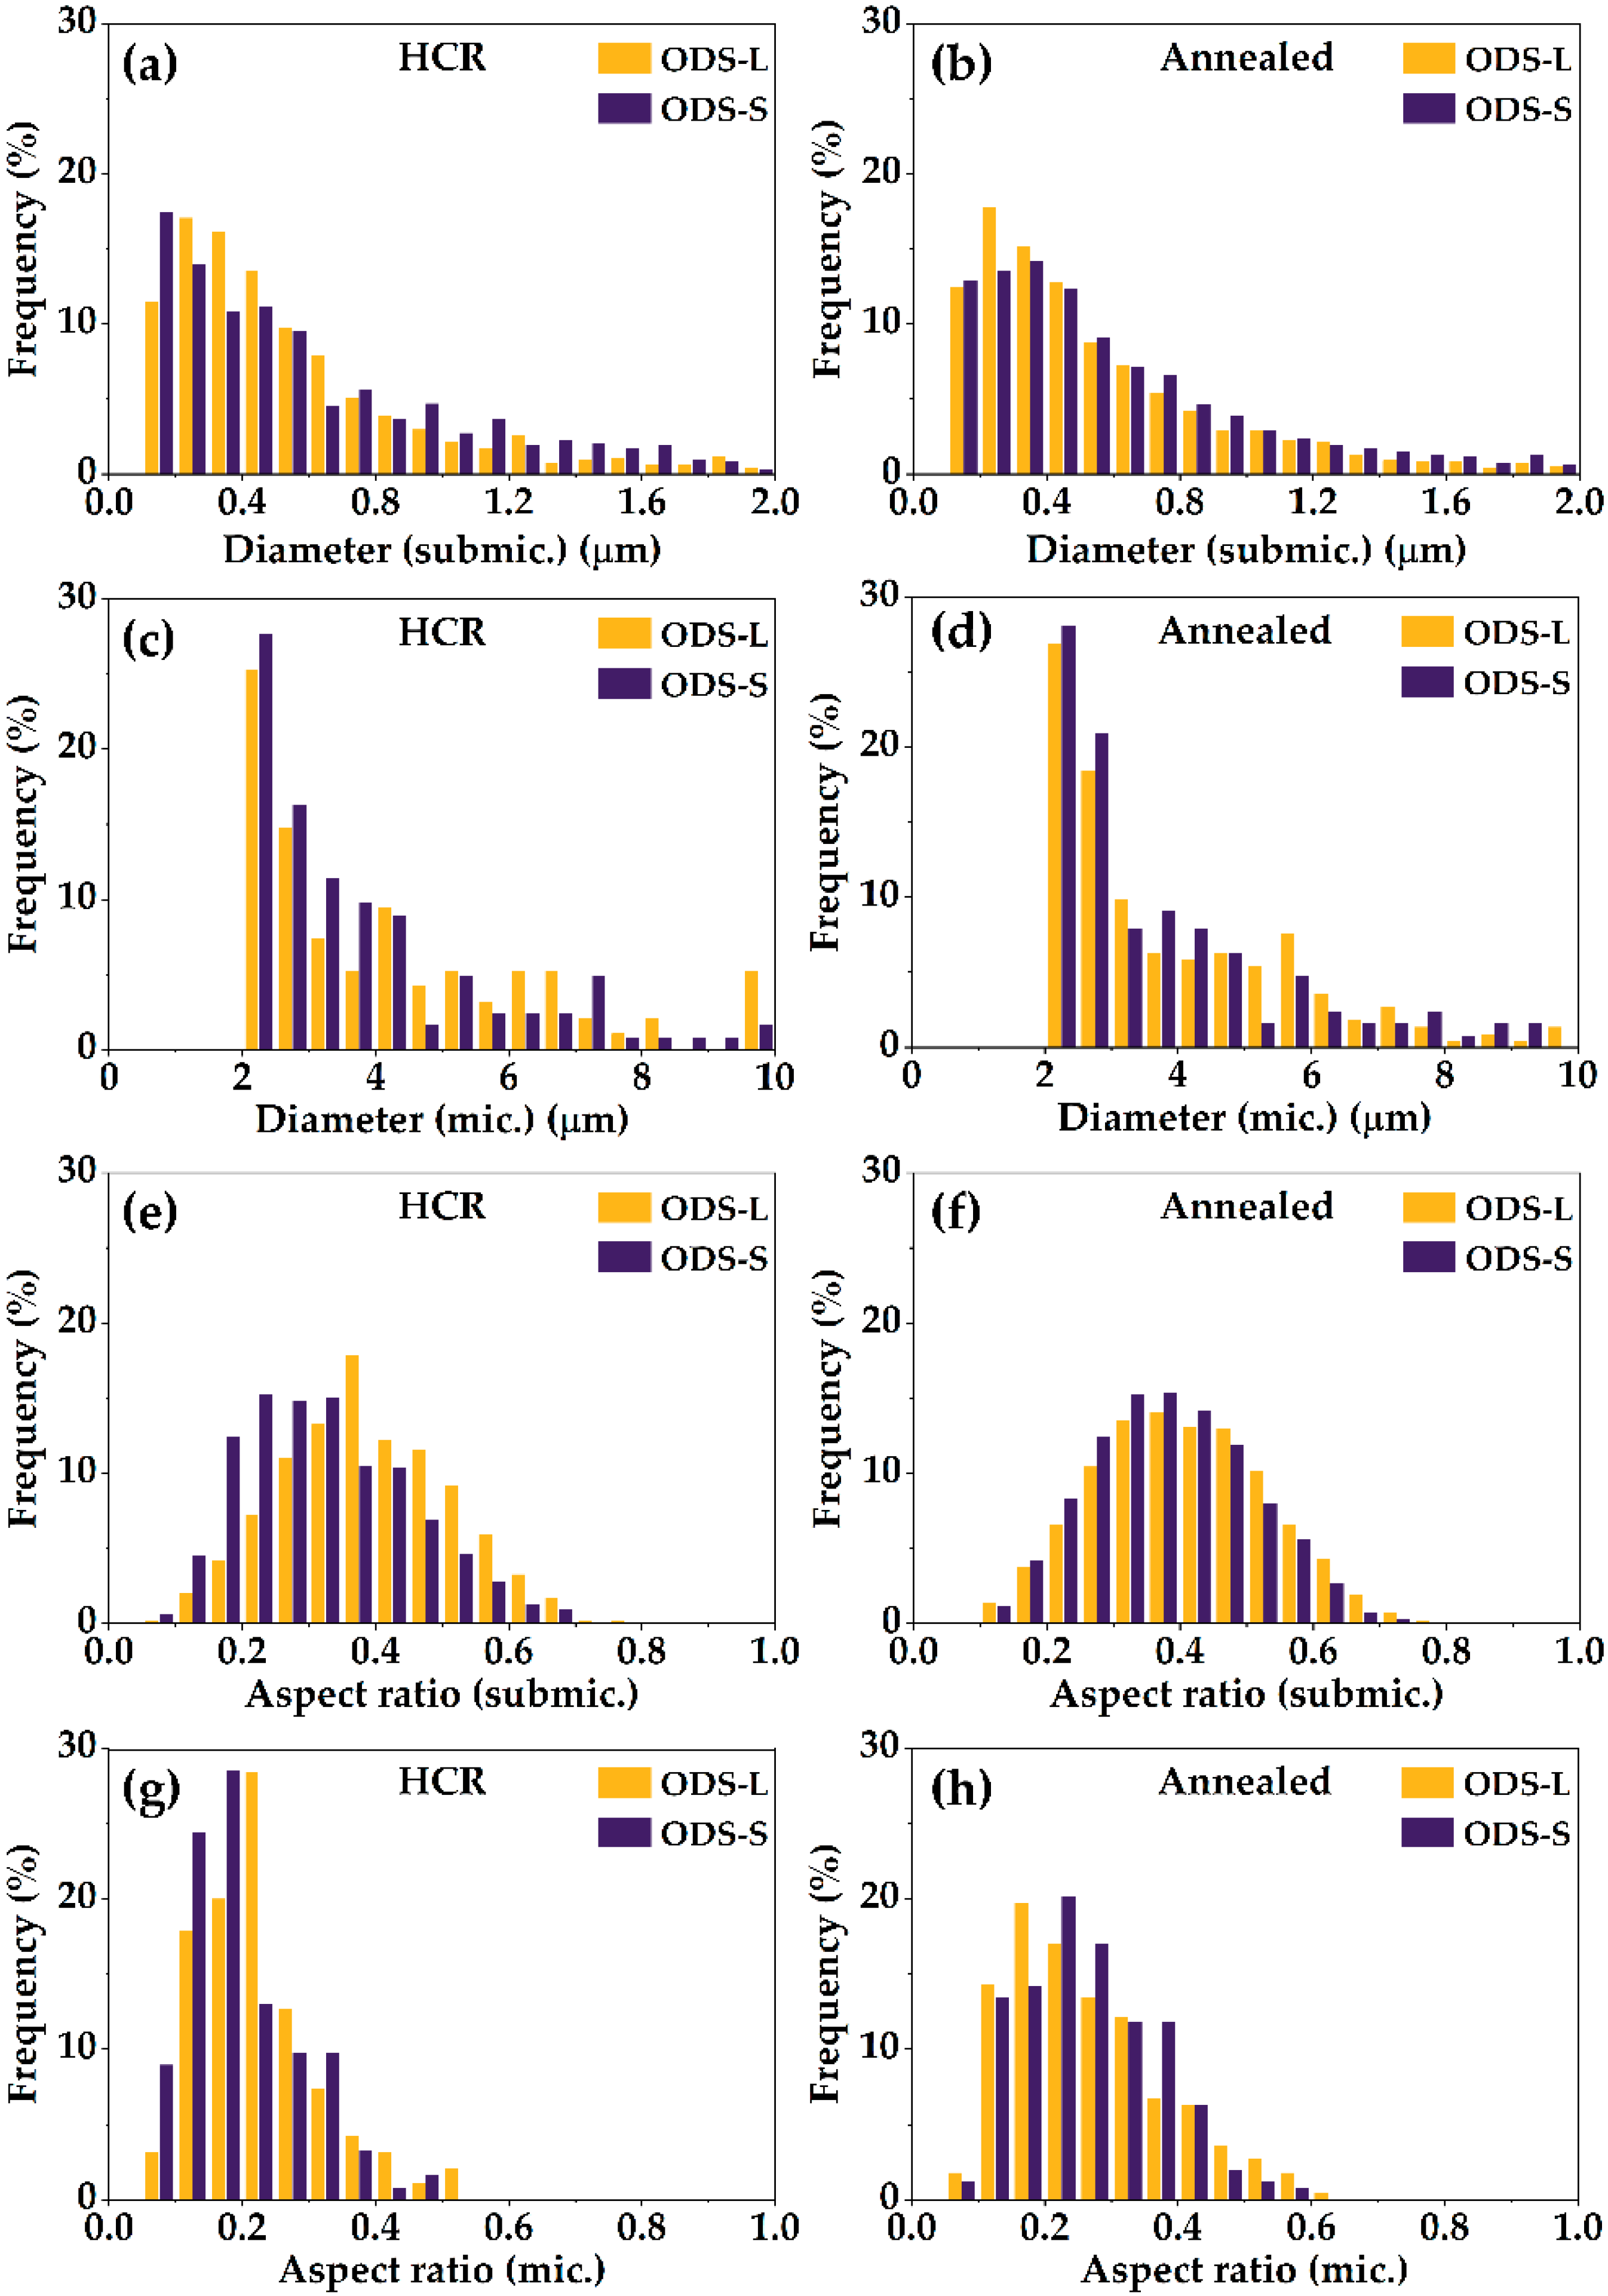
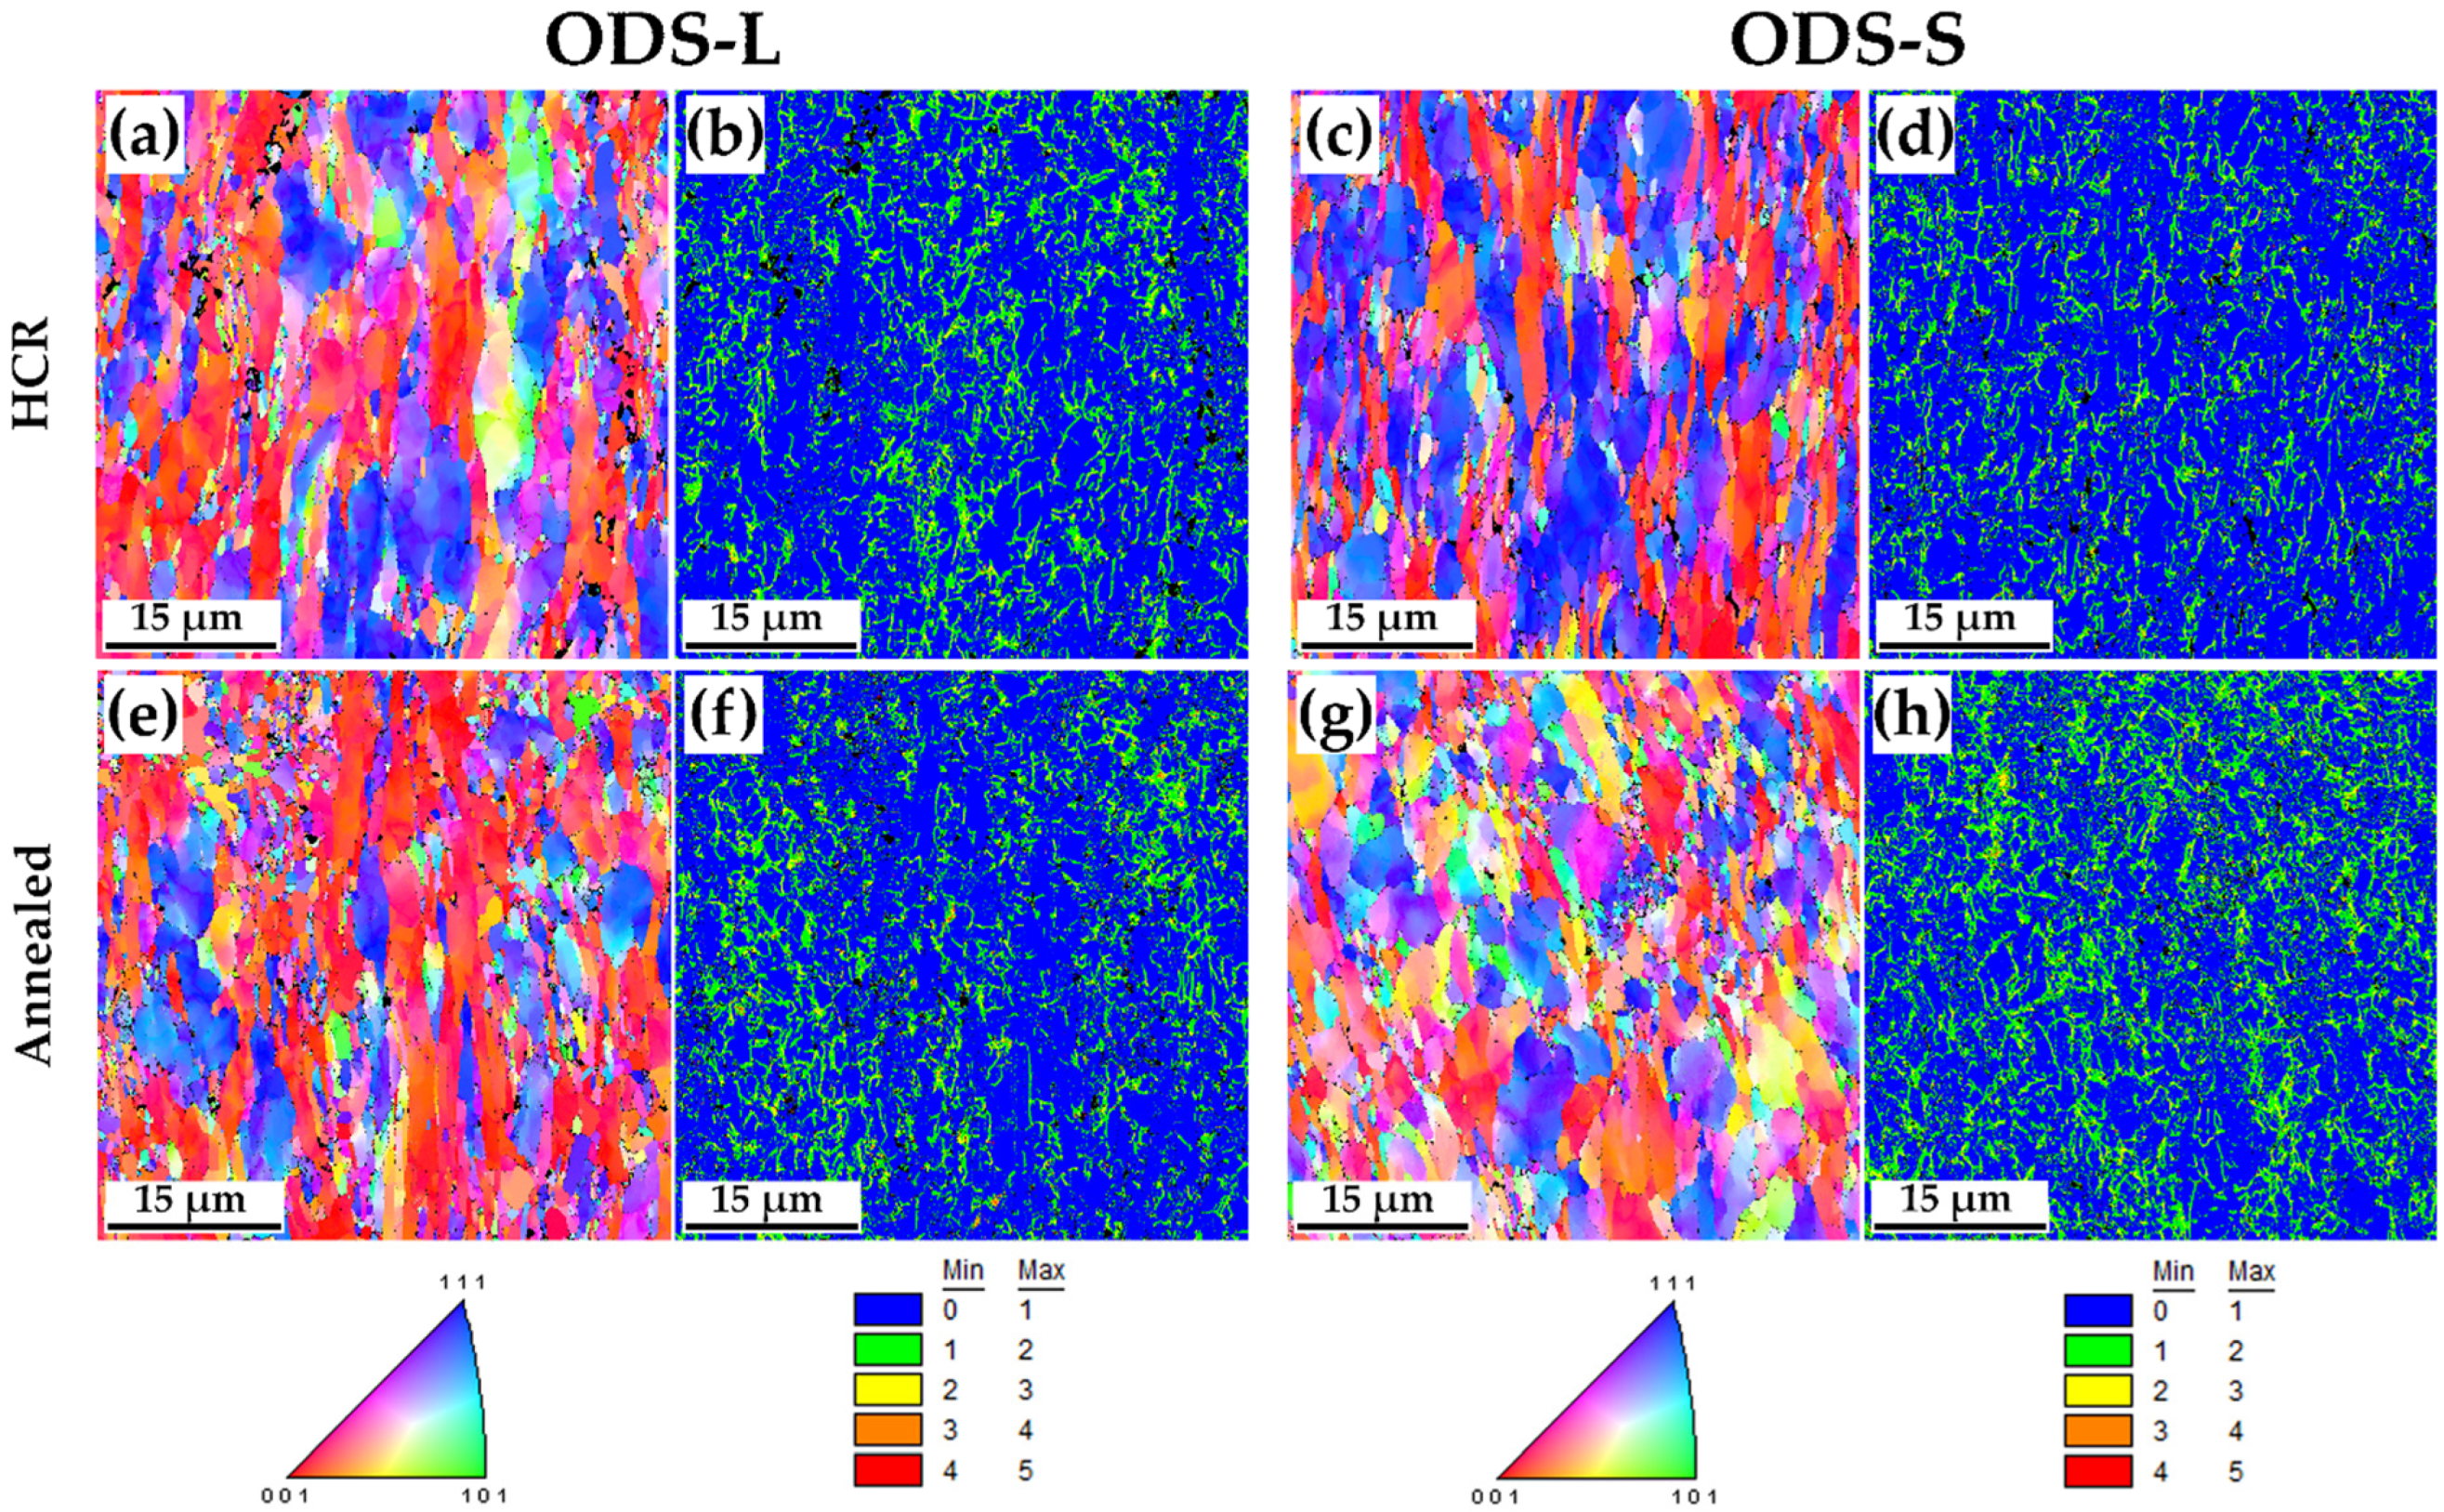
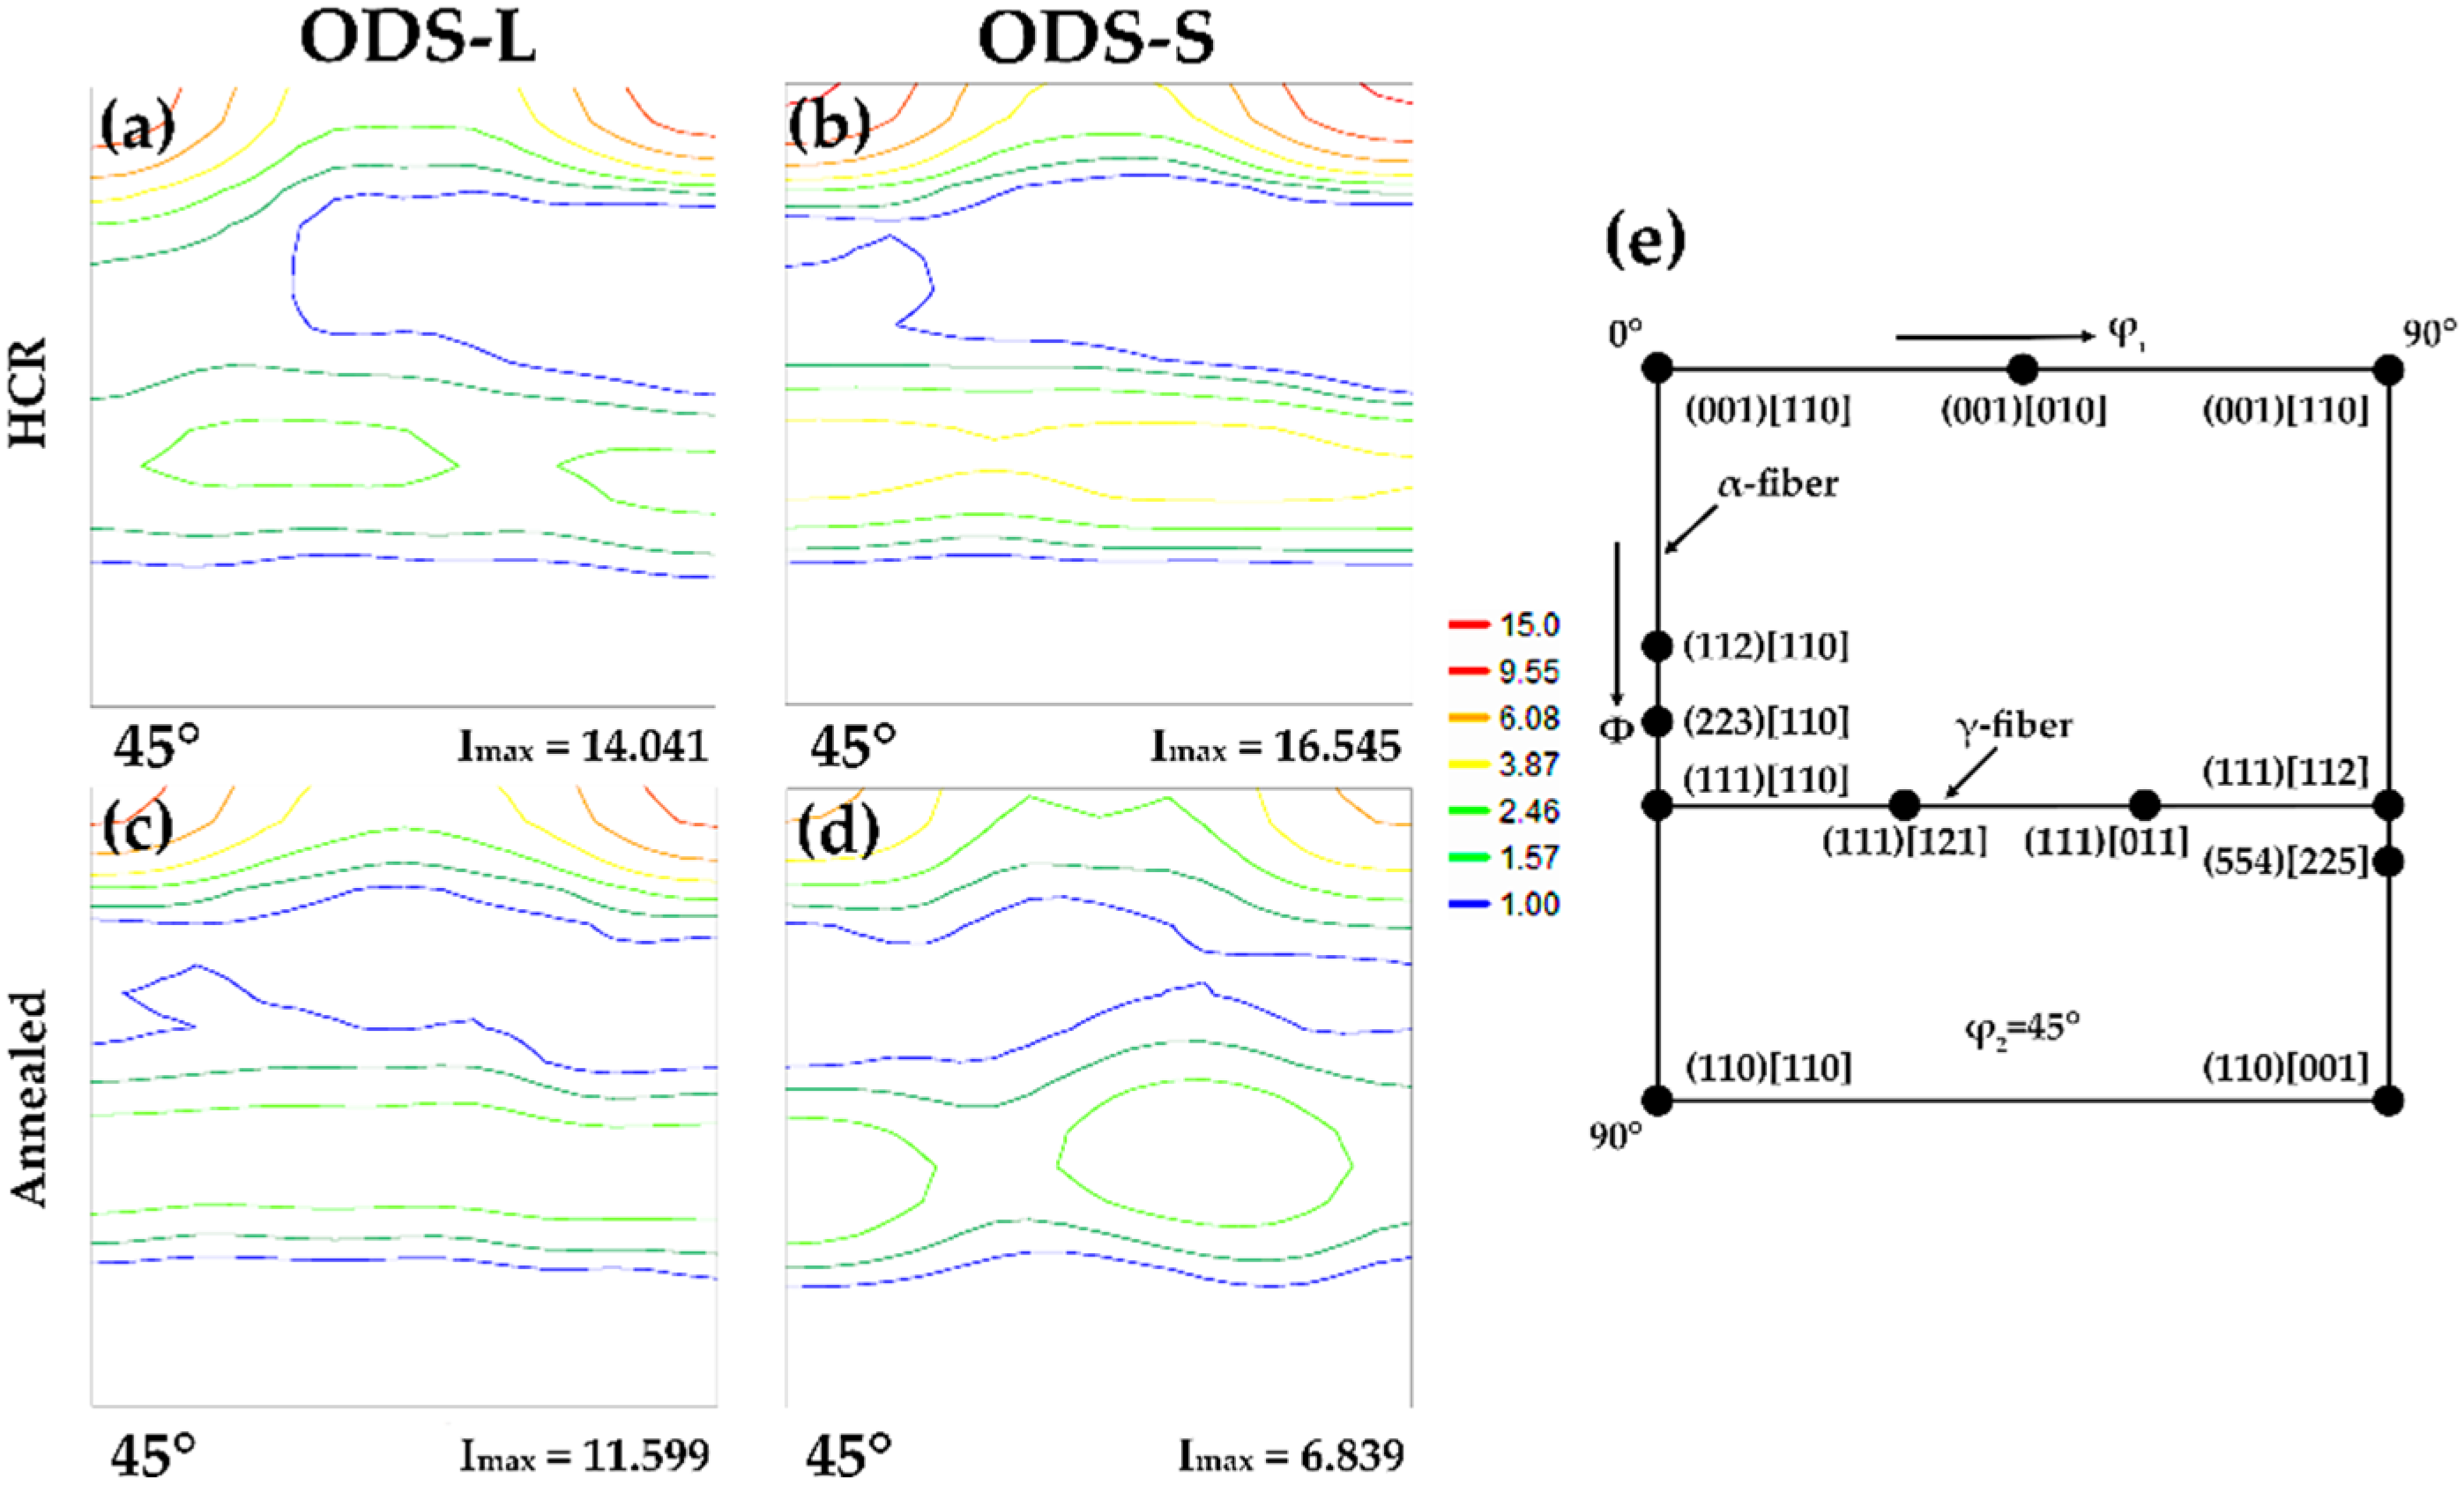
3.2. Grain Microstructure

Once sintered, the microstructure and secondary phases of the steels following HCR as well as after the subsequent annealing at 1273 K have been investigated. Both consolidated steels were fully dense; the density of the ODS-L steel after processing was 7.803 ± 0.007 g/cm3 (99.78% of theoretical density [11], while the measured density for the ODS-S steel was 7.816 ± 0.005 g/cm3 (relative density 99.95%).
SEM images of the rolled steels before and after annealing are shown in Figure 3 and Figure 4. The grain microstructure can be observed as well as some precipitates. As seen in Figure 4, no prior particle boundaries can be distinguished for any condition or material. The black circles in the images correspond to holes from which precipitates have fallen due to preferential etching during the electropolishing. As it can be seen in Figure 3a,b, the HCR process caused a homogeneous microstructure on the TS plane for both ODS-L and ODS-S steels, characterized by regions of elongated grains sized up to 4 µm and 0.2 aspect ratio, and equiaxed grains. Figure 5 shows grain size distributions measured before and after annealing. The distributions are very similar for both steels. Before annealing, the fraction of grains smaller than 0.3 µm for the ODS-S steel, 44% of the total amount of measured grains, is slightly higher than the fraction observed for the ODS-L steel (36%). After annealing, this difference disappears, as the fraction of grains smaller than 0.3 µm reduces to 32% for both ODS steel samples, indicating a slight coarsening of the smallest grains. In any case, the mean grain size stayed stable at 0.4 ± 0.2 µm for both ODS steel samples. Bimodal grain microstructures are very common in ODS steels obtained with similar mechanical alloying routes, at least in the as-HIP state. Although HCR reduces considerably the sizes and amount of larger grains present, more severe thermomechanical treatments would be necessary to remove them completely.
EBSD results highlight the distinctive features for anisotropic and high dislocation dense materials, characterizing texture and crystalline orientation. Unique Grain Color (UGC) maps allow to make a clear identification and quantification of grains among LAGB and HAGB. As observed from SEM results, the microstructural modifications caused by the HCR process led to a distribution of elongated micrometric grains and elongated or equiaxial submicrometric grains for both ODS-L and ODS-S steels (Figure 6). After annealing, the general microstructure remained highly stable for both samples. In general, for both samples, UGC maps do not emphasize new significant differences than the ones previously seen on SEM images (Figure 5), as it is described in Figure 7 and summarized in Table 2. For a comprehensive analysis, grain characterization is subdivided among grain diameters smaller or larger than 2 µm.
After HCR, submicrometric grains have a mean size of 0.5 ± 0.4 µm for the ODS-L steel and 0.6 ± 0.4 µm for the ODS-S steel. Besides, micrometric size grains present a mean diameter of 4 ± 3 µm and 4 ± 2 µm, respectively, for the ODS-L and ODS-S steels. The submicrometric grains also present rounder shapes than the micrometric ones based on higher aspects ratios in both ODS steel samples. After annealing, the aspect ratios increased for all grains, while the submicrometric and micrometric mean sizes stayed stable, presenting same values for both ODS steel samples. With an identical behavior, all the presented properties comparing the ODS-L and ODS-S steels smoothed the few original differences when the annealing treatment is applied on both ferritic steels at 1273 K. This highly stable behavior is related to the presence of nanoparticles in the interior of grains, as its thermal stability may make grain growth difficult, regardless of the high temperatures applied during annealing.
Figure 8 shows the crystallographic orientation maps for both steels before and after annealing. Inverse Pole Figure (IPF) and Kernel Average Misorientation (KAM) maps were obtained from EBSD measurements. Stereographic projection vertices seen in Figure 8 correspond to grains whose directions <100>, <110>, and <111> are parallel to the projection direction of the IPF (lamination direction). As a common result for both ODS-L and ODS-S steels, the thermomechanical HCR process induced two preferential crystallographic orientations in the material: <001> and <111>. This effect was previously reported on similar ODS steels after HCR [20]. The subsequent annealing treatment on the ODS-L steel minimized the extension of the few grains with preferential orientation other than the ones associated to the HCR (Figure 8a,e). On the ODS-S steel, annealing at 1273 K resulted in a partial loss of the preferential directions previously induced through the HCR process (Figure 8c,g). The analogous KAM figures represent the recrystallization states of the ferrite, with the blue color associated to totally recrystallized grains and the red color to non-recrystallized grains. Generally, on both ODS-L and ODS-S steels after HCR, the partially recrystallized regions are homogeneously distributed all over the material, often segregated to small grain size areas. Annealing at 1273 K can be particularly associated to the ODS-S steel with a reduction of the total recrystallized areas (Figure 8d in blue) in favor of partially recrystallized ones with values equal to 2 (Figure 8h in green).
ODF maps describe the lamination and recrystallization texture for steels in terms of the fiber orientations in the Euler space (Figure 9). Principal bcc steel fibers are α and γ: α fibers are oriented from {001} <110> to {111} <110> along <110>//(L, T), and γ fibers are oriented from {111} <110> to {111} <112> along <111>//S [21,22]. As described in Figure 9, TS plane on the ODS-L steel after HCR presents the common fibers for bcc-laminated steels with a strong <110>//T texture, which corresponds to the α fiber with its maximum intensity at {001} <110> and secondary components close to {111} <110> and {111} <011> related to the γ fiber (previously reported on similar steels [20,22]). These results are in well accordance with the IPF maps, as these last showed the two preferential orientations. This texture is mainly defined by the micrometric grains since submicron sized grains do not present any preferential orientation, which is represented with a wide range of colors in IPF maps. On the ODS-L steel as well, the thermal treatment at 1273 K caused a reduction of the maximum intensity for both α and γ fibers, from 14.041 to 11.599. Identical results were obtained for the ODS-S steel, with the same preferential orientation for α and γ fibers, while a deeper reduction of maximum intensities from 16.545 to 6.839 was observed.

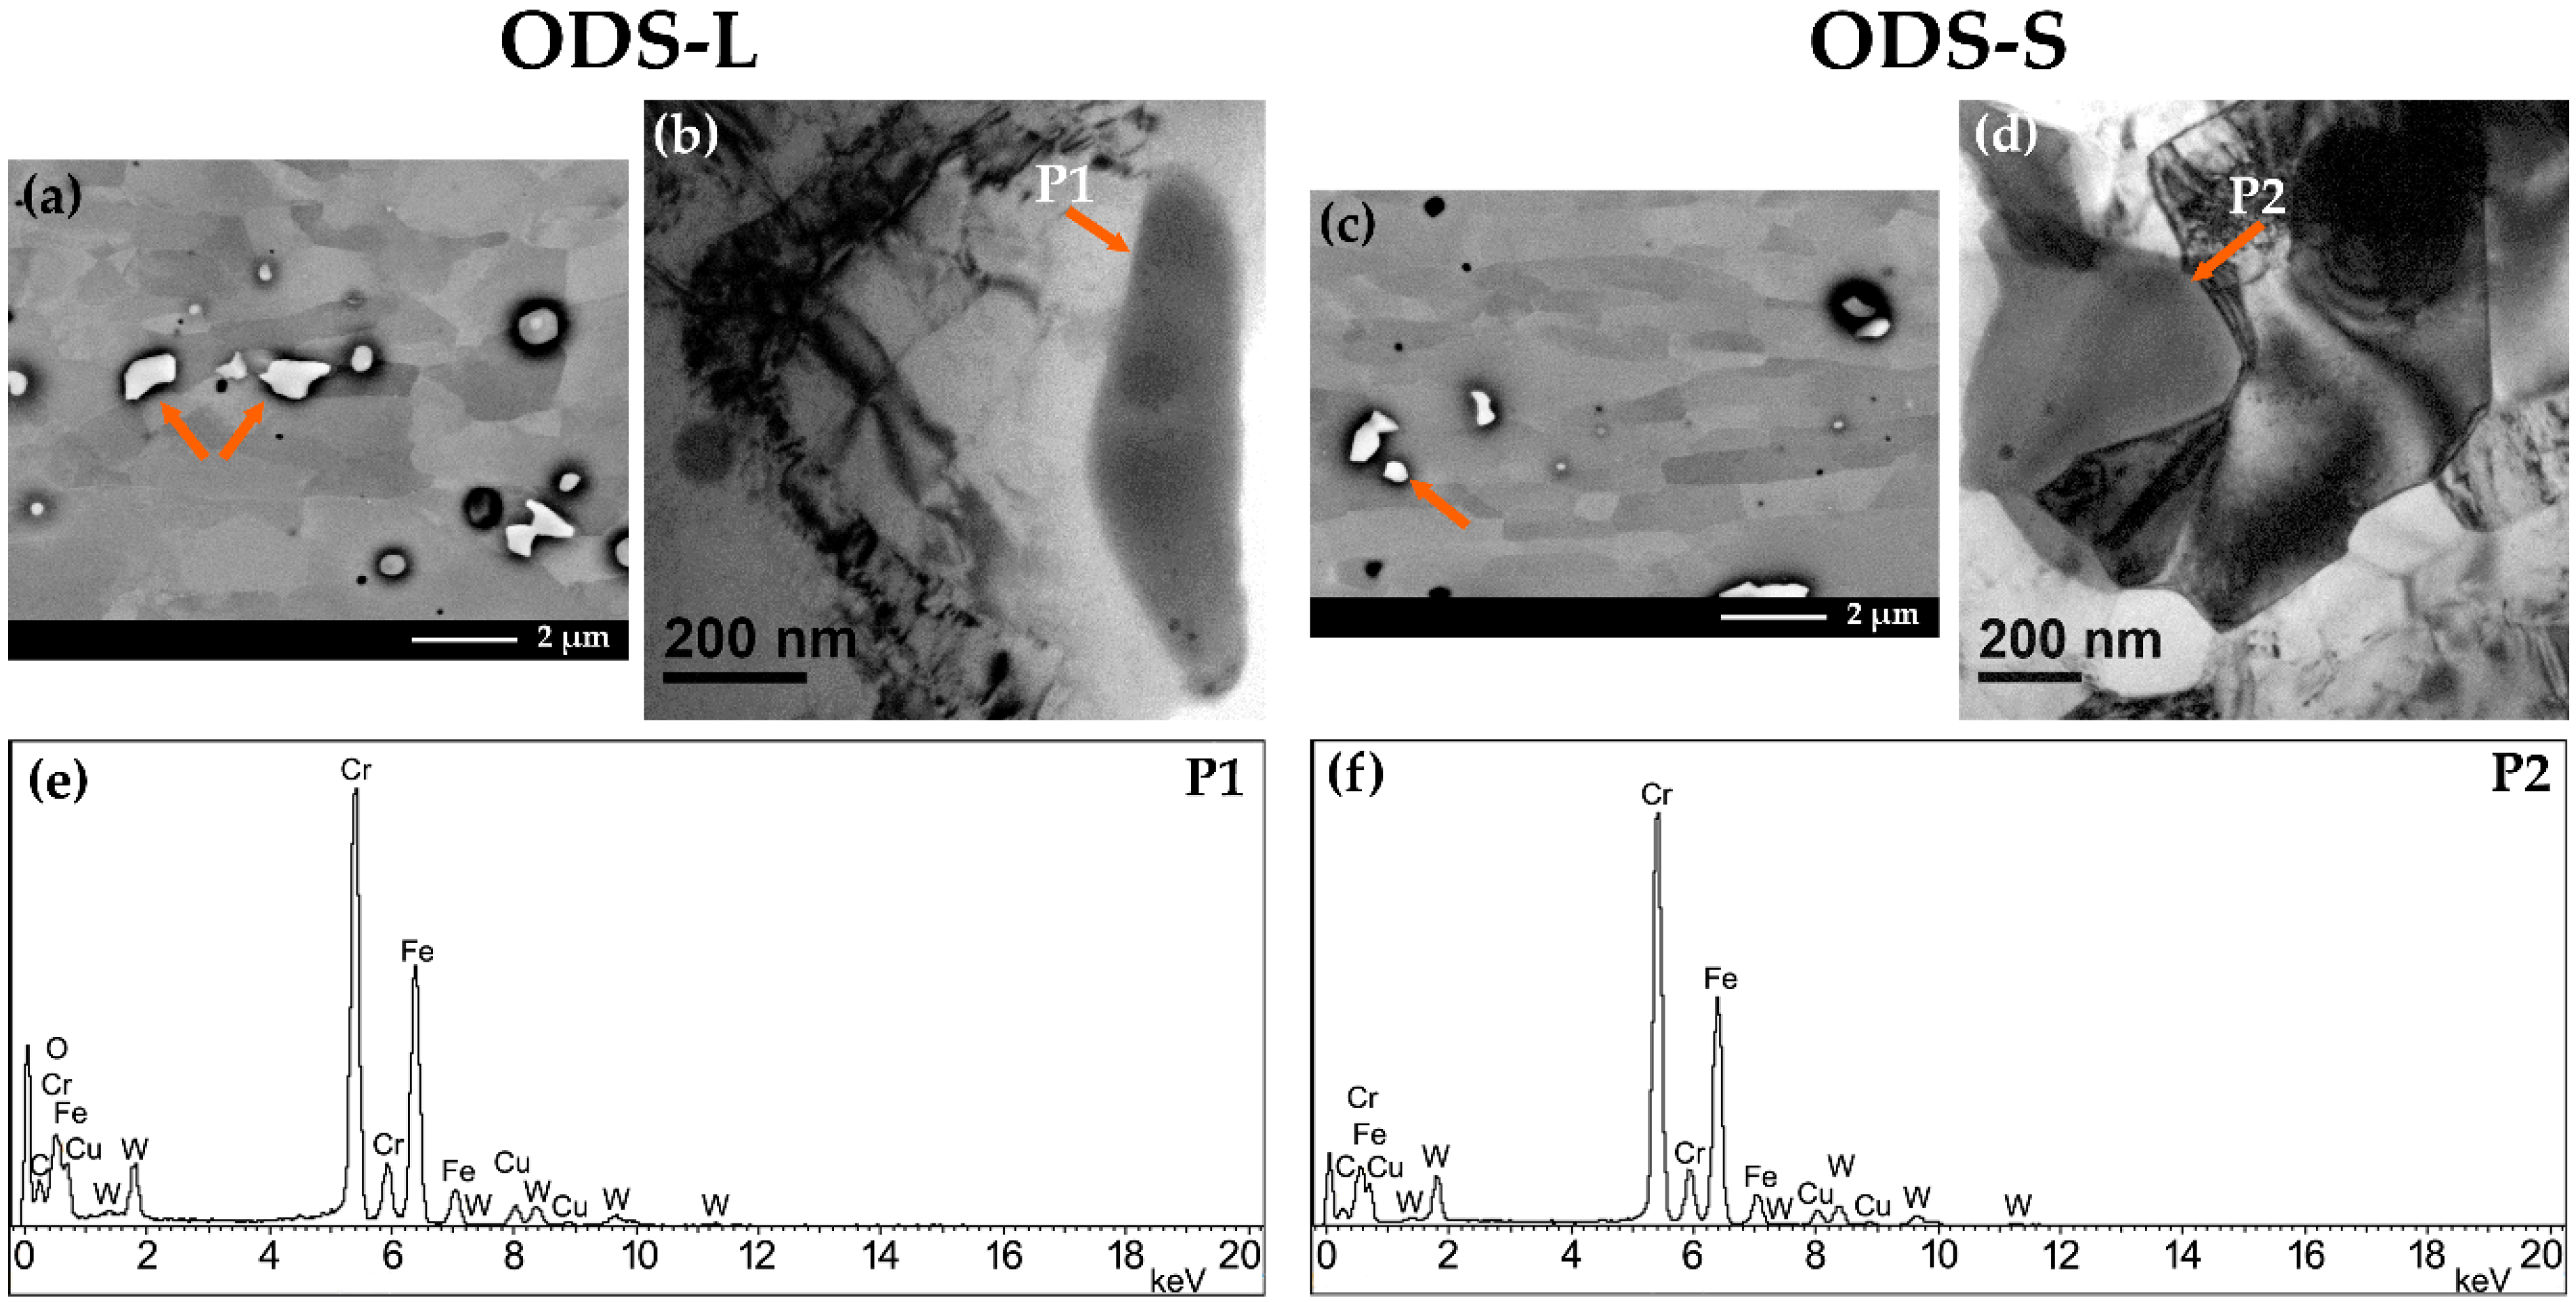
3.3. Secondary Phases

The secondary phases of the ODS-L and ODS-S steels annealed at 1273 K after HCR were characterized by TEM, focusing on chemical composition, size, and morphological differences. XEDS semi-quantitative analysis performed in both steels allowed identifying, according to their chemical composition, the three types of secondary phases already reported for the ODS-L steel after different thermal treatments [14]: Cr-W-rich precipitates (Figure 10), Ti-rich precipitates (Figure 11), and Y-Ti-O-rich nanoparticles (Figure 12).
Cr-W-rich precipitates on ODS-L after annealing presented irregular morphologies with sizes between ~0.1 and 2 µm (Figure 10a). A BF-TEM image and the corresponding XEDS identification are presented in Figure 10b,e. Regarding the ODS-S steel, the Cr-W-rich precipitates maintained the same morphology and dimensions (Figure 10c,d). On comparison, ODS steels annealed after hot rolling or forging the crystalline structure of precipitates with similar chemical composition allowed to identify these precipitates as M23C6-type carbides (M = Cr, W, Fe) [23,24].
In both ODS-L and ODS-S after annealing, Ti-rich secondary phases are characterized by a round morphology (Figure 11), with sizes oscillating between ~20 and 300 nm. They are preferentially distributed surrounding grain boundaries but can also be found in grain interiors with sizes smaller than 50 nm. The mean sizes of these precipitates are 120 ± 70 nm and 90 ± 50 nm, respectively for the ODS-L and ODS-S steels. Their crystalline structure was determined from HREM micrographs, with this secondary phase identified as the Ti2CrO7 oxide (Figure 13a). On similar ODS steels, Ti-rich oxides were also identified as Ti2CrO7 [11].
Y-Ti-O nanoparticles were analyzed on both samples after the annealing treatment, revealing comparable results. TEM images on BF mode (Figure 12a,b) show a high amount of nanoparticles with sizes < 30 nm. Their mean size in both steels was 3 ± 4 nm, with 95% of them smaller than 5 nm. Generally, the Y-Ti-O nanodispersoids exhibited round or rectangular morphologies, and they appear homogenously distributed in the interior of grains. Particle number density measurements ranged between (0.9–5.4) × 1023 m−3 and (0.71–7) × 1023 m−3, respectively, for the ODS-L and ODS-S steels [25,26]. Several nanoparticles were indexed from HREM micrographs (Figure 13b), and most of them could be identified as Y2TiO5 (none of them were identified as Y2O3).

3.4. Mechanical Properties

Samples cut along the TS plane of the two ODS ferritic steels, annealed at 1273 K after HCR, were prepared for mechanical characterization. Tensile and Charpy impact tests were conducted at different temperature conditions.
Selected stress-strain curves, measured from tensile tests performed between room temperature (RT = 298 K) and 973 K, are summarized in Figure 14. Mechanical properties obtained from this analysis are depicted in Figure 15. Yield and ultimate tensile strengths (YS and UTS) have a similar behavior for both samples over the investigated test temperature range, decreasing continuously with temperature to 340 ± 20 and 360 ± 20 MPa for the ODS-L steel and 345 ± 6 and 358 ± 9 MPa for the ODS-S steel at 973 K.
The ODS-S steel exhibits equal or superior ductility properties than the ODS-L one, and it is more evident from 773 K and higher temperatures. The highest uniform elongation (UE) is obtained at RT for both samples (Figure 15c), their values decreasing with test temperature and total elongation (TE) values exhibiting general higher stability, except at 873 K (Figure 15d). The peak values obtained at this temperature are characteristic of ODS ferritic steels, and they have been related with a maximum in the strain rate sensitivity, coinciding with a change of the deformation mechanism, as its character turns from intragranular to intergranular for higher temperatures [25]. This phenomenon is observed in both ODS steels samples.
Both ODS steel samples followed the same processing route that resulted in similar microstructures, comparable grain sizes, and morphologies as well as with respect to secondary phases. Thus, the influence of the respective microstructure of the ODS-S and ODS-L steels on their mechanical response would be the same. The only difference that accounts for the higher mechanical response up to 773 K and the superior ductility over this temperature for the ODS-S steel could be associated to the slight increment of particle number density present on this sample and its higher content on gaseous impurities. On the other hand, the loss of mechanical resistance could be related with the drop of grain boundary strengthening, as the strengthening mechanism associated to the nanoparticle dispersion decreased in importance.
Impact toughness properties were obtained from Charpy impact tests carried out between 77 and 473 K; the experimental values obtained were fitted to sigmoidal curves (Figure 16), and the results are summarized in Table 3.
The LSE value for the ODS-S steel is 52% higher than the one for the ODS-L steel. In addition, from the absorbed energy curves, the LSE is ~10% of USE for the ODS-S steel and ~6% of USE for the ODS-L one, indicating a higher toughness of the ODS-S steel at ~100 K. The DBTT values obtained for both alloys are in the best value range reported for ODS steels [11,20,26]: 250 ± 12 K for the ODS-L steel and 230 ± 20 K for the ODS-S one (7% lower than ODS-L). This result suggests that starting with finer powder particles may have a positive effect on the DBTT of these ODS steels. However, although the transition regime at the DBTT is sharper for the ODS-S steel, its USE is slightly lower, and it presents a larger dispersion than the result obtained for the ODS-L steel. In any case, the maximum USE values measured are similar in both samples.
The ODS-S steel exhibits slightly better DBTT and LSE than the ODS-L one but a small decrease in the USE value. This behavior could be ascribed to the counterbalancing effect of the improved contact between powder particles when the particle size is decreased and the increase of impurities (mostly O and N) present in the surface of the particles. Although the prior particle boundaries are not visible anymore after the consolidation and hot cross rolling, they could still be playing a role in the impact properties observed. Further investigations, in particular fractographic studies, could help to clarify this point.

4. Conclusions

Two ODS ferritic steels with initial powder particle sizes ≲70 and ≲30 µm were investigated. With the same nominal composition, Fe-14Cr-2W-0.4Ti-0.3Y2O3 (wt. %), the two ODS steels were manufactured by mechanical alloying, compacting by hot isostatic pressing, hot cross rolling, and annealing at 1273 K. The dispersion of nano-oxide particles and the dependence of the mechanical performance on initial particle size were addressed. The main conclusions of this study are the following:
  • Initial powder particle size differences between the ODS-L and ODS-S powders diminish after mechanical alloying. Particle size analysis for both alloyed powders present a bimodal distribution, and XRD patterns confirm a severe plastic deformation.
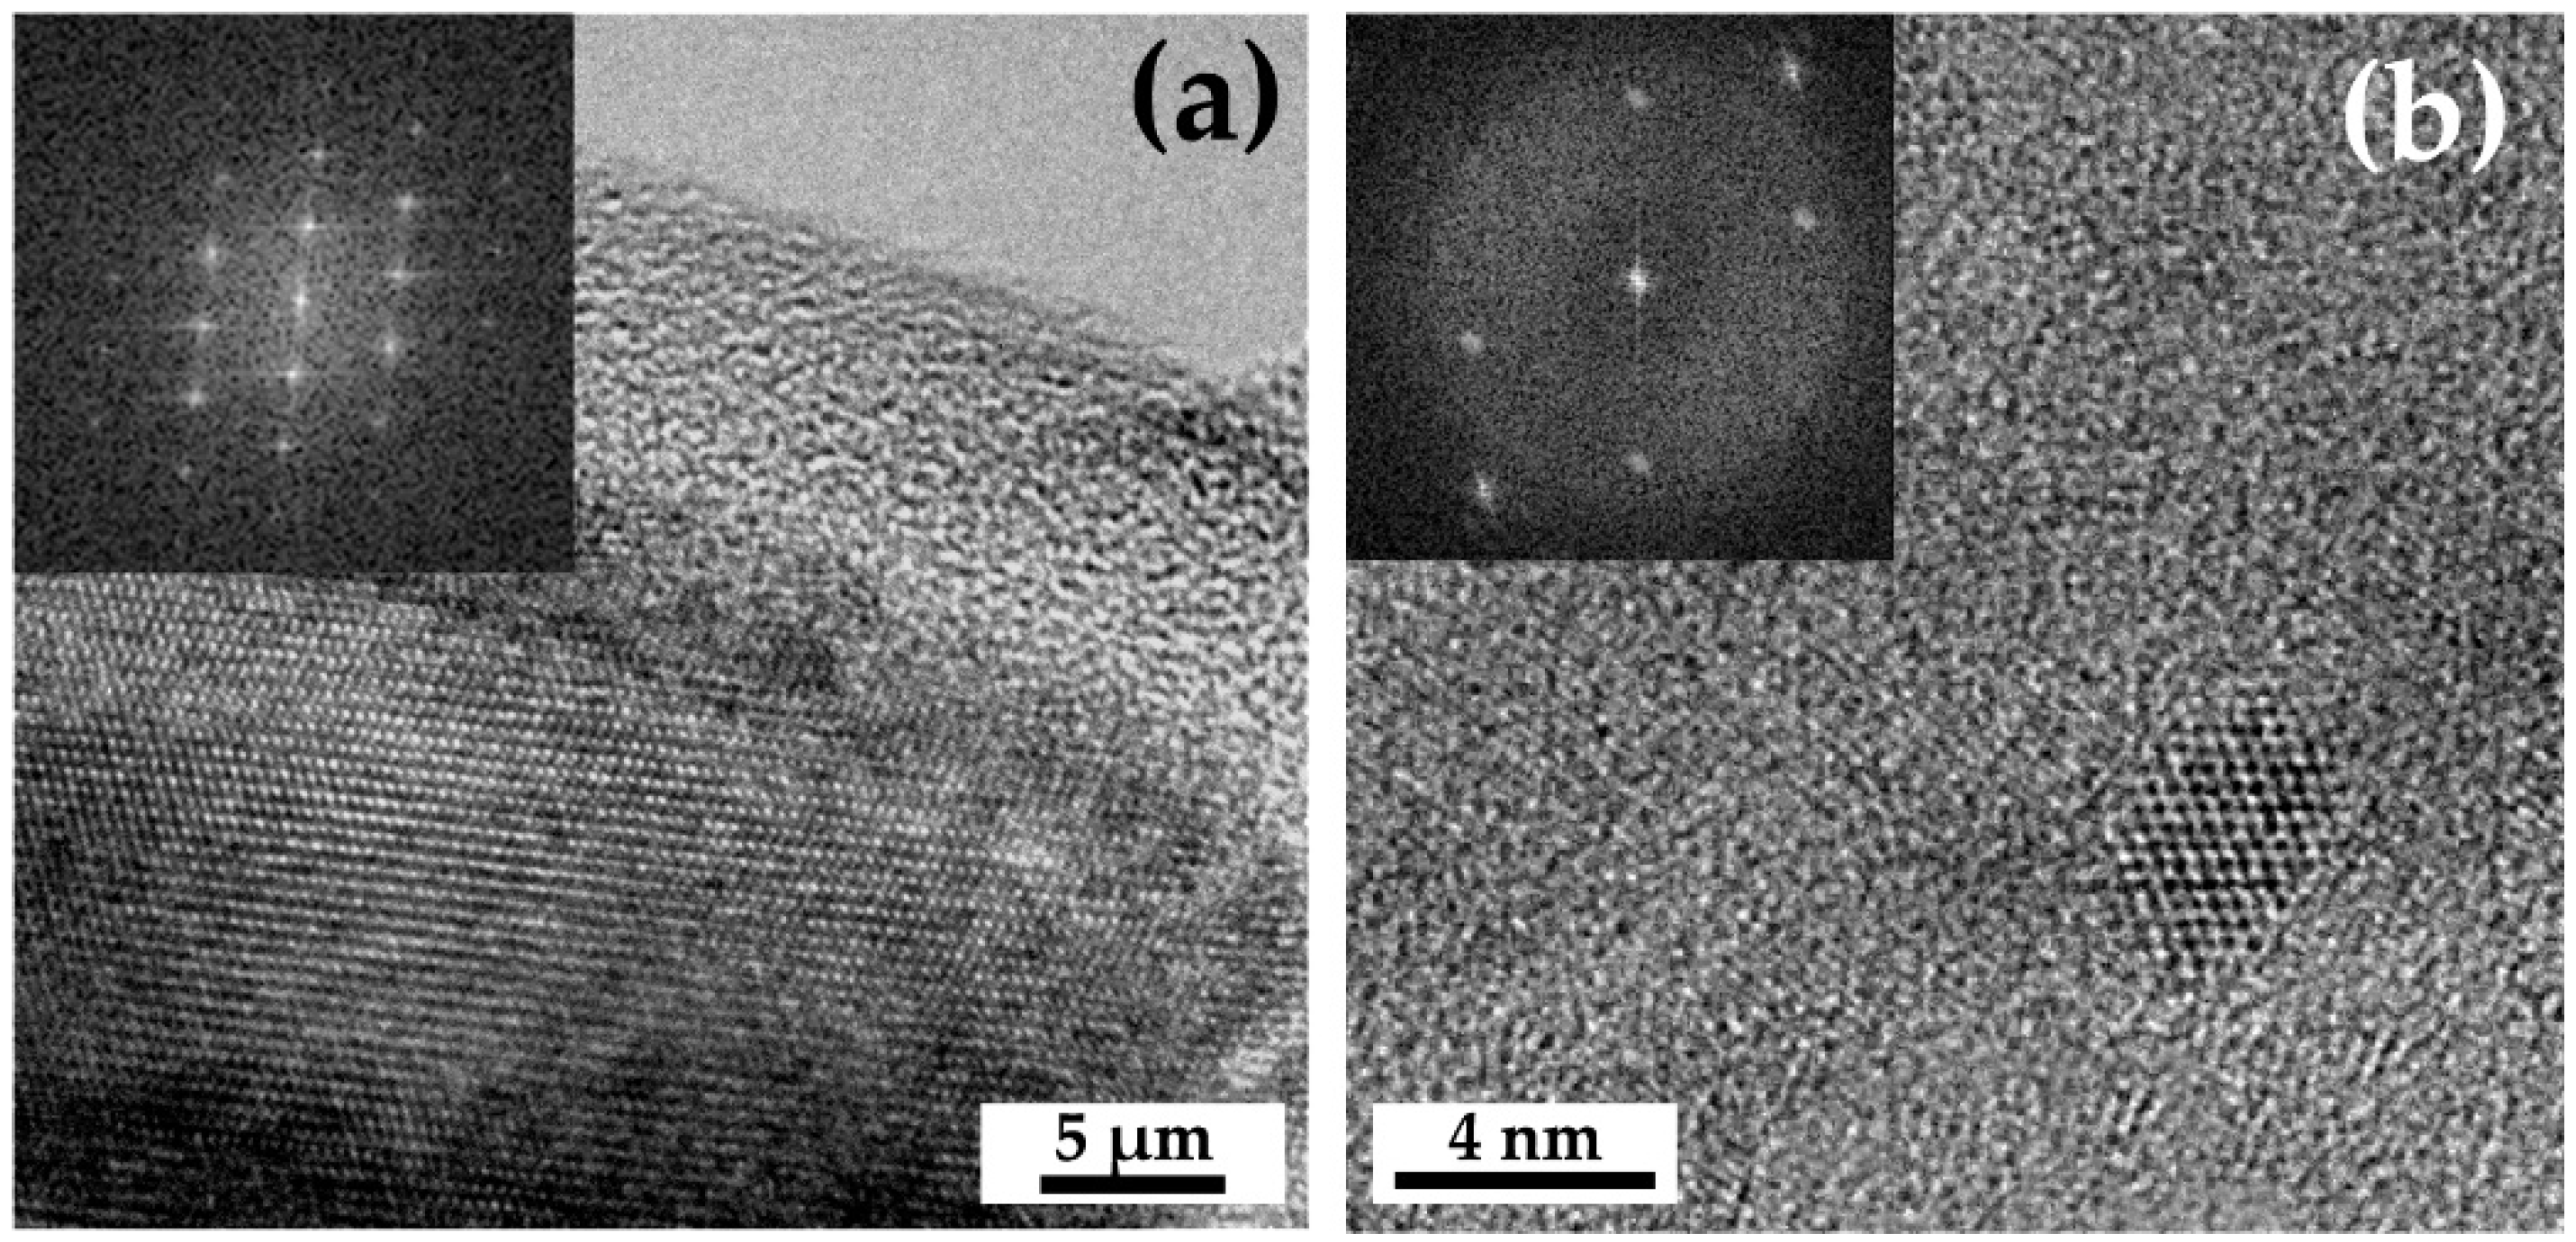
  • After HCR, the two steels present a homogeneous microstructure characterized by regions of elongated grains and equiaxed grains. EBSD maps show an almost completely recrystallized matrix with the presence of strong α and γ fibers. The annealing treatment at 1273 K does not introduce significant differences between the samples. Both steels show a fine and homogeneous dispersion of Y-Ti-rich nano-oxides, with average size ~ 3 nm. Cr-W-rich and Ti-rich precipitates are also observed presenting stable features in both steels.
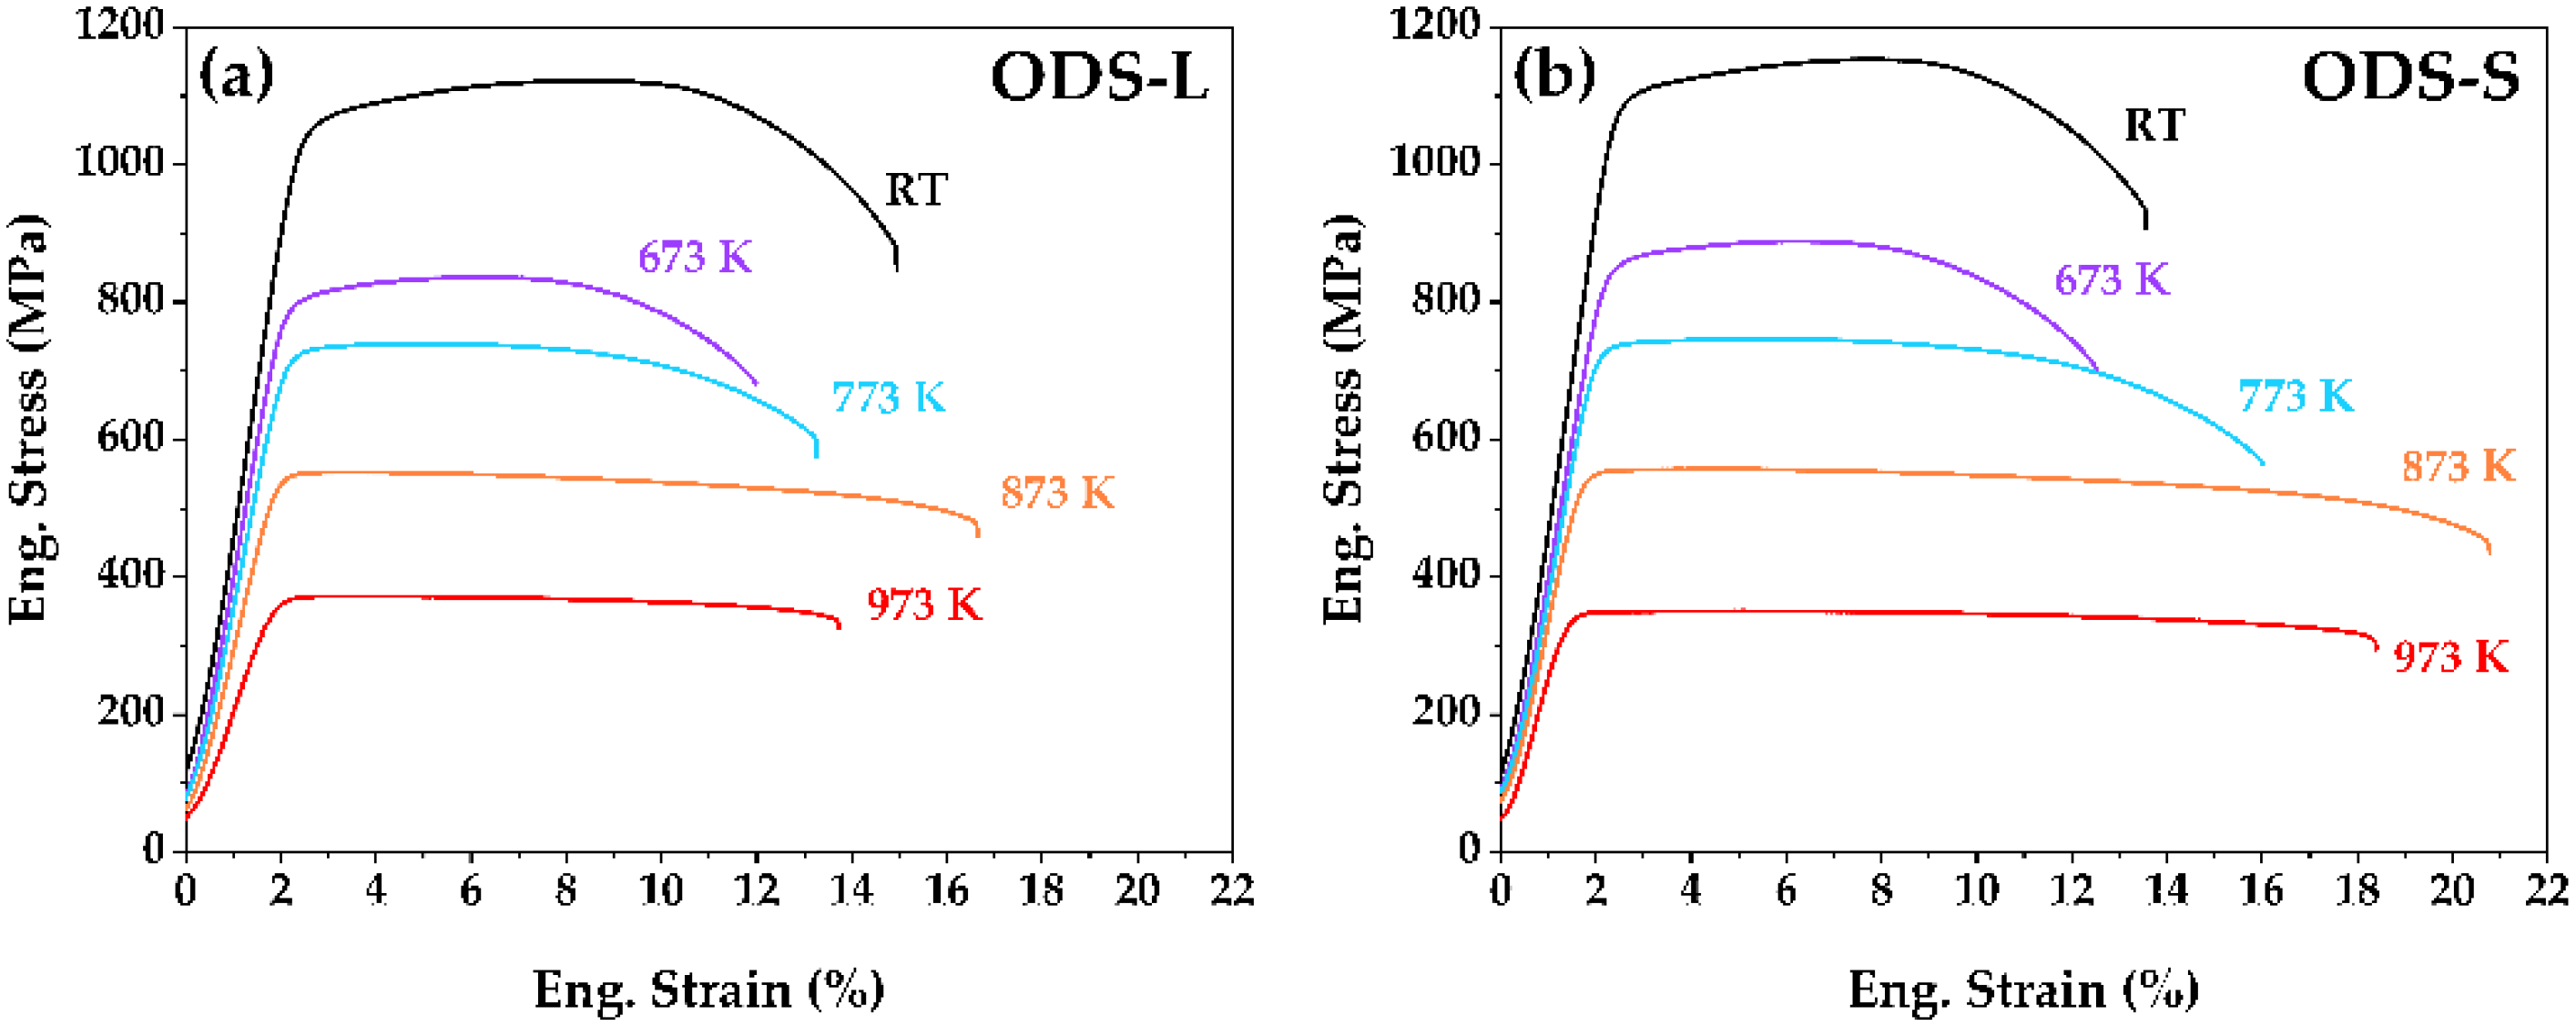
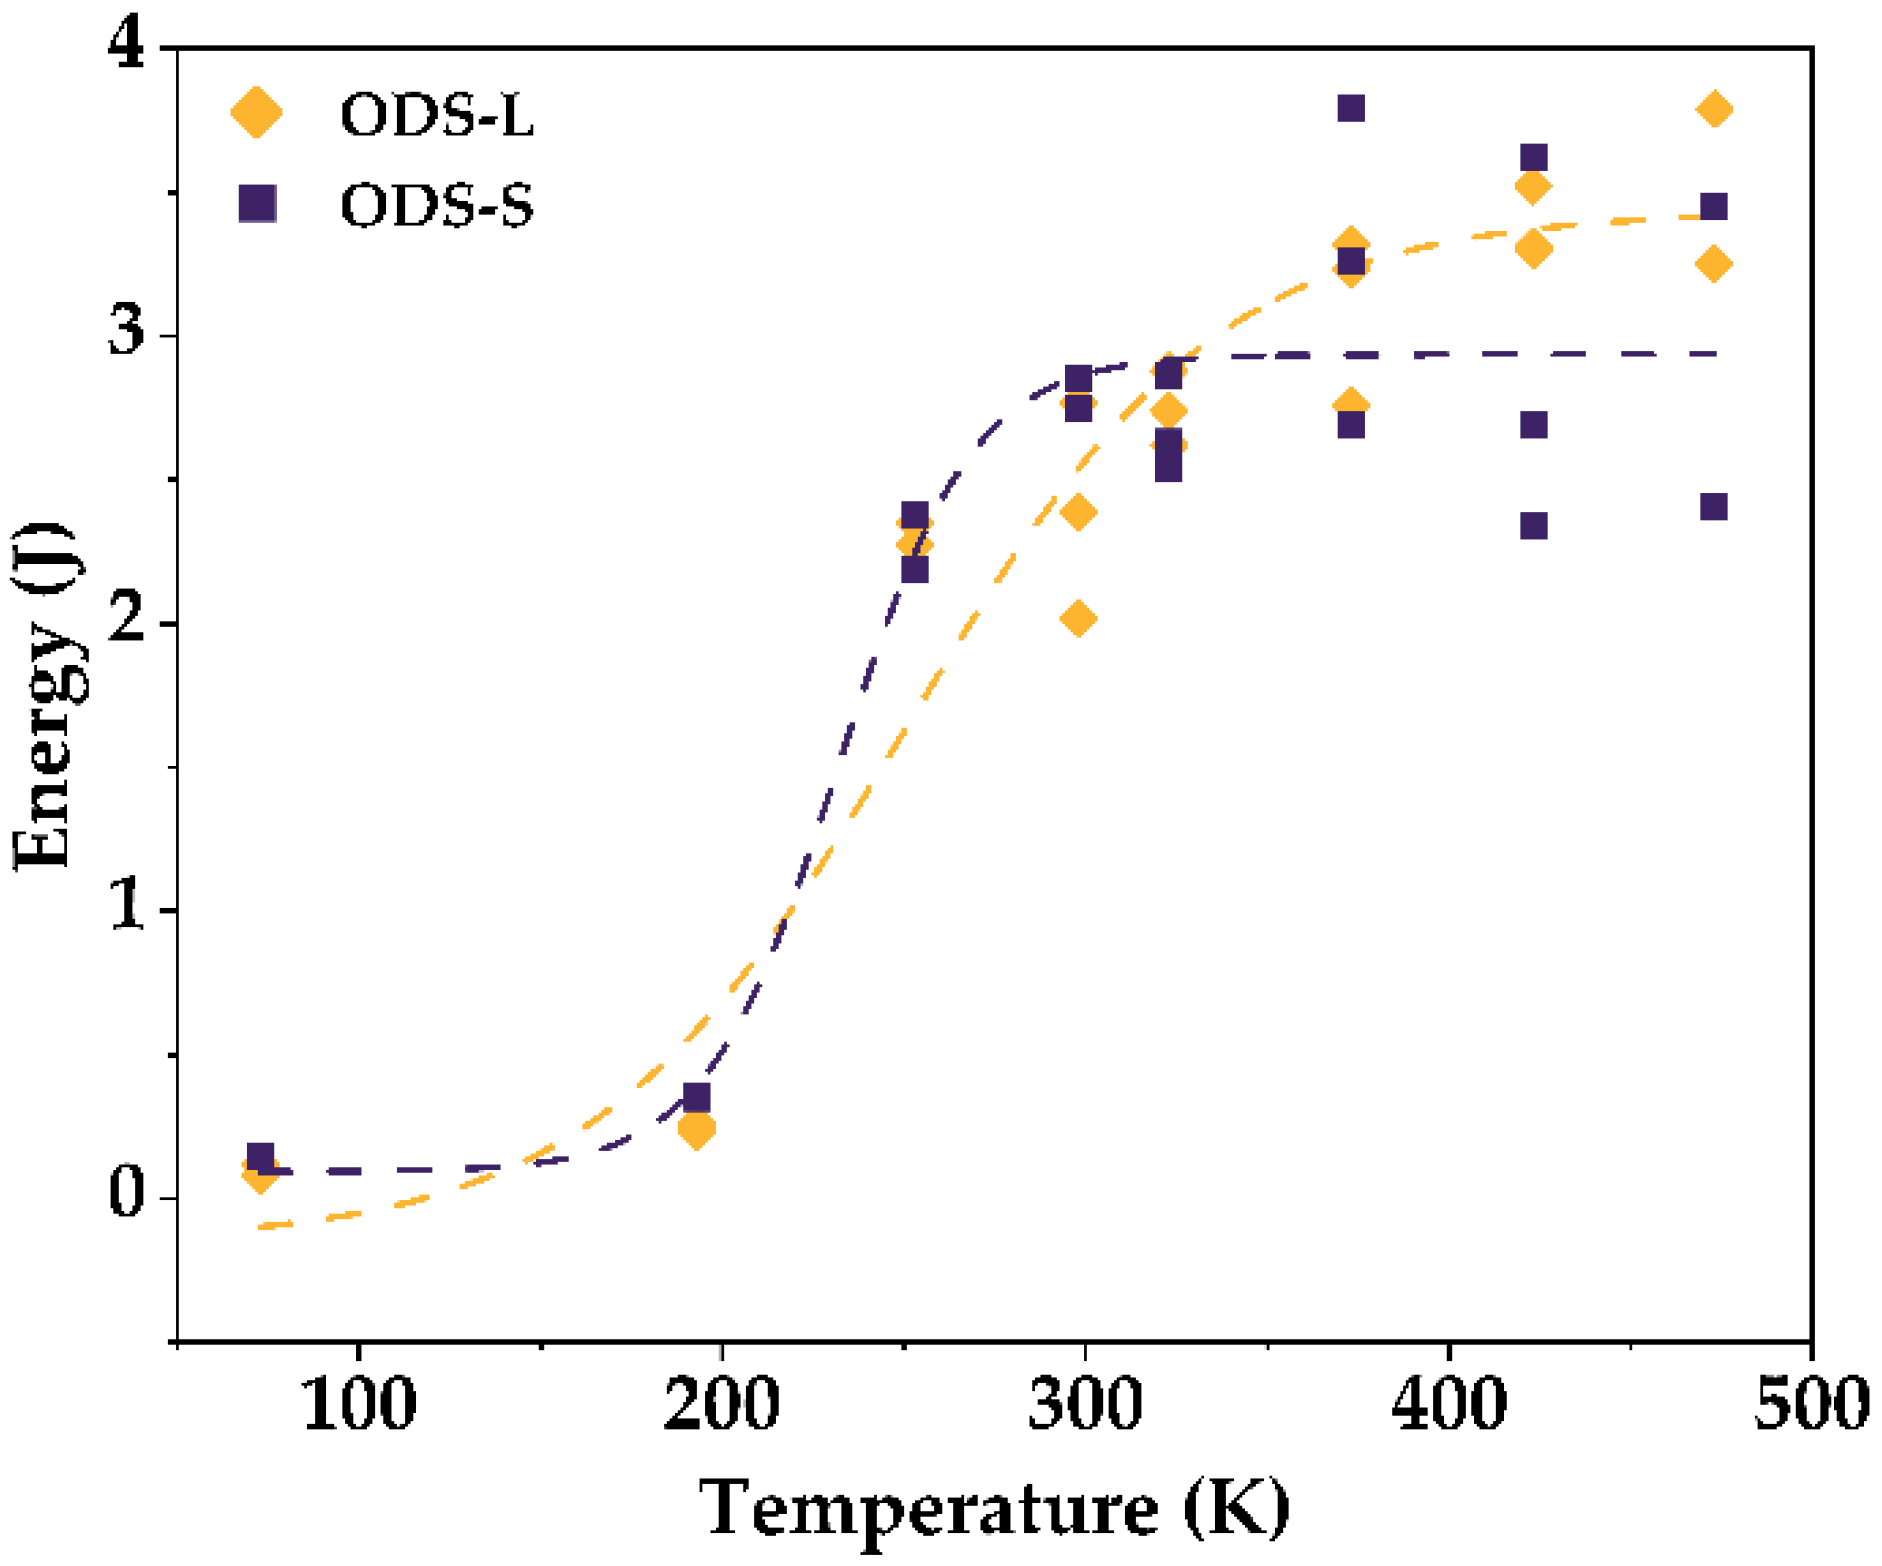
  • The steel produced from smaller powder particles exhibits similar strength, slightly better tensile ductility and DBTT, and a small decrease in the USE values as compared with the steel produced from larger powder particles although the differences observed are very small in concordance with their similar microstructure. This restricted improvement would not justify the higher cost of production of smaller powder particles, at least under the processing route explored.

Author Contributions

Conceptualization, V.d.C. and T.L.; methodology, V.d.C. and T.L.; validation, J.M.-D., V.d.C. and T.L.; formal analysis, M.O., J.M.-D., M.A.A., J.H., V.d.C. and T.L.; investigation, J.M.-D., J.H., V.d.C. and T.L.; resources, M.A.A., J.H., V.d.C. and T.L.; data curation, M.O. and J.M.-D.; writing—original draft preparation, M.O., M.A.A., V.d.C. and T.L.; writing—review and editing, M.O., M.A.A., V.d.C. and T.L.; visualization, M.O., J.M.-D. and M.A.A.; supervision, M.A.A., V.d.C. and T.L.; project administration, M.A.A., V.d.C. and T.L.; funding acquisition, M.A.A., V.d.C. and T.L. All authors have read and agreed to the published version of the manuscript.

Funding

This investigation has been supported by the AEI (Agencia Estatal de Investigación) with reference AEI/10.13039/501100011033 (project PID2019-105325RB-C33); the Comunidad de Madrid (Spain) through the programs MULTIMAT (S2013/MIT-2862), Talento-CAM (2017-T1/IND-5439), and the multiannual agreement with UC3M (“Excelencia para el Profesorado Universitario”-EPUC3M14).

Data Availability Statement

Not applicable.

Conflicts of Interest

The authors declare no conflict of interest.

References

  1. Zinkle, S.; Blanchard, J.; Callis, R.; Kessel, C.; Kurtz, R.; Lee, P.; McCarthy, K.; Morley, N.; Najmabadi, F.; Nygren, R.; et al. Fusion materials science and technology research opportunities now and during the ITER era. Fusion Eng. Des. 2014, 89, 1579–1585. [Google Scholar] [CrossRef]
  2. Tan, L.; Snead, L.; Katoh, Y. Development of new generation reduced activation ferritic-martensitic steels for advanced fusion reactors. J. Nucl. Mater. 2016, 478, 42–49. [Google Scholar] [CrossRef] [Green Version]
  3. Odette, G.R. Recent Progress in Developing and Qualifying Nanostructured Ferritic Alloys for Advanced Fission and Fusion Applications. JOM 2014, 66, 2427–2441. [Google Scholar] [CrossRef]
  4. Stork, D.; Agostini, P.; Boutard, J.; Buckthorpe, D.; Diegele, E.; Dudarev, S.; English, C.; Federici, G.; Gilbert, M.; Gonzalez, S.; et al. Developing structural, high-heat flux and plasma facing materials for a near-term DEMO fusion power plant: The EU assessment. J. Nucl. Mater. 2014, 455, 277–291. [Google Scholar] [CrossRef] [Green Version]
  5. Baluc, N.; Boutard, J.; Dudarev, S.; Rieth, M.; Correia, J.B.; Fournier, B.; Henry, J.; Legendre, F.; Leguey, T.; Lewandowska, M.; et al. Review on the EFDA work programme on nano-structured ODS RAF steels. J. Nucl. Mater. 2011, 417, 149–153. [Google Scholar] [CrossRef] [Green Version]
  6. Odette, G.; Alinger, M.; Wirth, B. Recent Developments in Irradiation-Resistant Steels. Annu. Rev. Mater. Res. 2008, 38, 471–503. [Google Scholar] [CrossRef]
  7. Hoffmann, J.; Rieth, M.; Lindau, R.; Klimenkov, M.; Möslang, A.; Sandim, H.R.Z. Investigation on different oxides as candidates for nano-sized ODS particles in reduced-activation ferritic (RAF) steels. J. Nucl. Mater. 2013, 442, 444–448. [Google Scholar] [CrossRef] [Green Version]
  8. Ukai, S.; Fujiwara, M. Perspective of ODS alloys application in nuclear environments. J. Nucl. Mater. 2002, 307–311, 749–757. [Google Scholar] [CrossRef]
  9. Kim, I.-S.; Choi, B.-Y.; Kang, C.-Y.; Okuda, T.; Maziasz, P.J.; Miyahara, K. Effect of Ti and W on the Mechanical Properties and Microstructure of 12% Cr Base Mechanical-alloyed Nano-sized ODS Ferritic Alloys. ISIJ Int. 2003, 43, 1640–1646. [Google Scholar] [CrossRef] [Green Version]
  10. Odette, G.R.; Hoelzer, D. Irradiation-tolerant nanostructured ferritic alloys: Transforming helium from a liability to an asset. JOM 2010, 62, 84–92. [Google Scholar] [CrossRef]
  11. Oksiuta, Z.; Hosemann, P.; Vogel, S.C.; Baluc, N. Microstructure examination of Fe-14Cr ODS ferritic steels produced through different processing routes. J. Nucl. Mater. 2014, 451, 320–327. [Google Scholar] [CrossRef]
  12. Pazos, D.; Cintins, A.; de Castro, V.; Fernández, P.; Hoffmann, J.; Vargas, W.G.; Leguey, T.; Purans, J.; Anspoks, A.; Kuzmin, A.; et al. ODS ferritic steels obtained from gas atomized powders through the STARS processing route: Reactive synthesis as an alternative to mechanical alloying. Nucl. Mater. Energy 2018, 17, 1–8. [Google Scholar] [CrossRef]
  13. Entler, S.; Horacek, J.; Dlouhy, T.; Dostal, V. Approximation of the economy of fusion energy. Energy 2018, 152, 489–497. [Google Scholar] [CrossRef]
  14. Oñoro, M.; Macías-Delgado, J.; Auger, M.; de Castro, V.; Leguey, T. Mechanical properties and stability of precipitates of an ODS steel after thermal cycling and aging. Nucl. Mater. Energy 2020, 24, 100758. [Google Scholar] [CrossRef]
  15. Macías-Delgado, J.; Leguey, T.; de Castro, V. Effect of hot cross rolling on the microstructure and mechanical properties of an Fe-14Cr ODS ferritic steel. Mater. Sci. Eng. A 2018, 711, 448–459. [Google Scholar] [CrossRef]
  16. de Castro, V.; Leguey, T.; Muñoz, A.; Monge, M.; Fernández, P.; Lancha, A.; Pareja, R. Mechanical and microstructural behaviour of Y2O3 ODS EUROFER 97. J. Nucl. Mater. 2007, 367–370, 196–201. [Google Scholar] [CrossRef]
  17. de Castro, V.; Leguey, T.; Muñoz, A.; Monge, M.; Pareja, R.; Marquis, E.; Lozano-Perez, S.; Jenkins, M. Microstructural characterization of Y2O3 ODS–Fe–Cr model alloys. J. Nucl. Mater. 2009, 386–388, 449–452. [Google Scholar] [CrossRef] [Green Version]
  18. Rout, M.; Pal, S.K.; Singh, S.B. Cross Rolling: A Metal Forming Process; Springer: Berlin/Heidelberg, Germany, 2015. [Google Scholar] [CrossRef]
  19. Zhao, Q.; Yu, L.; Liu, Y.; Li, H. Morphology and structure evolution of Y2O3 nanoparticles in ODS steel powders during mechanical alloying and annealing. Adv. Powder Technol. 2015, 26, 1578–1582. [Google Scholar] [CrossRef]
  20. He, P.; Lindau, R.; Moeslang, A.; Sandim, H. The influence of thermomechanical processing on the microstructure and mechanical properties of 13.5Cr ODS steels. Fusion Eng. Des. 2013, 88, 2448–2452. [Google Scholar] [CrossRef]
  21. Raabe, D.; Lücke, K. Annealing textures of BCC metals. Scr. Met. Mater. 1992, 27, 1533–1538. [Google Scholar] [CrossRef]
  22. Hoffmann, J.; Rieth, M.; Commin, L.; Antusch, S. Microstructural anisotropy of ferritic ODS alloys after different production routes. Fusion Eng. Des. 2015, 98, 1986–1990. [Google Scholar] [CrossRef]
  23. Auger, M.A.; de Castro, V.; Leguey, T.; Monge, M.A.; Munoz, A.; Pareja, R. Microstructure and tensile properties of oxide dispersion strengthened Fe-14Cr-0.3Y2O3 and Fe-14Cr-2W-0.3Ti-0.3Y2O3. J. Nucl. Mater. 2013, 442, S142–S147. [Google Scholar] [CrossRef] [Green Version]
  24. Gwon, J.-H.; Kim, J.-H.; Lee, K.-A. Effects of cryomilling on the microstructures and high temperature mechanical properties of oxide dispersion strengthened steel. J. Nucl. Mater. 2015, 459, 205–216. [Google Scholar] [CrossRef]
  25. Praud, M.; Mompiou, F.; Malaplate, J.; Caillard, D.; Garnier, J.; Steckmeyer, A.; Fournier, B. Study of the deformation mechanisms in a Fe–14% Cr ODS alloy. J. Nucl. Mater. 2011, 428, 90–97. [Google Scholar] [CrossRef]
  26. Fournier, B.; Steckmeyer, A.; Rouffie, A.-L.; Malaplate, J.; Garnier, J.; Ratti, M.; Wident, P.; Ziolek, L.; Tournie, I.; Rabeau, V.; et al. Mechanical behaviour of ferritic ODS steels—Temperature dependancy and anisotropy. J. Nucl. Mater. 2012, 430, 142–149. [Google Scholar] [CrossRef]
Figure 1. (a) Particle size distributions and (b) XRD patterns showing the evolution of the ODS-L and ODS-S steel powders with milling. The dashed lines correspond to the pre-alloyed powders, and the solid lines correspond to the mechanically alloyed powders.
Metals 12 00069 g001
Figure 2. BSE SEM images of the ODS steel powders before and after milling: (a) ODS-L pre-alloyed powders, (b) ODS-S pre-alloyed powders, (c) ODS-L mechanically alloyed powders, and (d) ODS-S mechanically alloyed powders.
Metals 12 00069 g002
Figure 3. BSE SEM images with low magnification showing the microstructure of the ODS steels on the TS plane after HCR and after annealing at 1273 K. (a) ODS-L and (b) ODS-S steels after HCR; (c) ODS-L and (d) ODS-S steels and after annealing at 1273 K; (e) plane orientation scheme.
Metals 12 00069 g003
Figure 4. BSE SEM images with high magnification showing the general microstructure of the ODS steels on the TS plane after HCR and after annealing at 1273 K. (a) ODS-L and (b) ODS-S steels after HCR; (c) ODS-L and (d) ODS-S steels and after annealing at 1273 K.
Metals 12 00069 g004
Figure 5. Grain size distribution measured from SEM images on the TS plane for the ODS-L and ODS-S steels: (a) after HCR; (b) after annealing at 1273 K.
Metals 12 00069 g005
Figure 6. UGC maps of the ODS steels after HCR and after annealing at 1273 K: (a) ODS-L steel after HCR, (b) ODS-S steel after HCR, (c) ODS-L steel after annealing, and (d) ODS-S steel after annealing. The maps were taken along the TS plane.
Metals 12 00069 g006
Figure 7. (ad) Grain size distributions and (eh) aspect ratios measured from UGC maps on submicrometric (<2 µm) and micrometric (>2 µm) sized grains for the ODS-L and ODS-S steels after HCR (a,c,e,g) and after annealing at 1273 K (b,d,f,h).
Metals 12 00069 g007
Figure 8. IPF and KAM maps taken on the TS plane for the ODS steels after HCR and after annealing at 1273 K. IPF maps: (a) ODS-L after HCR, (c) ODS-S after HCR, (e) ODS-L after annealing, and (g) ODS-S after annealing. The respective KAM maps are depicted on (b,d,f,h).
Metals 12 00069 g008
Figure 9. ODF maps obtained on the TS plane after HCR and after annealing at 1273 K. (a) ODS-L and (b) ODS-S steels after HCR; (c) ODS-L and (d) ODS-S steels after annealing; (e) Euler space section φ2 = 45° and main fibers of laminate bcc materials.
Metals 12 00069 g009
Figure 10. Micrographs and XEDS spectra showing Cr-W-rich precipitates on ODS-L and ODS-S steels after HCR and annealing at 1273 K: (a,c) BSE SEM micrographs, (b,d) BF-TEM micrographs, and (e,f) TEM-XEDS analyses.
Metals 12 00069 g010
Figure 11. BF-TEM micrographs and corresponding XEDS spectra showing Ti-rich precipitates (marked with arrows) on ODS-L (a,c) and ODS-S (b,d) steels annealed at 1273 K after HCR.
Metals 12 00069 g011
Figure 12. Y-Ti-O nanoparticles on ODS-L and ODS-S steel samples annealed at 1273 K after HCR: (a,c) BF-TEM micrographs, (b) particle size histogram, and (d,e) TEM-XEDS analysis.
Metals 12 00069 g012
Figure 13. HREM micrographs of the ODS-L steel annealed at 1273 K after HCR: (a) Ti-rich precipitate indexed as Ti2CrO7 on the zone axis <010>; (b) Y-Ti-O nanoparticle 4 nm in size indexed as Y2TiO5 on the zone axis [ 0 2 ¯ 1].
Metals 12 00069 g013
Figure 14. Representative stress-strain curves obtained from tensile test experiments performed on ODS steel samples annealed at 1273 K after HCR along the TS plane: (a) ODS-L; (b) ODS-S. Test temperatures ranged between RT and 973 K.
Metals 12 00069 g014
Figure 15. Mechanical properties as a function of the testing temperature for the ODS-L and ODS-S steels annealed at 1273 K after HCR on the TS plane: (a) Yield strength, (b) ultimate tensile strength, (c) uniform elongation, and (d) total elongation.
Metals 12 00069 g015
Figure 16. Charpy impact test curves on V-notch samples for the ODS-L and ODS-S steels annealed at 1273 K after HCR along the TS plane. The dashed lines represent the sigmoidal fits in each case.
Metals 12 00069 g016
Table 1. Chemical composition (wt. %) of the ODS steel powders after milling.
MaterialFeCrWTiYOCAlNSiS
ODS-LBal.13.12.00.380.180.170.04<0.050.020<0.05<0.003
ODS-SBal.13.22.00.390.250.230.04<0.050.050<0.05<0.003
Table 2. Summary of EBSD results for the ODS-L and ODS-S steels: mean size (Ds), aspect ratio (ARs), and number of grains (Ns) for grain sizes < 2 µm and for grain sizes > 2 µm (Dm, ARm, and Nm, respectively).
MaterialStageDs (µm)ARsNsDm (µm)ARmNm
ODS-Lafter HCR0.5 ± 0.40.39 ± 0.1310724 ± 30.22 ± 0.1195
after annealing0.5 ± 0.40.40 ± 0.1332814 ± 20.26 ± 0.12223
ODS-Safter HCR0.6 ± 0.40.32 ± 0.138714 ± 20.20 ± 0.09123
after annealing0.6 ± 0.40.38 ± 0.1225274 ± 20.26 ± 0.11253
Table 3. Charpy impact test properties for annealed ODS-L and ODS-S at 1273 K after HCR on the TS plane.
MaterialDBTT (K)USE (J)LSE (J)
ODS-L250 ± 123.4 ± 0.30.19 ± 0.08
ODS-S230 ± 203.0 ± 0.60.29 ± 0.12
Publisher’s Note: MDPI stays neutral with regard to jurisdictional claims in published maps and institutional affiliations.

