Article

Hot Deformation Behavior of PM Ni with Harmonic Microstructure

1
Department of Industrial Engineering, University of Trento, Via Sommarive 9, 38123 Trento, Italy
2
Department of Mechanical Engineering, College of Science and Engineering, Ritsumeikan University, 1-1-1 Noji-Higashi, Kusatsu 525-8577, Japan
*
Author to whom correspondence should be addressed.
Metals 2022, 12(1), 90; https://doi.org/10.3390/met12010090
Submission received: 10 November 2021 / Revised: 21 December 2021 / Accepted: 24 December 2021 / Published: 4 January 2022
(This article belongs to the Section Powder Metallurgy)

Abstract

:
The hot deformation behavior of a harmonic-structured pure nickel has been studied and compared with the hot deformability of a homogeneously structured nickel. Both materials were produced via the powder metallurgy route through the Spark Plasma Sintering (SPS) of mechanical milled and un-milled powders. Hot deformation was evaluated through compression tests at three different temperatures (400 °C, 800 °C, and 1300 °C), covering a wide range in the homologous temperature spectrum for Ni (from 0.39 to 0.91), and at three different strain rates (0.001, 0.01, and 0.1 s−1). The evaluation of the stress–strain curves showed a higher hot compression resistance for the harmonic-structured nickel, together with higher strain hardening and strain rate sensitivity, thanks to the peculiar microstructural features of this material. Through the metallographic analysis of the specimens after hot compression, different mechanisms were identified as responsible for the deformation behavior in relation to the temperature of testing. While at 400 °C dynamic recrystallization has slightly started, at 800 °C it is widely diffused, and at 1300 °C it is replaced by grain growth and diffusion creep phenomena.

Graphical Abstract

1. Introduction

The development of high-strength structural materials that are also tough enough to resist failure has always been a challenge for materials science research. Extensive investigations in the past few decades have indicated that a reduction in grain sizes results in an increase in strength at the expense of ductility [1,2]. To obtain an optimized combination of high strength and adequate ductility, materials with high strain-hardening capacity are required. Recently, materials with mechanical, chemical, and microstructural intentional heterogeneities have gained huge interest owing to their potentiality in achieving a good combination of strength and ductility [3,4,5,6,7]. These purposed heterogeneities induce non-identical plastic deformation with consistent strain gradients at the nano-scale level, thereby enhancing strain hardening. Harmonic structure (HS)-designed materials are newly developed hetero-structured materials that consist of a topological arrangement of coarse-grains (Core) surrounded by a three-dimensional connected network of fine grains (Shell) [8,9,10]. HS materials exhibit very interesting isotropic properties, extensively investigated at room temperature [11,12,13].
On the other hand, the response of these materials to high-temperature deformation has not yet been investigated and a comprehensive study on their hot deformability would be very important for the rational design of these materials, having the desired performance and properties for intended applications. It is well known, in fact, that the initial microstructure of a metallic material significantly affects its hot deformation behavior, and, therefore, its range of workability on one side, and its high-temperature strength, i.e., its field of application, on the other side [14]. Ni was chosen as the best candidate to develop this investigation on the hot deformation response of HS materials since it has a wide temperature range of deformability with no phase transformations or second-phase precipitation. The influence of microstructure on the mechanical properties of HS Ni compacts at room temperature has already been reported, wherein the effects of strain hardening rates and strain hardening exponents on deformation behavior at room temperature were also discussed [15].
This study intends to evaluate the hot deformation behavior of HS-designed pure Ni, compared to conventional homogeneous PM Ni through hot compression tests, stress–strain curve analysis, and a microstructural examination of deformed samples. The purpose is the comparison of two different grain size distributions in a pure metal in which the crystal structure (fcc) does not change with temperature and the application of stress. Since different processing parameters affect the hot deformability of a metallic material [16,17,18], in the present investigation strain rate and deformation temperature were varied within a certain range in order to induce different deformation mechanisms in Ni.

2. Materials and Methods

A pure Ni powder (Ni 99.5%) produced by a plasma rotating electrode process (PREP), having a mean particle size of 152 µm, was used to prepare the compacts. The homogeneous compacts were prepared by sintering the initial powder (material named IP = initial powder). The HS compacts were obtained by milling the IP to produce a mechanically milled (MM) powder in which every particle was deformed with the aim of creating an external layer with a smaller grain size. Milling was carried out in a Fritsch P-5 planetary ball mill rotating at 150 rpm for 50 h with a BPR of 1.8 in a steel vial using steel balls. An Ar atmosphere was created in the vial in order to prevent oxidation. Moreover, prior to the milling process, commercially pure Ni powder (<45 μm) was milled to make a nickel-coating layer on the surface of both vial and balls to avoid contamination caused by the milling media.
The sintering of both the IP and MM powder was carried out by Spark Plasma Sintering (SPS) at a nominal temperature of 800 °C (measured by a thermocouple inserted into a blind hole in the die wall) with a holding time of 30 min under a pressure of 100 MPa under ultra-high vacuum conditions. The microstructures of IP and MM samples are reported in Figure 1. The mean grain size of the IP specimen is 36 µm while the MM powder has a mean grain size of 26µm in the cores and the grains of the shell have a mean size of 4 µm, as shown at higher magnification in Figure 1c. The extension and the mean grain size of the shell areas are influenced by the milling time, as shown in a previous investigation of the author’s, regarding austenitic stainless steel [19]. A 6.6% volume of pores was measured on the IP sample, while it was 1.9% vol. for MM. The different porosity is due to the different sinterability of the two powders, being more active for the MM powder because of the deformed shell on the particle surface. In these areas, in fact, there is a higher diffusivity due to the dislocation pipe diffusion mechanism [20].
Hot compression tests were carried out in a horizontal Bähr dilatometer DIL 805A/D (Figure 2) equipped with a hydraulic system able to apply a compression force through a couple of alumina punches on cylindrical specimens (diameter 5 mm, height 10 mm) at three different temperatures (400, 800, 1300 °C) and strain rates (0.001–0.01–0.1 s−1), recording the stress–strain curves up to a true strain of 0.4. In order to ensure the material behavior reproducibility in each deformation condition, each curve was repeated at least three times, considering valid only the curves within a range of 3%. Hot deformation temperatures were chosen to cover a wide temperature range with the aim of observing different deformation behaviors and mechanisms. Flat disks (0.1 mm thickness and 8 mm diameter) made of 99.95% molybdenum were placed between the specimen and the punches to improve the contact conditions (thermal barrier and friction). The specimens were induction heated and their temperature was monitored and controlled using a Platinum: Platinum-Rhodium (Pt:Pt-Rh) thermocouple. A low pressure of 10−4 mbar was used during the tests in order to limit surface oxidation. A 5 min holding time was applied after heating in order to homogenize the temperature before starting the deformation step. After deformation, samples were rapidly cooled down at 10 °C/s with a flux of inert gas (Ar), in order to “freeze” the microstructure for the following metallographic investigations. Samples before and after the compression tests were characterized by means of optical microscopy after metallographic preparation and etching with a solution of 50 mL of HCl 32%, 50 mL of HNO3 65%, and 10 g of copper sulfate in 50 mL of ethanol 98%. The porosity of compacts was measured through Archimede’s method.

3. Results

3.1. Hot Deformation Curves

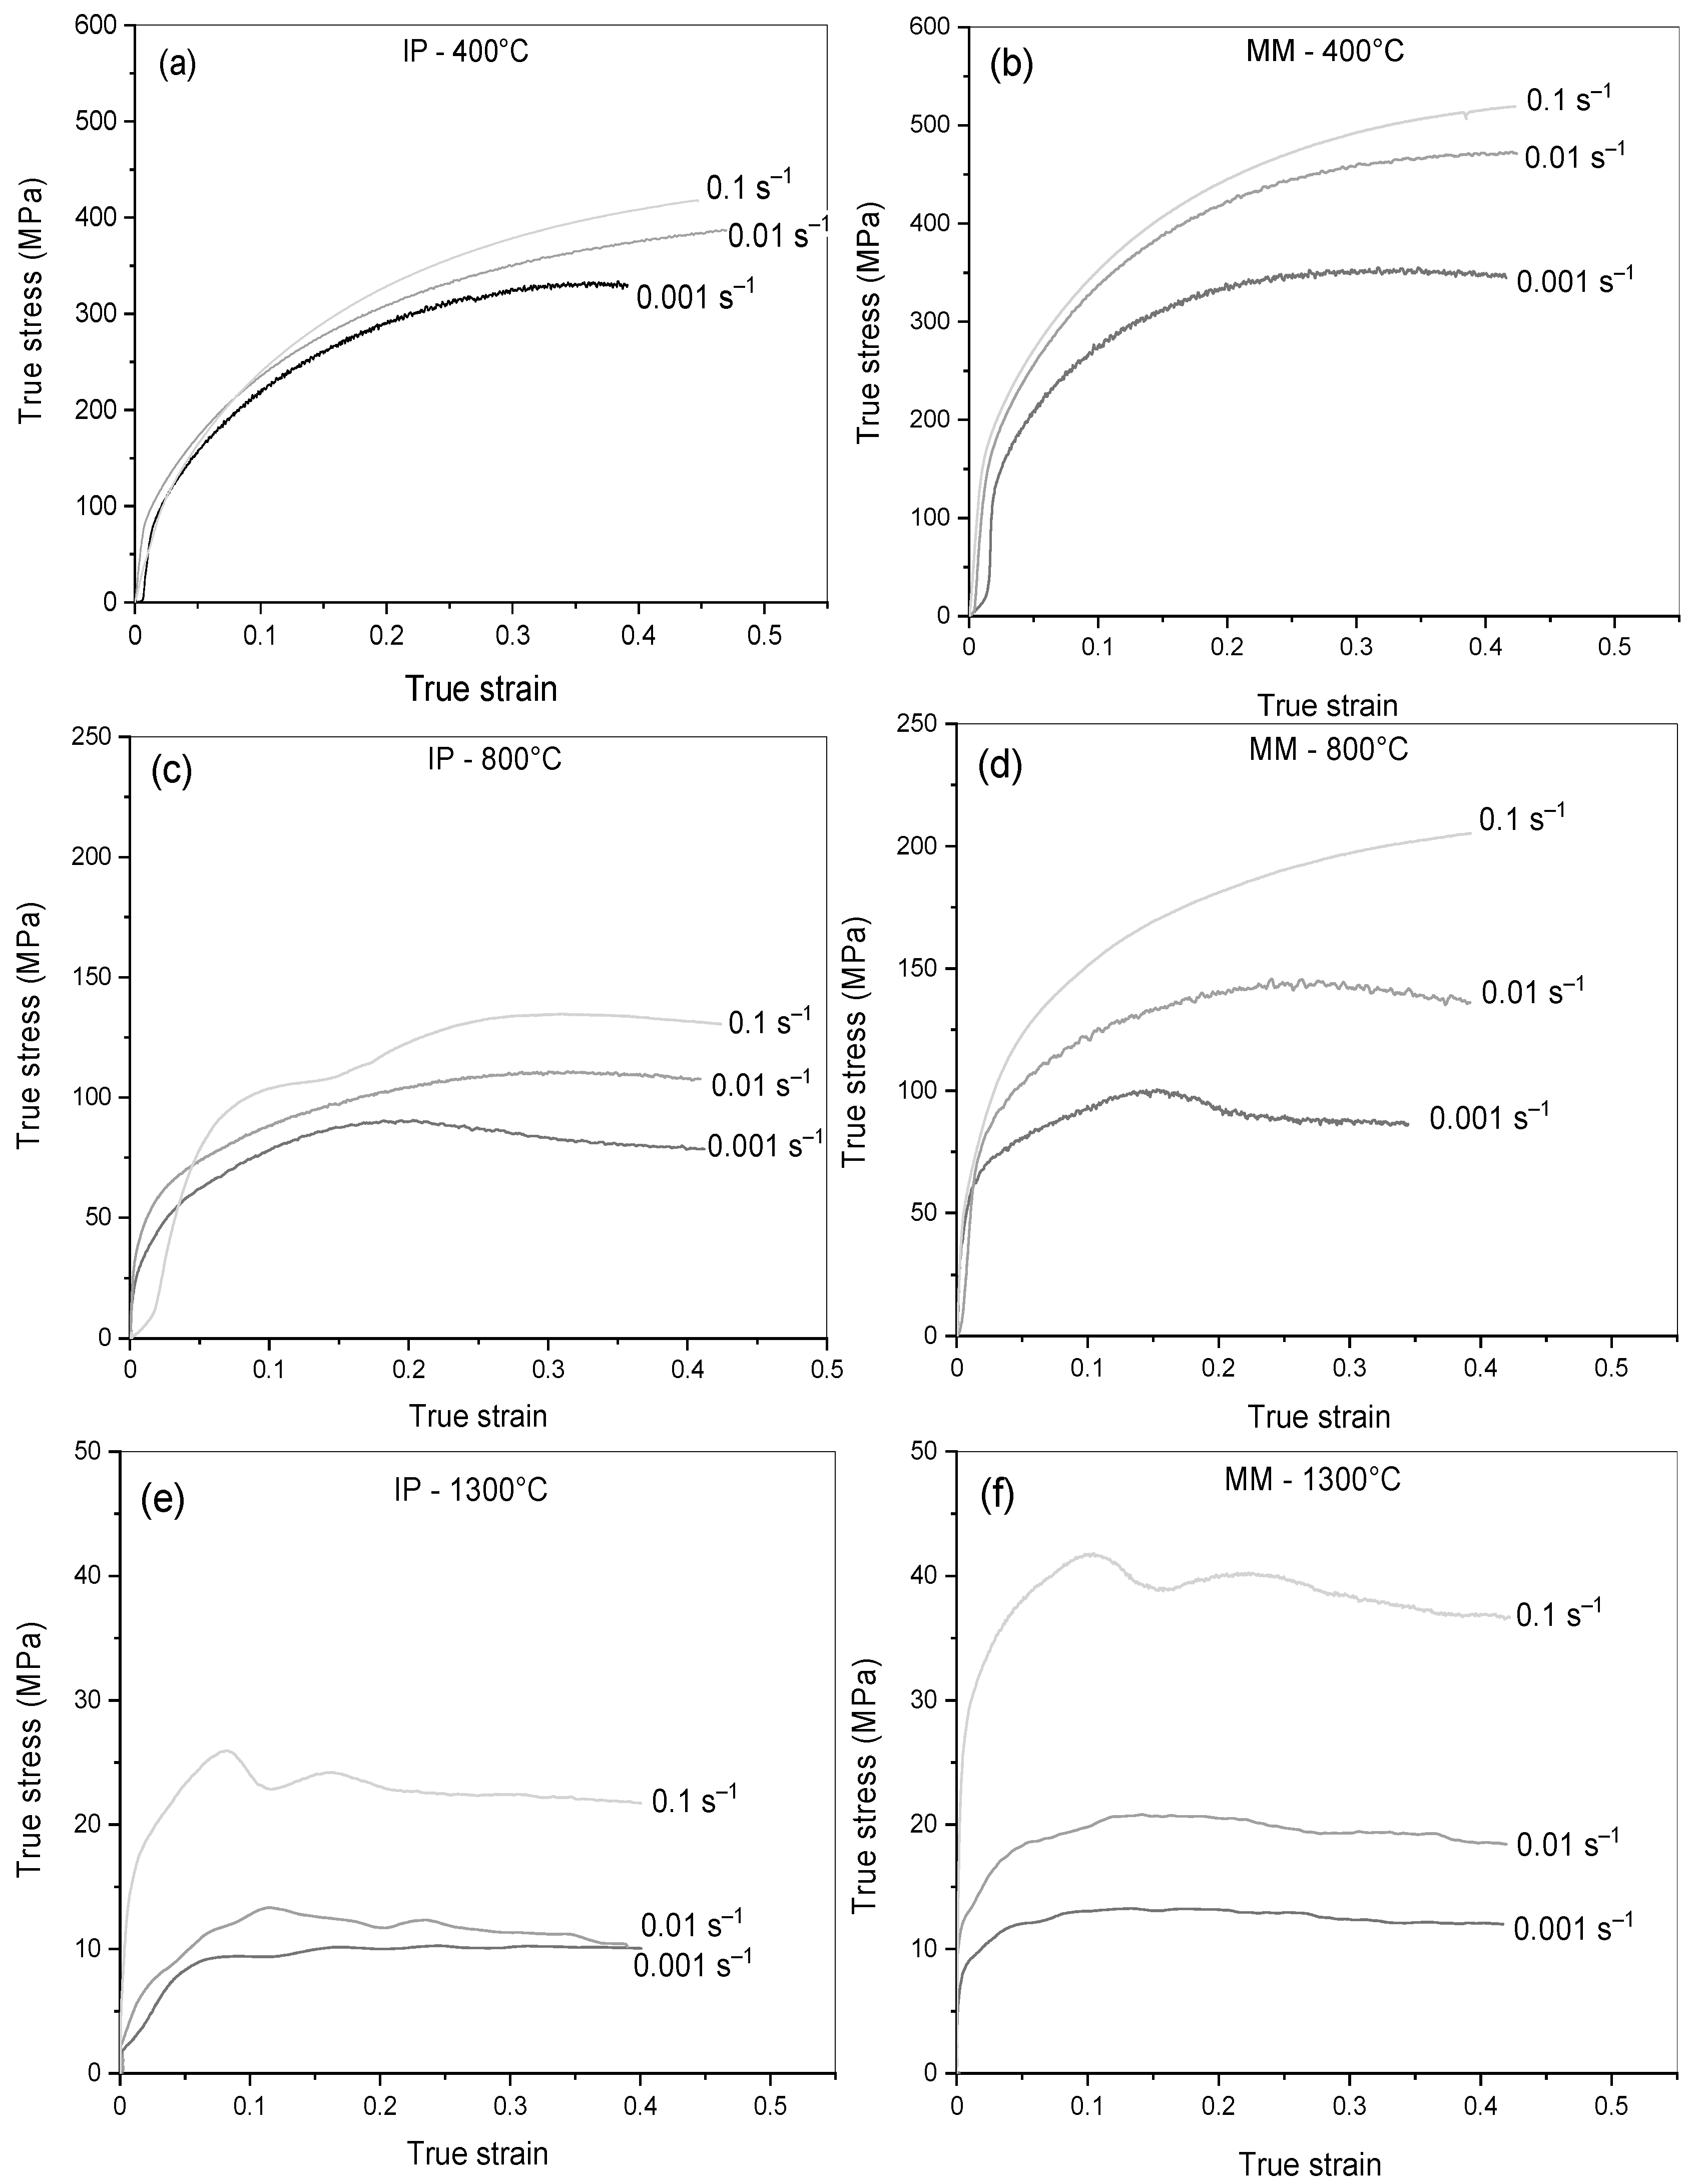
The true stress–true strain hot compression curves recorded for IP and MM nickel are displayed in Figure 3. The hot deformation behavior of IP nickel was consistent with literature data for wrought nickel [21,22,23,24,25]. However, the hot deformation behavior of the MM compact was distinct, owing to its bimodal grain size. As expected, flow stress increases with strain rate and decreases at higher temperatures.
In relation to the different hot deformation temperatures, compression curves can be described as follows:
-At 400 °C, compression curves show the typical stress–strain shape characterized by an increase in stress with strain due to strain hardening up to a maximum stress value. The maximum value of stress σp (peak flow stress) is reached only at the lowest strain rate of 0.001 s−1 in both materials. In IP, it is reached at a deformation very close to the maximum, i.e., at σp = 0.36, while in MM the peak flow stress is reached at a lower strain, σp = 0.30. At higher strain rates (0.01 and 0.1 s−1), the curves do not reach a maximum within a deformation ε of 0.4.
-At 800 °C, almost all curves show a maximum stress point followed by a decrease. The decrease is much more evident at the lowest strain rate (flow softening), where it is also followed by a steady-state deformation. This curve shape generally indicates the occurrence of dynamic recrystallization DRX [25,26], which is reasonably expected at this temperature.
-At 1300 °C, all the materials show compression curves characterized by very low stress values and the presence of more than one peak. These plastic flow oscillations can be due to different plastic instability phenomena occurring at this temperature. In general, instability phenomena that can lead to an unstable plastic flow behavior, evident on hot deformation curves, can be adiabatic shear bands, flow localization, the kinking of lamellar microstructures, grain boundary sliding, and wedge cracking [21,27,28,29,30].
From the analysis of the stress–strain curves, it can be stated that only at 800 °C is there evidence of a clear dynamic recrystallization phenomenon that is not highlighted at 400 °C. At 1300 °C, plastic instability phenomena become relevant, leading to the oscillation of the plastic flow.
Peak stress values, where present, were extracted from the compression curves and reported in Figure 4. The σp values of IP nickel are in line with those found by Sellars, who measured a peak stress of 33 MPa at 934 °C and at a strain rate of 0.115 s−1 [31], and by Gao [23], who measured as-cast pure nickel peak flow stresses in the range of 20–50 MPa at temperatures between 950 °C and 1150 °C and a strain rate of 0.001 s−1. Increasing the strain rate to 0.01 s−1, in the same temperature range, the stresses measured by Gao increased to 30–82 MPa, and, at the highest strain rate, the peak flow stresses are in the range of 50–125 MPa. These values of stress reported in the literature are in good agreement with the values found in the present research at 800 °C and 1300 °C, which fall below and above the temperature interval examined by Gao [23]. As shown in Figure 4, peak flow stresses are higher for the harmonic-structured material, MM, which shows higher resistance to compression with respect to IP at every temperature and strain rate. The higher resistance of harmonic-structured Ni at room temperature was already shown by Ameyama et al. in a previous paper [32]. As can be seen from Figure 3a–c, the difference between the flow stress of MM and IP (indicated in % on the MM bar) increases with the strain rate. This is due to a consistent strengthening effect exerted by the peculiar microstructure of harmonic material, in which the shell fraction withstands the deformation more heavily when the grains have less time to deform, i.e., at the highest strain rate.
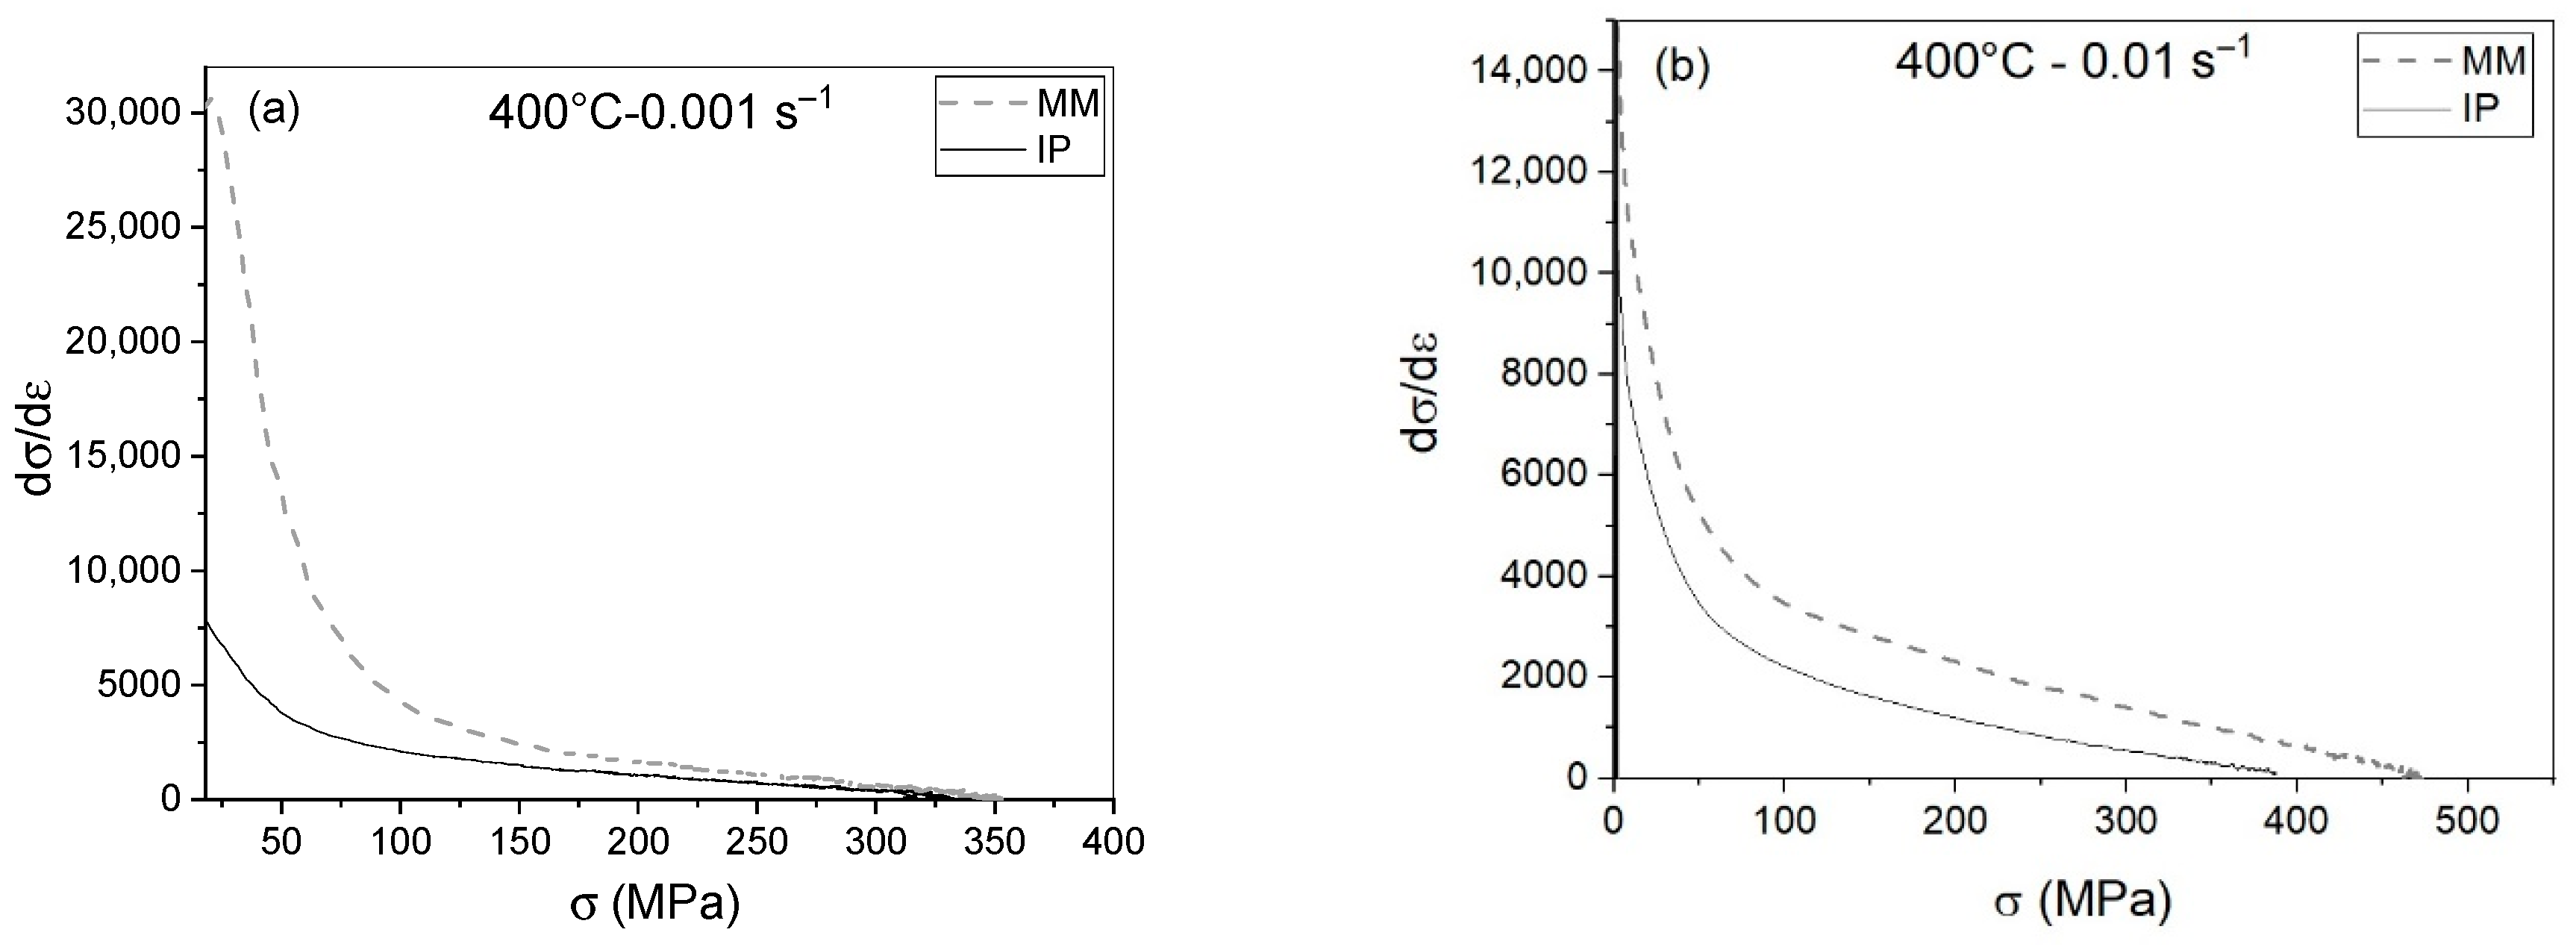
Strain hardening curves (dσ/dε = θ) were derived from the stress–strain curves of Figure 2 and compared for the IP and MM materials. An example of the curves dσ/dε vs. σ of the IP and MM specimens deformed at 400 °C is shown in Figure 5a–c. It can be seen that the strain hardening values of MM are higher than those of IP. As recently shown by Garcia de la Cruz et al. for pure Ni, a finer grain size should lead to lower strain hardening capability [33], but in HS Ni, the finer grain size of the shell results in a reinforcement effect, able to bear the load of transferring the deformation from the shell to the cores with a consequent higher strain hardening. From the strain hardening curves, the strain hardening exponent n, expressed by Formulas (1) and (2), has been calculated. The plots of n are reported in Figure 6 as a function of strain for the IP and MM specimens deformed at the lowest strain rate. At each temperature, the strain hardening exponent n of MM is higher than the corresponding value of IP. The same behavior has also been observed by Ameyama at room temperature [32]. The values of n found by Ameyama in a previous paper regarding harmonic-structured nickel at room temperature were in the range of 0.2–0.48. The values found in the present research are in the range of 0.11–0.45, with the highest value corresponding to the temperature of 400 °C and the lowest to 1300 °C. Khodabakhshi found, for Ni, a work hardening exponent n of 0.387 at room temperature [34], while Bowen measured an n = 0.36 for pure Ni [35]. In the present research, the enhanced work hardening behavior of MM Ni is due to the effect of the connected network of fine grains, i.e., the shell, able to withstand the deformation, transferring it to adjacent particle cores with a consequent increase in the strain hardening.
n = dln σ dln ε
n = dln σ dln ε = dln σ d σ · d ε dln ε · d σ d ε = ε σ · d σ d ε

3.2. Initiation of Dynamic Recrystallization

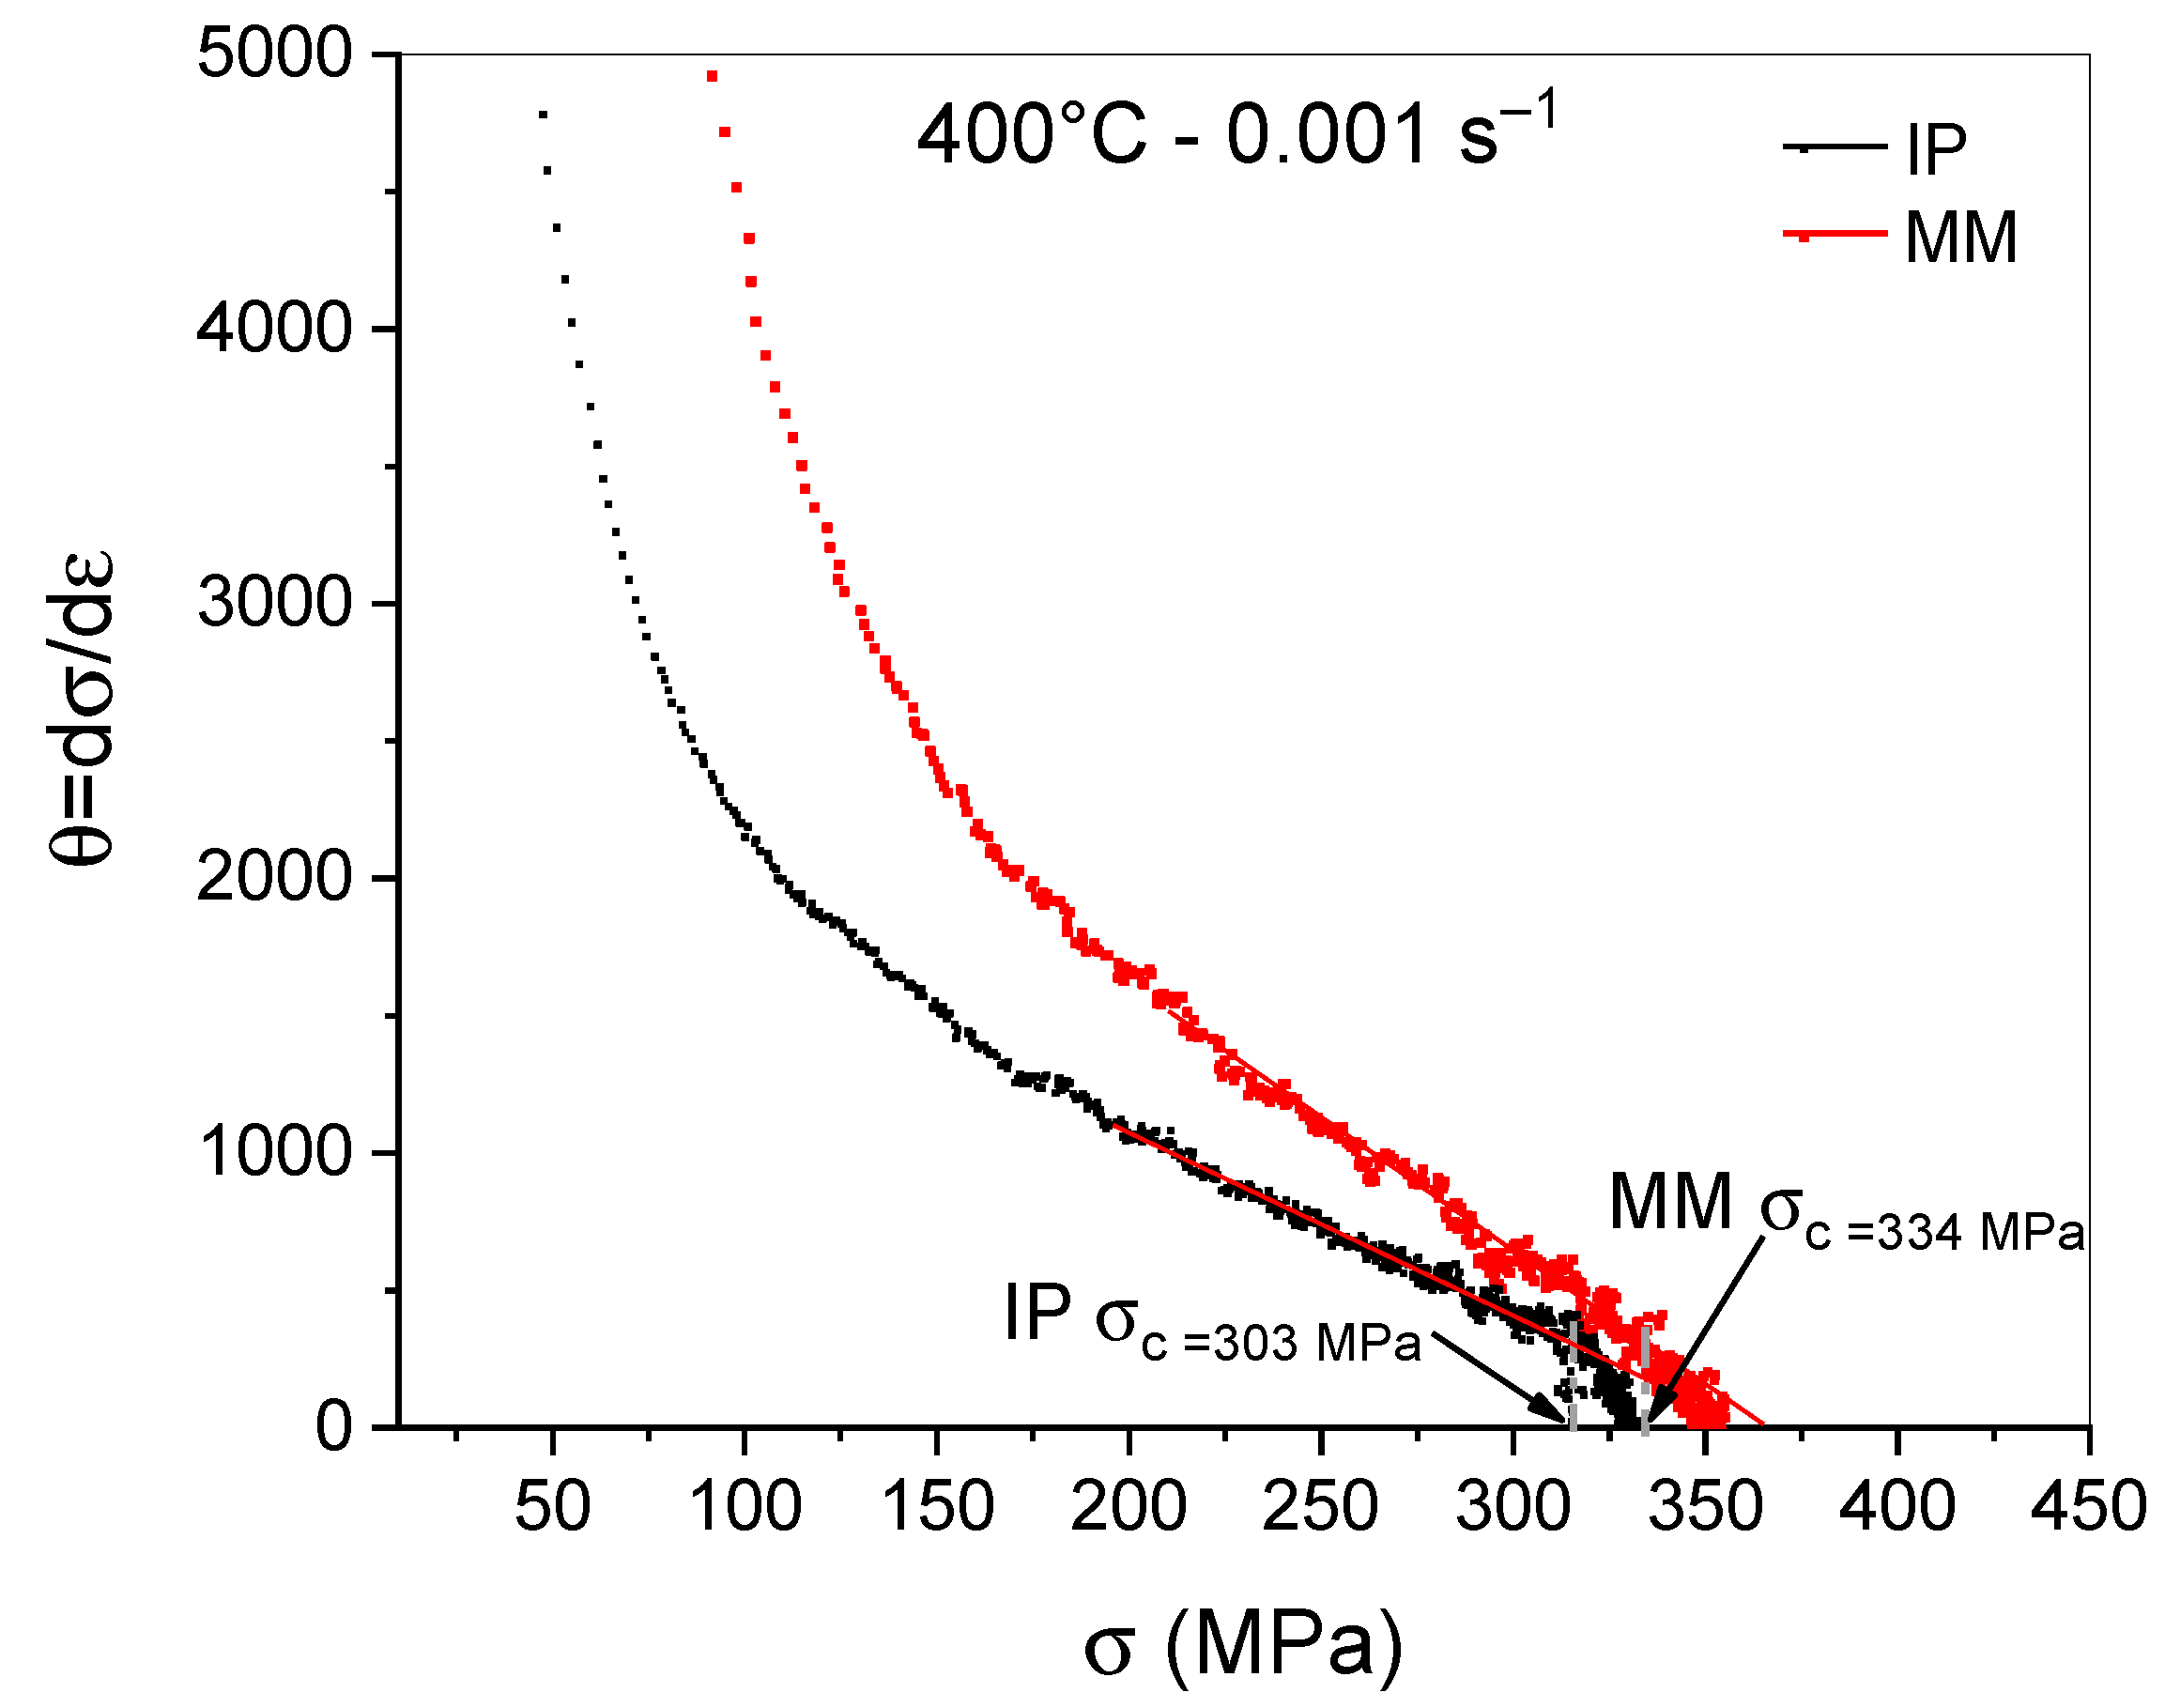
As reported in the description of the compression curves, the occurrence of DRX is indicated by the appearance of a peak in the stress–strain curve. However, DRX is actually initiated before the strain that corresponds to the stress peak [25,36]. This threshold strain is known as the critical strain εc, similar to the one required for the initiation of conventional static recrystallization (SRX). The critical strain for DRX depends on the chemical composition of the material under consideration, the grain size prior to deformation, and the deformation parameters (temperature and strain rate) [36]. Although the critical strain is a fundamental DRX parameter, it can only be determined under isothermal, constant strain rate conditions, such as the hot compression tests of the present investigation. According to the approach proposed by Poliak and Jonas [36], the critical stress for dynamic recrystallization σc, and therefore the corresponding εc, can be determined as the inflection point of the θ-σ curve where θ is the strain hardening rate, θ = dσ/dε. An example is shown in Figure 7, which is an enlargement of Figure 5a referring to the deformation of the two materials at 400 °C and 0.001 s−1. From the σc values, the corresponding critical strain εc values were derived from the stress–strain curves. The values of εc are summarized in Table 1. No inflection points were detected on the curves for IP and MM at 400 °C and ε ˙   = 0.01 s−1 and 0.1 s−1, confirming that DRX did not start under these deformation conditions, requiring a lower strain rate to occur. The values of εc reported in Table 1 show a decrease by increasing temperature and an increase in strain rate. Comparing IP and MM nickel, lower values were observed for the MM samples since the deformed part of the microstructure (the shell) promotes the easier nucleation of new grains, resulting in an early DRX. From the comparison of the data in Figure 3 with Table 1, it must be noted that only MM deformed at 800 °C–0.1 s−1 does not show a peak flow stress even after an early DRX initiation. In this material, the strain hardening mechanisms, in competition with DRX in the initial stage of deformation, are prevailing, shifting the peak to values of ε higher than 0.4.

3.3. Strain Rate Sensitivity

As demonstrated by the stress–strain flow curves, the plastic flow of these materials is sensitive to strain rate. This is known as strain-rate sensitivity (m), defined as:
m = f ( ε ˙ , T ) = dlog σ dlog ε ˙ | T , ε
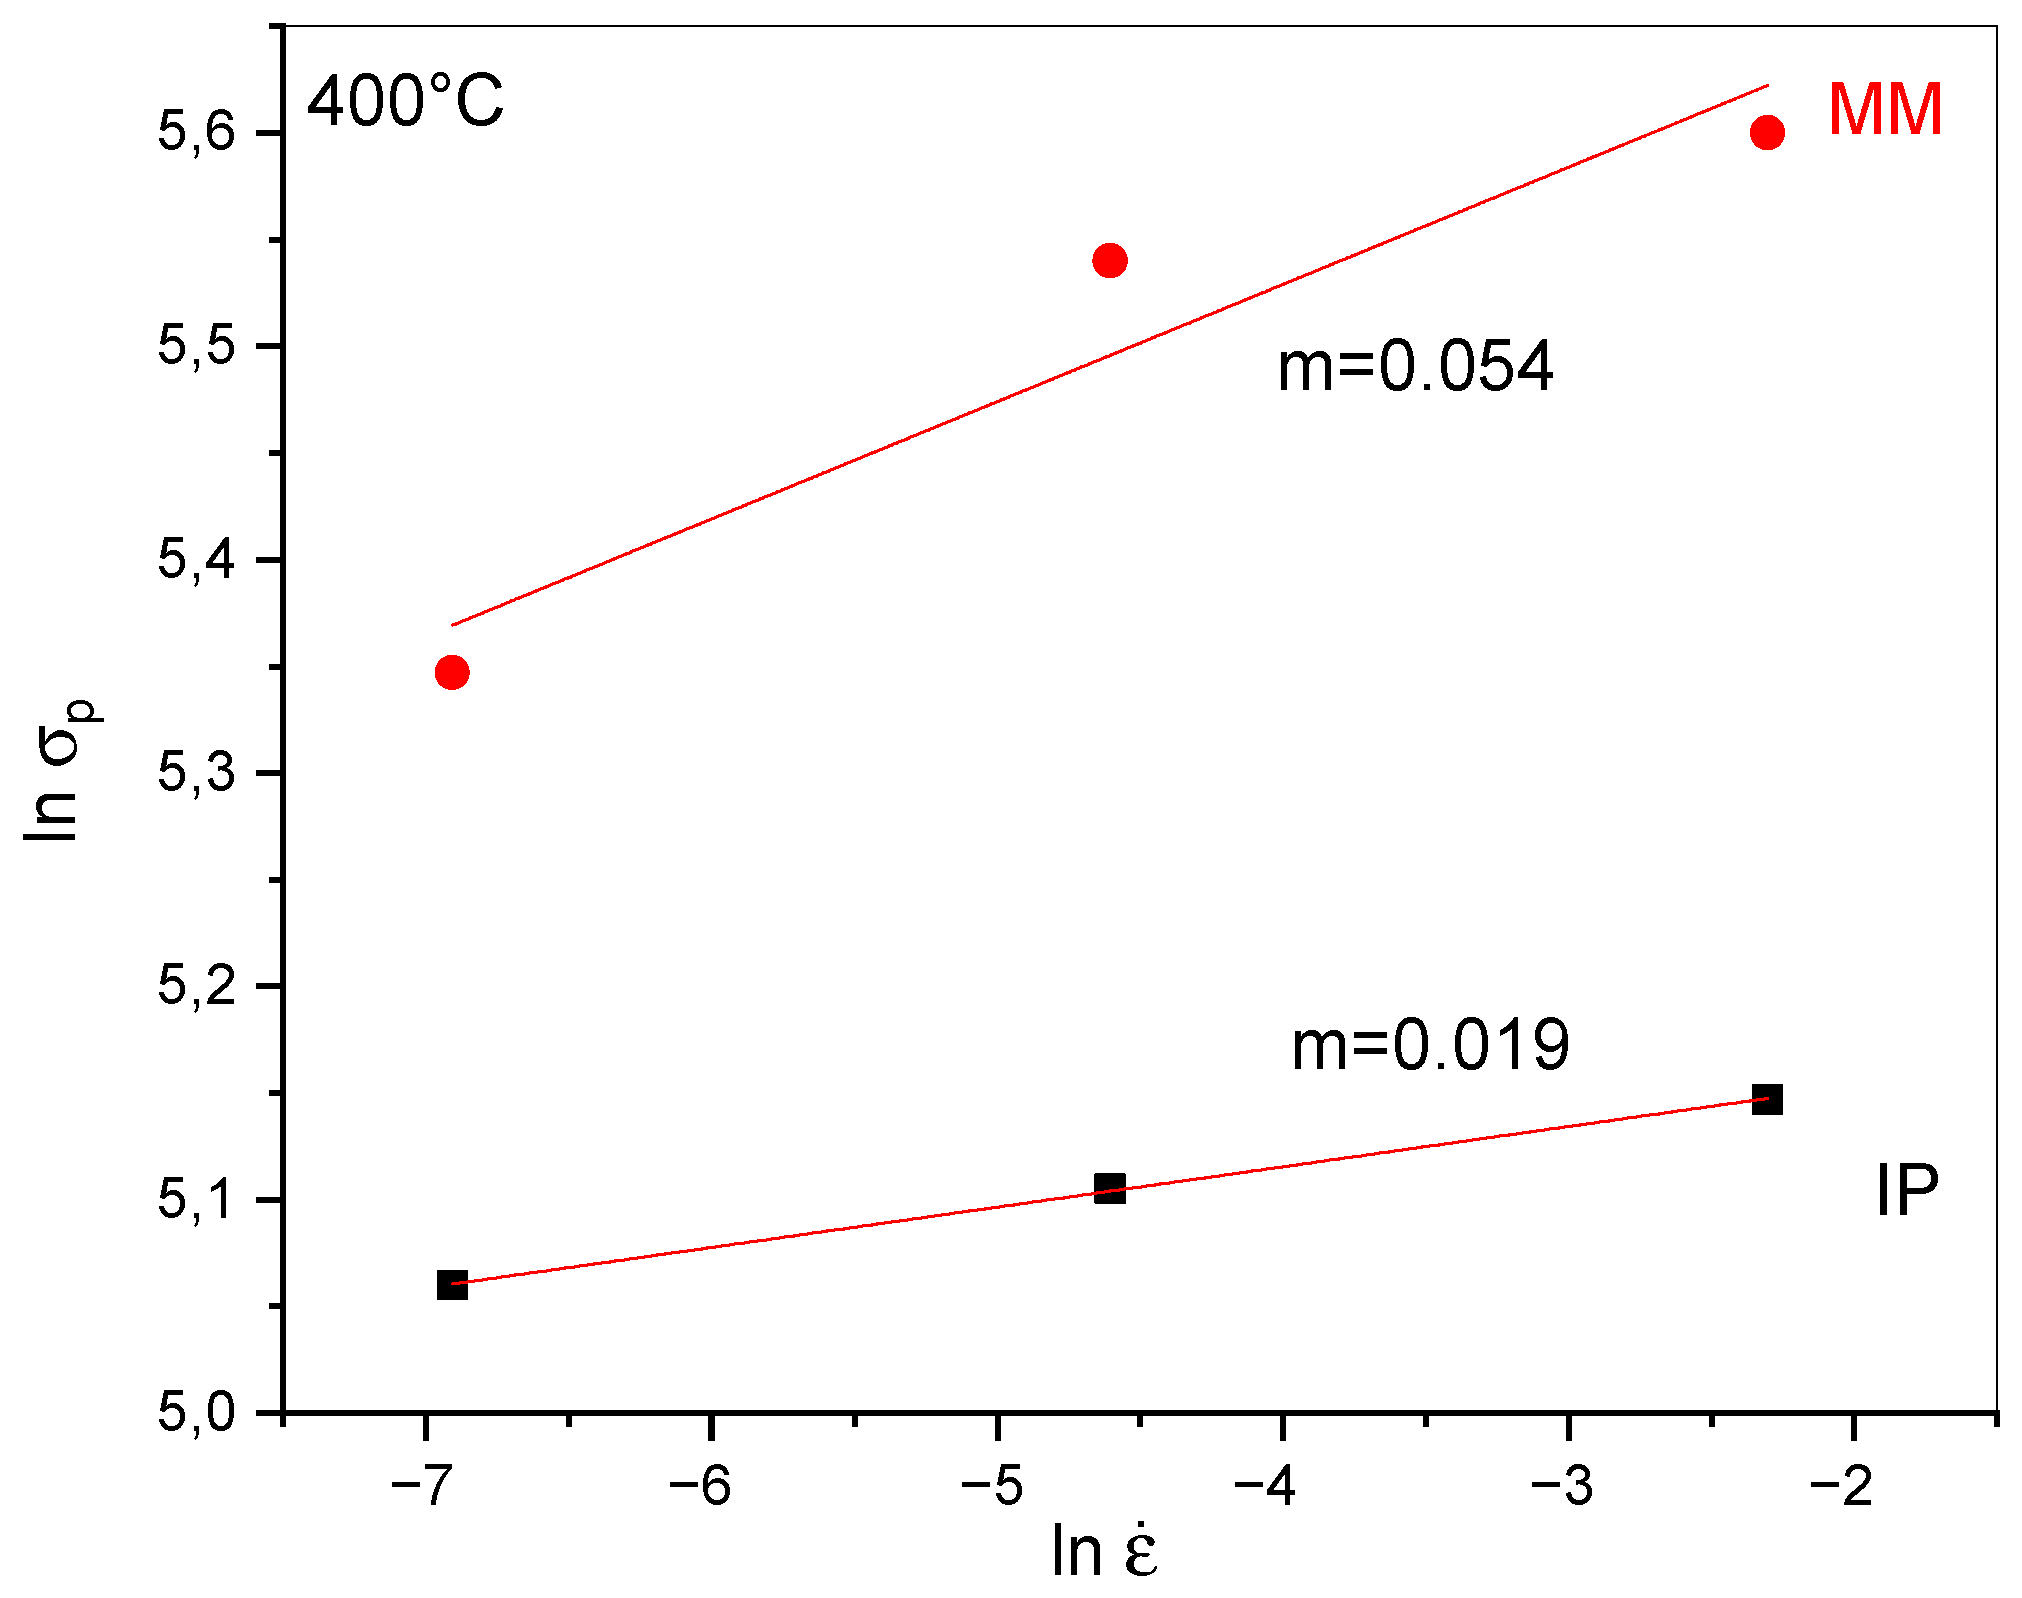
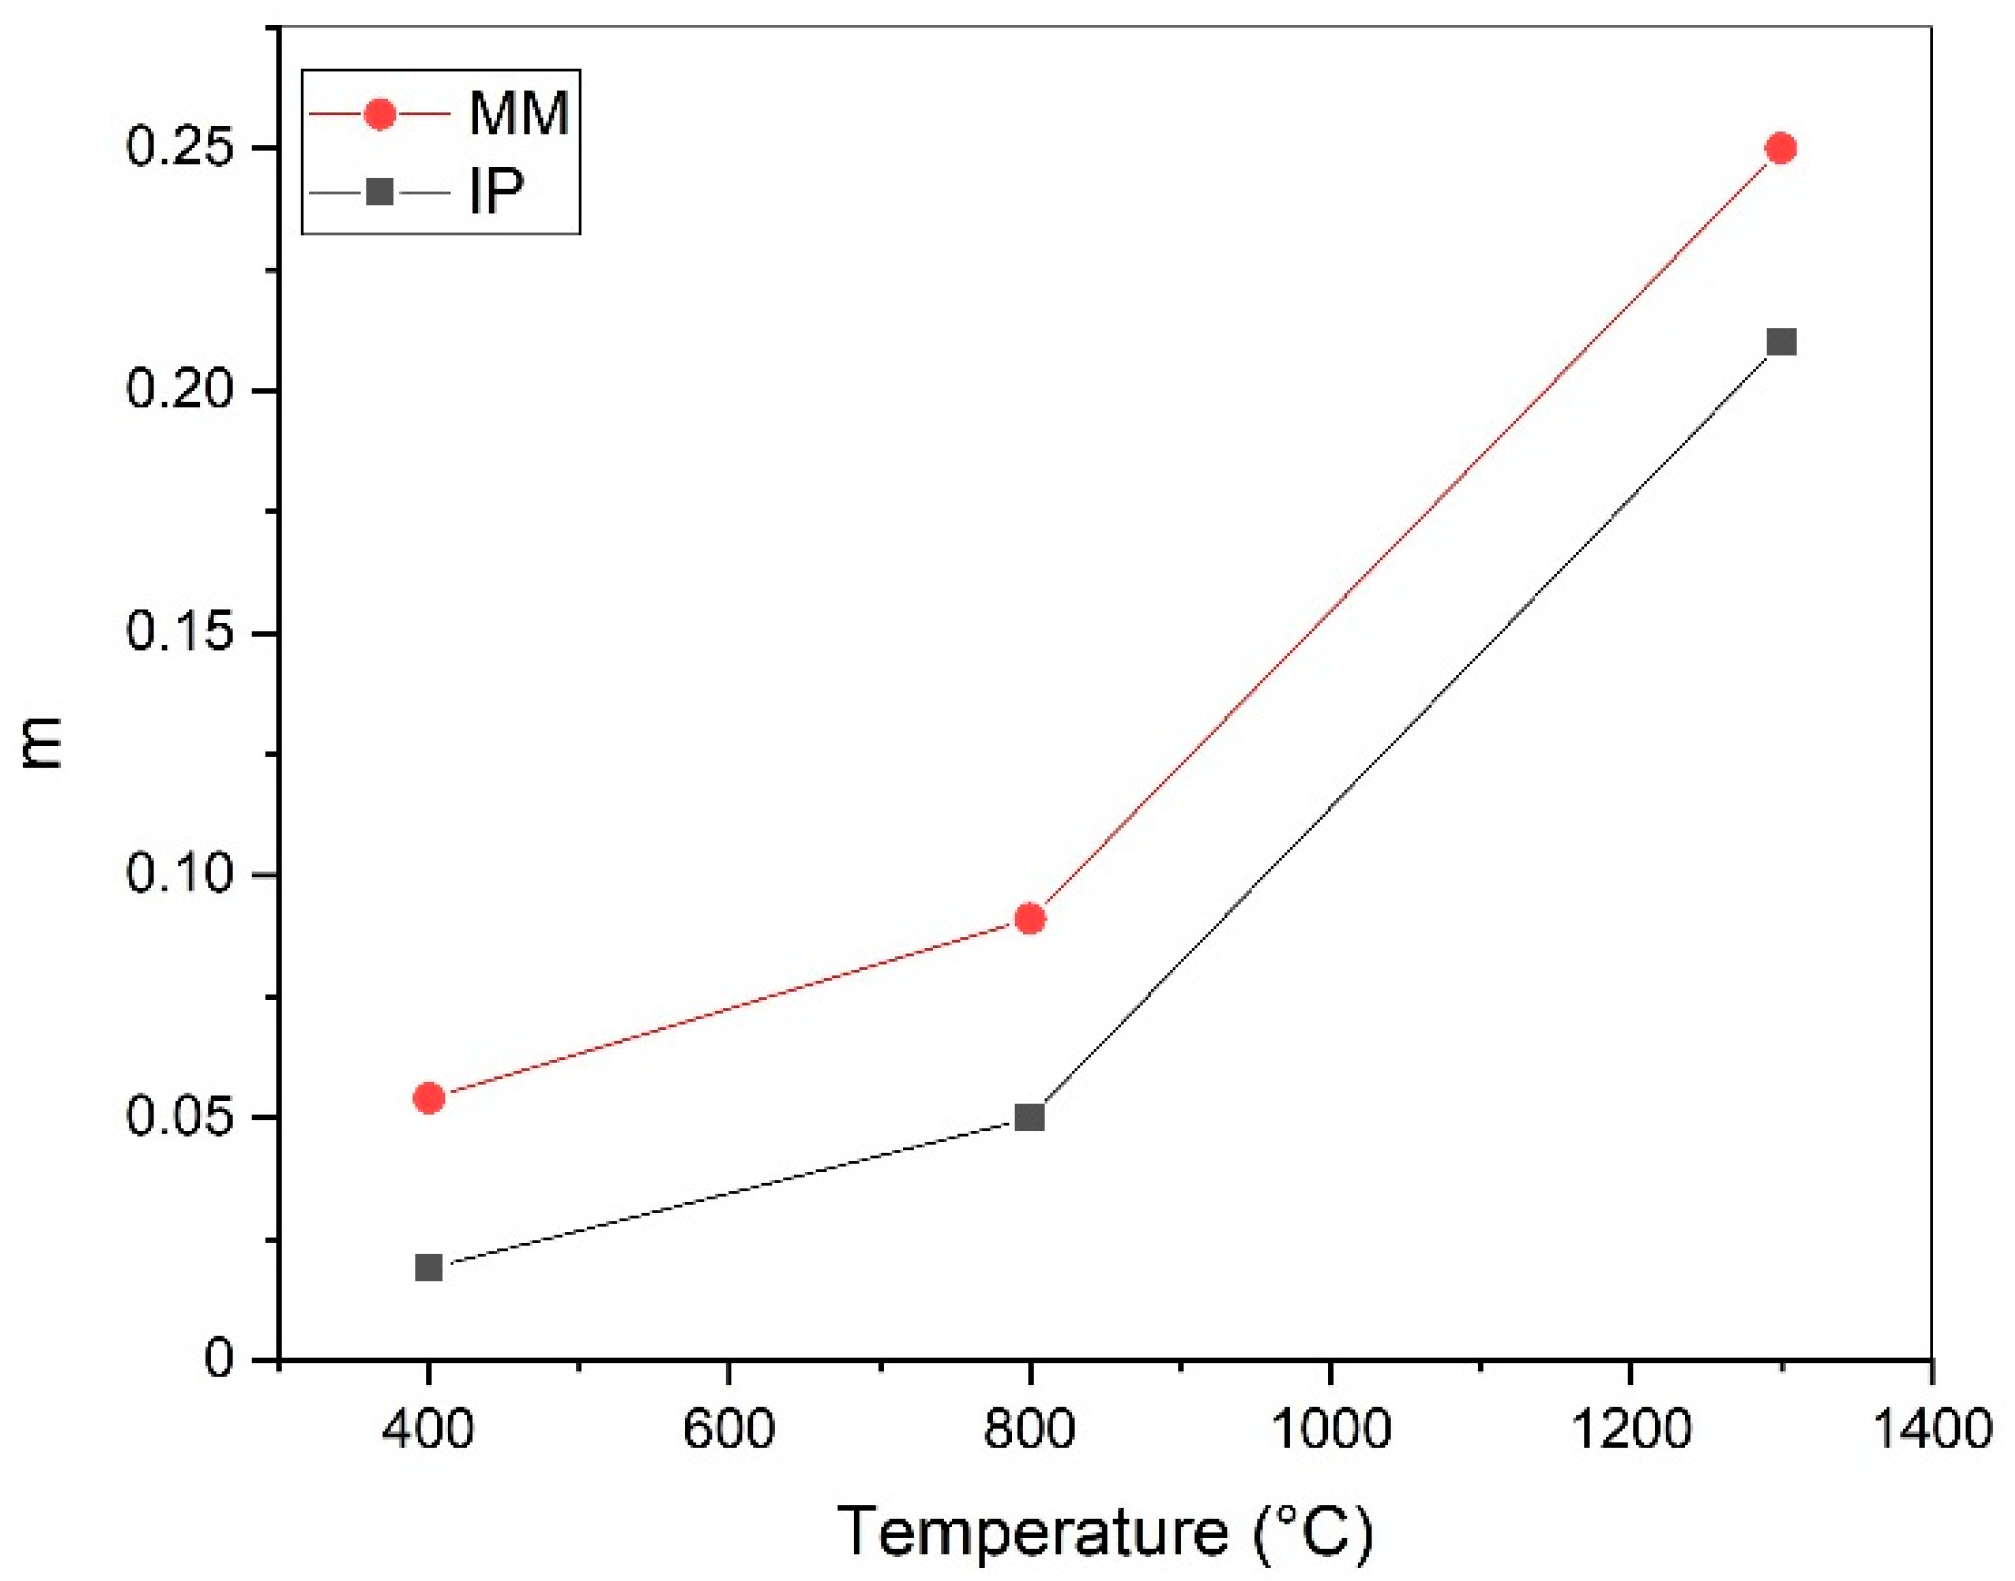
As stated by Formula (3), strain rate sensitivity is calculated as the slope of the σ– ε ˙ curves, plotted in a log–log scale (Figure 8). This kind of measurement is used for the determination of m from a constant strain rate test (CSRT). A strain value ε of 0.05 was chosen for the measurement of m, since at this deformation all the stress–strain curves are in the initial work-hardening step before reaching the peak flow stress. Values of strain rate sensitivity m, calculated as shown in Figure 8, are summarized in Table 2 and plotted in Figure 9 as a function of temperature. It can be seen that m increases slowly between 400 °C and 800 °C and then the increase is much more consistent between 800 and 1300 °C. It is well known, in fact, that the increase in strain rate sensitivity with temperature has a steep rise for the homologous temperature TH = T/Tm > 0.5–0.6 (the homologous temperature describes the operating temperature relative to the melting temperature of the material). For T/Tm > 0.5, material enters the recrystallization regime, and above this temperature, the increase in m with temperature is much higher [37]. In the present research, the three temperatures selected for hot compression tests correspond to 0.39 Tm, 0.62 Tm, and 0.91 Tm, respectively, so it is reasonable to have a much higher increase in m between 0.62 Tm and 0.91 Tm than below 0.62 Tm. Moreover, for elevated temperatures (1300 °C = 0.91 Tm), diffusion creep could be largely responsible for deformation, and in this condition, the material is very sensitive to the change in the deformation rate (i.e., it has a high strain rate sensitivity) [38]. When polycrystalline metals are deformed at high temperatures, diffusion creep occurs via the transport of atoms through the grains or along the grain boundaries. This diffusive transport of atoms through the lattice from compressed sites to tensile sites of grain boundaries is known as Nabarro–Herring (NH) creep and results in elongated grains. When mass transport is along grain boundaries, it is known as Coble creep [39,40,41]. Coble creep is favored at lower temperatures because the activation energy for grain boundary diffusion is lower, whereas NH creep is more active at high homologous temperatures. The mechanism of creep is also influenced by the grain size, Coble creep being dominant at very fine grain sizes whereas NH creep occurs in the case of larger grain sizes. In light of all these considerations, and taking into account the microstructural analysis of the samples deformed at 1300 °C, which will be shown in the next paragraph, it can be stated that in the present investigation the mechanism responsible for deformation at the highest temperature is the Nabarro–Herring creep.
The comparison of the strain rate sensitivities of IP and MM nickel shows higher values of m for MM nickel. The same difference was also observed at room temperature by Ameyama in a previous paper [32]. The strain rate sensitivity values of coarse-grained nickel at room temperature reported in the literature are in the range of m = 0.004–0.005 [42,43]. Wang also found very low values of m for coarse-grained Ni up to 200 °C [44]. The literature data for pure Ni in the range of 800–1000 °C reports a mean value of m = 0.21, which is in line with our results [24].
In the case of very fine grain size, the strain rate sensitivity values reported in the literature are higher if compared to the ones of the corresponding coarse-grained material, as observed by different authors [45,46,47]. The values of m at RT for a nanocrystalline Ni were found in the range of 0.01–0.03, i.e., one order of magnitude higher than the m values of a coarse-grained pure Ni [44,48,49]. Sharma reports m = 0.28 for an nc Ni at 300 °C [50]. In the present investigation, since the grain sizes of IP and MM are not so different, the m values are closer, even if they are always higher for MM.

3.4. Activation Volume

The strain rate sensitivity and activation volume for the plastic deformation V are related in the following equation [51]:
m = 3 k T V   σ f
where k is the Boltzmann constant, T is the absolute temperature, σf is the flow stress and V is the activation volume. The activation volume conveys the volume which is physically covered by dislocation from a base equilibrium state to an activated state after the deformation; therefore, an analysis of this parameter (together with m) can shed light on the rate-controlling mechanisms in the plastic deformation of metals, giving indications about the dislocation mechanisms governing the plastic deformation [52]. For example, diffusional mechanisms, such as Nabarro–Herring and Coble creep, are characterized by activation volumes of about the atomic volume (=b3 where b is the Burgers vector). Similar values are expected for grain boundary sliding. Dislocation movement (through a dislocation forest) in normal polycrystalline materials has, instead, activation volumes of the order of 1000 b3 [53].
In the present research, V, which is normally expressed as a function of the Burgers vector b (b = 0.249 nm for Ni), has been calculated using Equation (4) and the values found are reported in Table 3. As observed by other authors, referring to Ni and also Cu, the activation volume is lower in the case of a lower grain size [52]. For both IP and MM nickel, V increases with temperature because of the consistent decrease in σf, which exceeds the corresponding increase in m. In previous research works, very different values of V were found for nickel, depending on the initial microstructural features, in particular its grain size. For coarse-grained Ni, an activation volume V of about 1900 b3 was found by Dalla Torre [42]. This value decreases with the amount of strain applied during a deformation test. In the same paper, for a nanocrystalline Ni (grain size ~20 nm) an activation volume in the range 20–50 b3, i.e., two orders of magnitude lower than that of coarse-grained Ni, was measured, confirming the significant influence of the grain size on this parameter. In the present investigation, since the grain size difference between IP and MM is not so consistent, the difference between the activation volumes of the two materials is also not so high. Maier indicated values of V around 10 b3 for an nc Ni, whereas for a coarse-grained Ni they were higher than 100 b3 [51]. The mechanisms related to low activation volumes in nc materials are due to thermally activated diffusion processes at grain boundaries or the small volumes around these boundaries [47,54]. The MM samples have lower activation volumes than the corresponding IP, since they have a higher grain boundary surface on which these deformation processes are concentrated. Different mechanisms were proposed to explain the interaction of dislocations with the grain boundary that account for the very small activation volumes encountered in nanocrystalline metals or fine-grained metals, having smaller subgrain/cell/domain sizes [44]. MM samples being produced by mechanical milling (i.e., deformation) contain a certain amount of fine grains and subgrains on which the interaction with dislocations is concentrated, especially at the lowest temperature (400 °C). In accordance with this, the lowest values of V (V ≤ 6b3) were measured at 400 °C in the MM sample. In the present investigation, activation volumes are quite low at each temperature. At 400 and 800 °C, this could be due to the contribution of dislocation cross-slip, which, in conventional coarse-grained fcc metals, entails an activation volume of 10 b3–100 b3 [55], while at the highest temperature (1300 °C), the contribution of diffusion creep and grain boundary sliding, which also involve very low activation volumes, could be responsible for the low values of V [53].

3.5. Microstructural Analysis

The microstructures of the IP and MM samples after deformation are reported in Figure 10 and described as follows in relation to the deformation temperature:
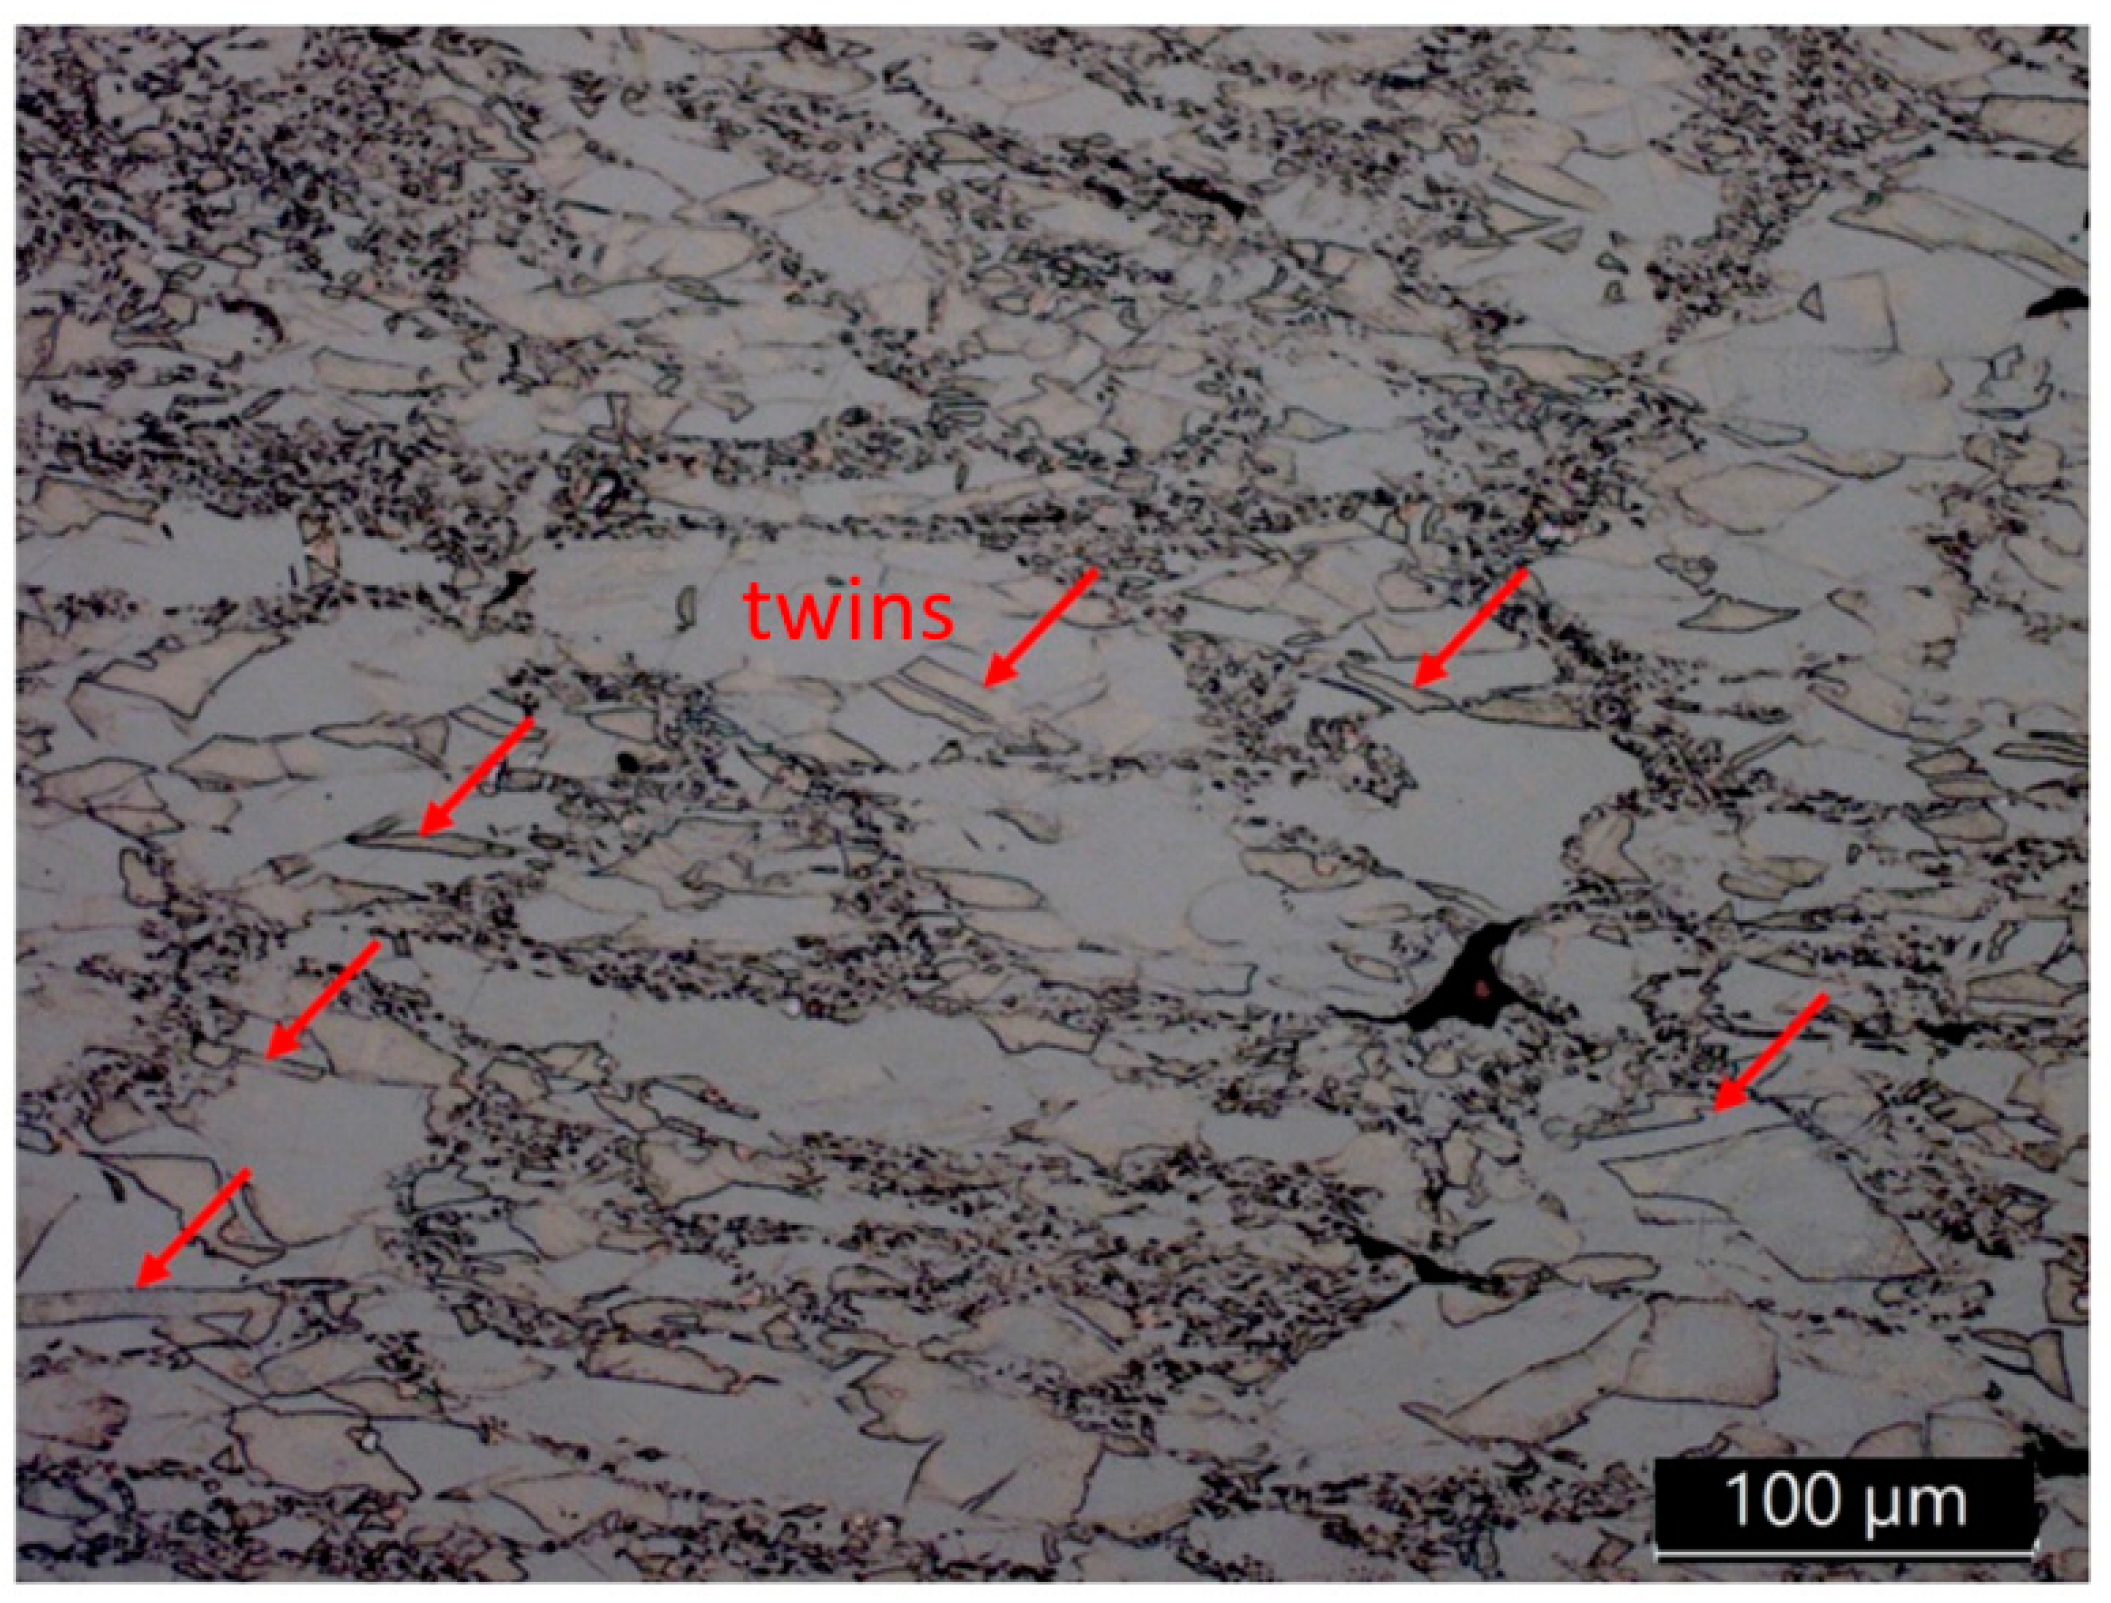
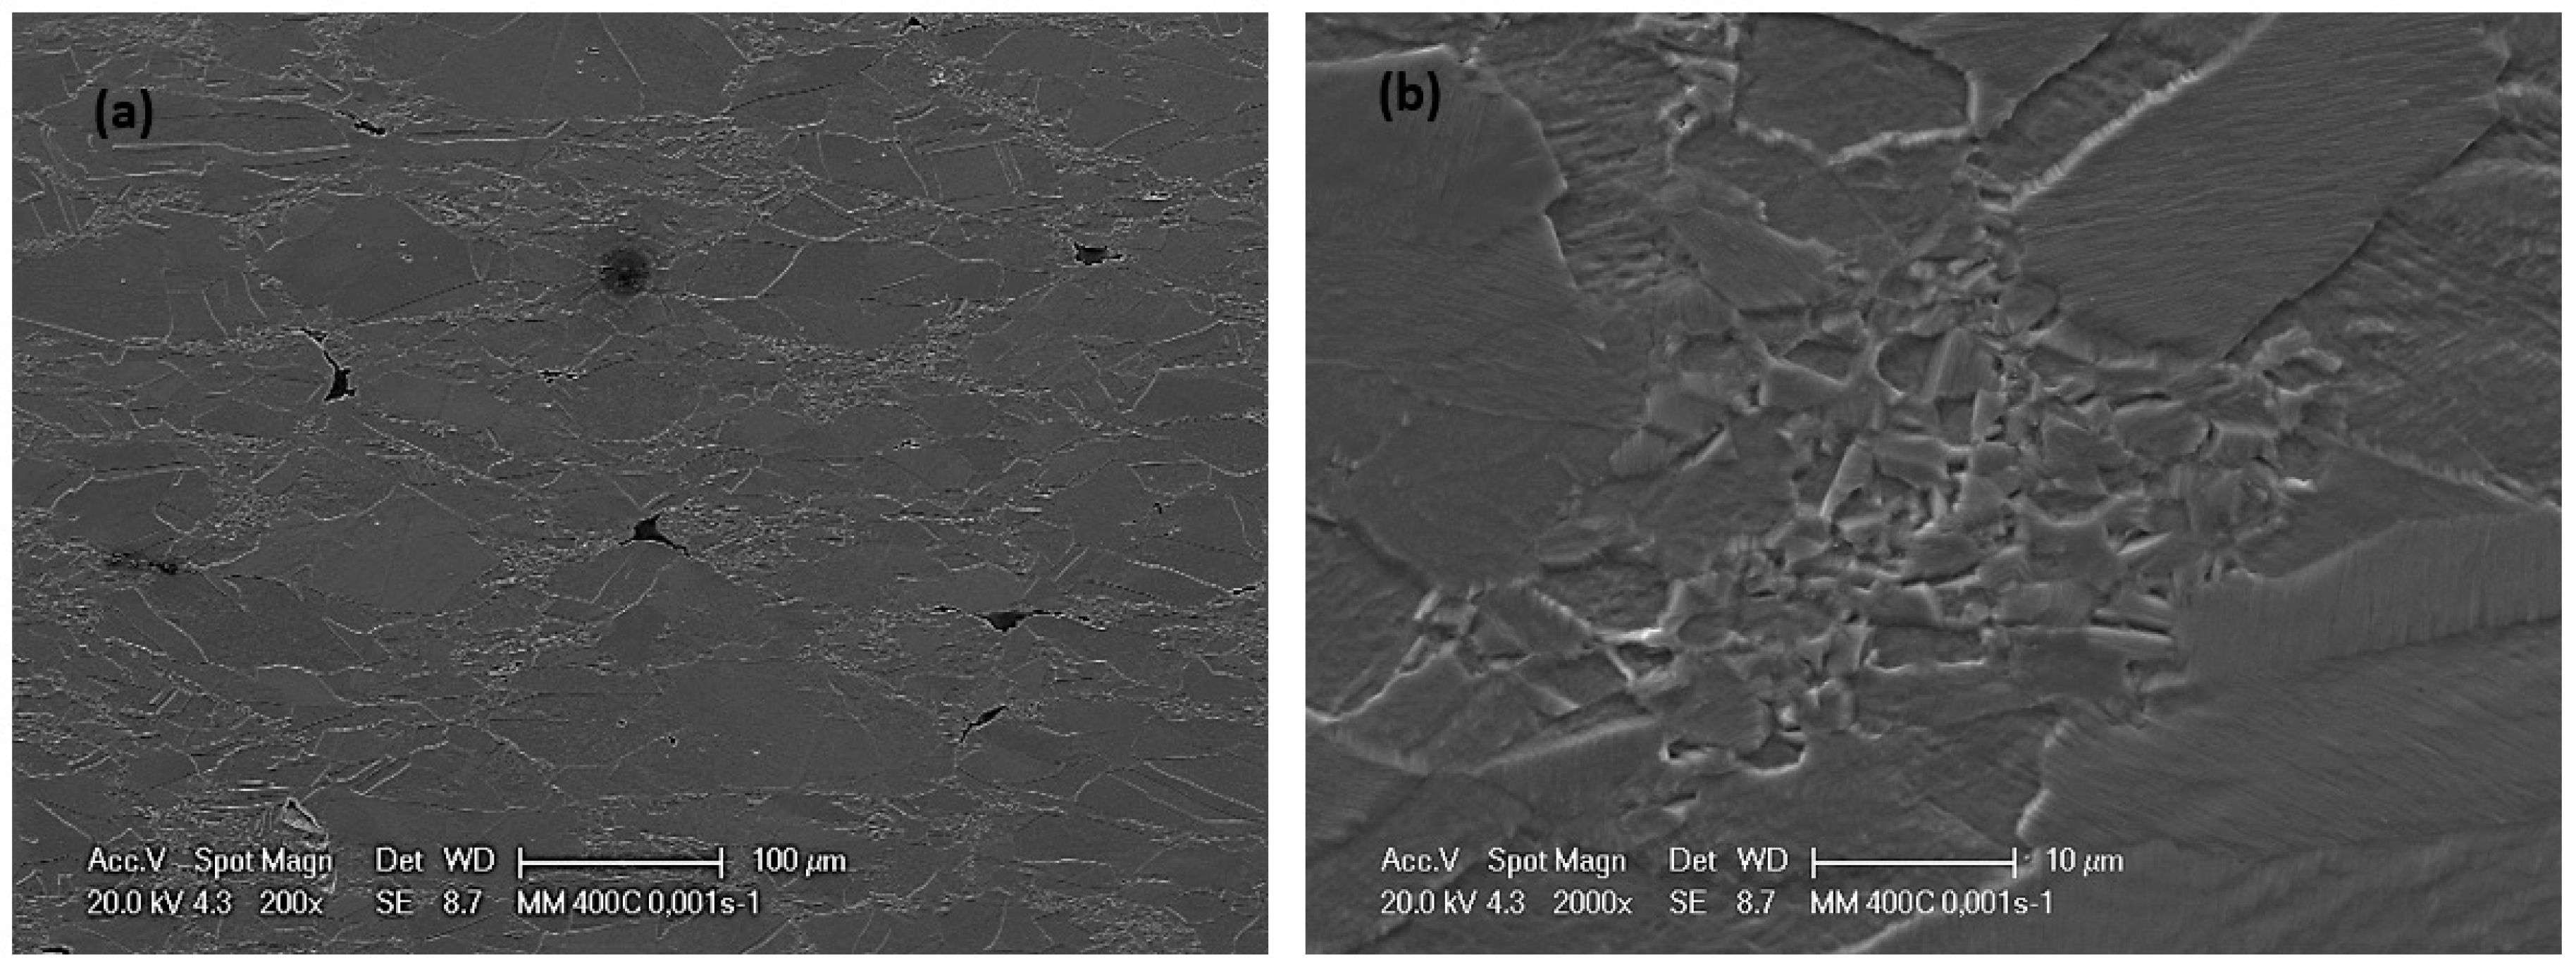
  • At 400 °C, the IP samples show the original powder particles deformed perpendicularly to the compression direction (indicated with arrows in Figure 10a), together with a closure of the initial pores. No traces of recrystallized areas are visible at the lowest strain rate ( ε ˙ = 0.001 s−1) since DRX has just barely initiated at this temperature. In addition, in the MM samples, the grains (cores and shell) are elongated perpendicularly to the compression direction. Moreover, in this material, a consistent twinning phenomenon is observed. The nucleation of twins in high deformation energy areas such as grain boundaries, impurities, or dislocation pile-ups occurs in Ni, which has a low stacking fault energy, at this temperature. This phenomenon indicates that the MM samples have a greater deformation level than the IP samples, in which twinning was not detected. Twinning is shown in Figure 11, which reports sample MM deformed at 400 °C–0.1 s−1. In the MM sample deformed at the lowest strain rate, recrystallization starts to be evident, as shown in the SEM picture of Figure 12. The finer grain size in the cores and in the shell is indeed very clear. The recrystallization is induced by the higher deformation level of MM with respect to the corresponding IP sample and confirmed by the lower value of εc (Table 1).
  • At 800 °C, both the IP and MM materials show a recrystallized microstructure (Figure 13a,b), even if the maximum peak stress is not observed on the compression curve of MM at the highest strain rate of 0.1 s−1, but the corresponding critical deformation value εc = 0.21 (Table 1) confirms the start of DRX. The grain size is higher in both materials at the lowest strain rate ( ε ˙ = 0.001 s−1) because a certain amount of grain growth occurs at this strain rate, which, on the contrary, has less time to occur when the test is carried out at ε ˙ = 0.01s−1 and ε ˙ = 0.1 s−1. Recrystallization is responsible for the flow softening observed in the stress–strain curves of both materials at the lowest strain rates, and for the consistent decrease in peak flow stress measured at this temperature. The sample MM, deformed at the lowest strain rate, shows, at this temperature, an increase in the grain size with respect to the same specimen deformed at 400 °C, which already exhibited a recrystallized microstructure. Comparing MM samples deformed at 800 °C and 400 °C at the same strain rate (Figure 13b vs. Figure 11), a smaller grain size is evident at 800 °C due to the recrystallization that occurred at this temperature.
  • At 1300 °C, there is a significant grain growth in both IP and MM materials. In sample IP, deformed at the lowest strain rate, the formation of wedge-type pores was observed, because, at this temperature (homologous temperature TH = 0.91), diffusion creep mechanisms are active and induce grain boundary sliding and, therefore, the formation of wedge-type pores, occurring to accommodate space problems between simultaneously sliding grains, especially at the triple grain junctions. Flattened grains (grains with a preferred orientation) and the increase in grain size, which are clearly visible at this temperature, are other microstructural indications that the material was deformed by diffusion creep. In the MM specimens, the microstructure seems to also have harmonic features at this extremely high temperature, but the shell areas disappeared because of grain growth, leaving behind the traces of some oxides present on the grain boundaries of the shell zone, as shown in the SEM analysis of Figure 14. The EDXS analysis carried out on the area is shown in Figure 14b, which is rich in very small precipitates, and empty precipitate sites, from which they were probably removed during polishing, reveal the presence of oxygen. Ni oxides could have partially formed during the milling process and partially precipitated during the high-temperature tests [56].

4. Conclusions

Harmonic-structured pure Ni, produced via mechanical milling (MM) and SPS, was tested under hot compression and compared with conventional Ni, obtained through the same powder metallurgy route but using the initial powder (IP) without any milling process. Hot compression tests were carried out at three different temperatures and strain rates.
It was observed that due to the peculiar bimodal grain size distribution of harmonic structured MM Ni:
  • The peak flow stress required for hot compression, strain hardening exponent n, and strain rate sensitivity m is higher for MM than in IP Ni;
  • The occurrence of dynamic recrystallization is promoted by the peculiar bimodal microstructure of MM Ni, specifically by its heavily deformed shell having a finer grain size;
  • The activation volumes of the MM Ni samples are lower than those of IP due to the lower grain size of this material and the consequent higher grain boundary surface, on which deformation mechanisms concentrate;
  • Increasing the temperature, the difference in flow stress of MM and IP reduces, since both the materials undergo the same deformation mechanisms: DRX at 800 °C and creep at 1300 °C.

Author Contributions

Conceptualization, C.M., B.S., K.A.; methodology, C.M., K.A.; formal analysis, K.A.; investigation, C.M., B.S.; resources, K.A.; writing—original draft preparation, C.M., B.S.; writing—review and editing, C.M., B.S., K.A.; supervision, K.A. All authors have read and agreed to the published version of the manuscript.

Funding

This research received no external funding.

Institutional Review Board Statement

Not applicable.

Informed Consent Statement

Not applicable.

Data Availability Statement

The data presented in this study are available on request from the corresponding author.

Conflicts of Interest

The authors declare no conflict of interest.

References

  1. Tsuji, N.; Okuno, S.; Koizumi, Y.; Minamino, Y. Toughness of ultrafine grained ferritic steels fabricated by ARB and annealing process. Mater. Trans. 2004, 45, 2272–2281. [Google Scholar] [CrossRef] [Green Version]
  2. Ritchie, R.O. The conflicts between strength and toughness. Nat. Mater. 2011, 10, 817–822. [Google Scholar] [CrossRef] [PubMed]
  3. Wu, X.; Yang, M.; Yuan, F.; Wu, G.; Wei, Y.; Huang, X.; Zhu, Y. Heterogeneous lamella structure unites ultrafine-grain strength with coarse-grain ductility. Proc. Natl. Acad. Sci. USA 2015, 112, 14501–14505. [Google Scholar] [CrossRef] [PubMed] [Green Version]
  4. Wang, Y.; Chen, M.; Zhou, F.; Ma, E. High tensile ductility in a nanostructured metal. Nature 2002, 419, 912–915. [Google Scholar] [CrossRef] [PubMed]
  5. Wei, Y.; Li, Y.; Zhu, L.; Liu, Y.; Lei, X.; Wang, G.; Wu, Y.; Mi, Z.; Liu, J.; Wang, H.; et al. Evading the strength-ductility trade-off dilemma in steel through gradient hierarchical nanotwins. Nat. Commun. 2014, 5, 3580. [Google Scholar] [CrossRef] [Green Version]
  6. Lu, K. Making strong nanomaterials ductile with gradients. Science 2014, 345, 1455–1456. [Google Scholar] [CrossRef] [PubMed]
  7. Wu, X.; Jiang, P.; Chen, L.; Yuan, F.; Zhu, Y.T. Extraordinary strain hardening by gradient structure. Proc. Natl. Acad. Sci. USA 2014, 111, 7197–7201. [Google Scholar] [CrossRef] [PubMed] [Green Version]
  8. Zhang, Z.; Vajpai, S.K.; Orlov, D.; Ameyama, K. Improvement of mechanical properties in SUS304L steel through the control of bimodal microstructure characteristics. Mater. Sci. Eng. A 2014, 598, 106–113. [Google Scholar] [CrossRef] [Green Version]
  9. Vajpai, S.K.; Ota, M.; Watanabe, T.; Maeda, R.; Sekiguchi, T.; Kusaka, T.; Ameyama, K. The development of high performance Ti-6Al-4V alloy via a unique microstructural design with bimodal grain size distribution. Metall. Mater. Trans. A 2015, 46, 903–914. [Google Scholar] [CrossRef]
  10. Sharma, B.; Nagano, K.; Kawabata, M.; Ameyama, K. Microstructure and mechanical properties of hetero-designed Ti-25Nb-25Zr alloy fabricated by powder metallurgy route. Lett Mater. 2019, 9, 511–516. [Google Scholar] [CrossRef] [Green Version]
  11. Sekiguchi, T.; Ono, K.; Fujiwara, H.; Ameyama, K. New microstructure design for commercially pure titanium with outstanding mechanical properties by mechanical milling and hot roll sintering. Mater. Trans. 2010, 51, 39–45. [Google Scholar] [CrossRef] [Green Version]
  12. Ameyama, K.; Horikawa, N.; Kawabata, M. Unique mechanical properties of harmonic structure designed materials. Tetsu ToHagane J. Iron Steel Inst. Jpn. 2019, 105, 124–126. [Google Scholar] [CrossRef] [Green Version]
  13. Orlov, D.; Ameyama, K. Critical Assesment 37: Harmonic-structure materials—Idea, status and perspectives. Mater. Sci. Technol. 2020, 36, 517–526. [Google Scholar] [CrossRef] [Green Version]
  14. Mirzadeh, H.; Parsa, M.H.; Ohadi, D. Hot deformation behavior of austenitic stainless steel for a wide range of initial grain size. Mater. Sci. Eng. A 2013, 569, 54–60. [Google Scholar] [CrossRef]
  15. Nagata, M.; Horikawa, N.; Kawabata, M.; Ameyama, K. Effects of microstructure on mechanical properties of harmonic structure designed pure Ni. Mater. Trans. 2019, 60, 1914–1920. [Google Scholar] [CrossRef] [Green Version]
  16. Wang, Y.; Zhen, L.; Shao, W.Z.; Yang, L.; Zhang, X.M. Hot working characteristics and dynamic recrystallization of delta-processed superalloy 718. J. Alloys Compd. 2009, 474, 341–346. [Google Scholar] [CrossRef]
  17. Chen, X.M.; Lin, Y.C.; Wen, D.X.; Zhang, J.L.; He, M. Dynamic recrystallization behavior of a typical nickel-based superalloy during hot deformation. Mater. Des. 2014, 57, 568–577. [Google Scholar] [CrossRef]
  18. Menapace, C.; Sartori, N.; Pellizzari, M.; Straffelini, G. Hot deformation behavior of four steels: A comparative study. J. Eng. Mater. Technol. Trans. ASME 2018, 140, 021006. [Google Scholar] [CrossRef]
  19. Yagi, K.; Sharma, B.; Kawabata, M.; Ameyama, K. Fabrication of SUS316L harmonic structure compacts by bi-modal milling process. J. Jpn. Soc. Powder Powder Metall. 2020, 67, 239–244. [Google Scholar] [CrossRef]
  20. Molinari, A.; Bisoffi, E.; Menapace, C.; Torralba, J. Shrinkage kinetics during early stage sintering of cold isostatically compacted iron powder. Powd Met. 2014, 57, 61–69. [Google Scholar] [CrossRef]
  21. Gandhi, C. On fracture initiation mechanisms and dynamic recrystallization during hot deformation of pure nickel. Metall Trans. A Phys. Metall. Mater. Sci. 1982, 13, 1233–1238. [Google Scholar] [CrossRef]
  22. Srinivasan, N.; Prasad, Y.V.R.K. Characterisation of dynamic recrystallisation in nickel using processing map for hot deformation. Mater. Sci. Technol. 1992, 8, 206–212. [Google Scholar] [CrossRef]
  23. Gao, W.L.; Lai, S.Z.; Teng, J.; Du, Z.T.; Liu, X.S.; Chang, Y.W. Flow behavior and microstructural evolution in nickel during hot deformation. Rare Met. 2019, 38, 675–682. [Google Scholar] [CrossRef]
  24. Matougui, N.; Piot, D.; Fares, M.L.; Montheillet, F.; Semiatin, S.L. Influence of niobium solutes on the mechanical behavior of nickel during hot working. Mater. Sci. Eng. A 2013, 586, 350–357. [Google Scholar] [CrossRef]
  25. Luton, M.J.; Sellars, C.M. Dynamic recrystallization in nickel and nickel-iron alloys during high temperature deformation. Acta Metall. 1969, 17, 1033–1043. [Google Scholar] [CrossRef]
  26. Sakai, T.; Jonas, J.J. Overview no. 35 dynamic recrystallization: Mechanical and microstructural considerations. Acta Metall. 1984, 32, 189–209. [Google Scholar] [CrossRef]
  27. Meagher, S.; Borch, R.S.; Groza, J.; Mukherjee, A.K.; Green, H.W. Activation parameters of high-temperature creep in polycrystalline nickel at ambient and high pressures. Acta Met. Mater. 1992, 40, 159–166. [Google Scholar] [CrossRef]
  28. Rice, J. The localization of plastic deformation. In Proceedings of the 14th International Congress on Theoretical and Applied Mechanichs, Delft, The Netherlands, 30 August–4 September 1976; Volume 1, pp. 207–220. [Google Scholar]
  29. Narayana Murty, S.V.S.; Nageswara Rao, B.; Kashyap, B.P. Instability criteria for hot deformation of materials. Int. Mater. Rev. 2000, 45, 15–26. [Google Scholar] [CrossRef]
  30. Staker, M.R.; Stayer, M.R. The relation between adiabatic shear instability strain and material properties. Acta Met. 1981, 29, 683–689. [Google Scholar] [CrossRef]
  31. Sellars, C.M. Recrystallization of metals during hot deformation. Philos. Trans. R. Soc. Lond. Ser. A Math. Phys. Sci. 1978, 288, 147–158. [Google Scholar] [CrossRef]
  32. Ota, M.; Shimojo, K.; Okada, S.; Vajpai, S.K.; Ameyama, K. Harmonic structure design and mechanical properties of pure ni compact. J. Powder Metall. Min. 2014, 3, 122. [Google Scholar] [CrossRef]
  33. Garcia de la Cruz, L.; Martinez Celis, M.; Keller, C.; Hug, E. Exploring the strain hardening mechanisms of ultrafine grained nickel processed by spark plasma sintering. Metals 2021, 11, 65. [Google Scholar] [CrossRef]
  34. Khodabakhshi, F.; Haghshenas, M.; Eskandari, H.; Koohbor, B. Hardness-strength relationships in fine and ultra-fine grained metals processed through constrained groove pressing. Mater. Sci. Eng. A 2015, 636, 331–339. [Google Scholar] [CrossRef]
  35. Bowen, A.W.; Partridge, P.G. Limitations of the Hollomon strain-hardening equation. J. Phys. D Appl. Phys. 1974, 7, 969–978. [Google Scholar] [CrossRef]
  36. Poliak, E.I.; Jonas, J.J. A one-parameter approach to determining the critical conditions for the initiation of dynamic recrystallization. Acta Mater. 1996, 44, 127–136. [Google Scholar] [CrossRef]
  37. Altan, T.; Boulger, F.W. Flow stress of metals and its application in metal forming analyses. ASME Pap. 1973, 95, 1009–1019. [Google Scholar] [CrossRef]
  38. Tjong, S.C.M.Y. Fundamental theories and mechanisms of failure. In Comprehensive Structural Integrity; Elsevier Science, Ltd.: Amsterdam, The Netherlands, 2007. [Google Scholar]
  39. Maryuama, K. Fundamental Aspects of Creep Deformation and Deformation Mechanism Map; Abe, F., Kern, T.-U., Viswanathan, R., Eds.; Creep-Resistant Steels—A Volume in Woodhead Publishing Series in Metals and Surface Engineering; Elsevier: Amsterdam, The Netherlands, 2008. [Google Scholar]
  40. Jenkins, W.D.; Digges, T.G.; Johnson, C.R. Creep of high-purity nickel. J. Res. Natl. Bur. Stand. 1954, 53, 329. [Google Scholar] [CrossRef]
  41. Movchan, B.A.; Dabizha, E.V. A phenomenological model for high-temperature creep in pure nickel. Strength Mater. 1975, 7, 278–283. [Google Scholar] [CrossRef]
  42. Dalla Torre, F.; Spätig, P.; Schäublin, R.; Victoria, M. Deformation behaviour and microstructure of nanocrystalline electrodeposited and high pressure torsioned nickel. Acta Mater. 2005, 53, 2337–2349. [Google Scholar] [CrossRef]
  43. Bui, Q.H.; Dirras, G.; Ramtani, S.; Gubicza, J. On the strengthening behavior of ultrafine-grained nickel processed from nanopowders. Mater Sci. Eng. A 2010, 527, 3227–3235. [Google Scholar] [CrossRef]
  44. Wang, Y.M.; Hamza, A.V.; Ma, E. Temperature-dependent strain rate sensitivity and activation volume of nanocrystalline Ni. Acta Mater. 2006, 54, 2715–2726. [Google Scholar] [CrossRef]
  45. Gray, G.T.; Lowe, T.C.; Cady, C.M.; Valiev, R.Z.; Aleksandrov, I.V. Influence of strain rate & temperature on the mechanical response of ultrafine-grained Cu, Ni, and Al-4Cu-0.5Zr. Nanostruct. Mater. 1997, 9, 477–480. [Google Scholar] [CrossRef]
  46. Schwaiger, R.; Moser, B.; Dao, M.; Chollacoop, N.; Suresh, S. Some critical experiments on the strain-rate sensitivity of nanocrystalline nickel. Acta Mater. 2003, 51, 5159–5172. [Google Scholar] [CrossRef]
  47. Li, Y.J.; Mueller, J.; Höppel, H.W.; Göken, M.; Blum, W. Deformation kinetics of nanocrystalline nickel. Acta Mater. 2007, 55, 5708–5717. [Google Scholar] [CrossRef]
  48. Dalla Torre, F.; Van Swygenhoven, H.; Victoria, M. Nanocrystalline electrodeposited Ni: Microstructure and tensile properties. Acta Mater. 2002, 50, 3957–3970. [Google Scholar] [CrossRef]
  49. Wei, Q.; Jia, D.; Ramesh, K.T.; Ma, E. Evolution and microstructure of shear bands in nanostructured Fe. Appl. Phys. Lett. 2002, 81, 1240–1242. [Google Scholar] [CrossRef]
  50. Sharma, G.; Chatterjee, A.; Paul, B.; Varshney, J.; Chakravartty, J.K. High temperature mechanical behavior of nanocrystalline Ni. Mater. Sci. Eng. A 2013, 576, 69–73. [Google Scholar] [CrossRef]
  51. Maier, V.; Durst, K.; Mueller, J.; Backes, B.; Höppel, H.W.; Göken, M. Nanoindentation strain-rate jump tests for determining the local strain-rate sensitivity in nanocrystalline Ni and ultrafine-grained Al. J. Mater. Res. 2011, 26, 1421–1430. [Google Scholar] [CrossRef] [Green Version]
  52. Wei, Q.; Cheng, S.; Ramesh, K.T.; Ma, E. Effect of nanocrystalline and ultrafine grain sizes on the strain rate sensitivity and activation volume: Fcc versus bcc metals. Mater. Sci. Eng. A 2004, 381, 71–79. [Google Scholar] [CrossRef]
  53. Morris, D. Strengthening mechanisms in nanocrystalline metals. In Nanostructured Metals and Alloys; Series in Metals and Surface Engineering; Woodhead Publishing: Sawston, UK, 2011. [Google Scholar]
  54. Höppel, H.W.; May, J.; Eisenlohr, P.; Göken, M. Strain rate sensitivity of ultrafine grained materials. Z. Met. 2005, 96, 566–571. [Google Scholar] [CrossRef]
  55. Caillard, D.; Martin, J.L. Thermally Activated Mechanisms in Crystal Plasticity; Pergamon Materials Series; Elsevier: Amsterdam, The Netherlands, 2003. [Google Scholar]
  56. Haugsrud, R. On the high-temperature oxidation of nickel. Corros. Sci. 2003, 45, 211–235. [Google Scholar] [CrossRef]
Figure 1. Sintered samples IP (a) and MM (b) nickel; (c) shell area at higher magnification.
Metals 12 00090 g001
Figure 2. (a) Dilatometer used for hot compression tests and (b) the thermomechanical cycle applied.
Metals 12 00090 g002
Figure 3. True stress-true strain curves of IP and MM at different temperatures. (a) IP 400 °C; (b) MM 400 °C; (c) IP 800 °C; (d) MM 800 °C; (e) IP 1300 °C; (f) MM 1300 °C.
Metals 12 00090 g003
Figure 4. Maximum flow stress σp of IP and MM at the three different strain rates. (a) 0.001 s−1; (b) 0.01 s−1; (c) 0.1 s−1.
Metals 12 00090 g004
Figure 5. Strain hardening rate dσ/dε vs. σ of IP and MM samples at 400 °C and different strain rates. (a) 0.001 s−1; (b) 0.01 s−1; (c) 0.1 s−1.
Metals 12 00090 g005aMetals 12 00090 g005b
Figure 6. Strain hardening exponent n of IP and MM samples deformed at the lowest strain rate (0.001 s−1).
Metals 12 00090 g006
Figure 7. Example of dσ/dε vs. σ curve used in the approach of Poliak and Jonas to determine the critical stress for DRX initiation σc.
Metals 12 00090 g007
Figure 8. Example of the determination of strain rate sensitivity at 400 °C.
Metals 12 00090 g008
Figure 9. Strain rate sensitivity vs. the temperature of the two materials at ε = 0.05.
Metals 12 00090 g009
Figure 10. Microstructures of IP and MM deformed samples. (a) IP 400 °C–0.001 s−1; (b) IP 400 °C–0.01 s−1; (c) IP 400 °C–0.1 s−1; (d) MM 400 °C–0.001 s−1; (e) MM 400 °C–0.01 s−1; (f) MM 400 °C–0.1 s−1; (g) IP 800 °C–0.001 s−1; (h) IP 800 °C–0.01 s−1; (i) IP 800 °C–0.1 s−1; (j) MM 800 °C–0.001 s−1; (k) MM 800 °C–0.01 s−1; (l) MM 800 °C–0.1 s−1; (m) IP 1300 °C–0.001 s−1; (n) IP 1300 °C–0.01 s−1; (o) IP 1300 °C–0.1 s−1; (p) MM 1300 °C–0.001 s−1; (q) MM 1300 °C–0.01 s−1; (r) MM 1300 °C–0.1 s−1.
Metals 12 00090 g010
Figure 11. Sample MM deformed at 400 °C–0.1 s−1 with an indication of twins.
Metals 12 00090 g011
Figure 12. SEM pictures of MM deformed at 400 °C–0.001 s−1 at (a) low magnification and (b) high magnification.
Metals 12 00090 g012
Figure 13. SEM picture of (a) sample IP deformed at 800 °C–0.1 s−1 and (b) sample MM deformed at 800 °C–0.1 s−1.
Metals 12 00090 g013
Figure 14. SEM pictures of MM deformed at 1300 °C–0.001 s−1 at (a) low magnification and (b) high magnification, and the (c) EDXS analysis on the area shown in figure (b).
Metals 12 00090 g014
Table 1. εc values of IP and MM samples at different temperatures and strain rates.
Strain Rate
s−1
400 °C800 °C1300 °C
IPMMIPMMIPMM
0.0010.2300.1930.1330.0990.0490.016
0.01--0.2160.1960.0510.040
0.1--0.2220.2100.0660.058
Table 2. Values of strain rate sensitivity (m) of IP and MM.
Temperature IPMM
400 °C0.0190.054
800 °C0.0500.091
1300 °C0.210.25
Table 3. Normalized activation volume (V/b3) of IP and MM materials.
Hot Compression ParametersIPMM
400 °C–0.001 s−1226
400 °C–0.01 s−1215
400 °C–0.1 s−1204
800 °C–0.001 s−13314
800 °C–0.01 s−12811
800 °C–0.1 s−1269
1300 °C–0.001 s−184 34
1300 °C–0.01 s−17423
1300 °C–0.1 s−13111
Publisher’s Note: MDPI stays neutral with regard to jurisdictional claims in published maps and institutional affiliations.