Article

Effect of Ni Concentration on the Surface Morphology and Corrosion Behavior of Zn-Ni Alloy Coatings

1
Corrosion Control Research Cell, Institute of Metallurgy and Materials Engineering, University of the Punjab, Lahore 54590, Pakistan
2
School of Advanced Materials Science & Engineering, Sungkyunkwan University, Suwon 16419, Korea
3
Department of Materials Engineering, The University of British Columbia, Vancouver, BC V6T 1Z4, Canada
*
Authors to whom correspondence should be addressed.
Metals 2022, 12(1), 96; https://doi.org/10.3390/met12010096
Submission received: 14 December 2021 / Revised: 29 December 2021 / Accepted: 29 December 2021 / Published: 4 January 2022

Abstract

:
This research work aims to develop electrodeposited Zn-Ni alloy coatings with controlled dissolution tendencies on a mild steel substrate. The varying Ni concentration in the electroplating bath, i.e., 10, 15, 20 and 25 g·L−1, affected the surface morphology and electrochemical properties of the deposited Zn-Ni alloy coatings. SEM and EDS analysis revealed the resulting variation in surface morphology and composition. The electrochemical behavior of different coatings was evaluated by measuring the open circuit potential and cyclic polarization trends in 3.5 wt.% NaCl solution. The degradation behavior of the electrodeposited Zn-Ni coatings was estimated by conducting a salt spray test for 96 h. The addition of Ni in the coating influenced the coating thickness and surface morphology of the coatings. The coating thickness decreased from 38.2 ± 0.5 μm to 20.7 ± 0.5 μm with the increase in Ni concentration. Relatively negative corrosion potential (<−1074 ± 10 mV) of the Zn-Ni alloy coatings compared to the steel substrate (−969 mV) indicated the sacrificial dissolution behavior of the Zn-rich coatings. On the other hand, compared to the pure Zn (26.12 mpy), ~4 times lower corrosion rate of the Zn-Ni coating (7.85 mpy) was observed by the addition of 25 g·L−1 Ni+2 in the bath solution. These results highlighted that the dissolution rate of the sacrificial Zn-Ni alloy coatings can effectively be tuned by the addition of Ni in the alloy coating during the electrodeposition process.

1. Introduction

In the past decade, cadmium electroplating has been applied to components to enhance the corrosion resistance of the steel substrate. Cadmium electroplating acts as a sacrificial metallic coating. However, due to the carcinogenic and toxic nature of cadmium, cadmium coatings on steel are banned by health and safety organizations all over the world. As a result, coating industries have adopted zinc coatings as a replacement for cadmium coatings [1]. Zinc acts as a sacrificial coating on steel subtract because it is more anodic than steel which helps it in protection from corrosion. The dissolution rate of zinc coatings is high due to the large potential difference between zinc and steel. To overcome, this problem a thick layer of zinc coating is required to ensure a long service life. Zinc coatings are not recommended for use in aggressive and high-temperature environments due to their reactive and sacrificial nature [2,3]. Compared to Fe, Ni presents electropositive potential in aqueous media and when applied on steel structures, could provide a barrier to the electrolyte ingress to the steel substrate. Based on barrier characteristics of Ni coatings, the uniformity of the coatings is an important consideration. Any small defect in the coating could accelerate the localized dissolution of the steel substrate due to galvanic coupling and could be detrimental to the structural integrity of a component. In other words, nickel is noble compared to steel and the effectiveness of Ni plating depends on the uniformity of the coating, without having any defect or porosity, etc. [4]. On the other hand, Zn coating on steel surface dissolves sacrificially and its dissolution rate could be controlled by the addition of different alloying elements in the zinc coating. For instance, the addition of iron, nickel, cobalt, manganese and tin in a sacrificial zinc coating could tune its dissolution character and is considered beneficial to prolong the service life of steel structures [5,6,7,8]. Zn-Ni alloy coatings have wide applications in the automotive, aerospace, and electronics industries [7]. Zn-Ni alloy coatings present better corrosion resistance compared to pure zinc coatings due to the addition of Ni that makes the alloy coatings relatively less active compared to the pure zinc coatings [9,10]. Owing to the more negative reduction potential of zinc compared to Ni, the Zn deposition is expected to lag during the Zn-Ni alloy co-deposition process. However, experimentally during the Zn-Ni co-deposition process, compared to Ni, the more active Zn is deposited in large quantity. The reason for a large amount of Zn deposition is due to the large overpotential for H2 evolution on Zn and its accelerated dissolution rate compared to Ni. The relatively large Zn deposition efficiency compared to Ni in the acidic electrolytes is usually known as the ‘anomalous co-deposition process’ and to explain this anomalous co-deposition of Zn on steel substrate in the presence of Ni, four different models have been proposed, i.e.,: (1) the hydrogen suppression mechanism, (2) the underpotential deposition mechanism, (3) the exchange current density model and (4) the kinematic model [11].
According to the hydrogen suppression mechanism model, the increase in pH at the interface would result in the adsorption of a zinc hydroxide film that could result in a decrease in the Ni deposition. Even at high current densities, the Ni deposition decreases because the Zn hydroxide film offers high resistance. According to the underpotential deposition model, Zn offers unique surface characteristics that help in the continuous co-deposition of Zn and Ni but hinder the sole deposition of the Ni. The exchange current density model explains that the exchange current density of H+/H2 redox couple on the surface of Zn is lower than on Ni and Co owing to their crystal structure, thermodynamics, and kinetic response. On the other hand, according to the kinematic model, the anomalous Zn-Ni co-deposition is due to the slow kinetics of Ni deposition compared to Zn [12,13,14,15]. The percentage of Ni in Zn-Ni alloy coatings is important as 12–15 wt.% Ni is considered optimum in terms of barrier characteristics. Higher amount of Ni content could improve the barrier characteristics of the Zn-Ni coating, but a low Ni concentration could induce a deleterious effect on the dissolution rate [16,17]. For Zn-Ni alloy co-deposition different bath compositions containing cyanide-, sulfamate-, sulphate-, chloride- and pyrophosphate-based species have been used in the past [12]. On the other hand, acid and alkali-based bath compositions could also produce alloy coatings containing 8–15 wt.% Ni. Different phases are formed during Zn-Ni co-deposition, which highly depend on the nickel contents in the coating. For instance, a mixture of η and γ phases is formed in the coatings having less than 10 wt.% Ni content. At high Ni concentrations (10–17 wt.%) a single γ-phase is formed. With further increase in the Ni concentration (>17 wt.%), a mixture of γ and α-phases are formed. These phases affect the mechanical properties of the alloy coating such as the γ-phase presents yield strength of 250 MN m−2 and hardness of 260–400 HV. The γ-phase in the Zn-Ni alloy coating induces internal stresses in the range 190–340 MNm−2. These internal stresses could create micro-cracks in the coating and the network of these micro-cracks could enhance localized attack by the ingress of electrolyte [11].
The current research focuses on the electrodeposition of Zn-Ni alloy coatings on mild steel substrates in acidic sulphate solutions containing varying amounts of Ni. Uniform and defect-free Zn-Ni alloy coatings were produced without the addition of surfactant and surface modifying agents in the electroplating solution. In addition, it is reported that the uniformity and corrosion resistance of the Zn-Ni coated steel can be tuned by controlling the Ni contents in the electroplating bath and in the coatings, which differentiates this work from existing studies. The effect of Ni concentrations on the coating thickness and corrosion resistance properties of the Zn-Ni alloy coatings is analyzed and compared with pure Zn and Ni coatings. Based on electrochemical tests, the mechanism of corrosion protection has been described. With the increase in Ni concentration in the Zn-Ni coatings, the simultaneous decrease in coating thickness and improvement in the corrosion resistance are the unique features of this research work.

2. Experimental

Mild steel (C 0.19 wt.%, Si 0.22 wt.%, Mn 0.4 wt.%, Cr 0.073 wt.% and Fe Bal.) samples having dimensions of 140 mm × 76 mm × 1.94 mm were used as substrate. The surface was cleaned and prepared by wire brushing. A nickel foil anode (99% pure, Alfa Aesar, Tewksbury, MA, USA) with a thickness of 0.5 mm was used for Zn-Ni alloy electroplating while a 98% pure zinc sheet anode with a thickness of 2 mm was used for zinc electroplating.
Table 1 highlights the composition of electroplating baths. For comparison, in addition to the Zn-Ni alloy coatings, pure Zn and Ni electroplated samples were also prepared. Bath pH was adjusted to 2.0 ± 0.1 with the addition of sulfuric acid in deionized water.
A constant current density of 1.5 A-dm−2 was applied by using a D.C power source (Matrix-MPS-300L-3, TME, Lodz, Poland) for one hour. The temperature of the water-jacketed cell containing the bath solutions was maintained at 40 °C by circulating water in an external jacket connected with a water bath. The steel substrate (cathode) and nickel foil (anode) were immersed in the bath solution with the help of a clamp with a separation of ~5 cm. The air was sparged in the bath solutions with the help of pumps during the electroplating process, as shown in Figure 1.
After electroplating, the coated samples and anode (nickel) were removed from the electroplating bath and washed with deionized water to remove any residual electrolyte before placing in an oven at 110 ± 5 °C for 15 min. To measure the coating thickness, the initial and final weight of the coated samples was measured. In the weight gain method, the weight of the substrate before and after the coating was measured to calculate the coating thickness by using Equation (1) [18]:
C o a t i n g   T h i c k n e s s   ( μ m ) = 10 4 w ρ A
where, w is the measured weight of the coating deposit (g), ρ is the density of the coating (g·cm−3) and ‘A’ is the surface area of the cathode (cm2). The density of the coating was measured by using the buoyancy method [18]. For the microscopic coating thickness method, triplicate samples from each coating system having 1 × 1 cm2 surface area were cut and mounted in epoxy resin keeping the cross-section of the coated samples exposed. The coating thickness was measured from the cross-section of the polished samples by using an optical microscope and was confirmed from the weight of the coating. The cathodic current efficiency (CCE) was calculated by using the following relation (Equation (2)) [17]:
%   C a t h o d i c   C u r r e n t   E f f i c i e n c y   =   M e a s u r e d   w e i g h t   g a i n T h e o r t i c a l   w e i g h t   g a i n × 100 =   w E W × I × t F × 100
where, w is the weight of the electrodeposited coating (measured gravimetrically by weighing the substrate before and after the application of coating) (g), EW is the equivalent weight of the deposit (g·equivalent−1), I is the applied current (A), t is the deposition time (s) and F is Faraday’s constant, which is equal to 96,485 C·mole−1.
The surface morphology and elemental mapping were carried out by using scanning electron microscopy coupled with an EDS analyzer (Inspect S 50, FEI, Hillsboro, Oregon, USA). Electrochemical testing was carried out on bare and coated samples in a paint cell having a surface area of 9.06 cm2 and connected with a potentiostat (1000E, Gamry, Warminster, PA, USA). For electrochemical tests, the samples were exposed to 3.5 wt.% NaCl solution. Ag/AgCl (saturated KCl), graphite rod and uncoated/coated samples were used as a reference, auxiliary and working electrodes in this three-electrode cell assembly. The open-circuit potential (OCP) was measured after 2 h of immersion for 1 h and cyclic polarization scans were obtained within −0.5 V and apex potential of 1.5 V vs. OCP with a forward scan rate of 5 mV·s−1. During the reverse scan to final potential −0.5 V with a reserve scan rate of 2.5 mV·s−1 was applied. A salt spray test was conducted on the coated samples according to ASTM B117 standard under 60% relative humidity in a solution containing 5 wt.% NaCl and pH of ~6.8 ± 0.1 at 35 ± 2 °C. The coated samples were cross-hatched on the front side and greased from the backside to assess the protection tendency and localized dissolution behavior of the coated samples. The substrate was placed in a salt spray chamber at the angle of 45° parallel to the flow direction of the saline mist for 96 h.

3. Results and Discussion

3.1. Effect of Ni Concentration on Coating Thickness

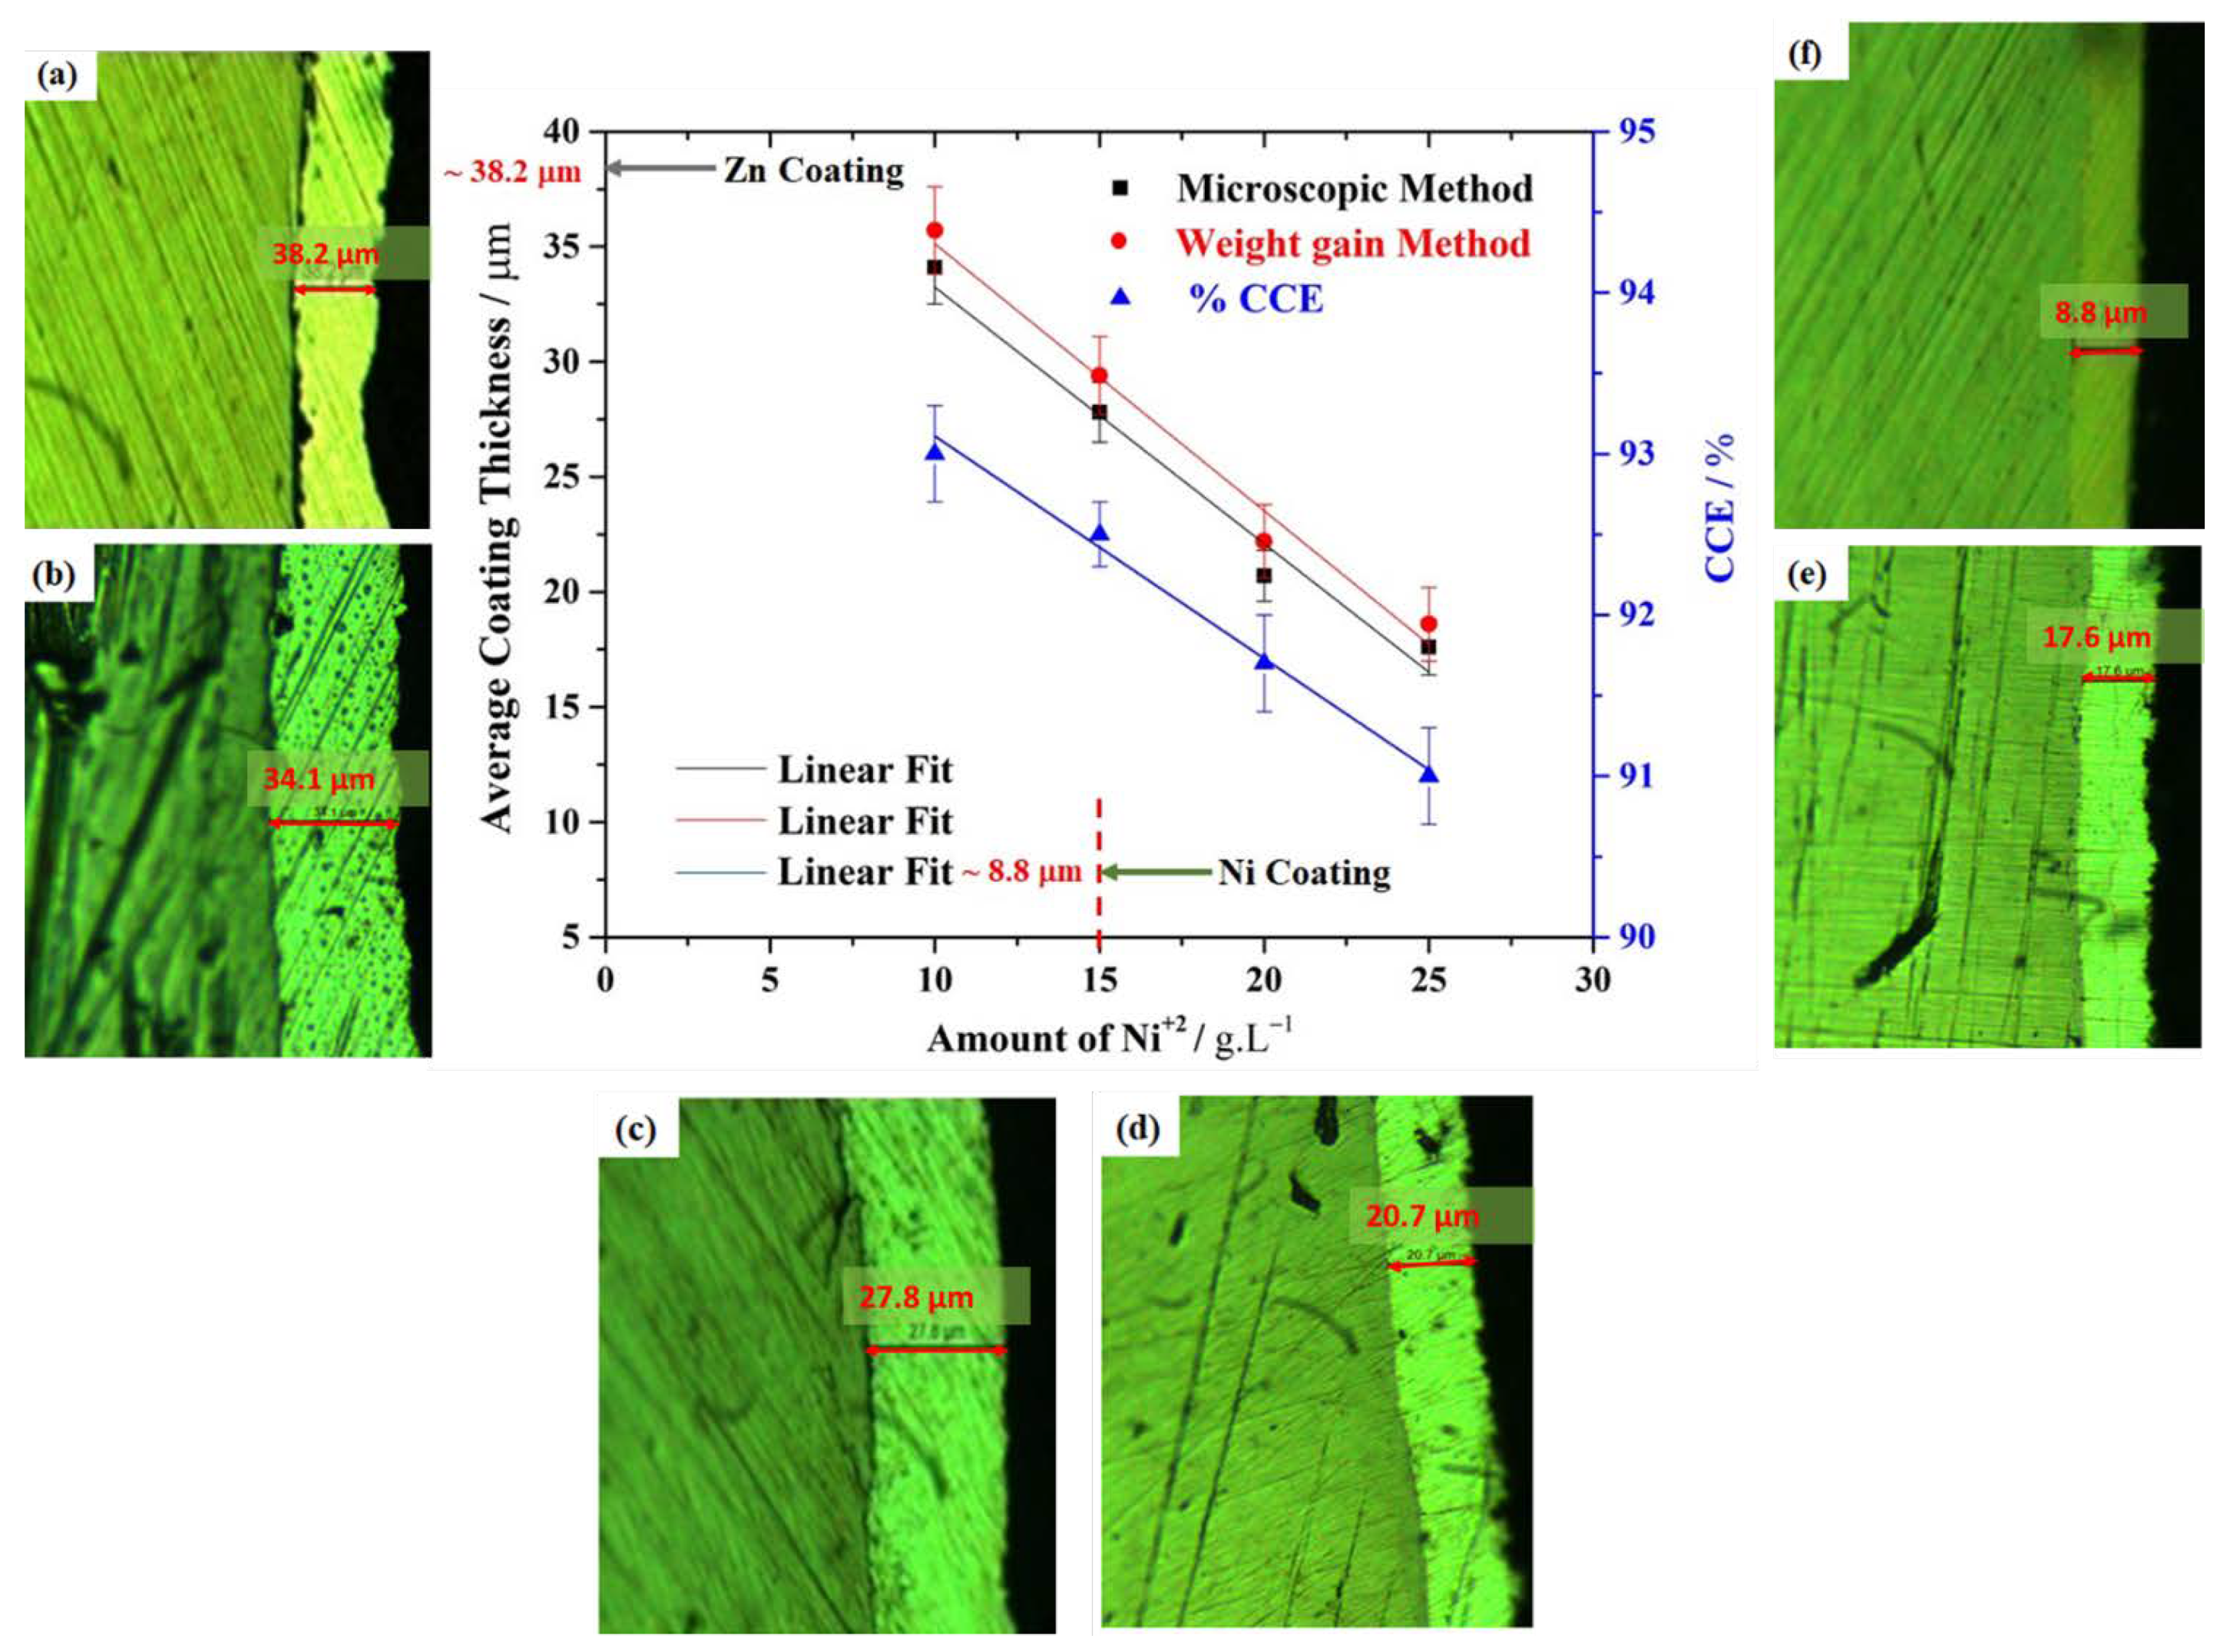
The coating thickness of the electroplated samples was measured by the weight gain and microscopic coating thickness measurements and the results are plotted in Figure 2. The increase in Ni concentration in the electroplating bath solution resulted in a decrease in the overall coating thickness after electrodeposition. For instance, the thickness of the coating in only a Zn-containing bath (without Ni addition) was measured to be 38.2 ± 1.1 µm. The addition of 10 g·L−1 nickel sulphate (Zn-Ni-10) in the bath resulted in the decrease of coating thickness to 34.1 ± 1.6 µm. In the case of Zn-Ni-25, the coating thickness further decreased to 17.6 ± 1.2 µm. The decrease in coating thickness with the increase in nickel content in the bath was due to grain refinement caused by the Zn and Ni co-deposition process. Under the same conditions and a current density of 1.5 A·dm−2, a pure Ni coating thickness was measured to be 8.8 ± 1.3 µm. The results obtained could be explained with the help of an anomalous co-deposition model. During Zn and Ni co-deposition on the steel substrate, the more active (less noble) Zn is deposited preferably in the aqueous electrolyte. Also, during electrodeposition, the H2 evolution occurring preferably on the adsorbed Ni could limit the effective Zn-Ni deposition, as evident in the decrease in coating thickness with the increase in Ni contents in the bath solution. Similarly, the other possible reason for anomalous Zn-Ni co-deposition is associated with the ionic mobility of dissolved Ni species and their limited deposition kinetic compared to Zn [12]. However, at a high Ni concentration in the bath solution, the Ni co-electrodeposition with Zn is possible due to the competitive co-deposition of the dissolved Ni and Zn species. In other words, the increase in Ni concentration in the bath solution, the Zn deposition is controlled by the competitive adsorption of Ni on the steel surface that may suppress the coating growth as evident from the decrease in Zn-Ni coating thickness. Under the applied conditions, in acidic bath solution, the nucleation of Zn-Ni alloy is initiated at the early stage of the electrodeposition process due to the simultaneous surface coverage of dissolved Zn and Ni species at the nucleating sites. The presence of adsorbed Zn on the steel surface could effectively suppress the generation of H2 and promote the formation single-phase Zn-Ni deposit. As a result of the increase in Ni concentration in the electroplating bath, the uniform deposition of the Zn-Ni at the coating/steel interface with an appreciable decrease in the coating thickness was observed.
The effect of cathodic current efficiency (CCE) directly influences the coating thickness and density. These properties depend on the chemical composition of the bath, nature of the deposited species, pH, current density, and temperature of the bath. The occurrence of the side reactions i.e., acidic re-dissolution of Zn coatings, and H2 evolution reaction could significantly affect the CCE. The CCE of the pure Zn coating deposition was ~96% which resulted in the formation of a thick coating (38.2 ± 1.1 µm) on the steel substrate. On the other hand, the CCE of pure Ni electrodeposition was 47% and resulted in a coating thickness of 8.8 ± 1.3 µm. The possible reason for the small CCE value in the Ni bath was related to the concomitant side reactions, i.e., H2 evolution. The electroreduction of H+ ions is relatively fast on the surface of Ni, as estimated from the exchange current density (io) of 4 μA·cm−2, compared to H2 evolution on the surface of Zn (io = 10 nA·cm−2), [19]. The CCE value of Zn-Ni alloy coatings varied between 91–93% and a slight decrease (from 93% to 91%) in the CCE with the increase in the Ni concentration was observed. With an increase in Ni concentration in the bath solution from 10 to 25 g·L−1 a linear decrease in the coating thickness with a slight decrease in CCE validated the progress of unwanted H2 evolution reaction, as displayed in Figure 2. The cross-sectional microstructures of the pure Zn, Zn-Ni alloy and pure Ni coatings are also shown in Figure 2a–f. The Zn-Ni alloy and pure Ni coatings were uniformly deposited on the steel surface and their improved binding characteristics can be estimated from the coating/steel interface microstructure. For instance, in the case of pure Zn and Zn-Ni-10 coatings, the presence of micro-cavities and pores at the coating/steel interface were observed as shown in Figure 2a,b. However, with an increase in Ni concentration in the solution, the coating produced was found to be well intact and smoothly adhered to the steel surface. Based on these results, it was evaluated that the increase Ni concentration in the coating systems could effectively improve the adhesion of the coating as estimated from the uniform binding of the Zn-Ni-15, Zn-Ni-20, Zn-Ni-25, and pure Ni coatings with the steel surface as shown in Figure 2c,d,f, respectively. The coating thickness measured from the cross-sectional images well supported the thickness calculated from the gravimetric method as discussed above.

3.2. Surface Morphology and Composition of the Coatings

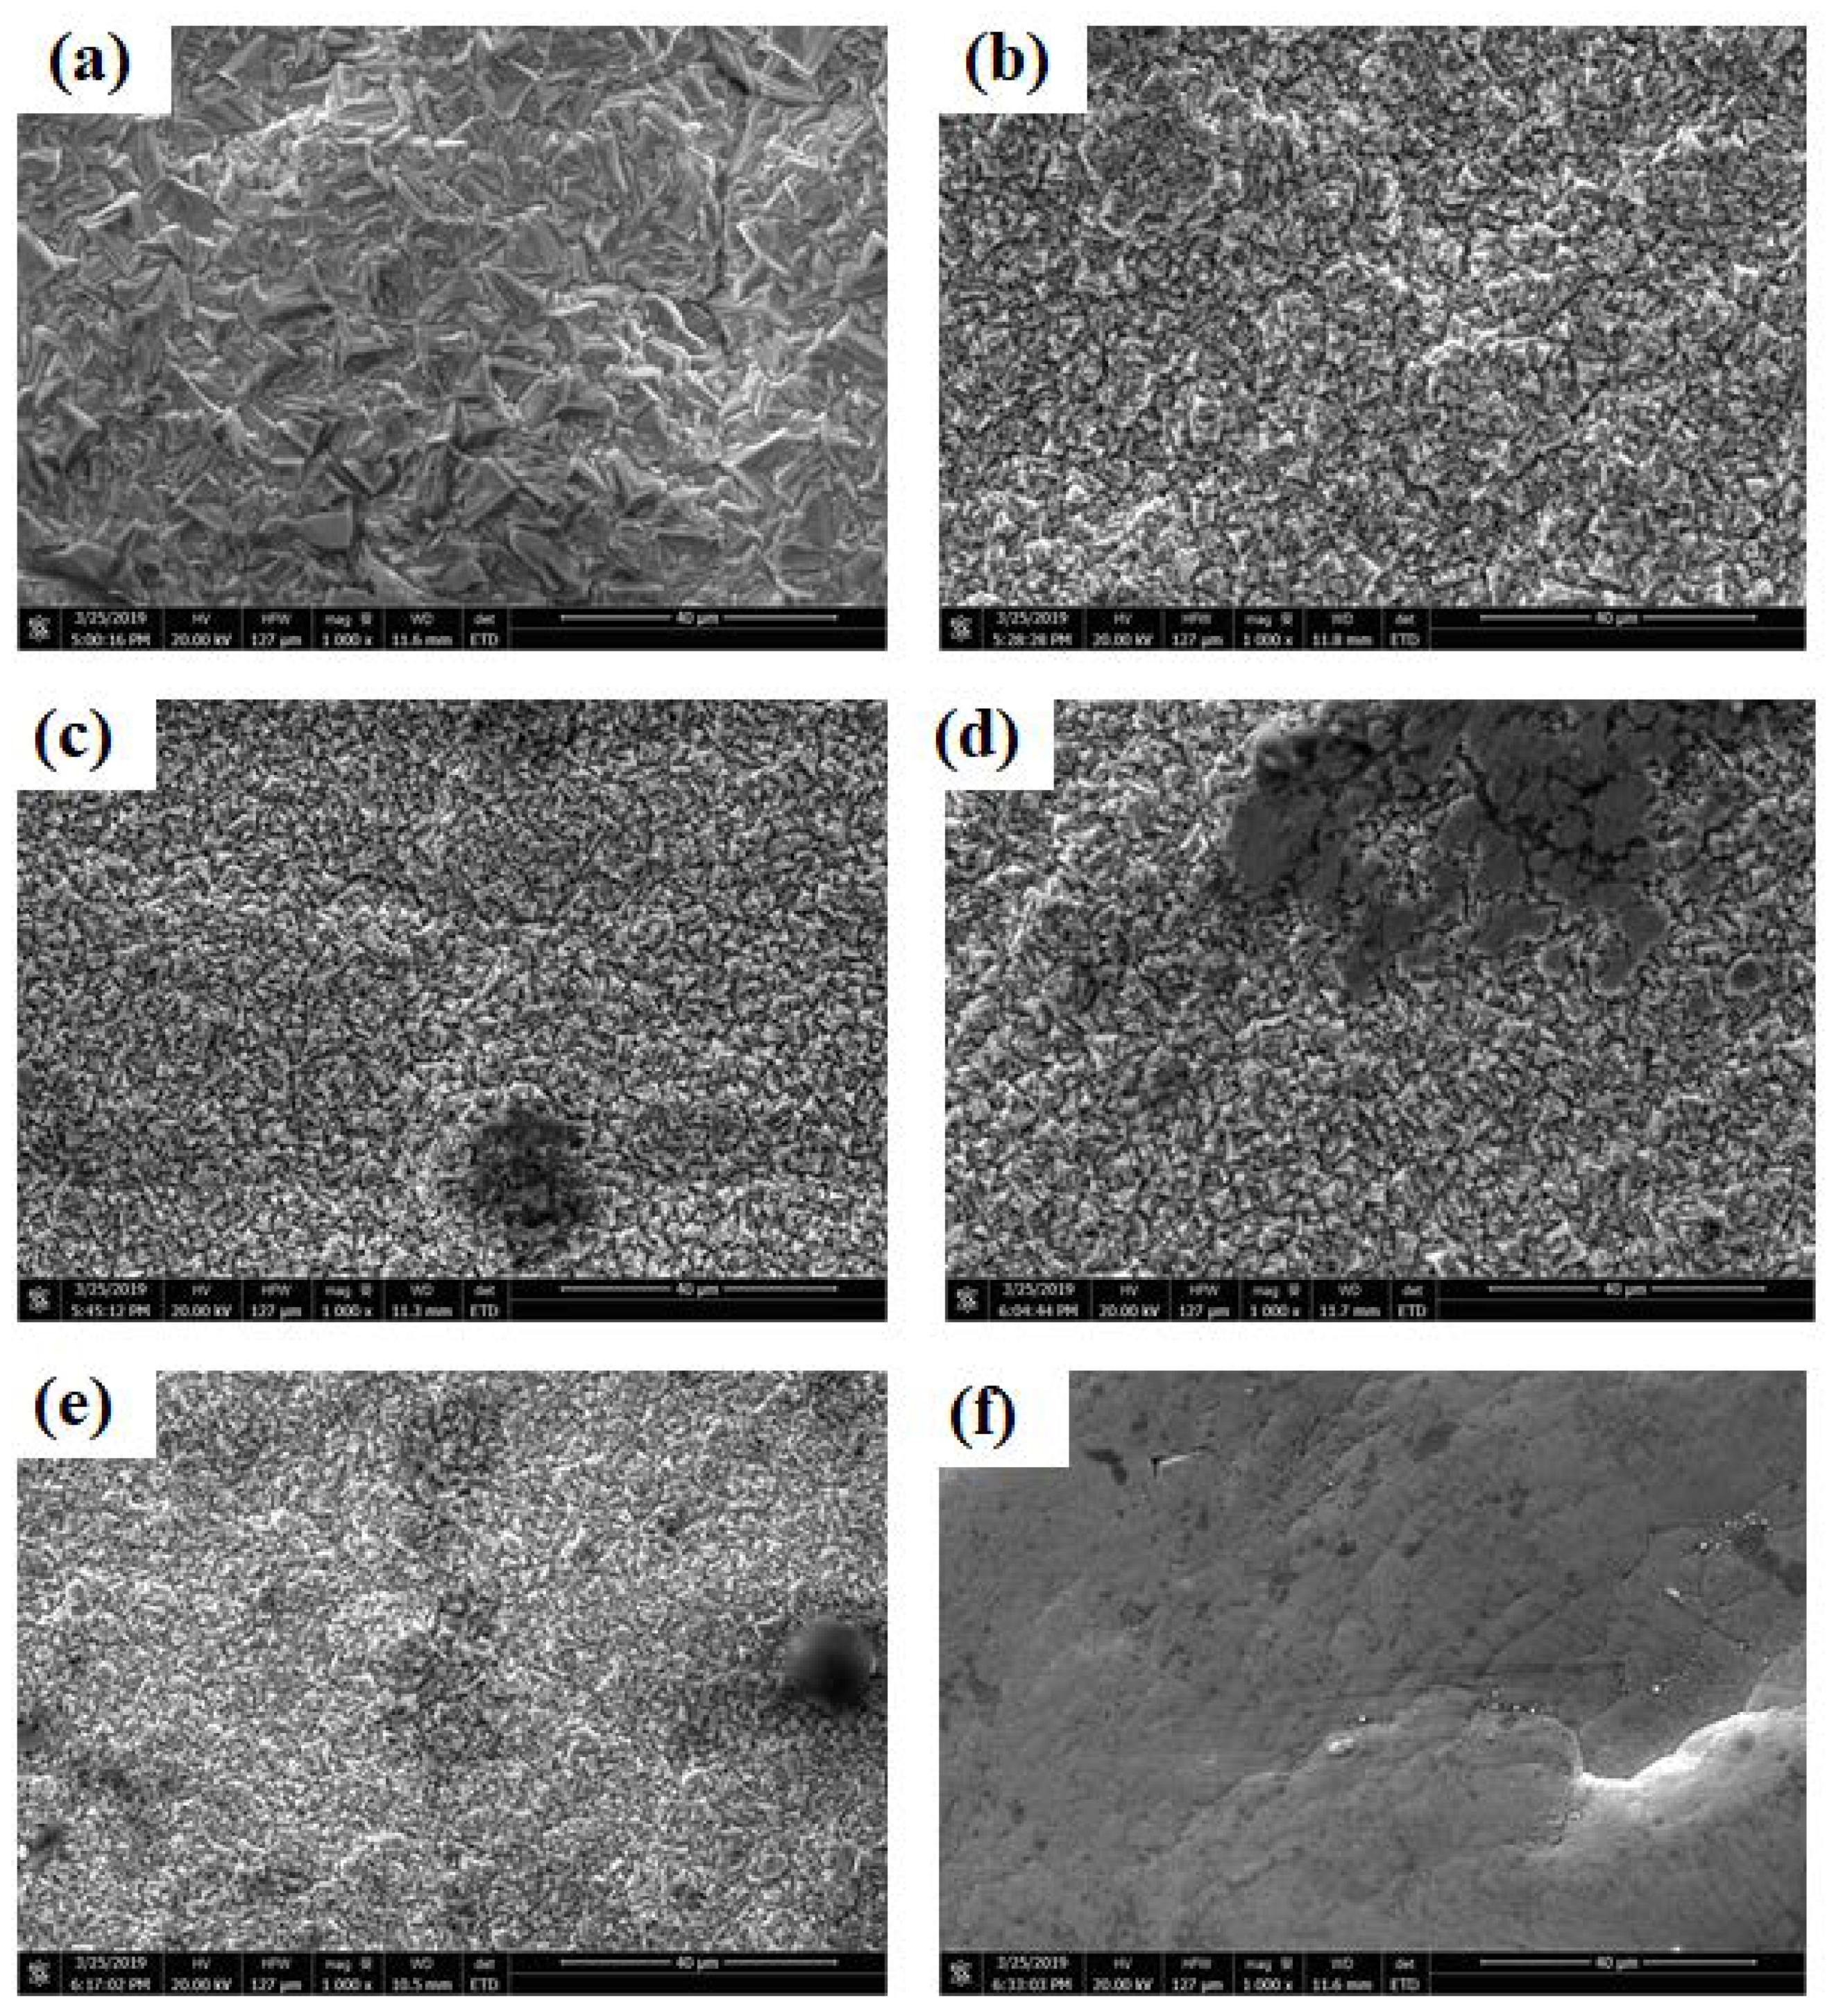
Figure 3 shows the surface morphology of the single-layer zinc, nickel, and Zn-Ni alloy coatings. The SEM image of zinc coating (Figure 3a) shows the typical pyramidal-shaped crystallites however, the addition of Ni species in the electrolytes for depositing a Zn-Ni alloy coating significantly changed the grain structure. With an increase in Ni concentration in the bath solutions, a corresponding decrease in grain size was observed, which is possibly associated with the heterogeneous nucleation and growth of Zn-Ni alloy crystallizes. The Zn-Ni alloy coating bath containing 25 g·L−1 registered the presence of approximately 5.3 wt.% Ni contents in the coating. The formation of fine grain structure was associated with the increase in nucleation sites and the increase in Ni concentration in the Zn-Ni alloy. This resulted in restricted crystallites growth and a decrease in coating thickness [20,21,22]. For instance, the Zn-Ni-25 samples presented the finest grain structure, the highest Ni contents (~5.3 ± 1.0 wt.%) and the lowest coating thickness of about 17.6 ± 1.2 µm among all the Zn-Ni alloy coatings. At the same applied current density, the pure Ni coating presented the formation of a uniformly distributed large size globular shape grain structure on the steel surface, as shown in Figure 3f.
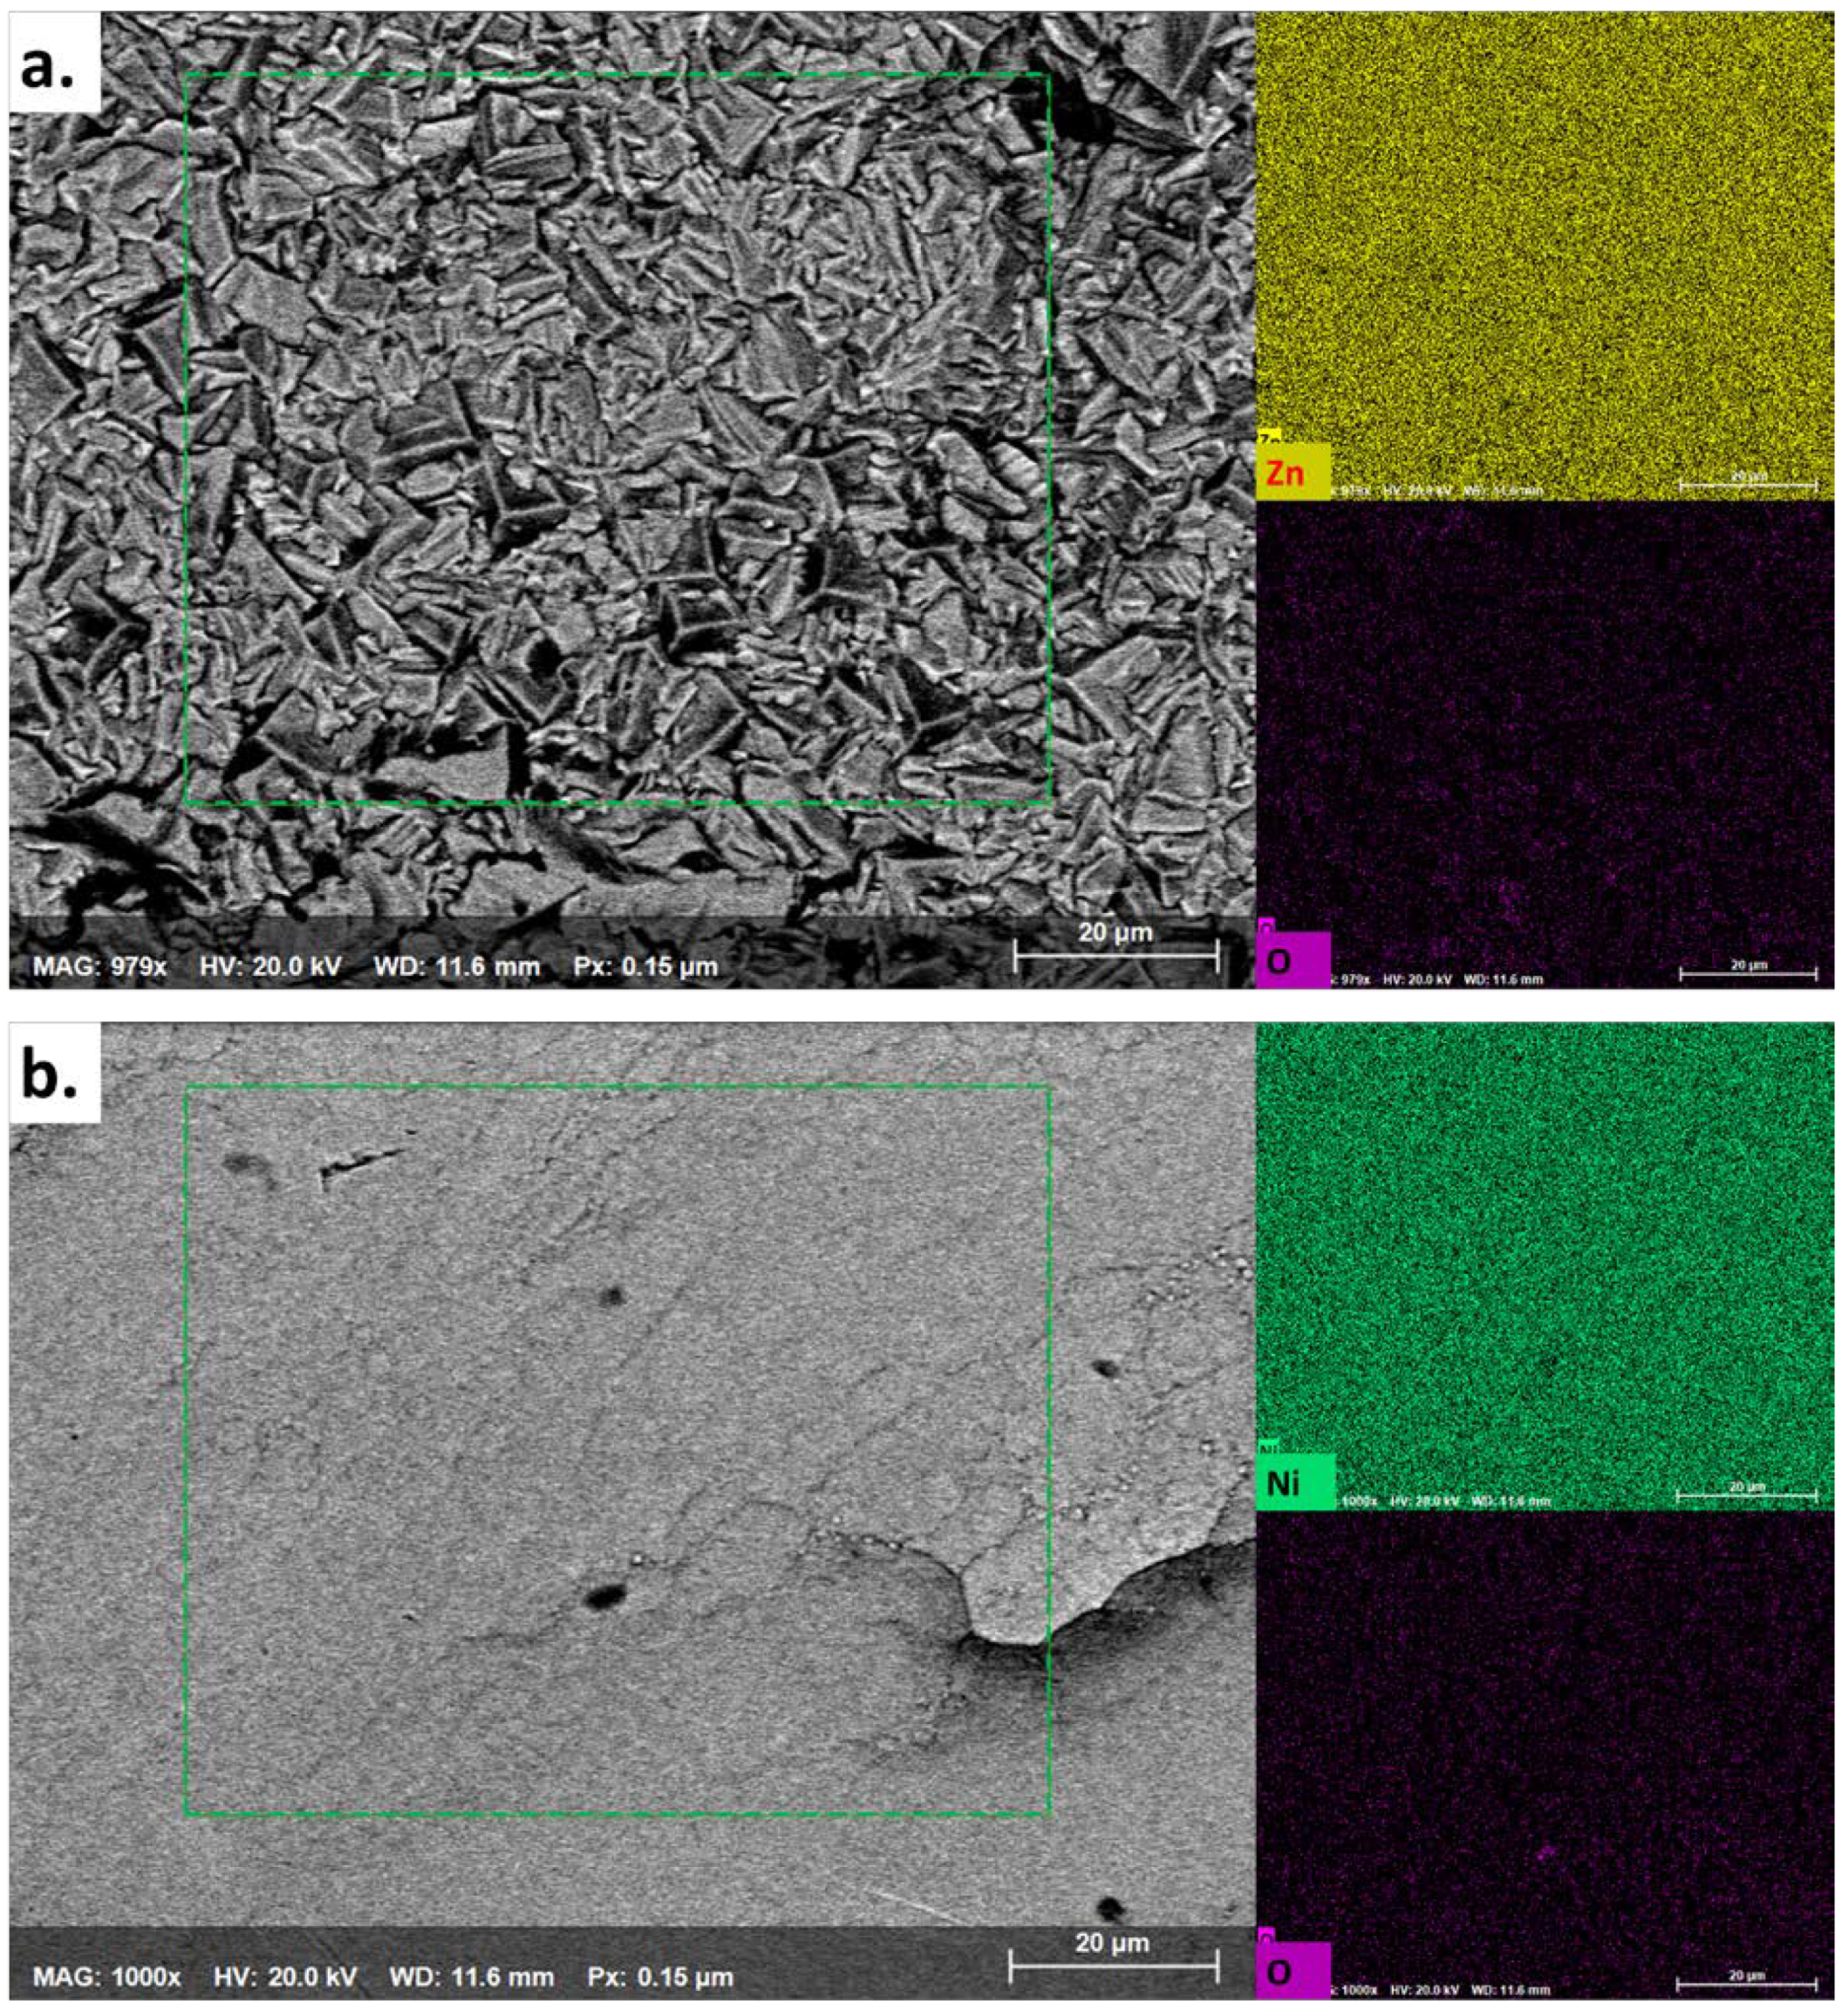
Figure 4a shows the crystallite of pure Zn deposited on the steel substrate. The Zn platelets were randomly oriented and well distributed on the surface [22]. The absence of any surface defects, i.e., micropores, crakes and impurity phases highlighted the uniformity in the deposit. The conditions applied to produce uniform Zn-Ni deposits were optimized and ensured by repetitive experimentation. Under the same conditions, the formation of surface microcracks and defects were evident in the Ni coatings (Figure 4b) possibly either due to the non-homogeneous current distribution, localized H2 evolution or due to the development of internal stresses in the coating during the electrodeposition process. The EDX analysis of the pure Zn and Ni coated samples confirmed the uniform distribution of Zn and Ni elements in the coating, respectively. In addition, the elemental O distribution maps highlighted the presence of oxide species on the coated surfaces. The surface oxides may form either during the electrodeposition process or during the handling/storage of the coated samples. Further investigation of surface oxide species is out of the scope of this study and will be discussed in future work.
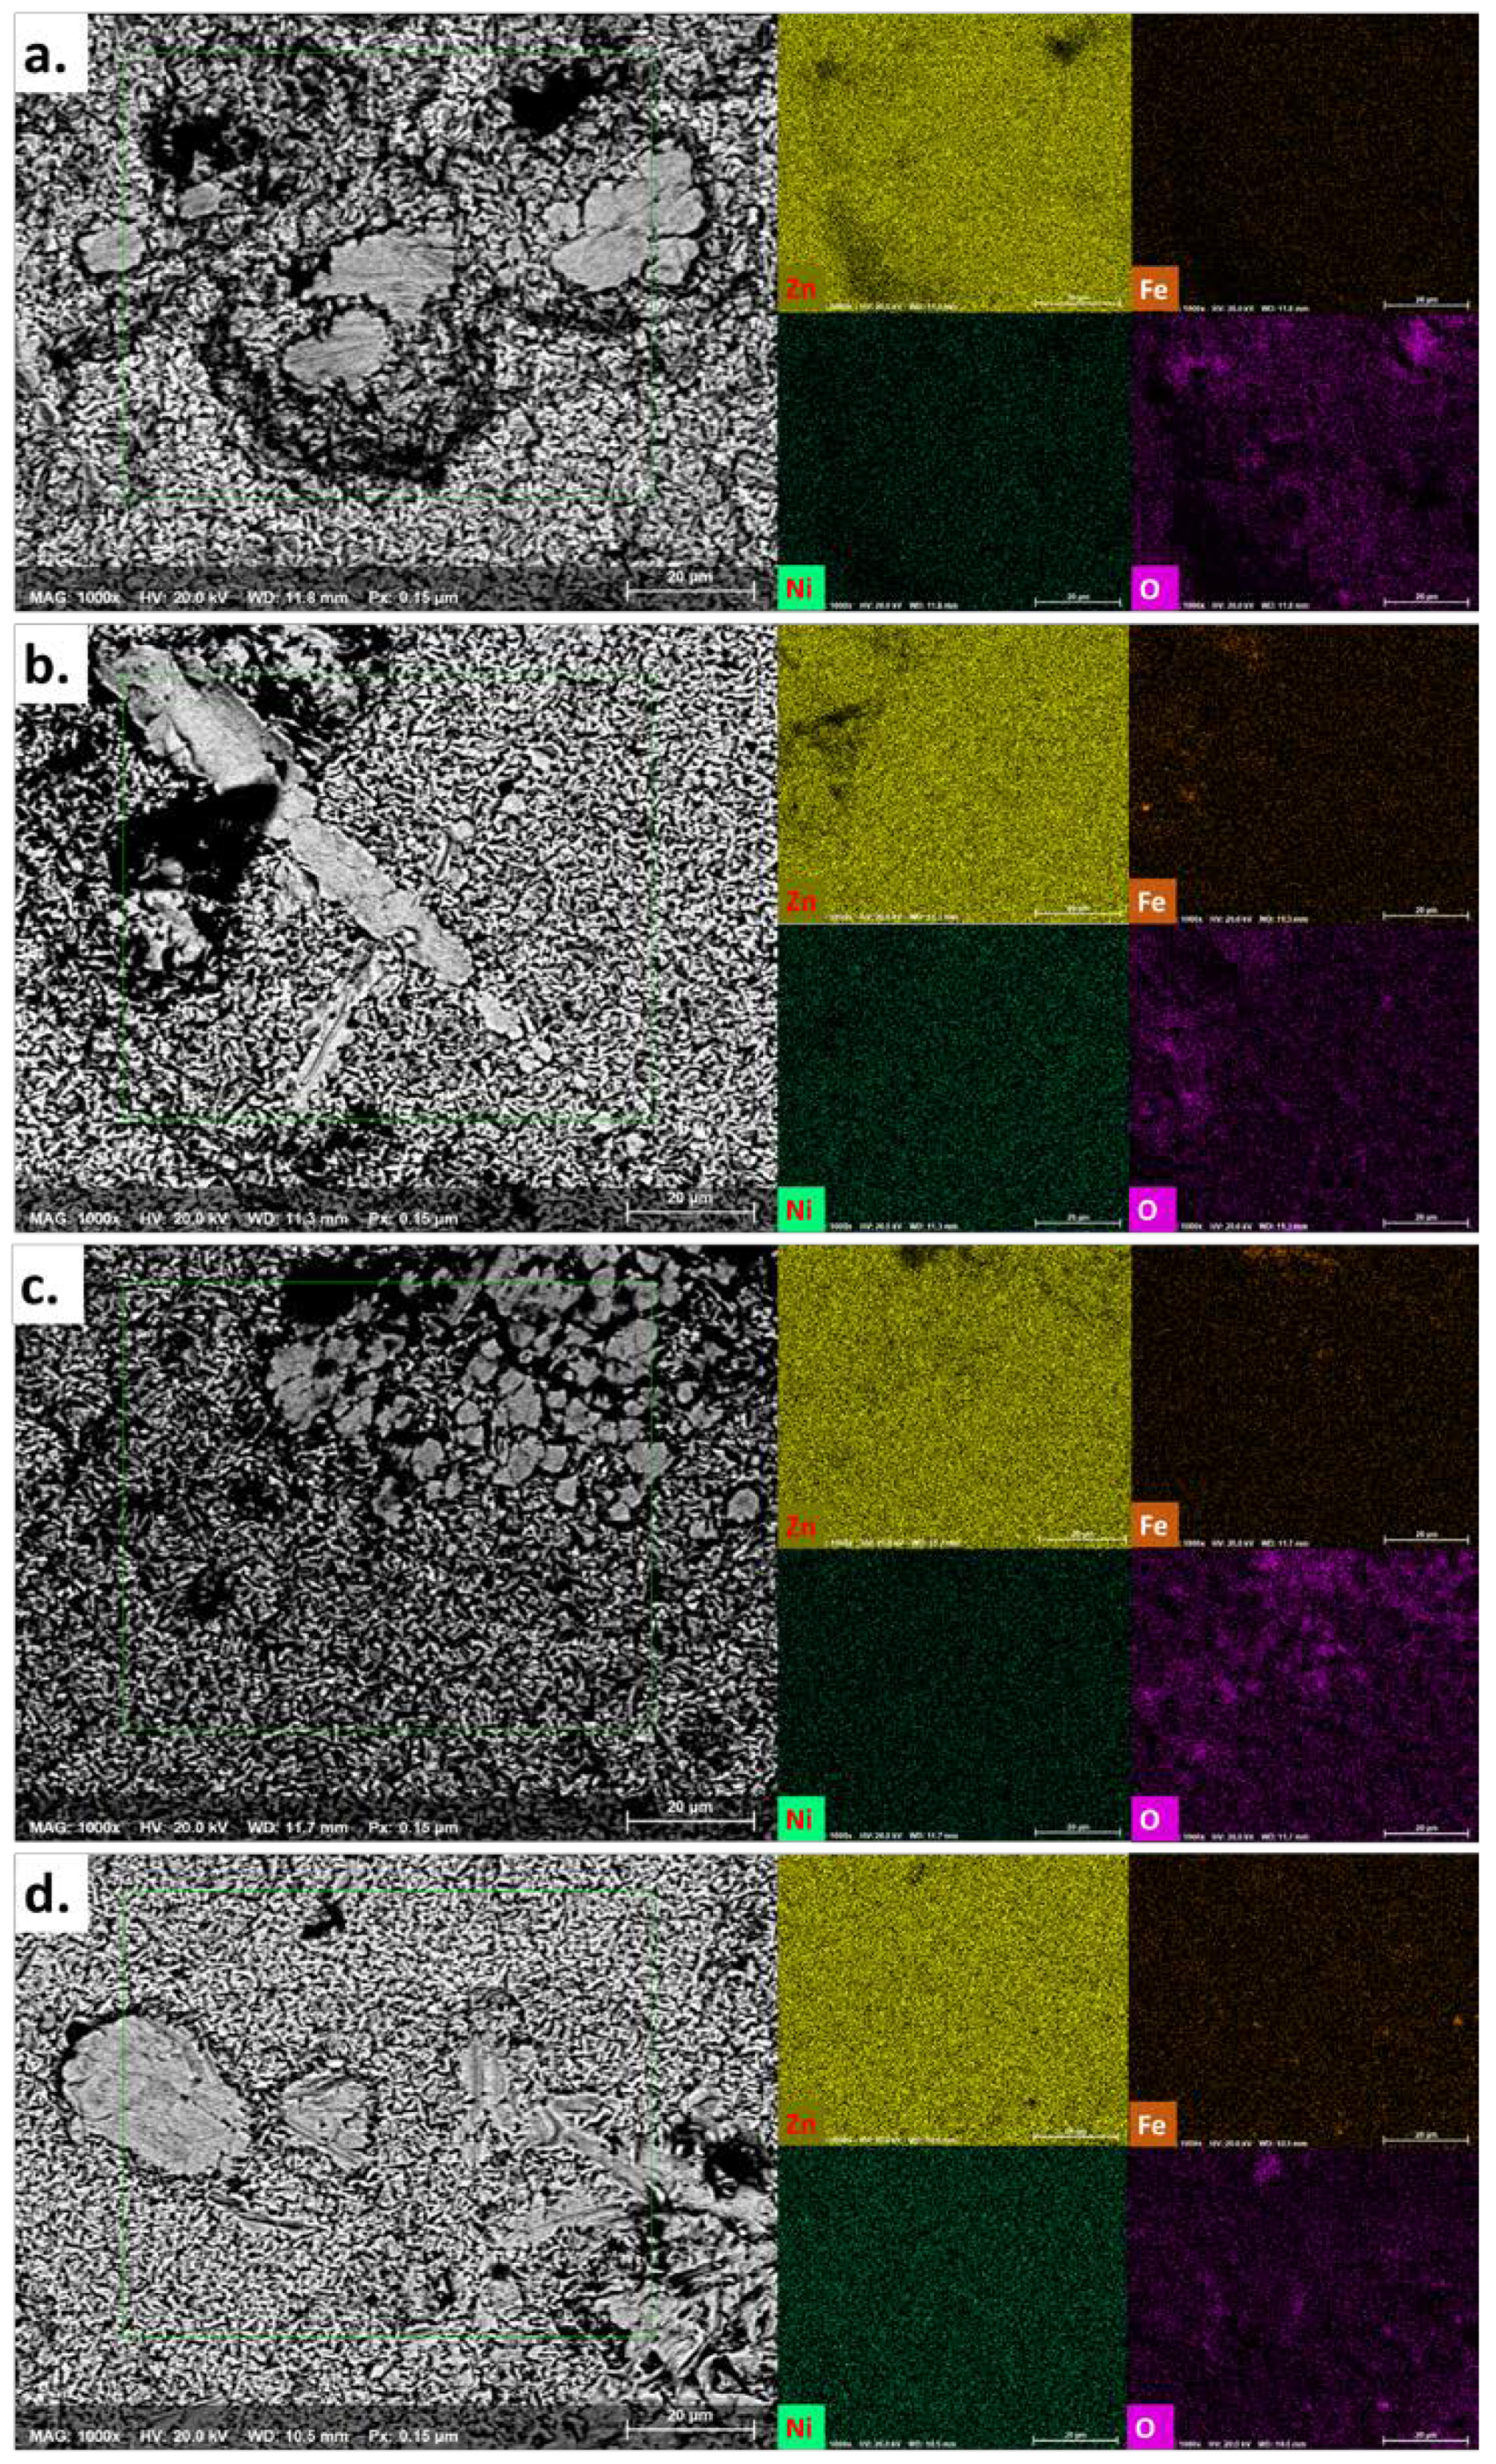
The elemental mapping of the Zn-Ni coatings (Figure 5) shows the uniform distribution of Zn and Ni. It can be estimated that no separate Zn or Ni-rich phases can be differentiated with the increase in Ni ions concentration in the coating. The Ni contents in the Zn-Ni alloy coatings were also increased from 2.9 to 5.3 wt.% and the results well supported the variations in the coating thickness. The increased Ni concentration in the coatings also improved the electrochemical properties as discussed in the following sections. The uniform distribution of Zn and Ni in the Zn-Ni alloy coating represented the formation of Zn enriched Zn-Ni solid solution. The large size grains in the Ni-containing Zn-Ni coatings were also observed due to localized nucleation and growth of the Zn-Ni solid solution. The formation of these large size grains was possibly associated with the non-homogeneous current distribution during the electrodeposition process. In addition, the elemental maps of Fe and O species are also shown in Figure 5, which highlighted the oxidation of coating surface that may happen during handling and storage of samples before EDX analysis.

3.3. Dissolution Behavior of Zn-Ni Coatings

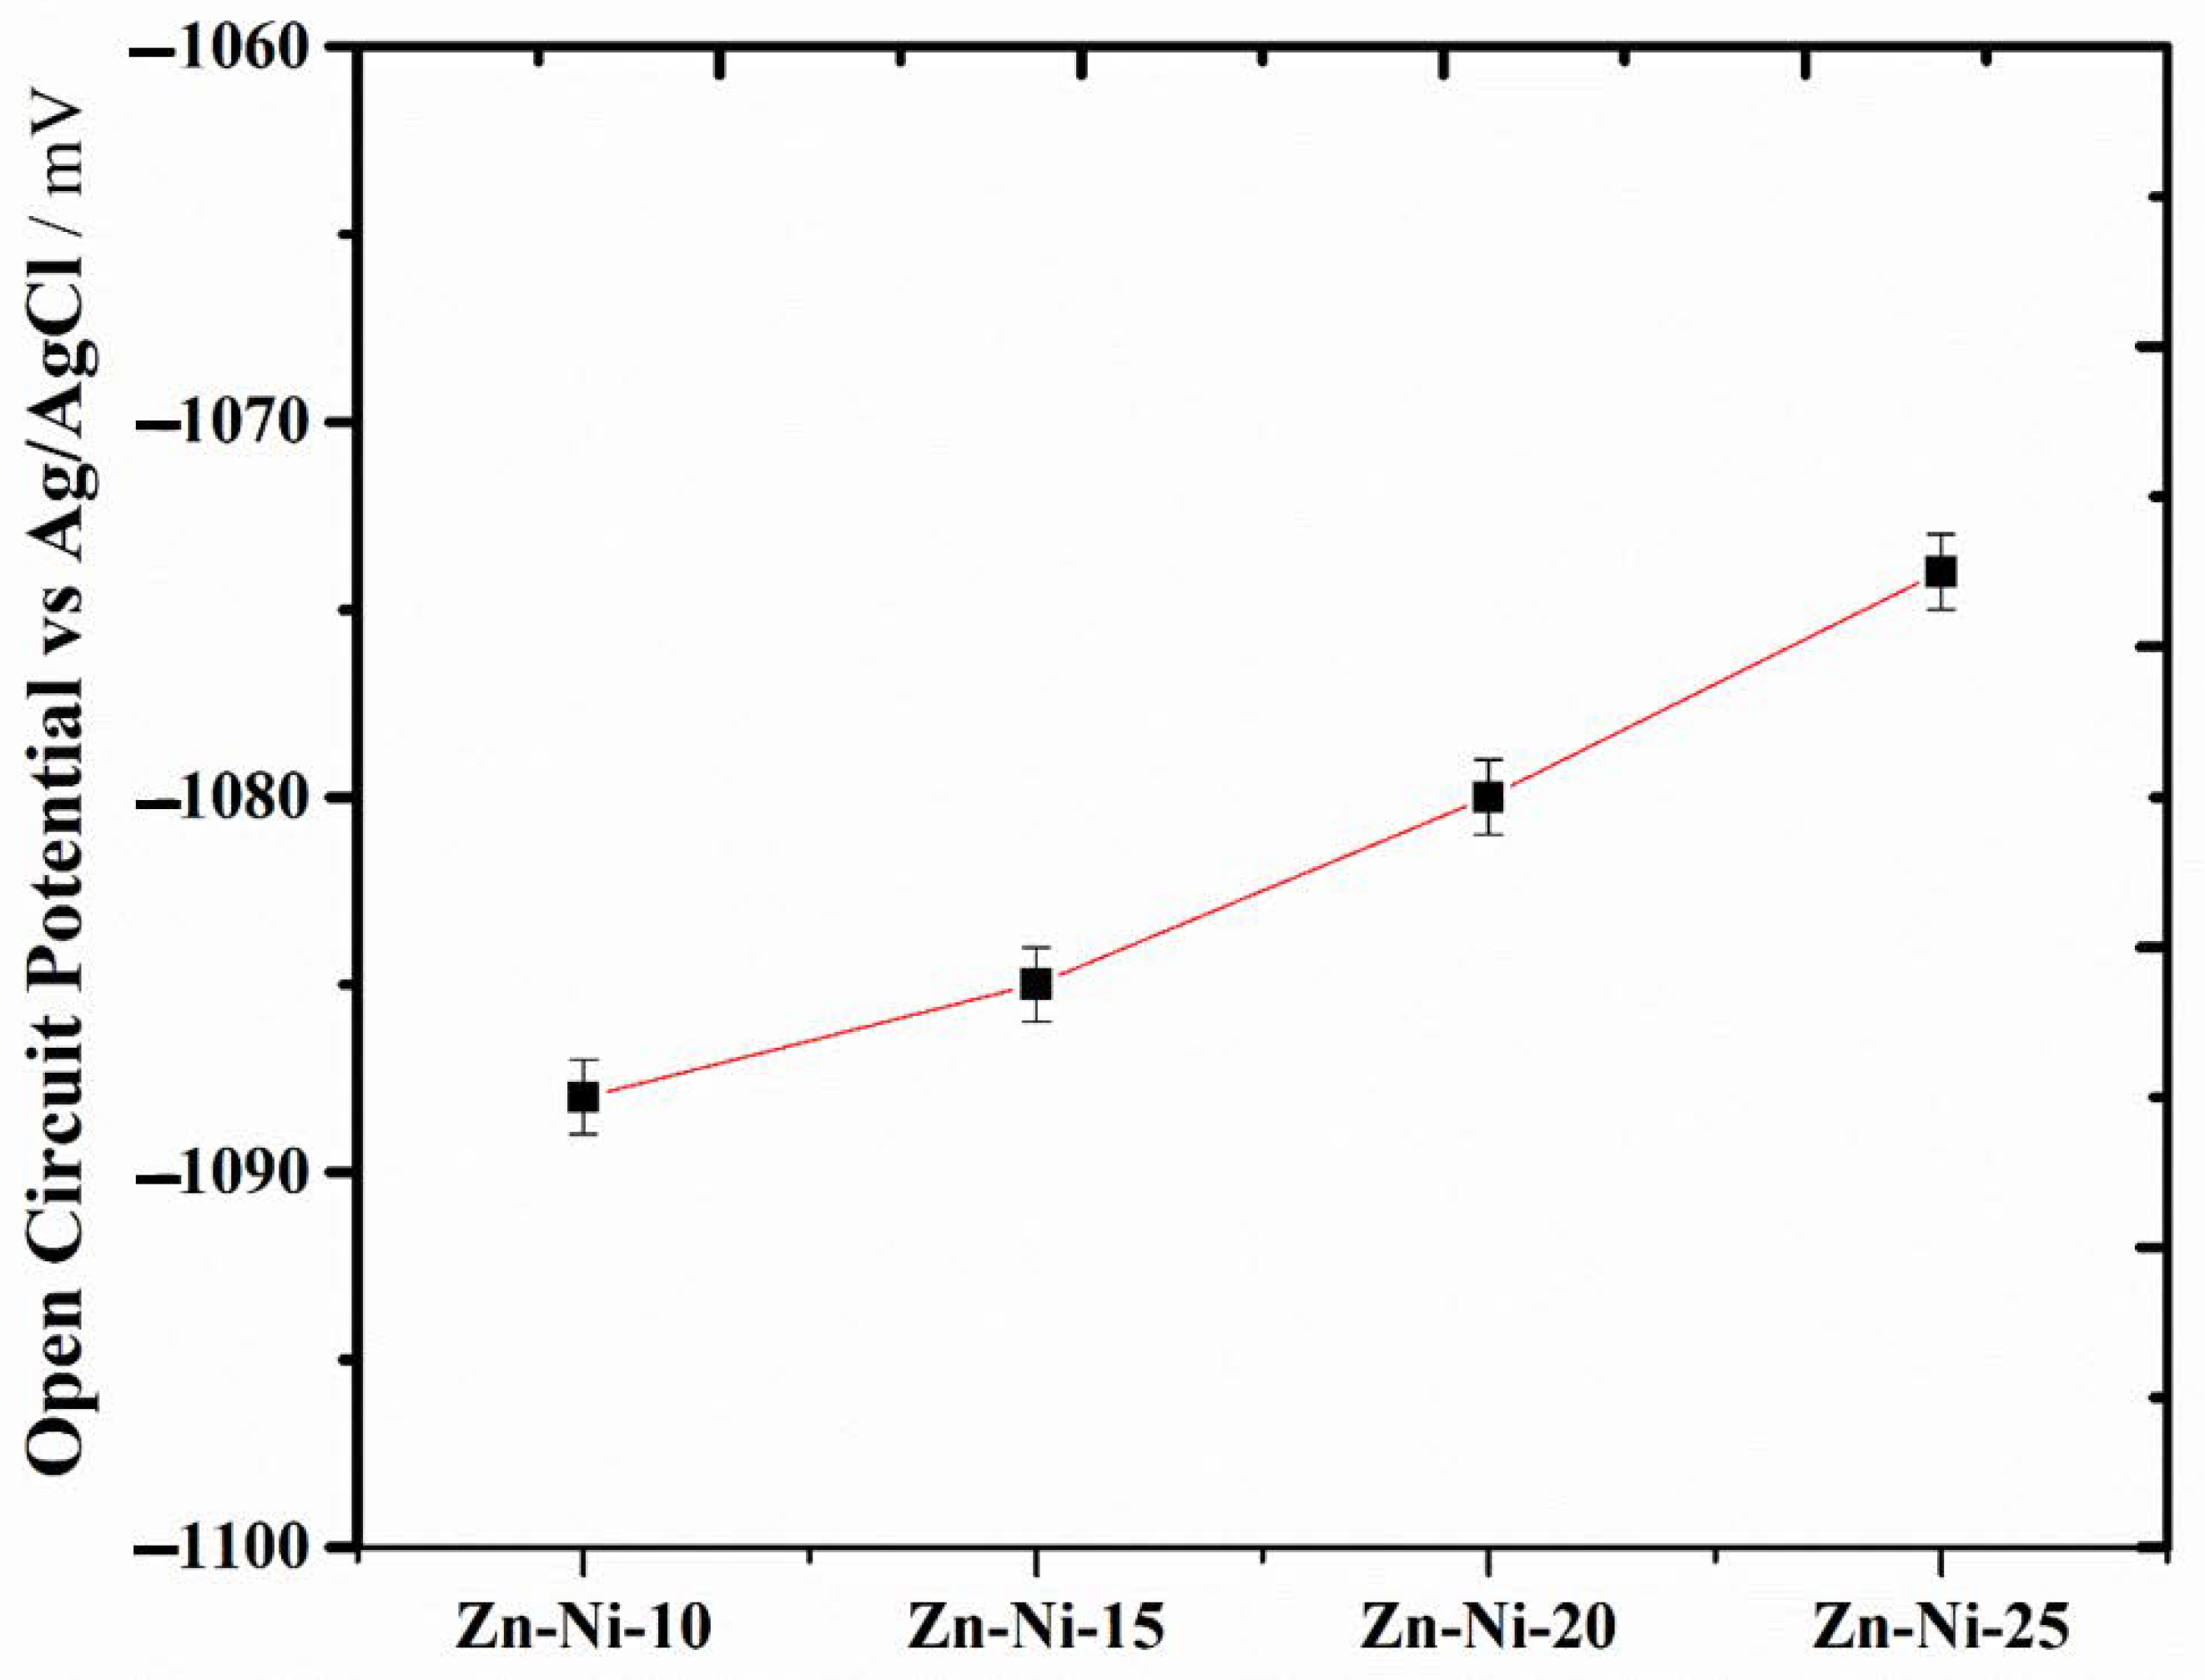
Open circuit potential (OCP) results of the bare and coated mild steel samples are shown in Figure 6. It can be seen that the alloy coating (Zn-Ni) presented more negative OCP compared to the bare steel sample (−0.757 V vs. Ag/AgCl) indicating their sacrificial tendency when coupled with steel and exposed to 3.5 wt.% NaCl solution. Pure zinc coating presented a negative OCP of −1.1 V vs. Ag/AgCl [23]. By increasing the concentration of Ni in the electroplating bath (from 10 to 25 g·L−1) a slight shift in OCP in the coated samples was observed, as shown in Figure 6. For instance, a slight shift in OCP (~20 mV) towards positive potential highlighted the negligible effect of Ni on the dissolution tendency of Zn-Ni alloy coatings, as explained elsewhere [16]. The OCP of Ni coating was measured to be −0.557 V vs. Ag/AgCl in the 3.5 wt.% NaCl solution, which is a relatively positive OCP compared to the steel substrate and Zn-Ni alloy coatings. Based on the potential difference, the relatively positive OCP of the Ni coating compared to the steel substrate and Zn-Ni coating confirmed its barrier/protective characteristics. Owing to the relatively positive OCP of the pure Ni coatings compared to the steel substrate, it is important to mention that any defect or in-homogeneity in the Ni coating could be deleterious and may accelerate the localized dissolution of steel substrate due to the galvanic effect. However, the strategy of Ni addition in Zn coatings could be beneficial to control and tune the dissolution rate of the Zn-enriched sacrificial coating [24].
Cyclic polarization curves of bare steel, pure Zn, pure Ni and coated samples are shown in Figure 7a,b, respectively. The kinetic parameters were estimated from the polarization curves and quantitative data is given in Table 2. For instance, the Tafel slope of the anodic (βa) and cathodic polarization curves (βc) were measured by fitting the E vs. log (i) curves. With the extrapolation of both anodic and cathodic Tafel regions in the forward polarization scan, the linear fit lines intersected corresponding to the corrosion current density (icorr) and corrosion potential (Ecorr). The large value of the βa and βc represents hindrance in the charge transfer processes. For instance, the surface passivation, specific adsorption of ionic species or surface coverage by the reaction products could lead to large values of Tafel slopes. The pure Zn-coated sample registered a βa value of 38.3 mV/decade indicating its accelerated dissolution tendency during anodic polarization, whereas relatively large βa of a pure Ni coated sample (284.2 mV/decade) highlighted its slow dissolution tendency under the same conditions. These results well supported their general dissolution characteristics as reported elsewhere [25,26]. On the other hand, compared to pure Zn (297.2 mV/decade), the Ni-coated sample presented a relatively small βc value (171.9 mV/decade), indicating the improved kinetics of H2O reduction on its surface, which is considered a possible cathodic reaction under applied conditions. Similarly, in the Zn-Ni alloy coatings, the increase in Ni contents resulted in the decrease of βc attributing to the improvement in the kinetics of H2O reduction reaction. Owing to the potential difference between the Zn matrix and Ni alloying phase, in contrast to their intrinsic dissolution character, the βa values of the Zn-Ni alloy coatings were found to be higher compared to pure Zn coated samples. These results indicated that the dissolution character of the Zn can be modified by the Ni addition. The wide variation in the Ecorr and icorr due to the addition of Ni in the Zn coatings were also calculated from the polarization curves. Briefly, the more negative and positive Ecorr of the Zn and Ni coatings respectively compared to the bare steel sample was evident. The relatively negative Ecorr of the Zn coating compared to steel suggested its cathodic protection and sacrificial dissolution of the Zn coating. The potential plateau at approximately −1.0 V and large anodic current indicated the oxidation of Zn coating to Zn(OH)2 according to Reaction (3). On the other hand, the corrosion protection of steel substrate by the Ni coating is highly dependent on the uniformity and its barrier characteristics as predicted from the positive Ecorr of Ni coating compared to the bare steel sample [18]. The addition of Ni in the Zn-Ni alloy coating induces a minor effect on the Ecorr. However, a slightly negative shift of Ecorr values (~60 mV) of Zn-Ni coated samples compared to pure Zn coating was quite anomalous and may be associated with the internal stresses that may develop in the crystal lattice of Zn due to Ni addition [27]. On the other hand, the polarization scans were initiated from the very negative potentials (<OCP) and the occurrence of cathodic reactions i.e., H2O reduction could also shift the Ecorr and may affect the kinetic behavior of the Zn-Ni coatings. To understand the effect of galvanic couples and to estimate the dissolution characteristics of the steel substrate and coatings, a schematic diagram of polarization trends is shown in Figure 8. The sacrificial dissolution rate of Zn coating can be estimated from the couple current (iZn/Fe) obtained from the intersection of polarization curves (anodic branch of Zn coating with the cathodic curve of steel substrate). The positive Ecorr and smaller icorr of Ni (coating 3.27 μA·cm−2) compared to steel substrate sample (5.57 μA·cm−2) validated its slow dissolution. These results also suggested the barrier characteristics of the Ni coating. In other words, the uniform Ni coatings could restrict the dissolution of the steel substrate, however, the presence of microcracks or defects in the Ni coatings could induce a harmful effect on its structural integrity due to localized corrosion of the steel substrate [24]. The dissolution tendency and corrosion rate of the steel substrate (2.54 mpy) can also be estimated from the relatively negative Ecorr (−969 mV vs. Ag/AgCl) and large icorr values (5.57 μA-cm−2). Two potential plateaux were observed at approximately −0.1 and 0.3 V vs. Ag/AgCl in the anodic polarization curve of a pure Ni coating attributing to the possible oxidation of steel and Ni coating according to Reactions (4) and (5), respectively. Also, during the reverse anodic polarization scan, the large hysteresis loop and the intersection at a low potential (−0.4 V vs. Ag/AgCl) confirmed the localized dissolution of the steel substrate at the defect sites present within the coating.
Zn + 2H2O = Zn(OH)2 + 2H+ + 2e
Fe + 2H2O = Fe(OH)2 + 2H+ + 2e
Ni + H2O = NiOH+ + H+ + e
In other words, the corrosion resistance of the Ni coated steel substrate depends on the uniformity and barrier characteristics of the Ni coating. Due to galvanic coupling, any defect in the Ni coating could accelerate the localized dissolution of steel. In the case of Zn-Ni alloy coatings, the polarization trend was negligibly influenced by the Ni contents in the coatings. However, a slight difference in the limiting current within −1.25 to −1.0 V vs. Ag/AgCl was observed, which highlighted the intrinsic oxidation of Zn via Reaction (3) as indicated by the potential plateau at −0.1 V vs. Ag/AgCl. The relatively large anodic current and negative Ecorr of Zn-Ni-10 and Zn-Ni-15 samples compared to the high Ni-containing coatings indicate that high Ni contents could tune the dissolution tendency of Zn. At large anodic overpotentials (>−1.0 V vs. AgCl), the rapid increase in anodic current highlighted the preferential dissolution of Zn. During reverse anodic polarization the Ecorr2 of the Zn-Ni shifted to more positive potential as shown in Figure 7b. Similarly, large icorr2 values suggested the accelerated dissolution of Zn-Ni coatings in an oxidizing environment.
In summary, analysis of the polarization curve depicted that the dissolution rate of the Zn-Ni alloy decreased appreciably compared to the pure Zn-coated sample (26.12 mpy). With the increase in the Ni concentration in the electroplating bath solution, the decrease in the icorr corresponded to the decrease in the coating dissolution rate. For instance, the corrosion rate of the Zn-Ni-10-coated sample (12.12 mpy) was approximately two times lower than the pure Zn-coated sample (26.12 mpy) as given in Table 2. Due to the increase in Ni contents in the Zn-Ni coatings (from 2.9 to 5.3 wt.%) with the increase in Ni concentration in the electroplating bath resulted in an appreciable decrease in icorr (approximately four times lower than Zn-coated sample) and corrosion rate i.e., 15.9 μA-cm−2 and 7.25 mpy, respectively (i.e., in the case of Zn-Ni-25). In other words, this significant improvement is the corrosion resistance was attributed to the high Ni contents in the Zn-Ni-25 coating (5.3 ± 1.0 wt.%).

3.4. Salt Spray Tests—Post Exposure Surface Features

Surface appearances of the coated substrate before and after 96 h of exposure during the salt spray test are shown in Figure 9. White rust appeared on the surfaces of all the samples, but the alloy coating having a lower amount of nickel (10 g·L−l) showed more white corrosion product on the surface. The white product corresponded to the formation of zinc hydroxides (Zn(OH)2) phase on the surface due to the preferential dissolution of Zn according to Reaction (3).
In simple words, during exposure to saline solution, Zn and Zn-Ni alloy coatings would protect the steel substrate from corrosion due to the sacrificial dissolution of Zn [11]. After 96 h of exposure, the formation of a white product has covered the cross-hatched region of the coated samples. These results showed that the sacrificial dissolution of the coatings would not only cathodically protect the steel substrate, but may have healing capability for local defects in the coating due to the formation of Zn(OH)2 species. In simple words, the accumulation of white product within the local defect could supply a physical barrier to the electrolyte resulting in the delayed dissolution of the steel substrate. For instance, before reaching the protection capacity of the Zn coating, this white product could provide a physical barrier to the electrolyte to reach the substrate. As evident in Figure 9b–e, the amount of white product decreased with increase Ni contents and supported the electrochemical test results.
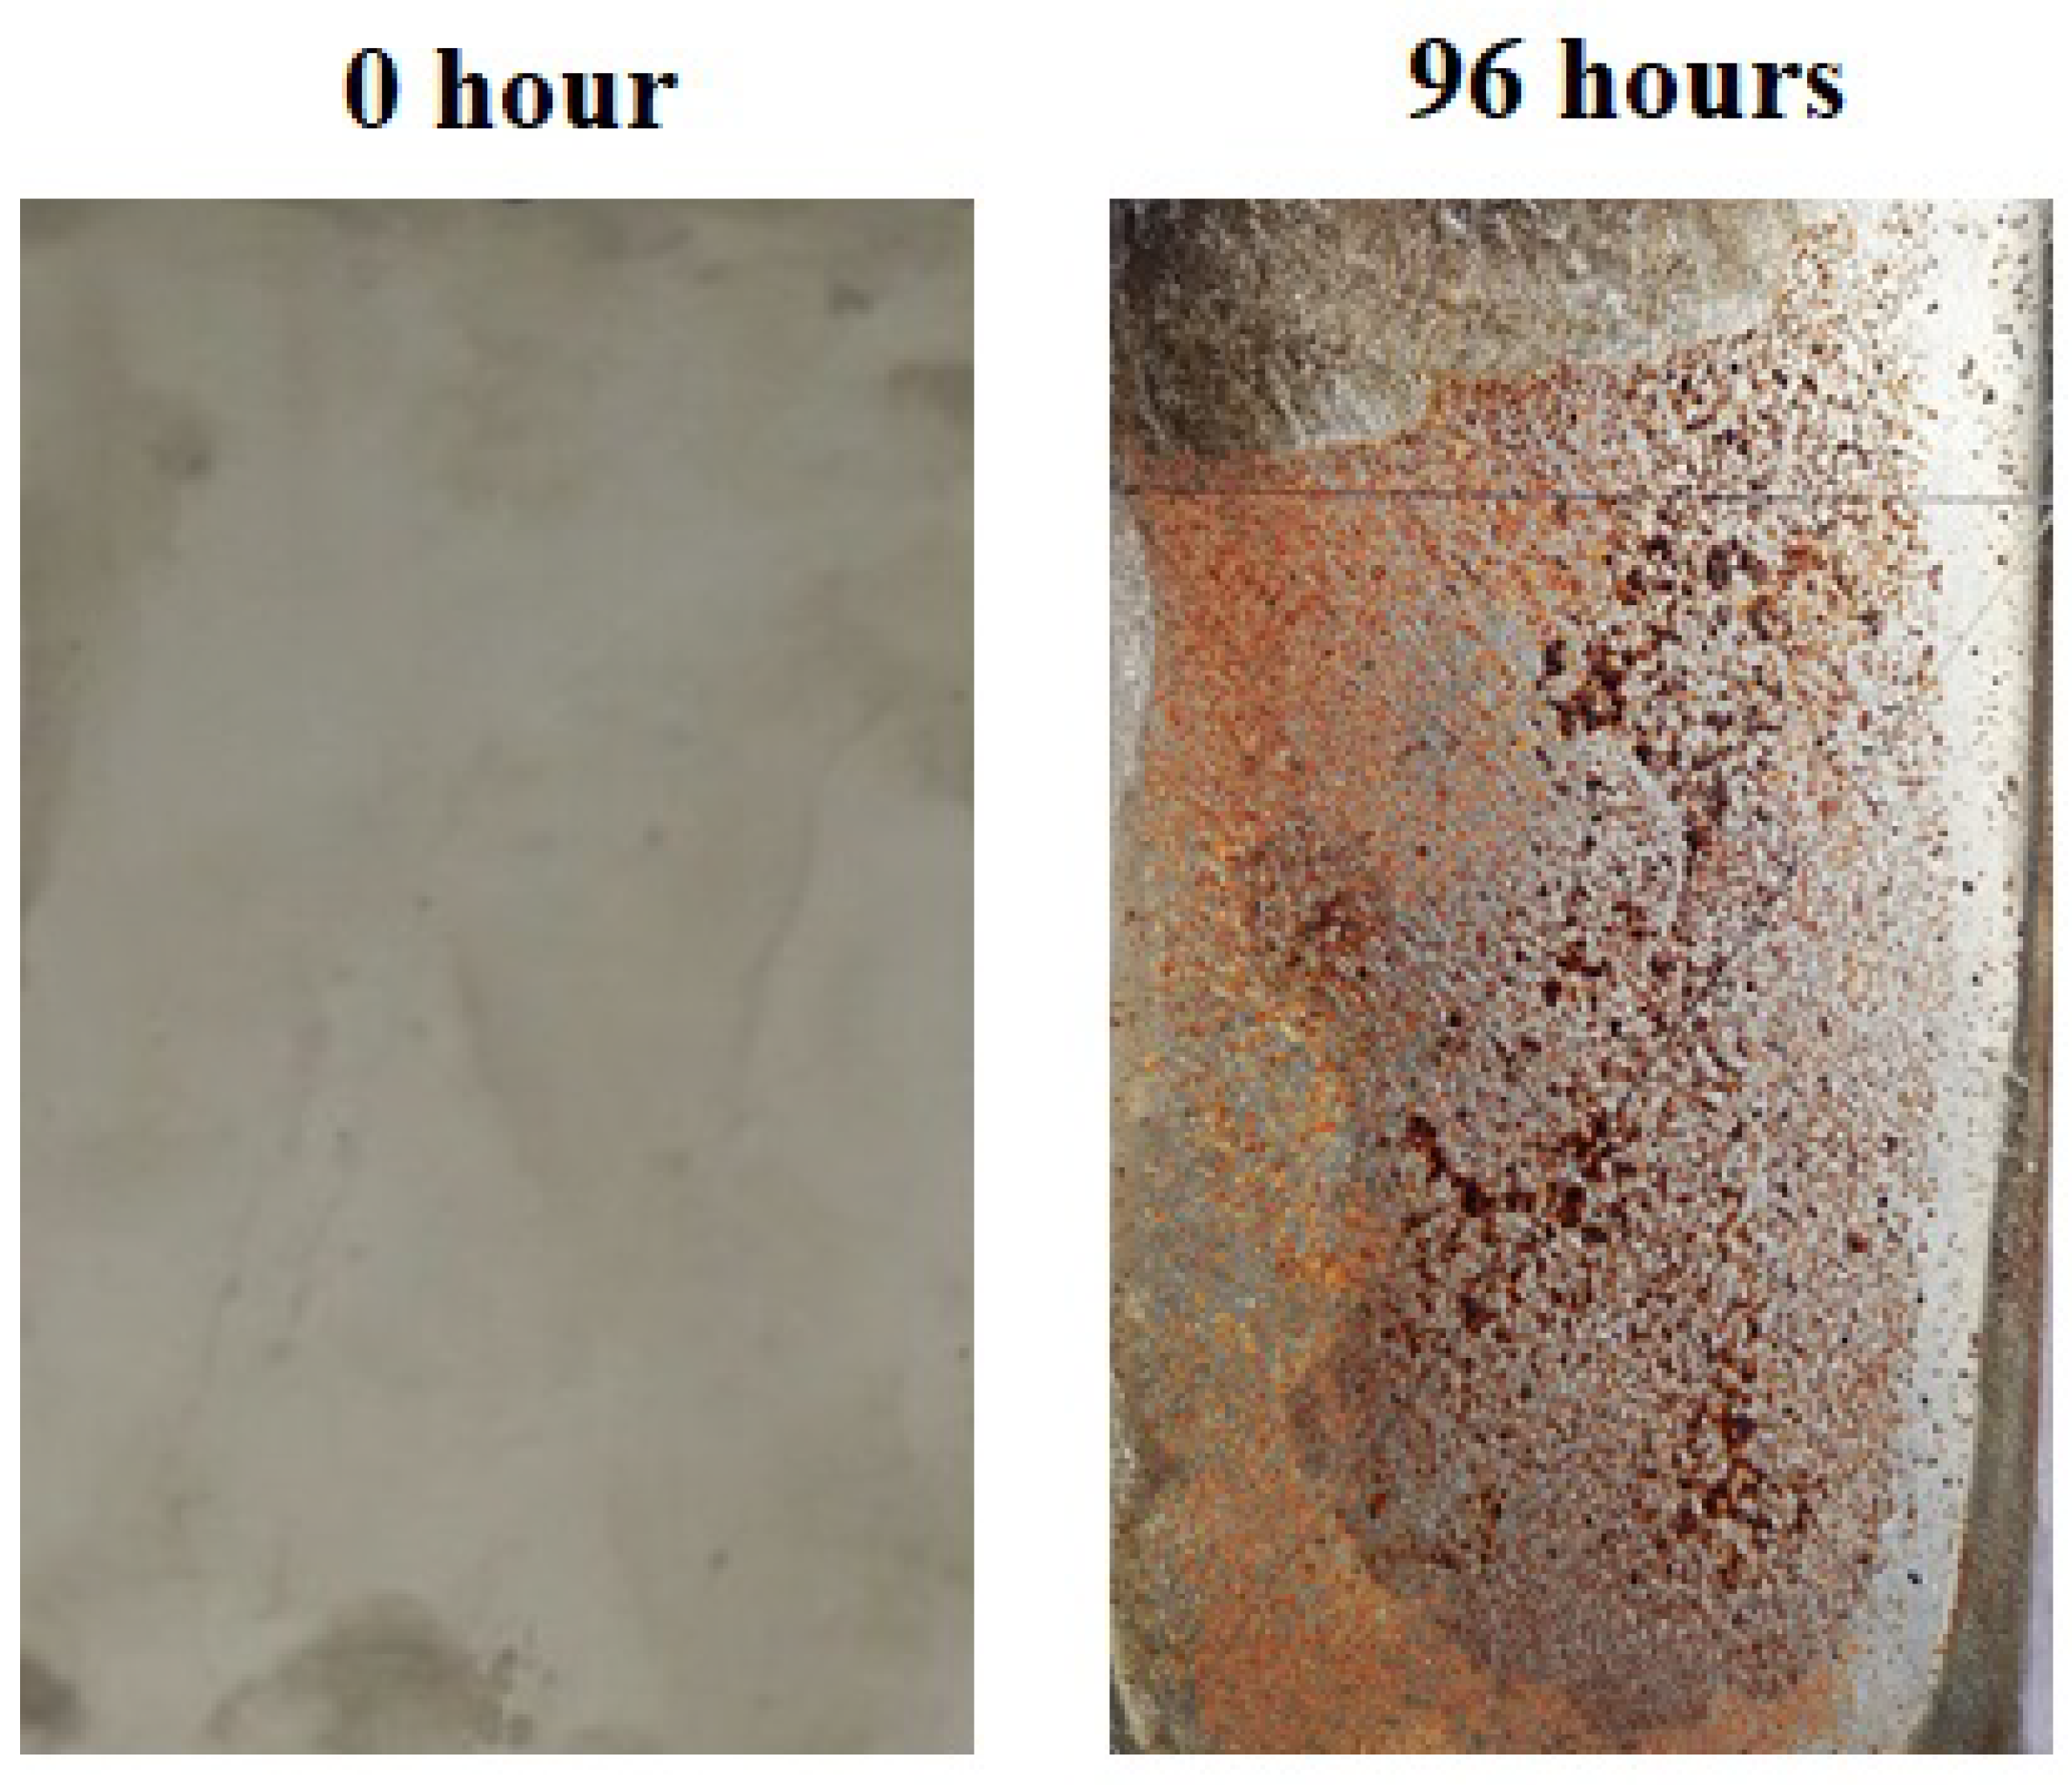
On the other hand, pure Ni-coated samples presented severe corrosion damage after 96 h of exposure, which is highlighted as localized corrosion spots on the surface as shown in Figure 10. In other words, the barrier characteristics of the Ni coating were compromised by the presence of localized defects in the coating. The ingress of electrolyte through the localized defects enhanced the presential dissolution of the steel substrate (via Reaction (4)) as predicted from the potential difference between Ni/steel couple as quantified in Table 2.

4. Conclusions

Zn-Ni alloy coatings were co-deposited on a steel substrate using varying concentrations of Ni in the electroplating bath. The morphology and electrochemical behavior of Zn-Ni coatings were compared with the corresponding pure Zn and Ni coatings. The thickness of the electrodeposited Zn-Ni coatings decreased from 38.2 μm to 20.7 μm with the increase in Ni concentration in the bath solutions (from 10 to 25 g·L−1 Ni+2). The increase in Ni concentration (up to 25 g·L−1) resulted in an increase in Ni contents in the coatings and formation of fine grain structures attributed to the competing nucleation and grain growth during co-deposition of the Zn and Ni species. A slight increase in OCP (~20 mV) was observed with an increase in Ni concentration in the bath solution. The relatively negative OCP of the Zn compared to the steel substrate led to its sacrificial dissolution character in the 3.5% NaCl solution. However, the dissolution tendency was largely affected by the presence of varying Ni concentrations in the Zn-Ni deposit. The negative Ecorr of the Zn-Ni coatings (<−1240 mV vs. Ag/AgCl) compared to the steel substrate and an appreciably low corrosion rate of the Zn-Ni-25 (7.25 mpy) sample compared to pure Zn (26.12 mpy) is a promising feature of these alloy coatings. Although an appreciable decrease in Zn-Ni coating thickness was observed, the increase in Ni concentration significantly improved the corrosion resistance of the Zn-Ni/steel substrate system (i.e., Zn-Ni-25). For instance, the negative Ecorr of Zn-Ni coatings (compared to pure Zn coatings) and a significant decrease in corrosion rate with an increase in the Ni concentration (from 2.9 to 5.3 wt.%) were observed. These results suggested that the dissolution characteristics of the Zn-Ni alloy coating can be effectively tuned by varying the Ni2+ concentration in the bath solution and the life of the sacrificial Zn-Ni coatings can be extended accordingly. The appreciable decrease in coating thickness resulted in an overall reduction in coating weight but having improved corrosion resistance, which is a positive feature and is always recommended for structural applications. This work can be further extended to evaluate the galvanic corrosion tendency of Zn-Ni coated steel coupled with aluminum or magnesium alloys as required by the automotive and aerospace industries for the assembly of dissimilar metal components.

Author Contributions

Conceptualization, A.F. and K.M.D.; methodology, A.F. and K.M.D.; validation, A.F., K.M.D. and K.H.; formal analysis, A.F. and S.A.; resources, K.M.D. and K.H.; writing—original draft preparation, A.F. and K.M.D.; writing—review and editing, K.M.D. and K.H.; visualization, K.M.D.; supervision, K.M.D.; project administration, A.F., K.H. and K.M.D.; funding acquisition, K.H. All authors have read and agreed to the published version of the manuscript.

Funding

This research was funded by National Research Foundation (NRF) of South Korea, grant number (2020R1A2C1004720). And the APC was funded by National Research Foundation (NRF) of South Korea, grant number (2020R1A2C1004720).

Institutional Review Board Statement

Not applicable.

Informed Consent Statement

Not applicable.

Data Availability Statement

There is no additional data associated with this article. Further information is available and can be requested from authors with appropriate reasons.

Acknowledgments

This research was supported by the National Research Foundation (NRF) of South Korea (2020R1A2C1004720).

Conflicts of Interest

The authors declare no conflict of interest.

References

  1. Conde, A.; Arenas, M.A.; De Damborenea, J.J. Electrodeposition of Zn-Ni alloy coatings as Cd replacement for corrosion protection of high strength steel. Corr. Sci. 2011, 53, 1489–1497. [Google Scholar] [CrossRef]
  2. Durodola, B.M.; Olugbuyiro, J.A.O.; Moshood, S.A.; Fayomi, O.S.; Popoola, A.P.I. Study of influence of zinc plated mild steel deterioration in seawater environment. Int. J. Electrochem. Sci. 2011, 6, 5605–5616. [Google Scholar]
  3. Wilcox, G.; Gabe, D. Electrodeposited zinc alloy coatings. Corros. Sci. 1993, 35, 1251–1258. [Google Scholar] [CrossRef]
  4. Tafreshi, M.; Allahkaram, S.R.; Farhangi, H. Comparative study on structure, corrosion properties and tribological behavior of Zn and Zn-Ni alloy coatings. Mater. Chem. Phys. 2016, 183, 263–272. [Google Scholar] [CrossRef]
  5. Fei, J.-Y.; Liang, G.-Z.; Xin, W.-L.; Wang, W.-K. Surface Modification with Zinc and Zn-Ni Alloy Compositionally Modulated Multilayer Coatings. J. Iron Steel Res. Int. 2006, 13, 61–67. [Google Scholar] [CrossRef]
  6. Ghaziof, S.; Gao, W. Electrodeposition of single gamma phased Zn–Ni alloy coatings from additive-free acidic bath. Appl. Surf. Sci. 2014, 311, 635–642. [Google Scholar] [CrossRef]
  7. Fratesi, R.; Roventi, G. Corrosion resistance of Zn-Ni alloy coatings in industrial production. Surf. Coat. Technol. 1996, 82, 158–164. [Google Scholar] [CrossRef]
  8. Rahman, M.J.; Sen, S.R.; Moniruzzaman, M.; Shorowordi, K.M. Morphology and properties of electrodeposited Zn-Ni alloy coatings on mild steel. J. Mech. Eng. 1970, 40, 9–14. [Google Scholar] [CrossRef] [Green Version]
  9. Tozar, A.; Karahan, I. Structural and corrosion protection properties of electrochemically deposited nano-sized Zn–Ni alloy coatings. Appl. Surf. Sci. 2014, 318, 15–23. [Google Scholar] [CrossRef]
  10. Fashu, S.; Khan, R. Recent work on electrochemical deposition of Zn-Ni (-X) alloys for corrosion protection of steel. Anti-Corrosion Methods Mater. 2019, 66, 45–60. [Google Scholar] [CrossRef]
  11. Kwon, M.; Jo, D.-H.; Cho, S.H.; Kim, H.T.; Park, J.-T. Characterization of the influence of Ni content on the corrosion resistance of electrodeposited Zn–Ni alloy coatings. Surf. Coat. Technol. 2016, 288, 163–170. [Google Scholar] [CrossRef]
  12. Abou-Krisha, M.M.; Assaf, F.H.; Toghan, A.A. Electrodeposition of Zn-Ni alloys from sulphate bath. J. Solid State Electrochem. 2007, 11, 244–252. [Google Scholar] [CrossRef]
  13. Khan, R.; Mehmood, M.; Rizwan, R.; Ahmad, J.; Ul Hasan, M.; Iqbal, Z.; Mudassar, T.; Aslam, M. Corrosion behavior of zinc-nickel alloy coatings electrodeposited in additive free chloride baths. Corr. Eng. Sci. Technol. 2011, 46, 755–761. [Google Scholar] [CrossRef]
  14. Tuaweri, T.J.; Gumus, R. Zn-Ni Electrodeposition for enhanced corrosion performance. Int. J. Mater. Sci. Appl. 2013, 2, 221–227. [Google Scholar] [CrossRef] [Green Version]
  15. Abd El-Lateef, H.M.; Abdel-Rahman, E.S.; Mohran, H.S. Role of Ni content in improvement of corrosion resistance of Zn-Ni alloy in 3.5% NaCl solution, Part I: Polarization and impedance studies. Trans. Nonferr. Metals Soc. China 2015, 25, 2807–2816. [Google Scholar] [CrossRef]
  16. Baldwin, K.; Robinson, M.; Smith, C. The corrosion resistance of electrodeposited zinc-nickel alloy coatings. Corros. Sci. 1993, 35, 1267–1272. [Google Scholar] [CrossRef]
  17. Eliaz, N.; Venkatakrishna, K.; Hegde, A.C. Electroplating and characterization of Zn-Ni, Zn-Co, and Zn-Ni-Co alloys. Surf. Coat. Technol. 2010, 205, 1969–1978. [Google Scholar] [CrossRef]
  18. Canning, W. The Canning Handbook: Surface Finishing Technology; CBS HB: Delhi, India, 2000; p. 231. [Google Scholar]
  19. Cramer, S.D.; Covino, B.S., Jr. Corrosion: Fundamental, Testing and Protection; ASM International: Russell Township, OH, USA, 2003; p. 541. [Google Scholar]
  20. Rahsepar, M.; Bahrololoom, M. Corrosion study of Ni/Zn compositionally modulated multilayer coatings using electrochemical impedance spectroscopy. Corros. Sci. 2009, 51, 2537–2543. [Google Scholar] [CrossRef]
  21. Rashmi, S.; Elias, L.; Hegde, A.C. Multilayered Zn-Ni alloy coatings for better corrosion protection of mild steel. Eng. Sci. Technol. Int. J. 2017, 20, 1227–1232. [Google Scholar] [CrossRef] [Green Version]
  22. Crasta, R.J.; Shetty, S. Comparative Study of Electrodeposited Zn and Zn–Ni Alloy Coatings for Improved Corrosion Protection in Chloride Medium. Prot. Met. Phys. Chem. Surf. 2021, 57, 139–146. [Google Scholar] [CrossRef]
  23. Farooq, A.; Chaudry, U.; Saleem, A.; Deen, K.; Hamad, K.; Ahmad, R. Sacrificial Dissolution of Zinc Electroplated and Cold Galvanized Coated Steel in Saline and Soil Environments: A Comparison. Materials 2021, 14, 744. [Google Scholar] [CrossRef] [PubMed]
  24. Kelly, R.G.; Scully, J.R.; Shoesmith, D.; Buchheit, R.G. Electrochemical Techniques in Corrosion Science and Engineering; Marcel Dekker, Inc.: New York, NY, USA, 2002; pp. 84–90. [Google Scholar]
  25. Deen, K.; Afzal, N.; Ahmad, R.; Niazi, Z.; Ayub, R.; Farooq, A.; Khan, I.; Khaleeq-Ur-Rahman, M. Intergranular pitting tendency of yttrium implanted Inconel 600 in acidic chloride media. Surf. Coat. Technol. 2012, 212, 61–66. [Google Scholar] [CrossRef]
  26. Farooq, A.; Hamza, M.; Ahmed, Q.; Deen, K.M. Evaluating the performance of zinc and aluminum sacrificial anodes in artificial seawater. Electrochim. Acta 2019, 314, 135–141. [Google Scholar] [CrossRef]
  27. Anwar, S.; Zhang, Y.; Khan, F. Electrochemical behavior and analysis of Zn and Zn-Ni alloy anti-corrosive deposited from citrate baths. RSC Adv. 2018, 8, 28869. [Google Scholar] [CrossRef] [Green Version]
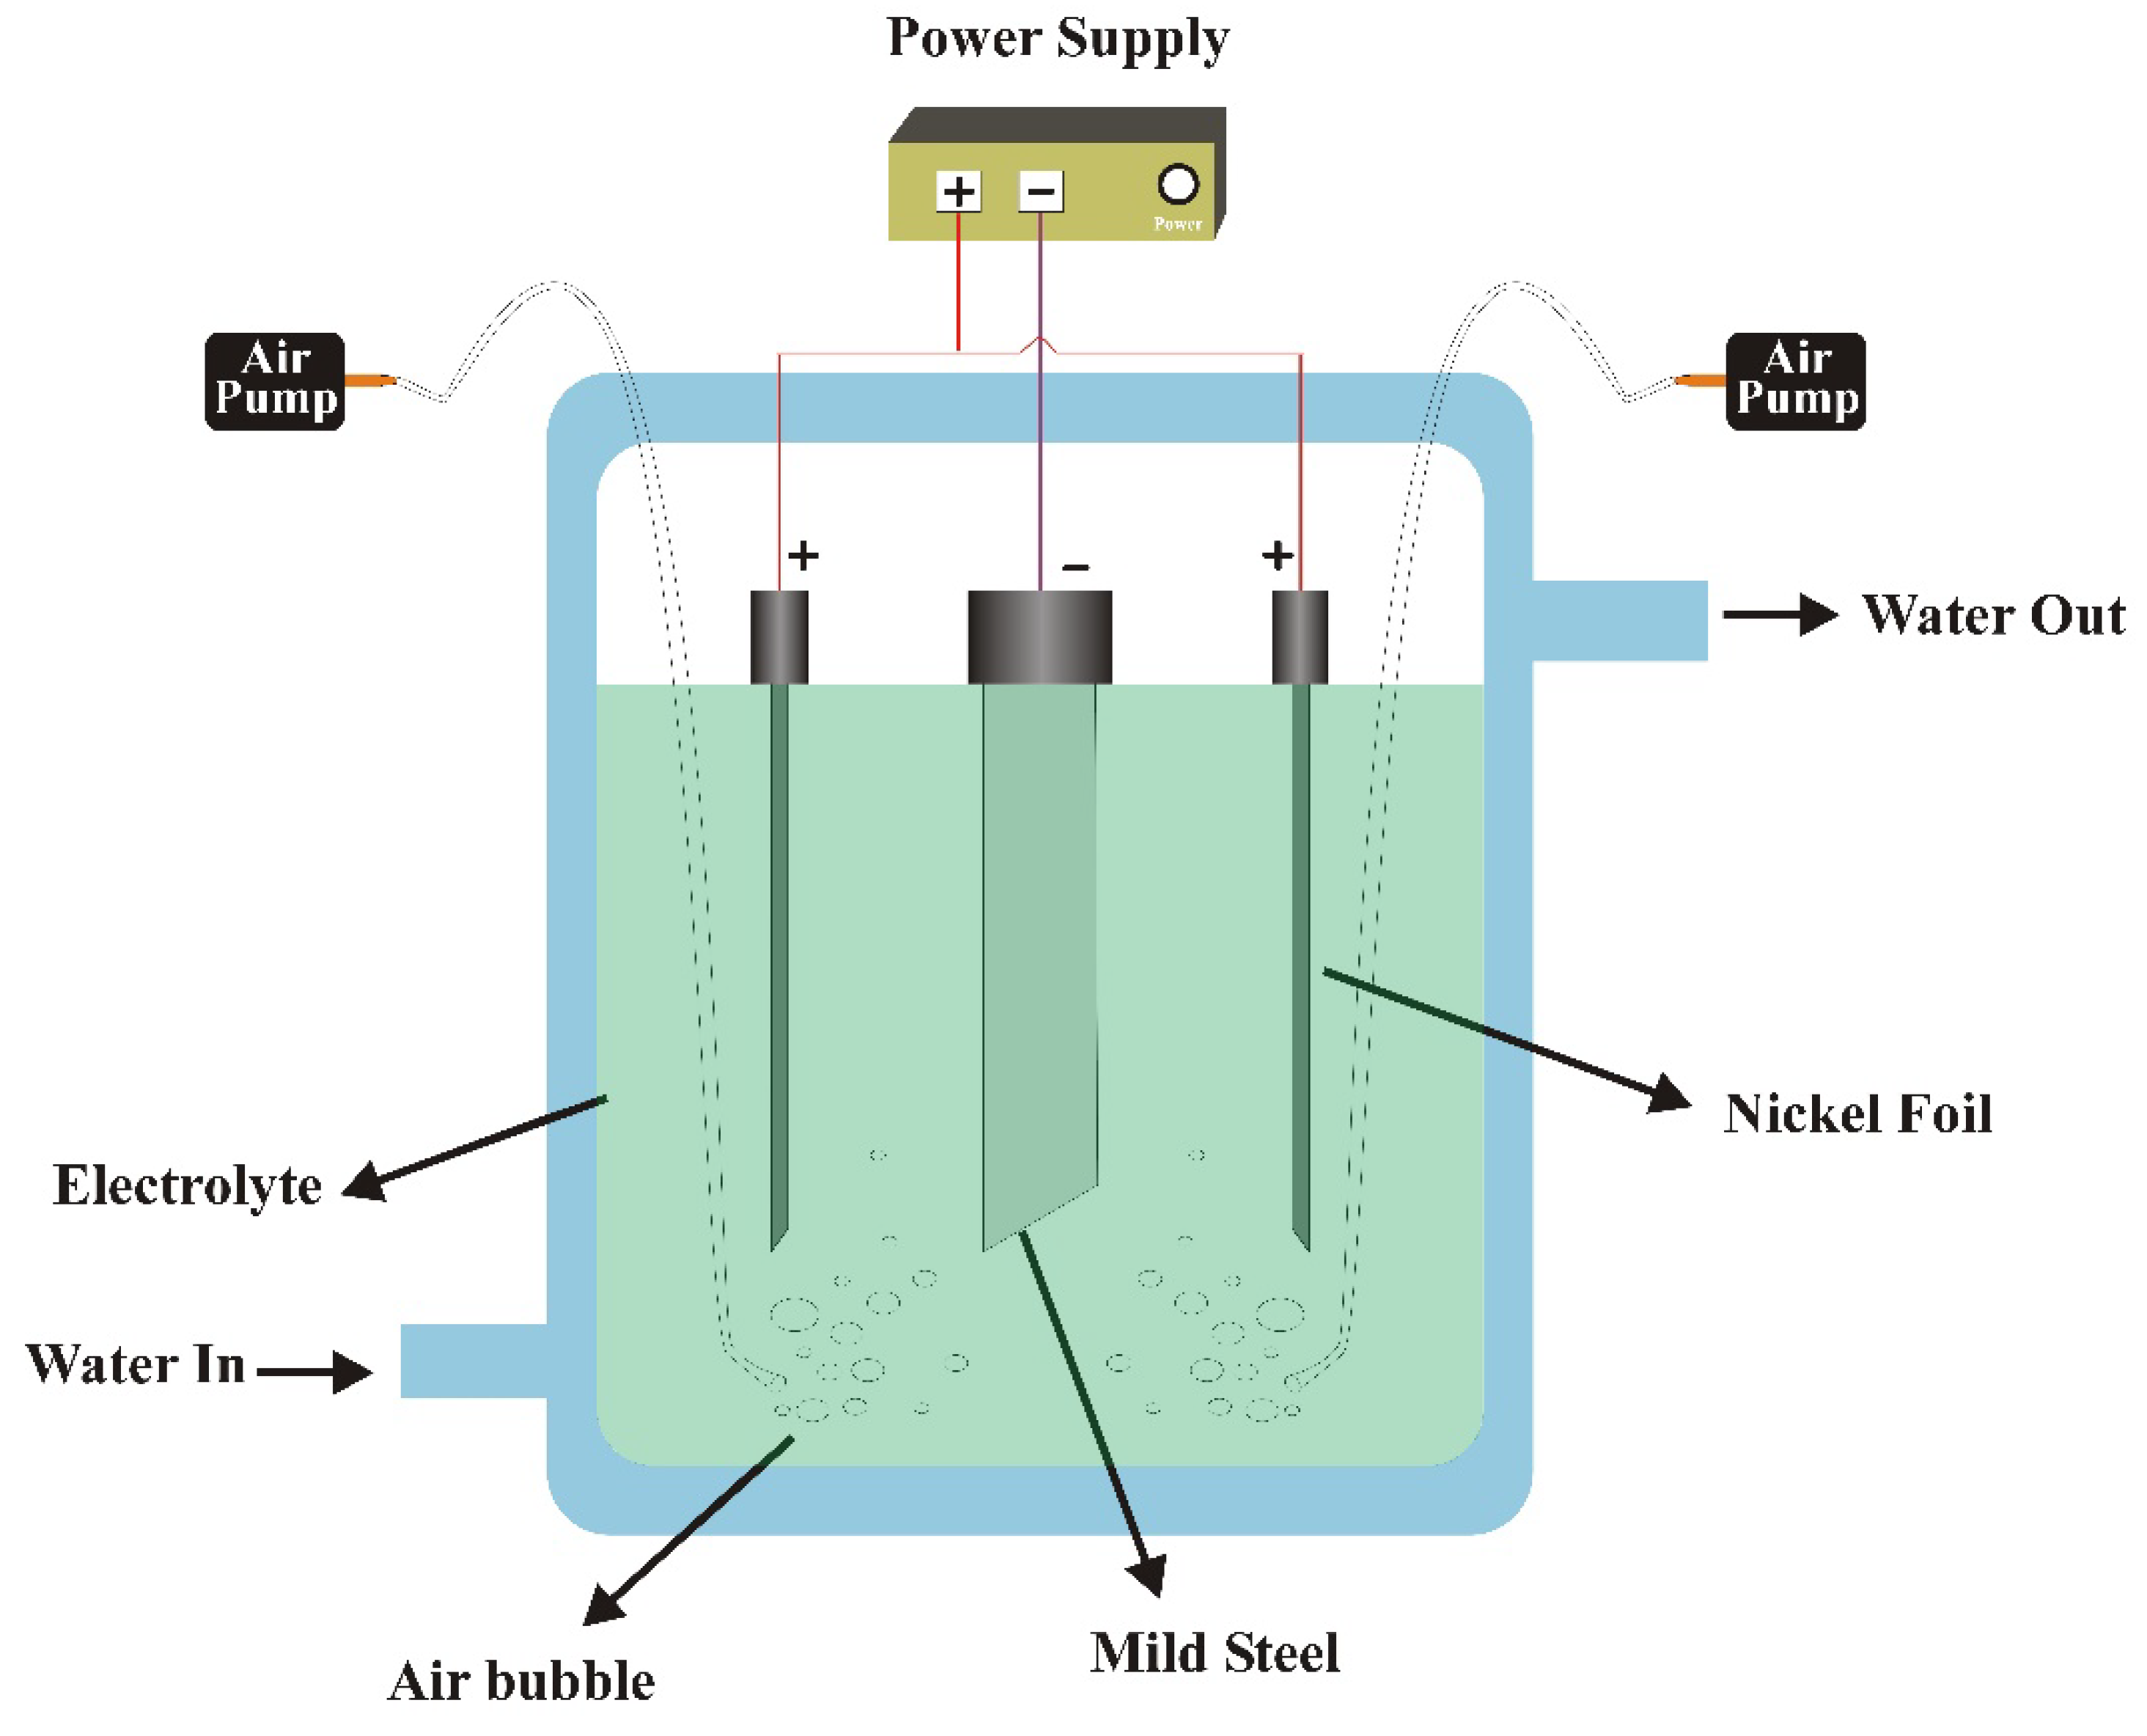
Figure 1. Schematic diagram of the electroplating setup used to deposit pure Zn, Zn-Ni and pure Ni coatings.
Metals 12 00096 g001
Figure 2. Cross-sectional microstructural of the (a) pure Zn, (b) Zn-Ni-10, (c) Zn-Ni-15 (d) Zn-Ni-20, (e) Zn-Ni-25, and (f) pure Ni coatings. Quantitatively, the central figure describes the variation in coating thickness and % cathodic current efficiency (CCE) as a function of Ni concentration in the electroplating bath solution.
Metals 12 00096 g002
Figure 3. SEM images (a) Zn (b) Zn-Ni-10 (c) Zn-Ni-15 (d) Zn-Ni-20 (e) Zn-Ni-25 (f) Ni coatings.
Metals 12 00096 g003
Figure 4. Surface morphology of the (a) pure Zn and (b) Ni coating showing the elemental distribution of Zn, and Ni in the coating, respectively. The ‘O’ maps are shown to highlight the presence of any oxide species on the surface.
Metals 12 00096 g004
Figure 5. Surface topography of the Zn-Ni alloy coatings showing the distribution of Zn, Ni, Fe and O elements in the microstructure of (a) Zn-Ni-10, (b) Zn-Ni-15 (c) Zn-Ni-20 and (d) Zn-Ni-25 coatings.
Metals 12 00096 g005
Figure 6. Open-circuit potential trend of the Zn-Ni alloy coatings.
Metals 12 00096 g006
Figure 7. Cyclic polarization scan comparison between (a) bare steel substrate, pure zinc and pure nickel coating (b) Zn-Ni alloy coating.
Metals 12 00096 g007
Figure 8. Schematic polarization trends of Fe, Zn and Ni to understand the dissolution tendency of metallic coatings on the steel surface.
Metals 12 00096 g008
Figure 9. The surface appearance of coatings before and after salt spray tests: (a) Zn (b) Zn-Ni-10 (c) Zn-Ni-15 (d) Zn-Ni-20 (e) Zn-Ni-25.
Metals 12 00096 g009
Figure 10. The surface appearance of nickel coatings before and after salt spray test.
Metals 12 00096 g010
Table 1. Different electroplating bath compositions used to apply pure Zn, Ni metallic and Zn-Ni alloy coatings.
ConcentrationZn BathNi BathZn-Ni-10 BathZn-Ni-15 BathZn-Ni-20 BathZn-Ni-25 Bath
ZnSO4 (g·L−1)150-150150150150
NiSO4 (g·L−1)-1510152025
Note: All baths contain Na2SO4 (40 g·L1), BH3O3 (15.5 g·L−1), C12H25NaO4S (0.05 g·L−1), pH 2 ± 0.1, temperature 40 °C.
Table 2. Kinetic parameters of bare steel, Zn, Ni and Zn-Ni alloy coating in 3.5 wt.% NaCl solution.
* Ni Contents
Wt%
βa
(mV-decade−1)
βc
(mV-decade−1)
icorr
(μA-cm−2)
Ecorr
(mV)
Corrosion Rate
(mpy)
Bare Steel 73.744.25.56−9692.541
Zn-38.3297.257.10−124026.12
Ni-284.2171.93.27−734 1.50
Zn-Ni-102.9 ± 0.9130.8236.226.50−127012.12
Zn-Ni-153.4 ± 1.0117.9129.925.12−129011.44
Zn-Ni-204.1 ± 0.7122.986.819.20−1280 8.80
Zn-Ni-255.3 ± 1.087.699.715.90−13007.25
* As measured by EDS analysis.
Publisher’s Note: MDPI stays neutral with regard to jurisdictional claims in published maps and institutional affiliations.