Abstract
The spherical pressure hull used in the manned cabin of deep-sea submersibles endures low-cycle fatigue problems during the process of cyclic submergence and recovery, but fatigue testing on its full-scale model is difficult to conduct. To approximate the problem, the paper proposed the design of an L-type equivalent welding joint to simulate the status of the strengthened part of the spherical pressure hull under a certain cyclic axial pressure history. The design principle of the equivalent welding joint is to ensure that the stress ratio between inner and outer surface and the distribution of the simulated test piece should be similar to or smaller than the actual stress distribution characteristics in the critical zone of the spherical hull for conservative consideration. The angle of the L-type joint is 175° in the present study, at which the stress on the outside is at the turning point from compressive stress to tensile stress. The fatigue experiment of the equivalent welding joint is conducted with measurements of crack growth and residual stresses. Multiple cracks are observed in the vicinity of the weld, which grows showing a typical low-cycle fracture morphology. The three-dimensional finite element modelling for the equivalent welding joint with prefabricated notch and the same weld zone shape with its tested piece is carried out. An improved crack growth model proposed by the author’s group, considering multiple factors, is adopted for crack growth calculation and compared with experimental results, which shows satisfactory agreement. The finite element modelling based on the pre-designed L-type joint combined with the improved crack growth rate model can be applied as a simplified method to simulate the fatigue life of the spherical pressure hull.
1. Introduction
With the development of deep-diving technology, large pressure hulls have been widely used in deep-sea submersibles in recent years [1,2,3,4,5,6,7]. The spherical hull in the manned cabin of deep-sea submersible is the most important component in the whole system, which usually accommodates three pilots or scientists and is typically designed with an inner diameter of over 2.0 m and thickness of more than tens of centimeters [5,8,9]. It is generally manufactured by two hemispheres punched and welded together with several large openings and strengthened by forged components [8,9]. The spherical pressure hull belongs to thick shell made of high-strength metal material, so the welding process is very challenging [9,10]. Heat treatment process has the problem that it cannot completely eliminate residual stress, and welded parts are prone to inducing stress concentration. The coexistence of welding residual stress and unavoidable welding defects can easily lead to crack propagation and final structural damage of the whole structure [10,11,12], which threatens structural security.
In order to ensure the design and manufacturing reliability, as well as the operation safety, many scholars have studied the ultimate bearing capacity of the spherical pressure hulls and its corresponding influential factors [13,14,15,16,17,18], some of which are adopted by ship classification societies [19]. However, these studies are mainly based on static strength analysis or nonlinear buckling analysis [14,15,16] and do not consider the strength degradation in the process of long-term service. During the service of the submersible, the spherical pressure hull will be subjected to cyclic loading with high pressure in the deep sea. The fatigue problem in long-term repeated operation should be paid attention in the future, which must take into account residual stress and initial defects [20,21,22]. Some researchers have studied the performance of pressure hull materials under cyclic loading [23]. In addition, numerous studies have been made to estimate the welding residual stresses [24,25] of metal structures combined with experimental and numerical techniques under different loading conditions. Fatigue life assessment of pressure hull is studied by a method based on equivalent structural stress [26], and the most common approach to model the entire fatigue life of as-weld joints with some initial residual stress and flaws is by fracture mechanics [27]. However, there are no clear conclusions, and experiment-based evaluation practices only presently discuss methodology [6,20]. Generally, as other marine structures, there are two methods for fatigue evaluation of deep-sea pressure hulls, namely, cumulative damage method based on an S–N curve and fracture mechanics method based on crack growth rate [28,29,30]. However, the submersible has its particularity of load history [20,31,32,33] with a certain of dwell time expressing the underwater service time in each diving cycle. Some efforts have been made in the past for the fatigue life assessment of the deep-sea spherical pressure hulls, although the practicability has not been verified. Most of which apply theoretical and numerical analysis based on cumulative damage theory and simplified loading history [20,33,34]. The application of these methods requires the determination of material parameters by sample tests. To obtain basic parameters, tests are conducted to obtain the fracture resistance and fatigue properties for high-strength titanium alloys [8,9]. In addition, a simplified method to estimate the fatigue life of deep-sea spherical pressure hulls is proposed based on a modified S–N curve of the material under dwell-fatigue loading history [20]. However, validation by full-scale model is almost impossible for this purpose due to expensive experimental costs beyond normal budget. The fatigue testing even by using a scale spherical model in a high pressure chamber is still unrealistic, with excessive cost on long-term repeated application of high pressure testing equipment. Therefore, some new methods to investigate the fatigue performance of actual pressure hulls are presented to approach the real situation from wide aspects.
In this paper, it is proposed to design an equivalent welding joint that can approximately simulate the stress gradient distribution in the vicinity of the key positions of spherical pressure hull and fatigue testing is carried out to obtain the characteristics of crack growth with specially designed test fixture. A spherical pressure hull used for the deep sea of 6000 m is taken as a research object for designing the equivalent welding joint based on the static analysis of the spherical hull. In order to consider the constraints of observation windows, the hatch cover and the penetration parts, the model of the whole manned cabin is established for numerical analysis. Then, the sample is designed and fabricated according to the calculation results of the bending stress ratio. Residual stress measurement is carried out before testing to provide input of residual stress condition following crack growth simulation. The fatigue experiment of the crack length measurement accomplished by optical techniques is carried out. Crack growth versus cycles in different positions are recorded to show the failure process. A simplified simulation on the crack growth is conducted to provide reference by using finite element method to simulate the fatigue life of the spherical hulls.
2. Design of the Equivalent Welding Joint
2.1. Material of the Equivalent Welding Joint
In the present study, a type of beta-annealed titanium alloy Ti-6Al-4V (extra-low interstitial, ELI) is considered as material for the spherical pressure hull of the manned cabin used in a submersible with a designed depth of 6000 m. The material properties of base and weld material are experimentally studied during the manufacture process of the spherical hull with the results listed in Table 1, where σy, σb, ε, E, υ are, respectively, the yield strength, the ultimate tensile strength, the elongation, the elastic modulus and the Poisson’s ratio of the material. The overall performance of the weld material is lower than that of the base metal for strength and elongation, respectively. The existence of defects further reduces the performance of the welds.

Table 1.
Mechanical properties of base and weld material of the spherical hull in room temperature.
2.2. Design of the Equivalent Welding Joint
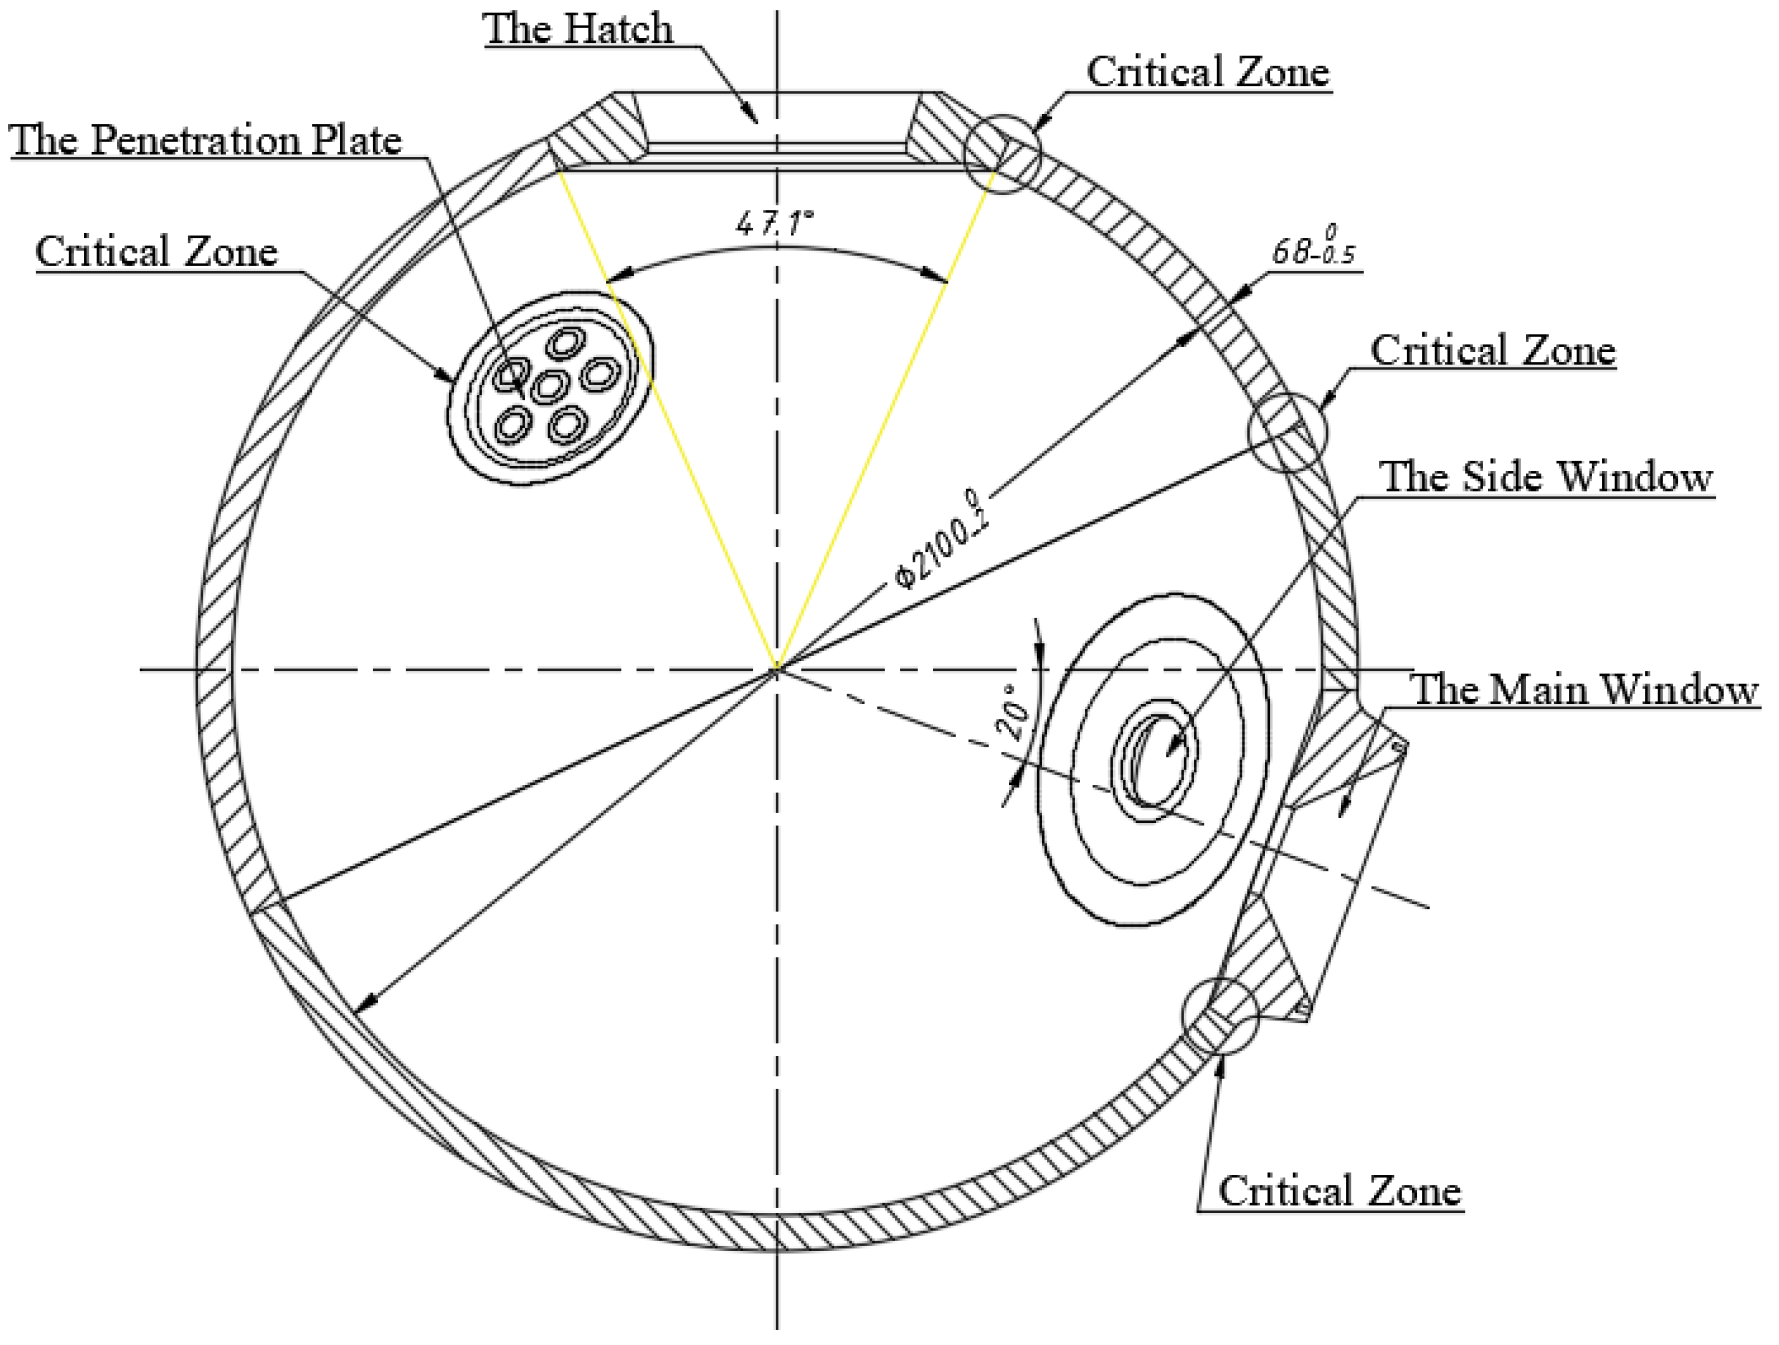
The design principle of the equivalent welding joint is to ensure that the stress ratio between inner and outer surface and the distribution of the simulated test piece should be similar to or smaller than the actual stress distribution characteristics in the critical zone of the spherical hull for conservative consideration. Figure 1 illustrates that critical parts in the cracks tend to initiate in the spherical pressure hull. These positions are mainly distributed at the reinforcing parts of each opening, including those for the hatch, the windows and the penetration plates. The design principle of these reinforcing parts is that the stress level there cannot exceed the tensile yield strength of the material.
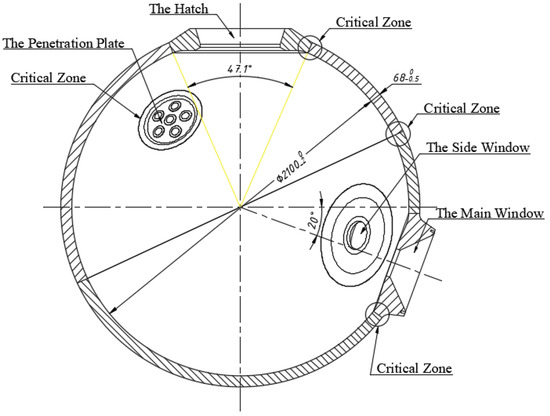
Figure 1.
A sketch of spherical pressure hull with critical zones that cracks tend to initiate.
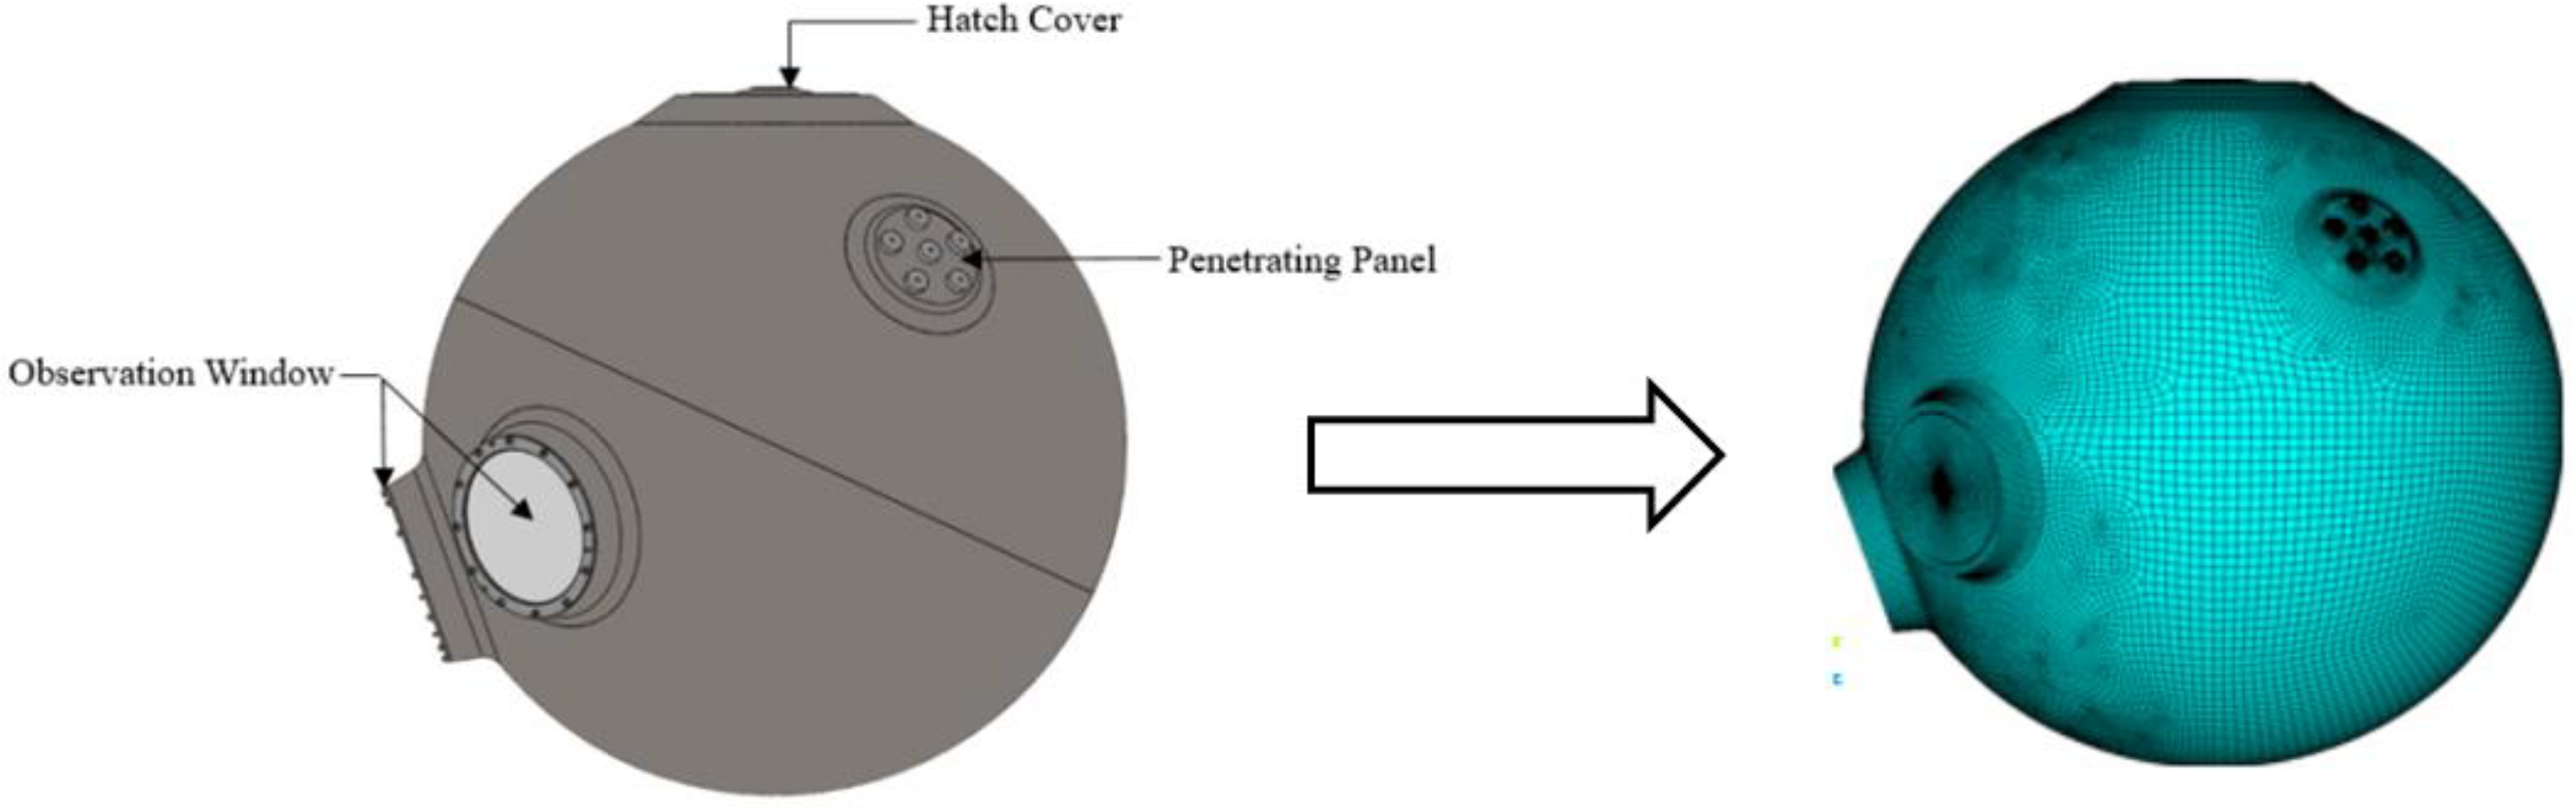
The static finite element analysis in ANSYS code by using bilinear material model is conducted to obtain the stress distribution characteristics in the critical zones of the spherical pressure hull. A sketch of the manned cabin involved in this study is shown in Figure 2, which is applied in a deep-sea manned submersible to the diving depth of 6000 m (the designed operation pressure will be 60 MPa). The manned cabin is composed of a pressure spherical hull, an access hatch cover, three observation windows, two electrical penetration panels and a set of hatch cover opening and closing mechanism. Its inner diameter and thickness are, respectively, 2100 mm and 68 mm. Three-dimensional element SOLID186, together with TARGE170 and CONTA174 used as the contact elements, are applied for modelling of the whole manned cabin. The spherical hull is divided into three layers elements in thickness (t) direction, and the overall mesh size is 40 × 40 mm × t/3. All parts of the manned cabin are refined according to the actual situation, and the hexahedral element is mainly used in the model. An average mesh size of 10 mm is applied. The high-strength titanium alloy Ti-6Al-4V ELI is used for the metal spherical hull and the material of the penetrating parts is stainless steel 17-4PH H925. The observation windows are manufactured by using PMMA (polymethyl methacrylate).

Figure 2.
Sketch of the manned cabin used in deep-sea manned submersible to the depth of 6000 m.
Three-point constraints are set according to the CCS Specification [19]. The external sea water pressure is applied to the external surfaces of the spherical hull, the surface of the observation window and all the external surfaces of the access hatch cover exposed to the sea water. For the opening of the penetration, the corresponding water pressure is equivalent to the surrounding external surface. Maximum working pressure of 60 MPa is applied. The results of finite element analysis show that the total stress of the spherical pressure hull is compressive stress, and the reinforcement in the vicinity of the large openings causes geometric discontinuity.
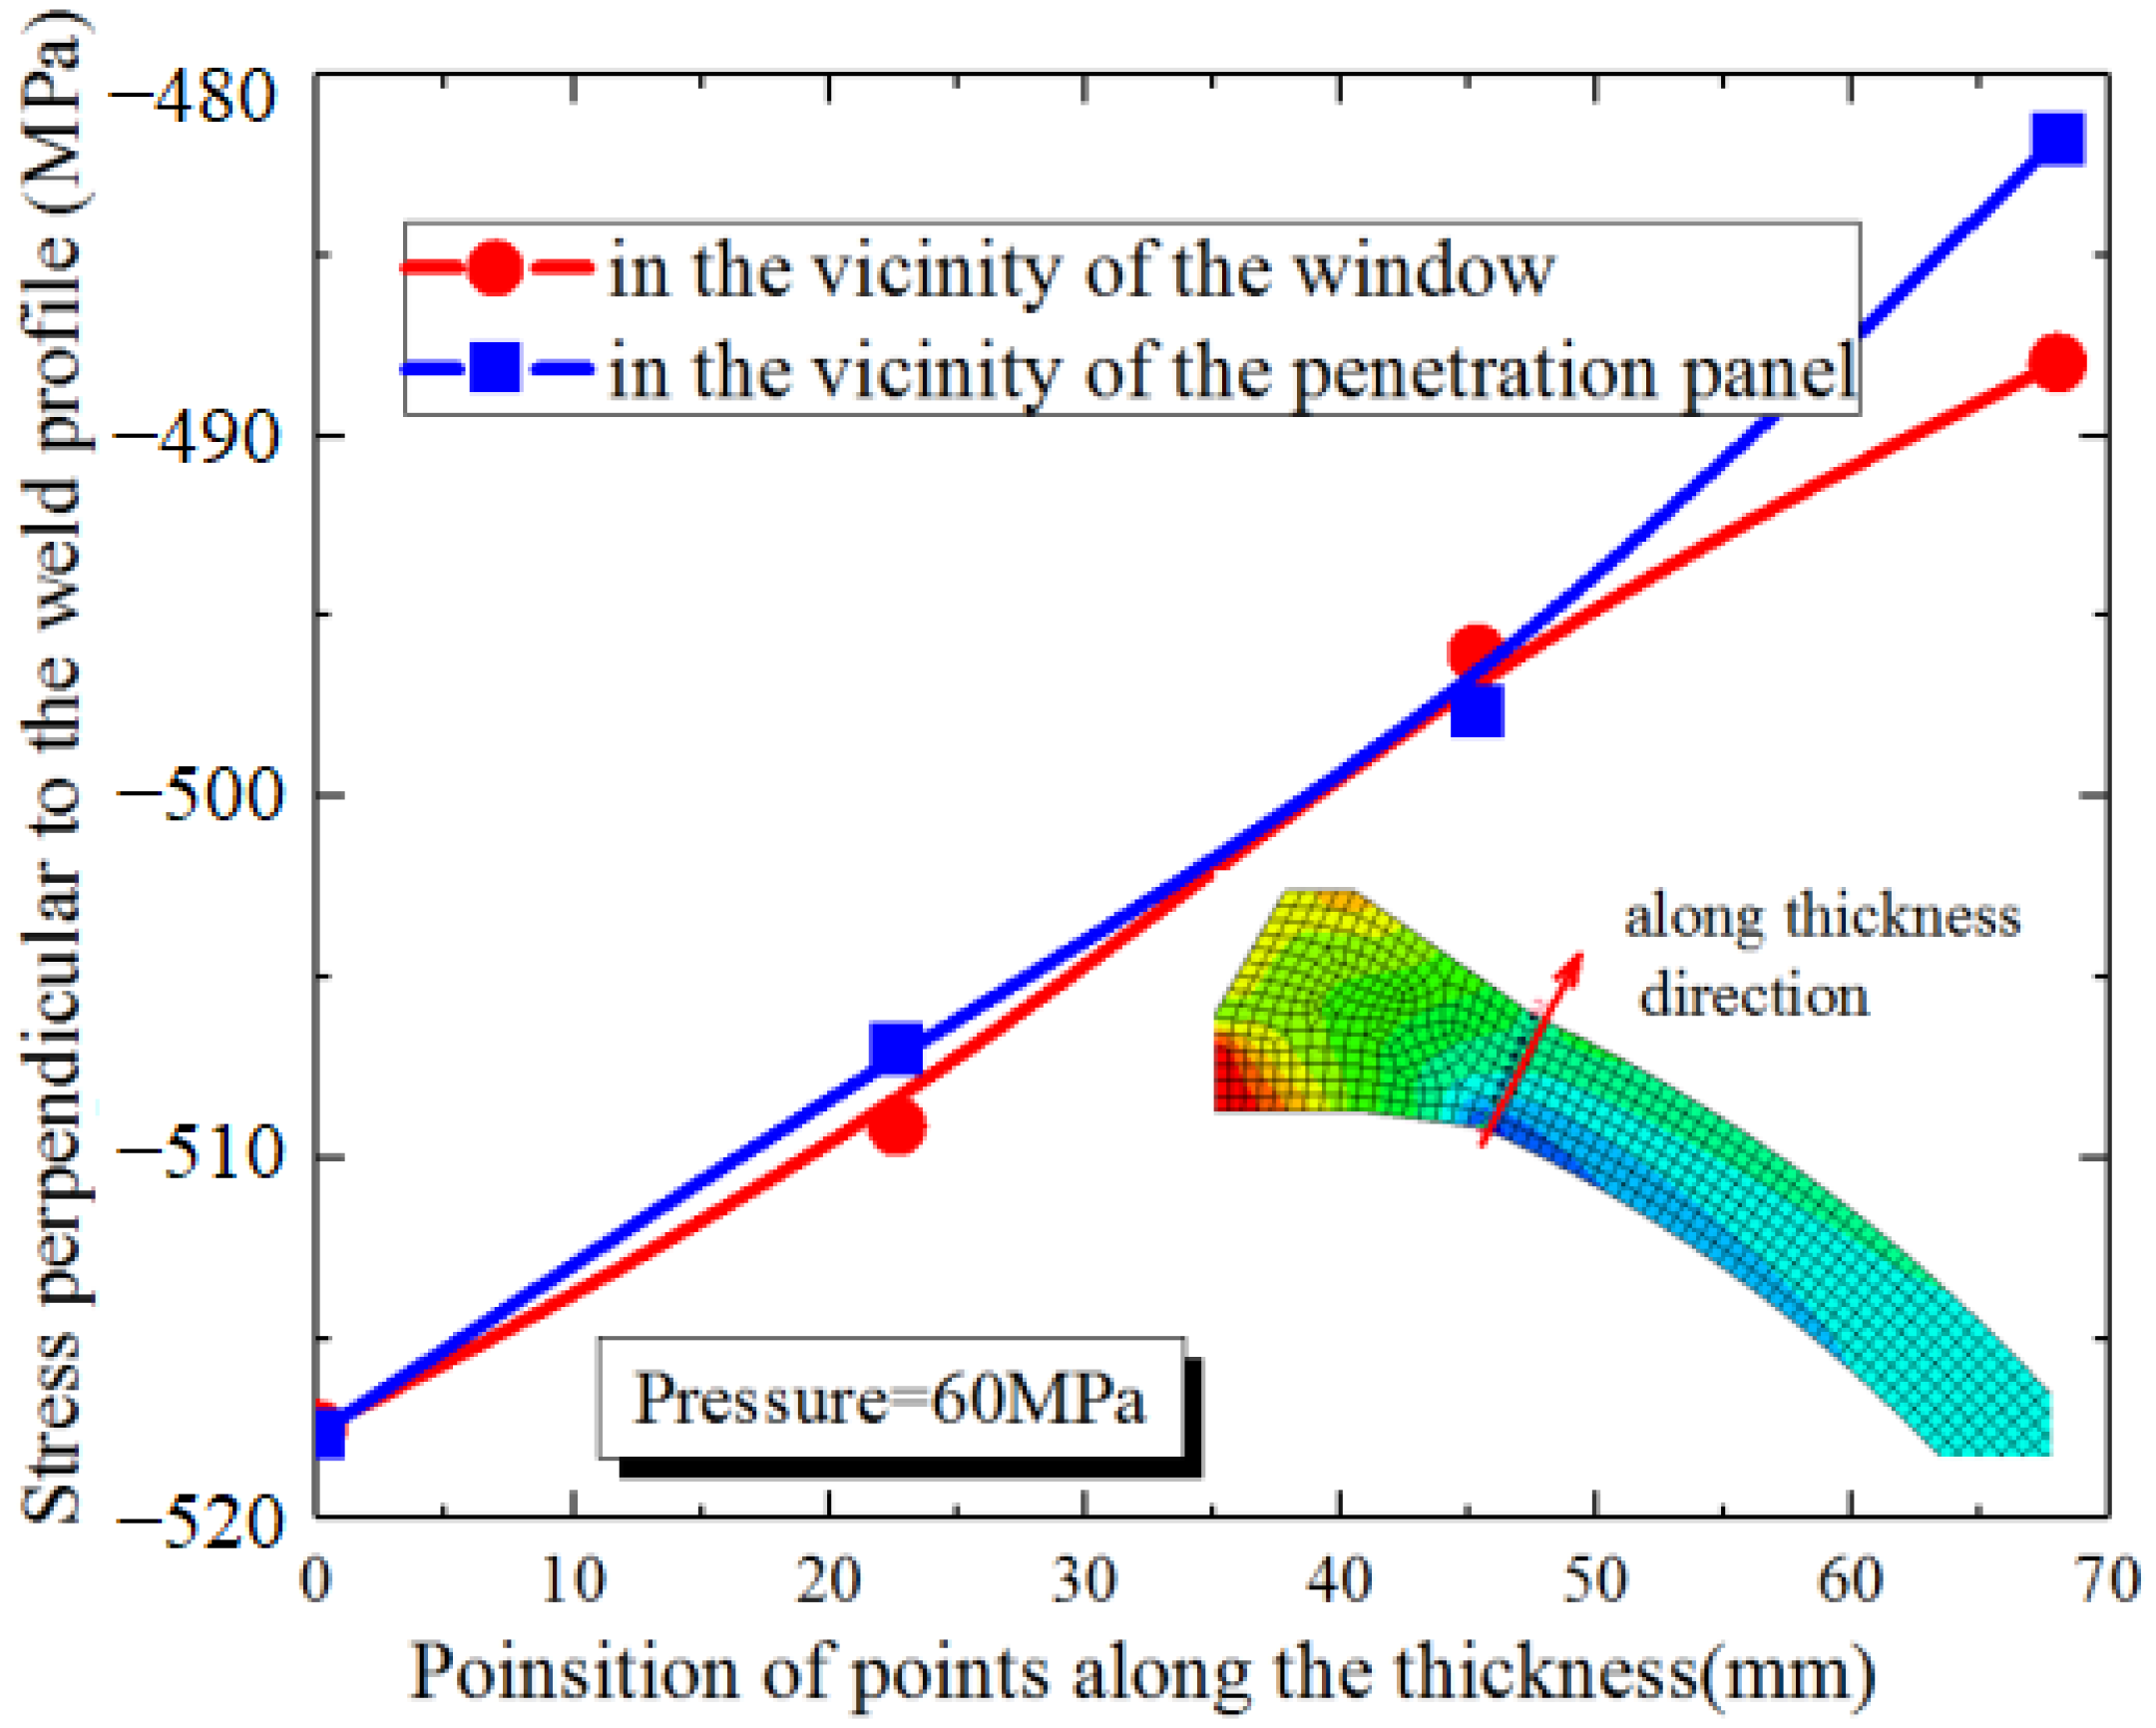
The stress coupled with the residual stress of the welding may make fatigue failure from the inner wall of the reinforcement area. Figure 3 shows the circumferential stress distribution of the spherical hull along two pointed paths in the direction of the hull thickness under the pressure of 60 MPa. Bending is caused by peak stress difference between internal and external surfaces. The ratios of external stress σx1 and internal stress σx2 (the stress vertical to the path along thickness direction) are 0.94 and 0.93, respectively, for penetration area and window area, both of which are critical zone with high stress concentration. As the part in the vicinity of the entrance and exit hatch is designed to be relatively smooth for this cabin, the stress concentration is not obvious, then only the reinforcing parts for the main observation window and the penetration plates are considered presently.
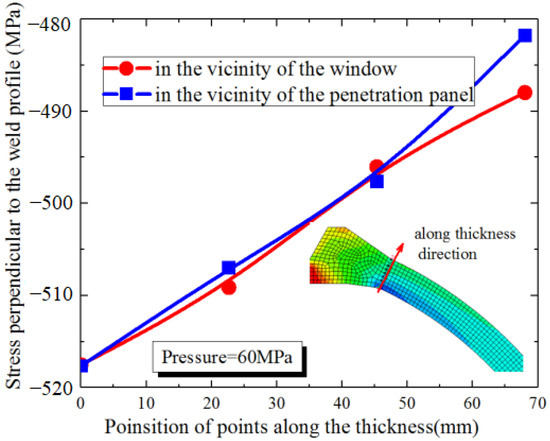
Figure 3.
The circumferential stress distribution along the pointed paths under pressure of 60 MPa.
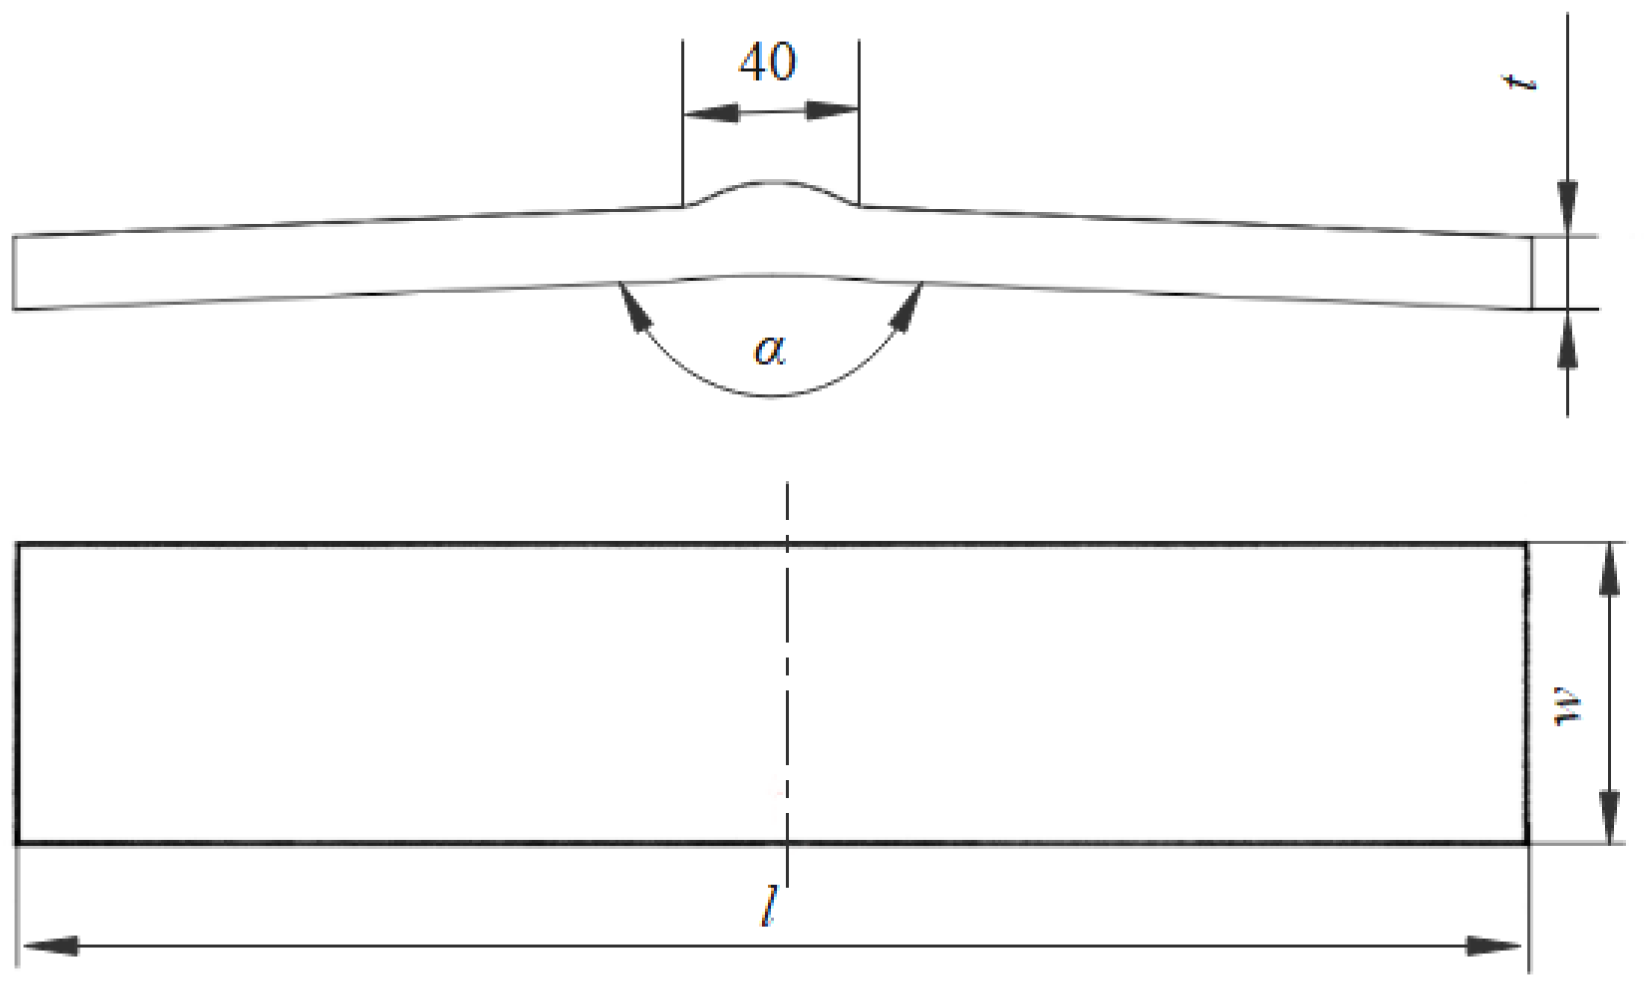
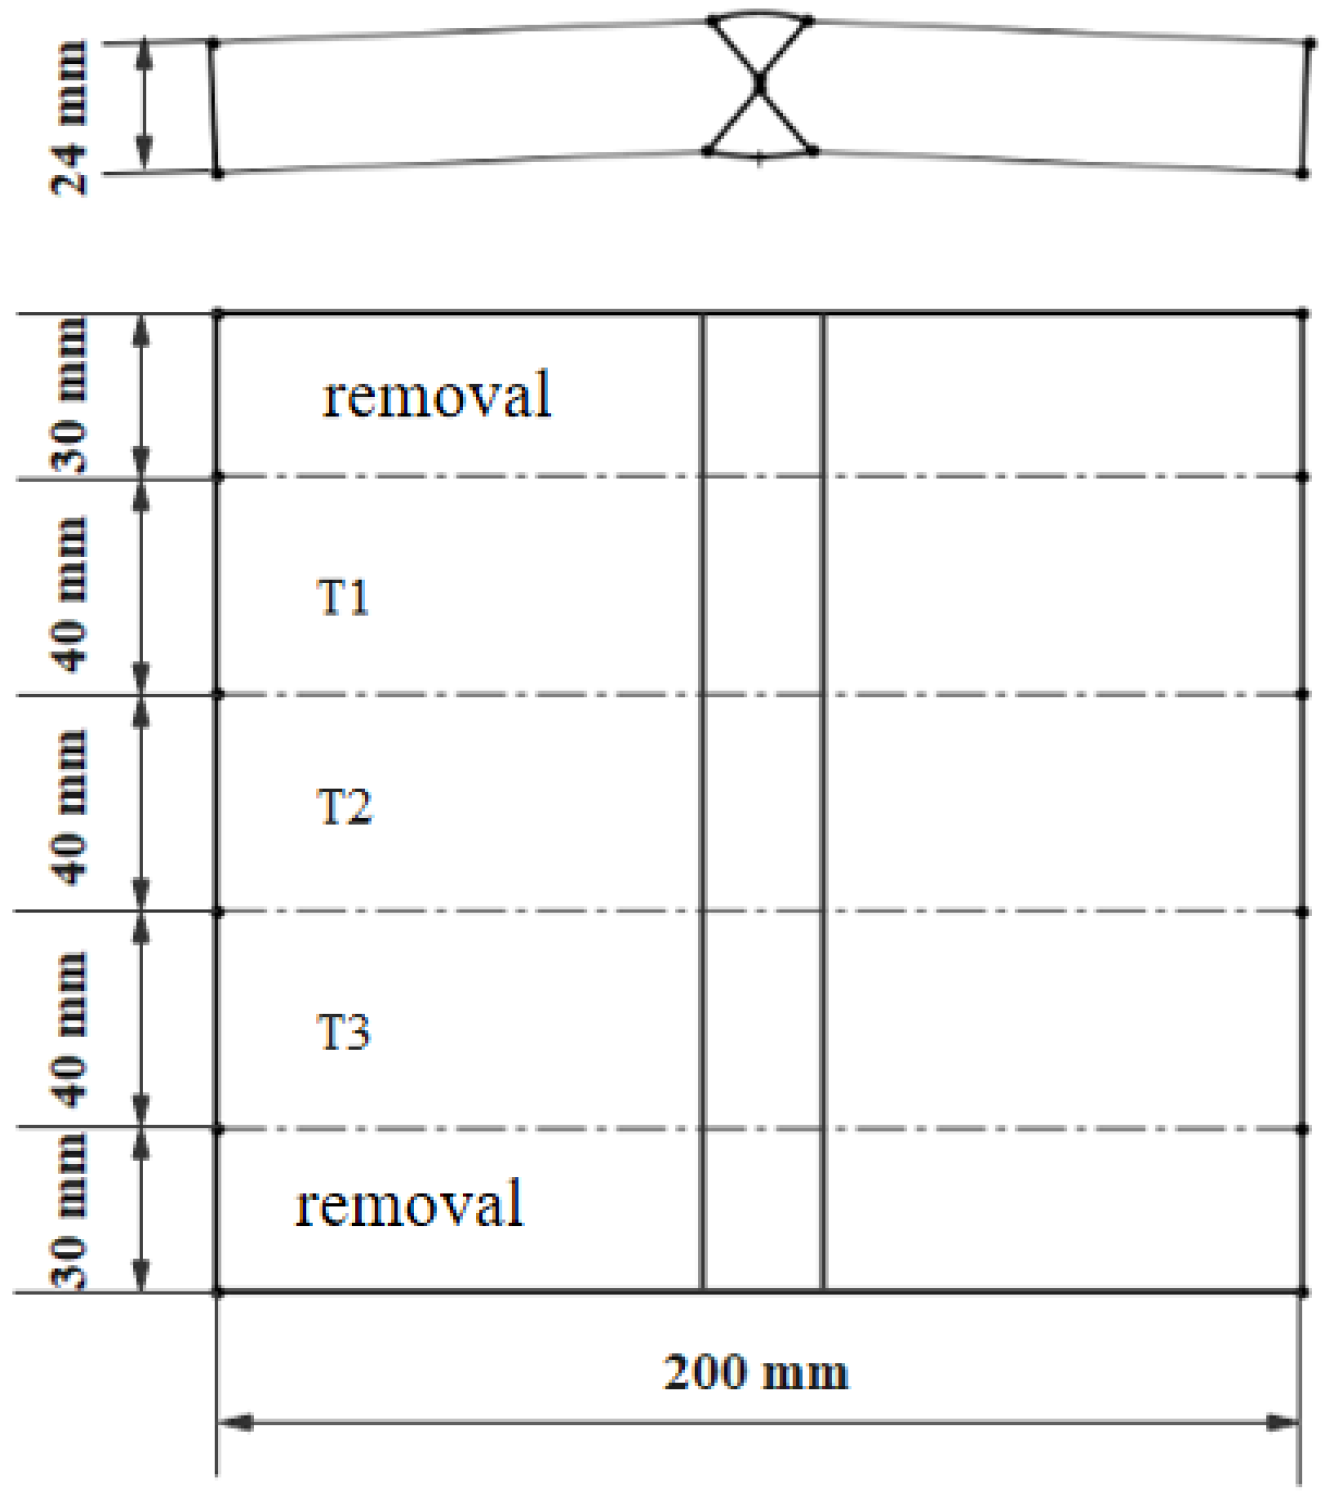
According to finite element analysis, the design of the equivalent welding joint can be a butt weld at a certain angle, being subjected to axial load, which will ensure simulating the mechanical characteristics of the reinforcement zone as accurately as possible. In addition, the fatigue crack growth experiment can be carried out under a certain cyclic axial pressure history. The geometry of the equivalent welding joint mainly includes the plate thickness t, the width w, the length L and the angle α of the joint, as shown in Figure 4. As the thickness of the hull is relatively large. In view of the difficulty of the test and the limit of the text fixture, a thinner sample is applied. According to the design principle, the dimension of the thickness will have no influence on the design. The plate thickness t is 24mm; and the plate width w is 40 mm; the angle α is an important parameter that needs to be optimized for calculation; the length L is determined by the angle α, the test machine capacity and the stability condition.
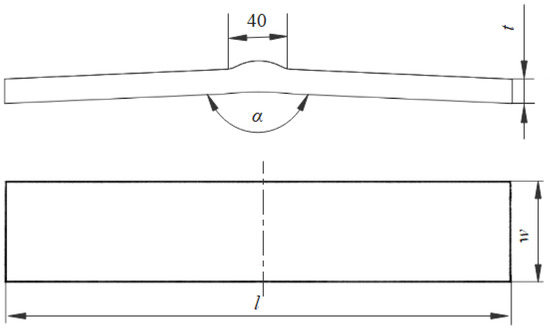
Figure 4.
The geometry of the welding joint.
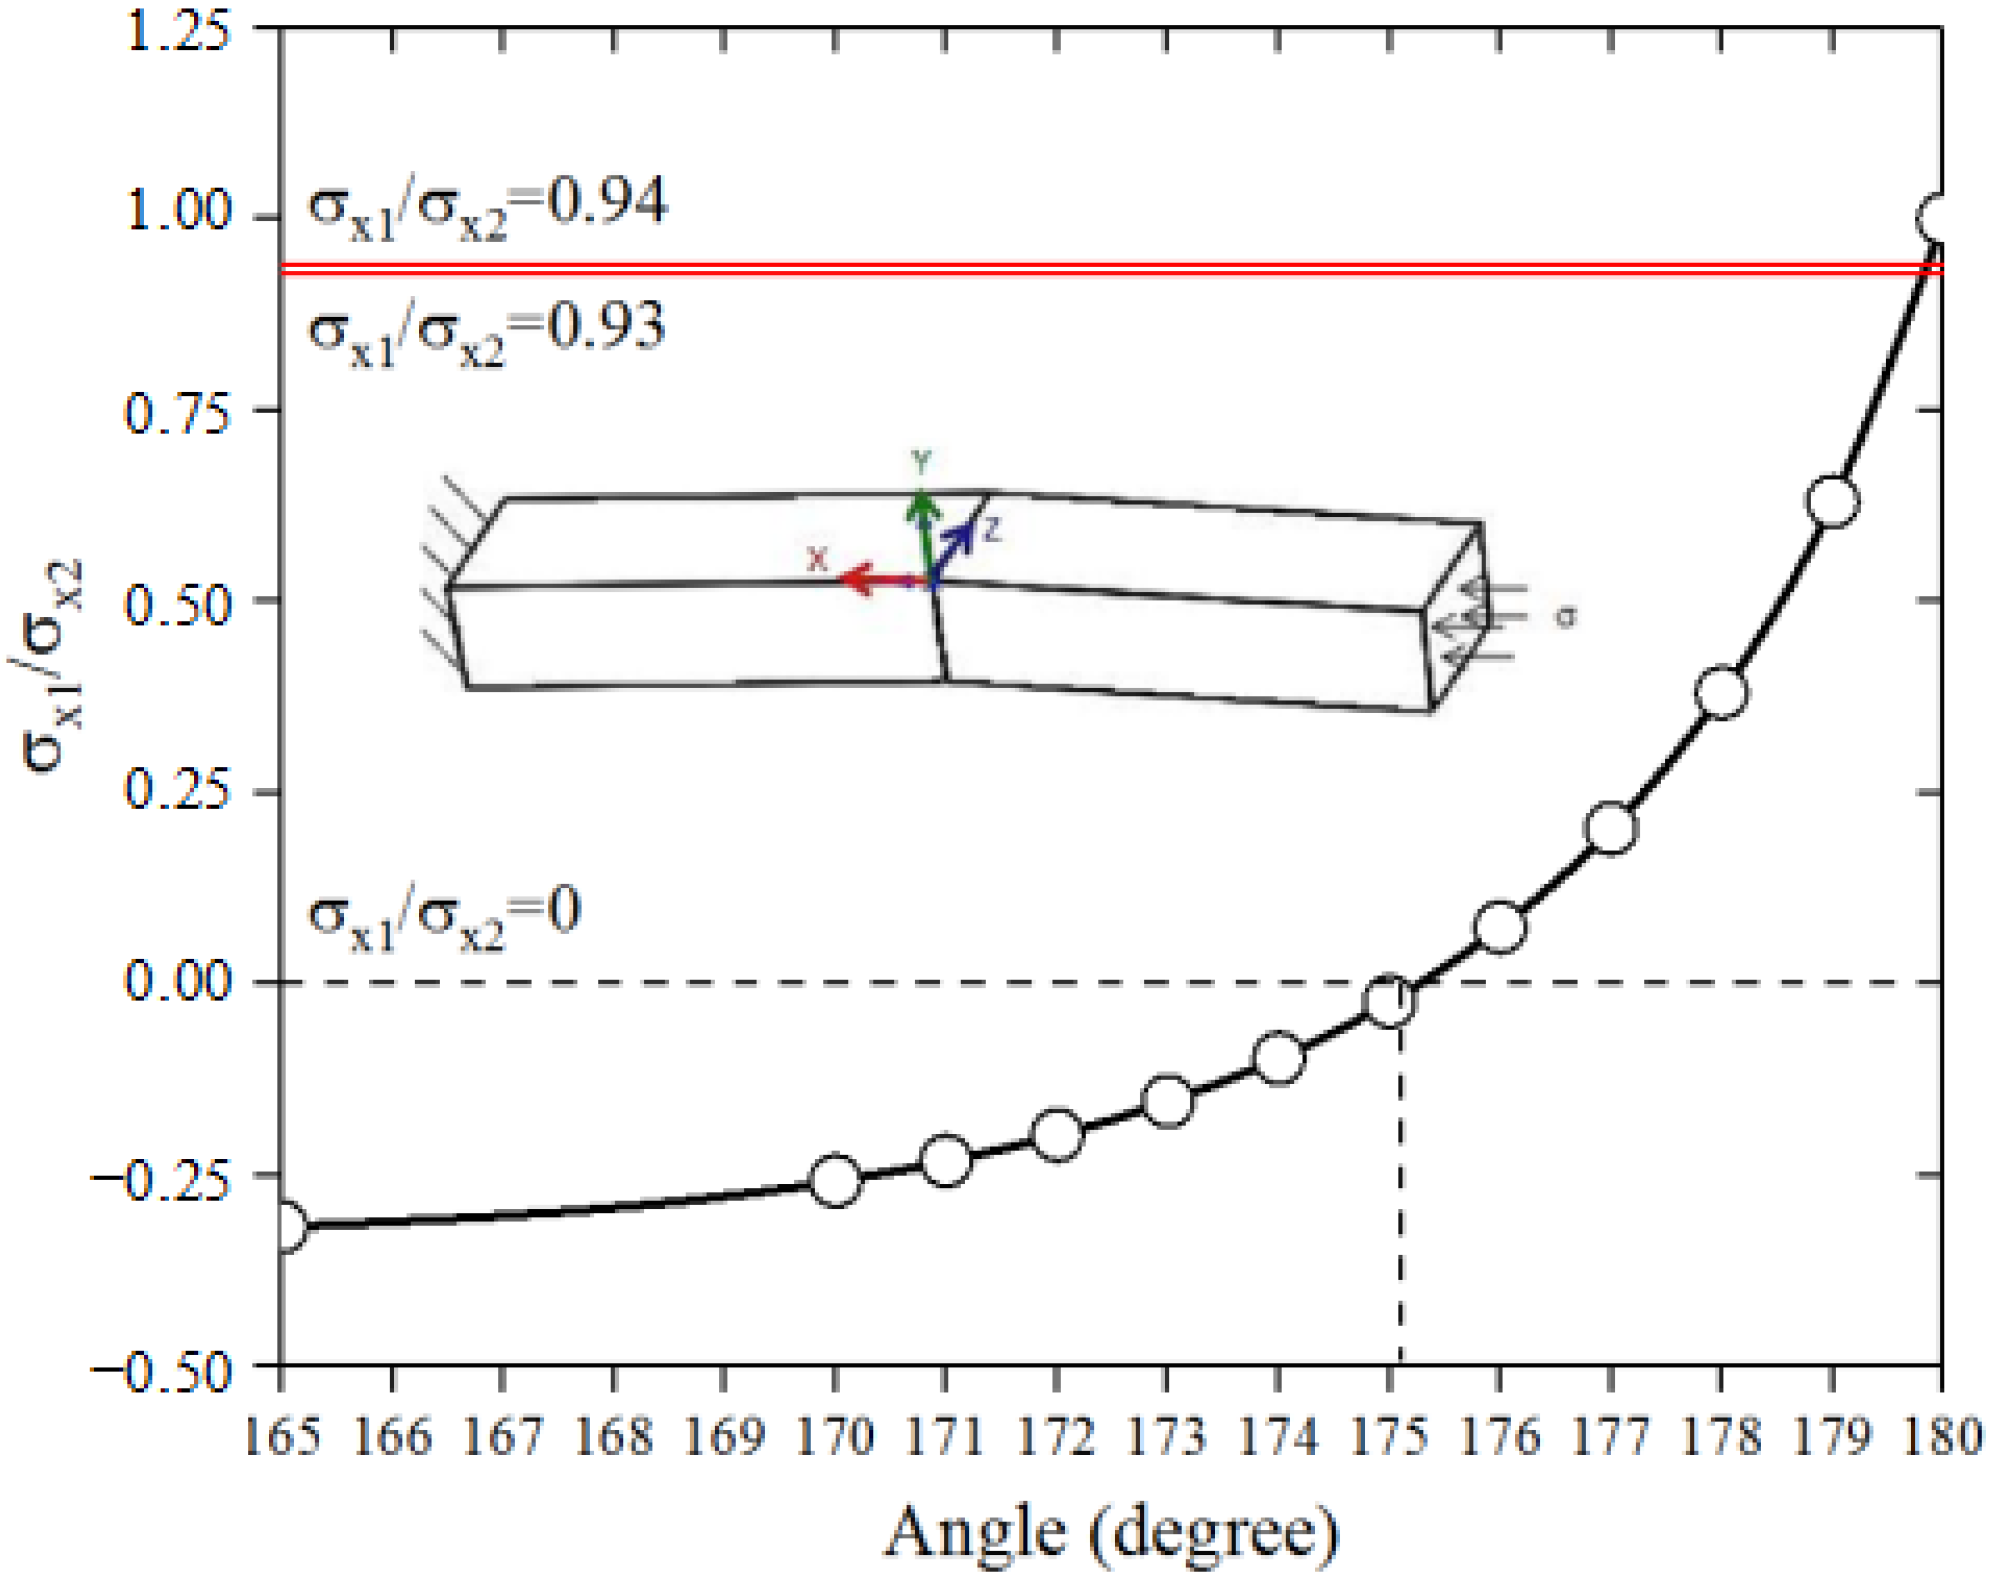
Under the axial pressure of 105 MPa, the ratio of external stress σx1 and internal stress σx2 on the specimen surfaces changes with the angle α shown in Figure 5. In addition, the ratio changes from negative to positive as the internal stress changes from compressive to tensile stress with the increase in the angle. According to Figure 3, the ratio of σx1 and σx2 is about 0.93–0.94, which will lead to the design of the angle a little less than 180°, as depicted in Figure 5. Considering the various factors, such as the difficulty of processing and the principle of conservative design, and to simplify it conservatively, the angle is defined to 175° at which the stress on the outside is at the turning point from compressive stress to tensile stress.
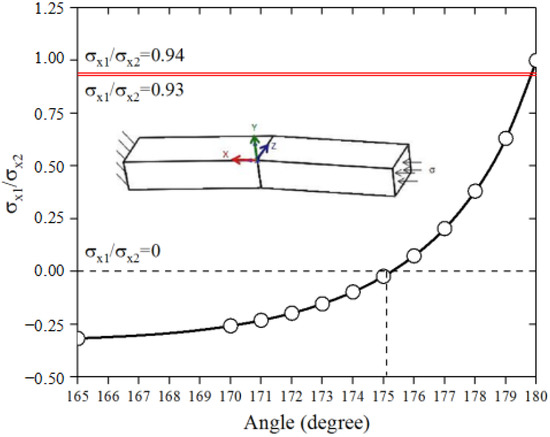
Figure 5.
The ratio of external stress to internal stress varies with angle.
3. Experiment
The two pieces of plates made of Ti-6Al-4V ELI with thickness of 24 mm, length of 100 mm and width of 180 mm are butt welded by TIG welding method with the welding angle of 175°. ERTA2ELI of 2 mm diameter is used as the welding wire, the basic situation of which are shown in Table 2. In the welding process, the welding current range is 120–180 A and the welding speed range is 100mm/min~130mm/min. The flow rate range of 99.99% argon is 14–18 L/min as the shielding gas. In addition, the welding is conducted by 13 layers.
Table 2.
The situation of the welding wire.
3.1. Residual Stress Measurement
The real stress intensity factors of the crack will be the summation of those induced by the applied load together with residual stresses, which plays a critical role on fatigue life. A wide welded joint is sampled to three fatigue specimens by wire cutting, as the equivalent welded joints show in Figure 6.
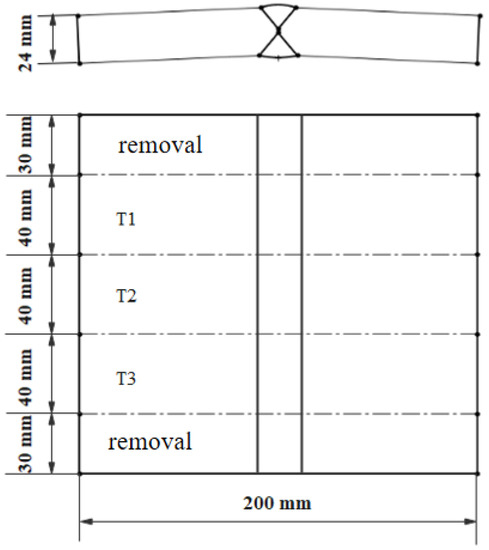
Figure 6.
The sampling of the welded joints.
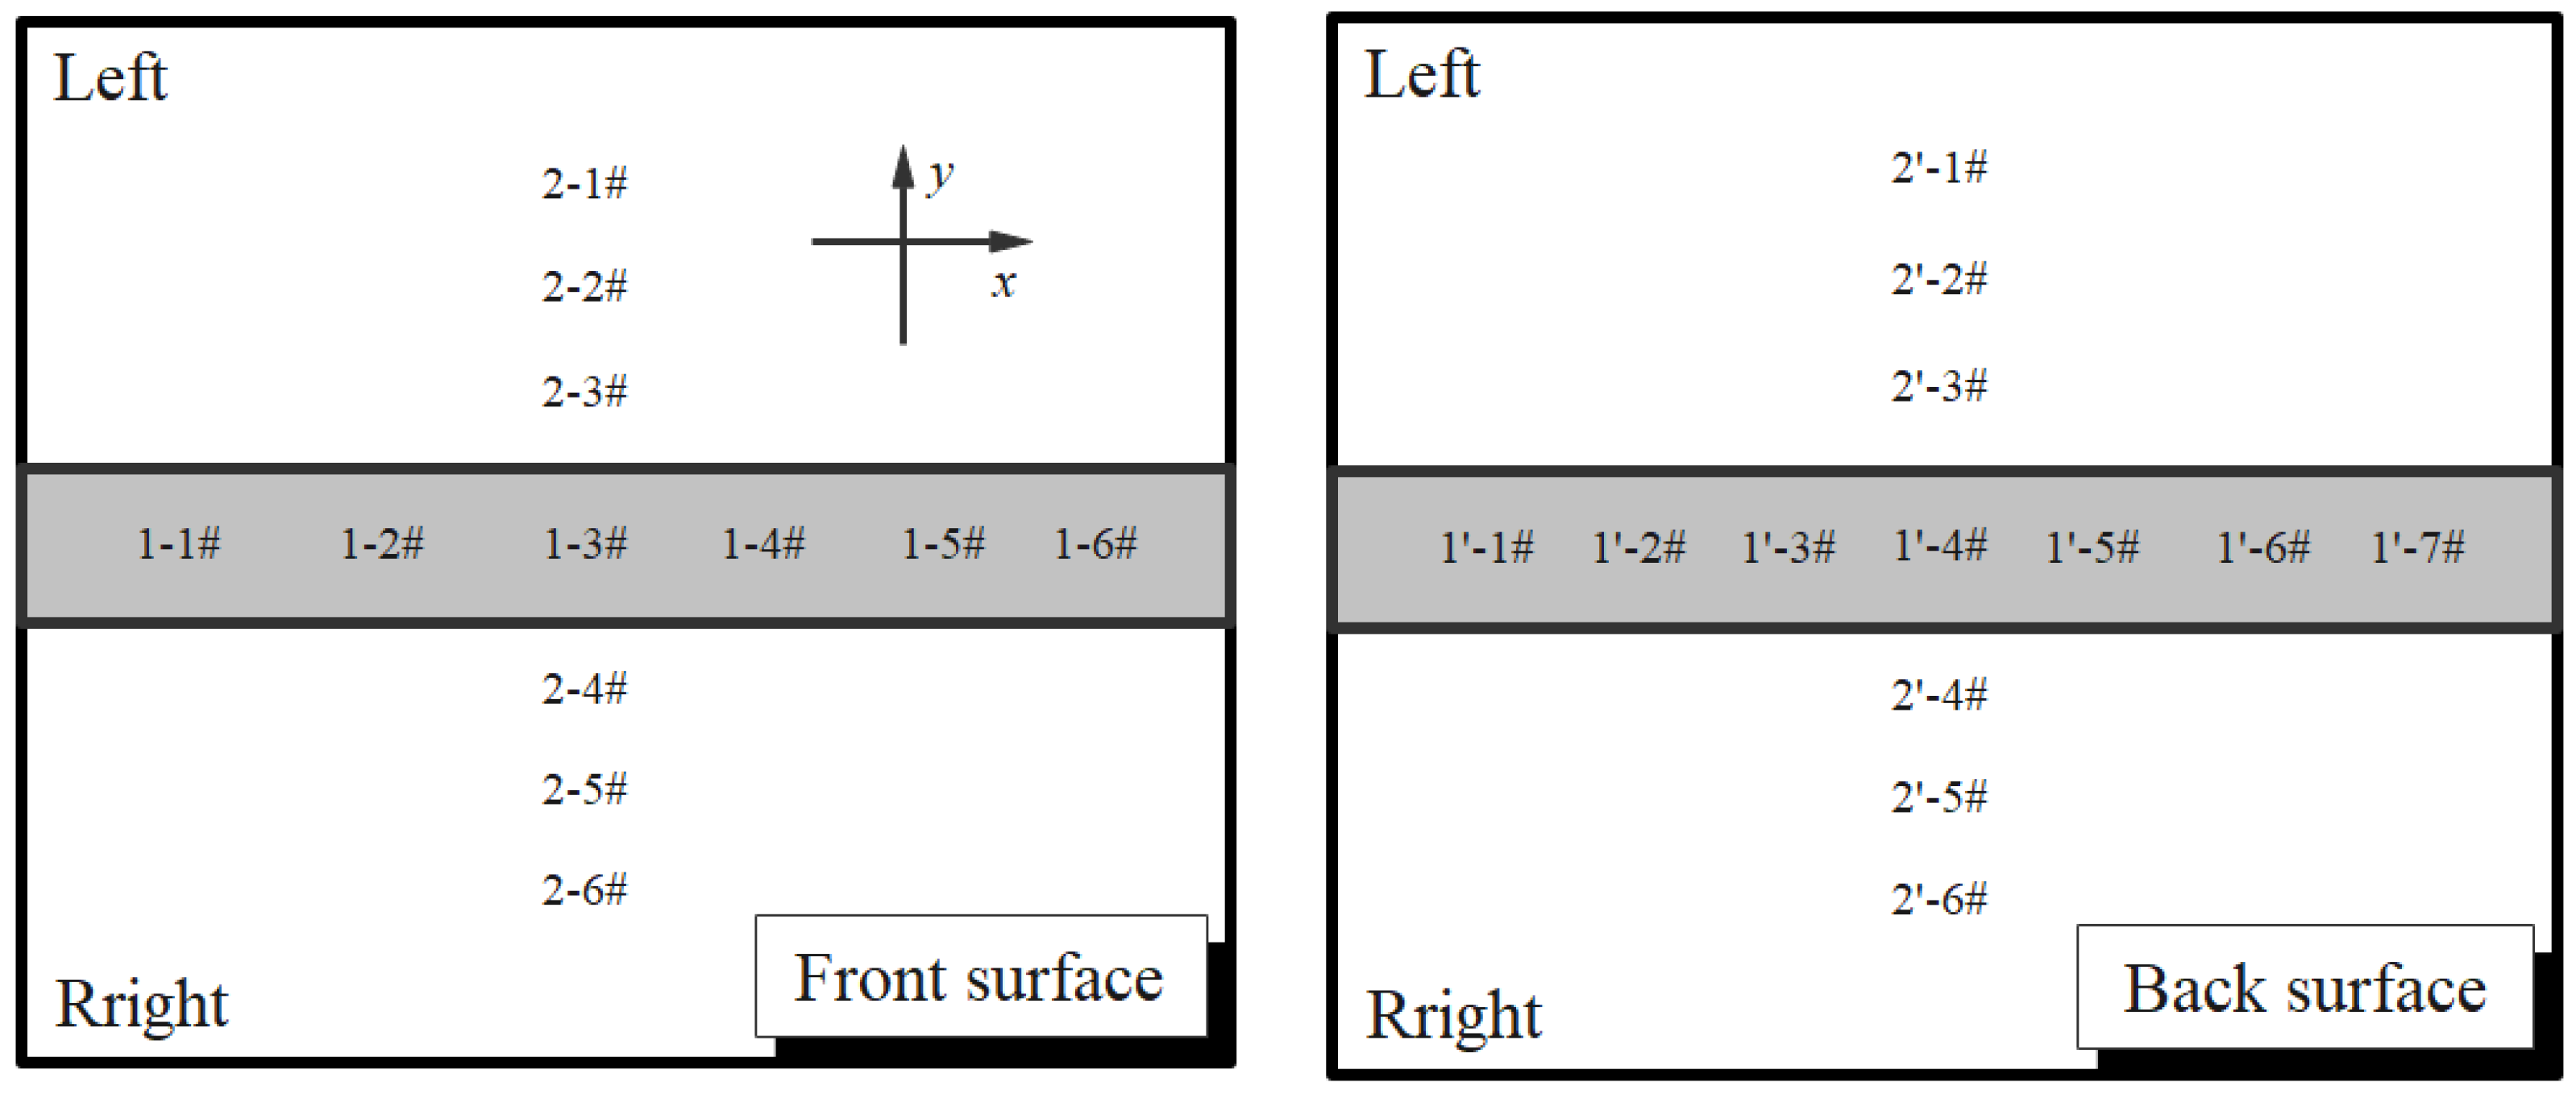
The measurement in the present study is based on ASTM E837-08 [35]. Hole-drilling method is applied for residual stress measurement. The strain gauges are pasted on the part to be tested. During hole-drilling, the stress around the hole will be released, which will cause the strain change in the area around the hole. The actual stress condition of this part can be obtained through calculation. Generally, the center of the weld undergoes rapid heating and cooling, compared to other parts of the weld, which is the area with high incidence of residual stress. However, for the whole welded joint (including weld and base metal), the residual stress distribution data are relatively large, which makes them difficult to extract, and as the input calculation for subsequent crack propagation is significant, the measurement is conducted at several typical positions on both the front and back surfaces of the specimen. Six to seven points are selected on the longitudinal central line of the weld, and three points are pointed, respectively, in the left and the right side at the middle part of the weld. On the front surface, three points with the distance of 15 mm (1-1#), 65 mm (1-2#), 85 mm (1-3#) from the far left and three points (1-4#,1-5#,1-6#) at the right end with the same distance are selected in the middle of the welding seam. Three positions with the distance of 5 mm (2-3#,2-4#), 23mm (2-2#,2-5#) and 38 mm (2-1#,2-6#) from the junction between the weld and the base metal are selected as the measurement points, respectively, on both sides of the weld. The selection of measuring points on the back is similar to that on the front, as shown in Figure 7.
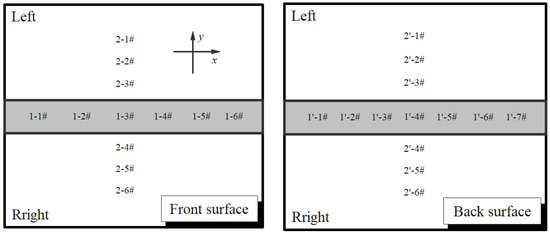
Figure 7.
Positions for residual stress measurement.
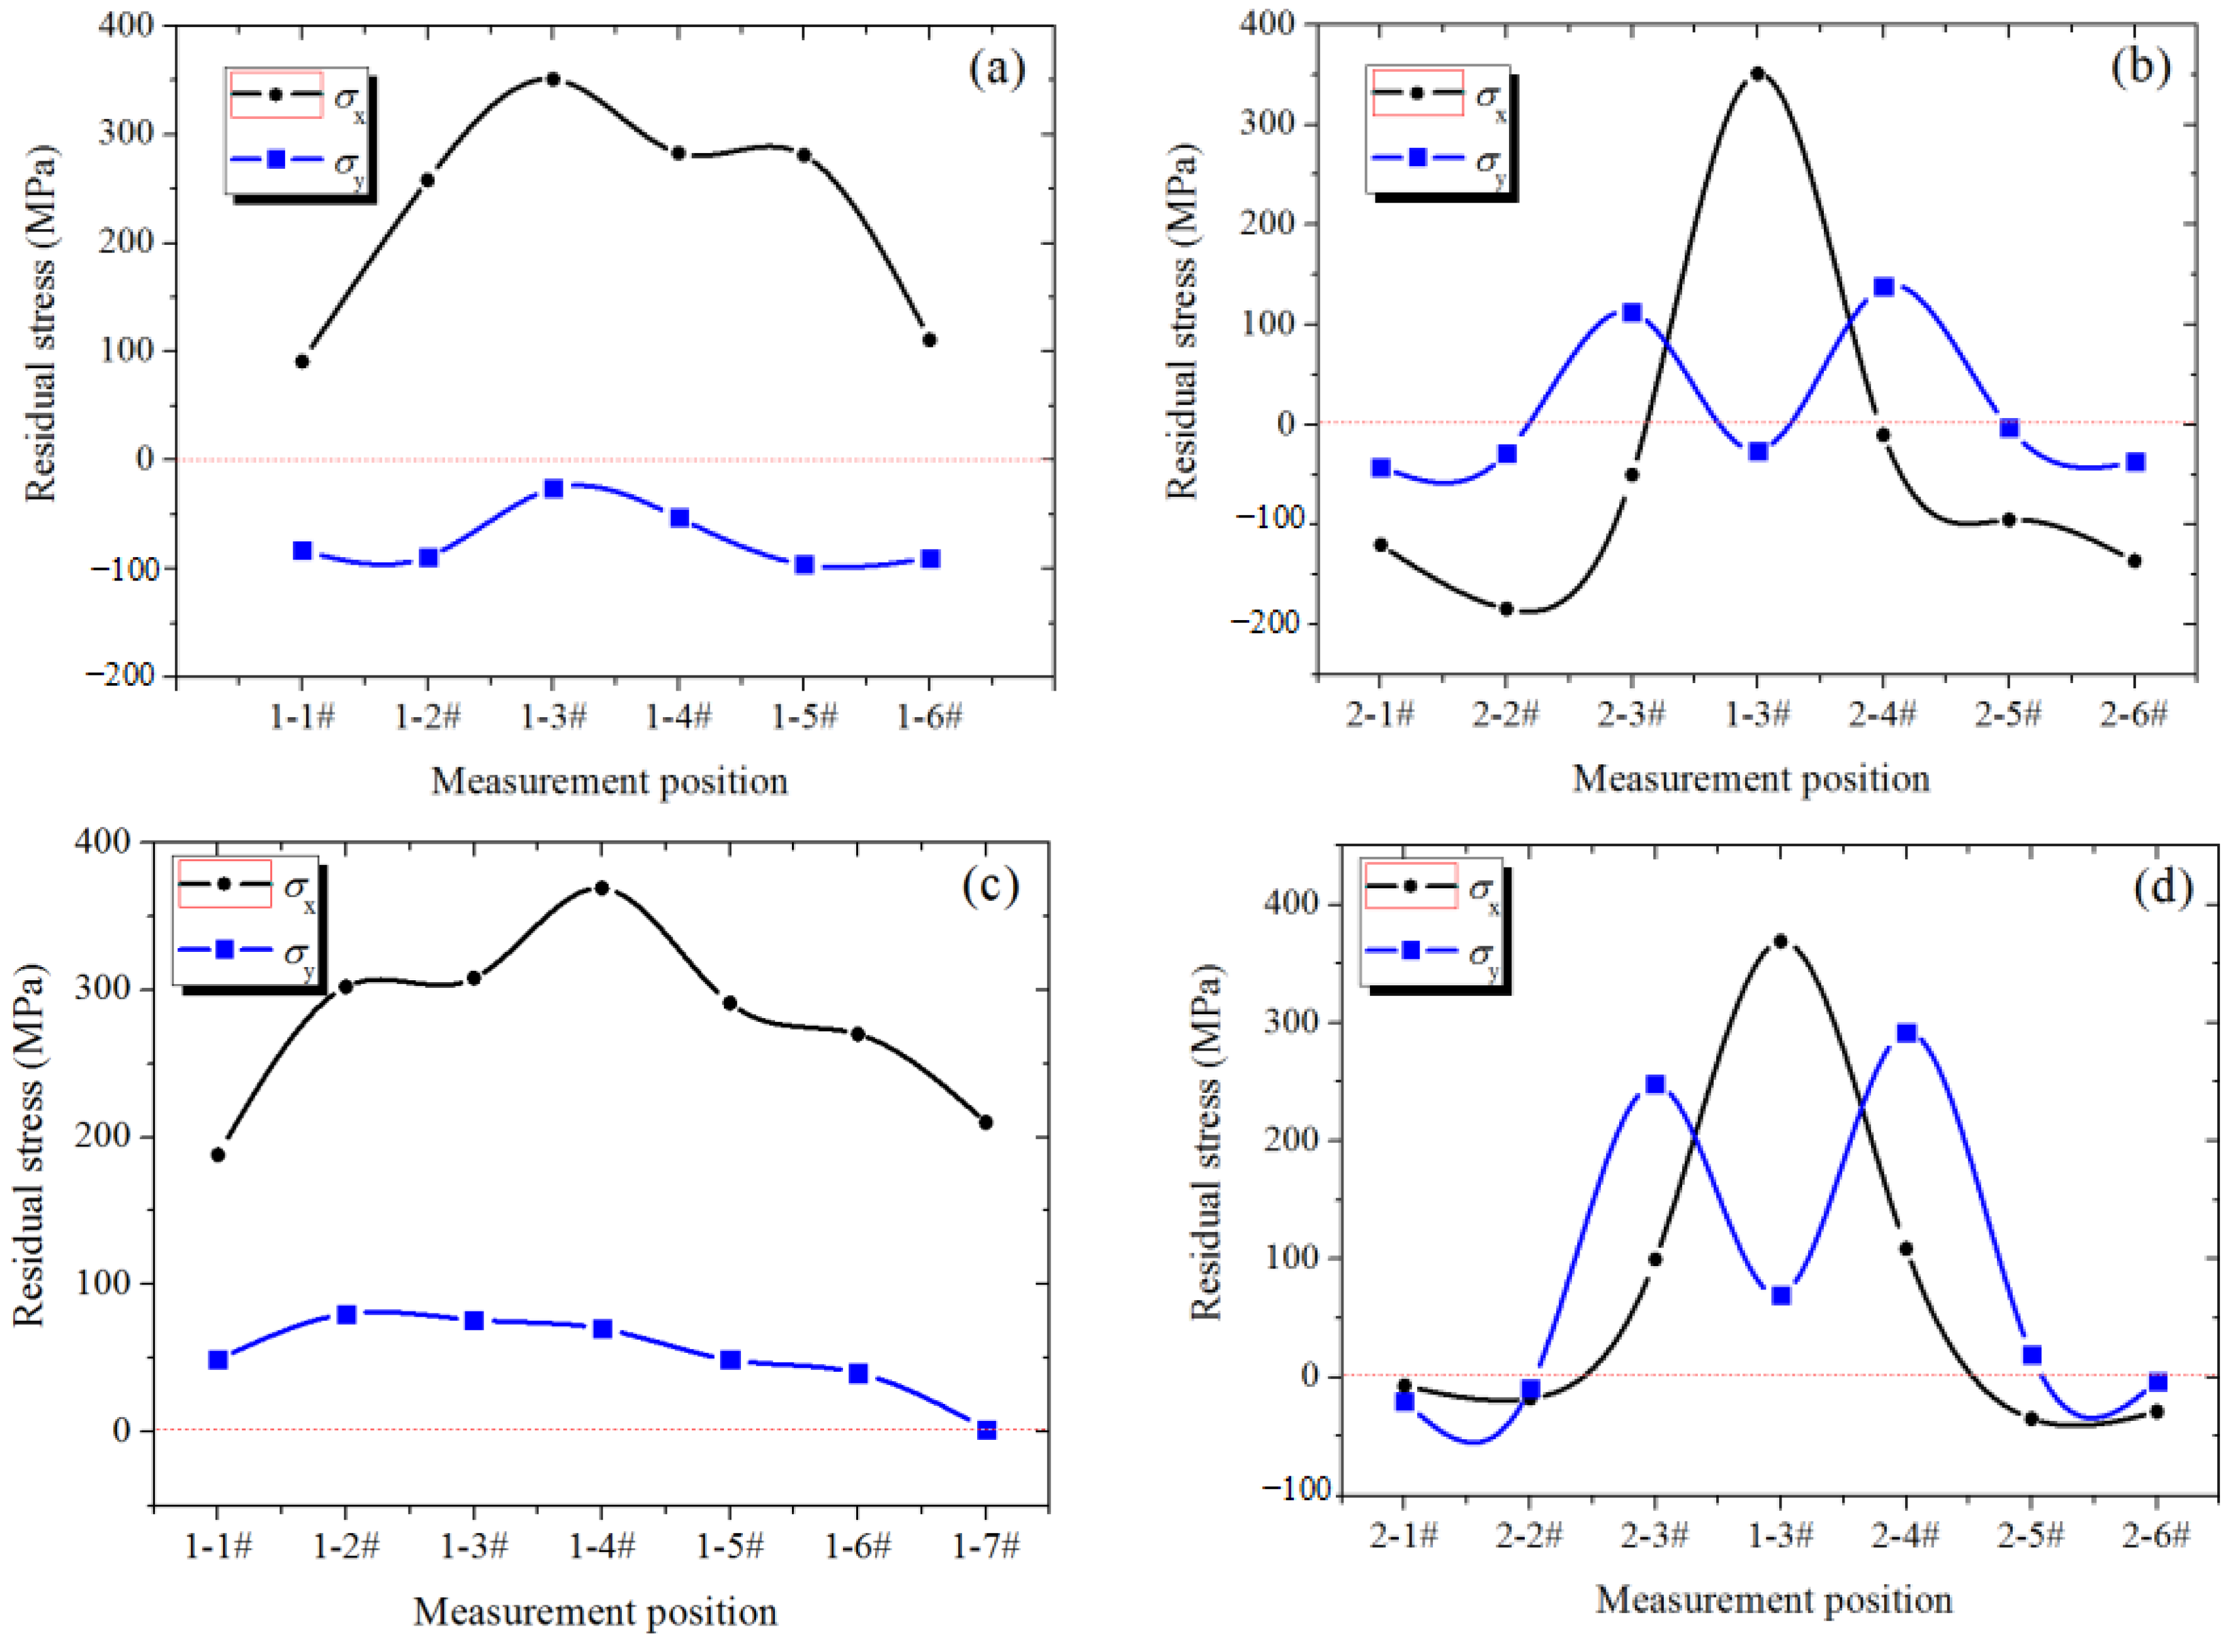
The measurement results are listed in Table 3 and Figure 8a–d for the continuous changing trend. Generally, the residual stress is considered to be constantly parallel to the weld line for simplification. The present study shows that the residual stress along the weld direction σx in the weld central line shown in Figure 8a,c has little change, while σx decreases gradually from the central point to the edge. In the direction perpendicular to the weld, the variation trend of residual stress has more obvious peaks, as shown in Figure 8b,d.
Table 3.
Residual stress measurement results (F: front surface; B: back surface).
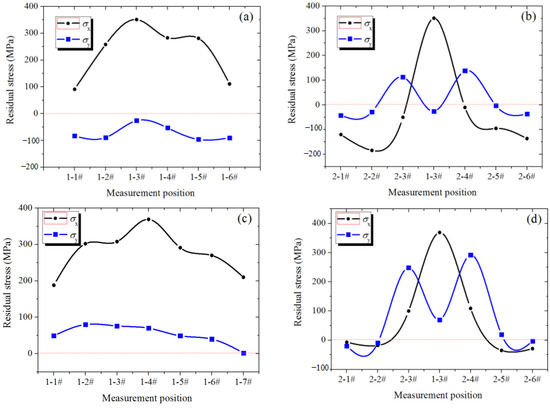
Figure 8.
Residual stress measurement results in front surface—(a,b) and in back surface—(c,d).
3.2. Fatigue Experiment
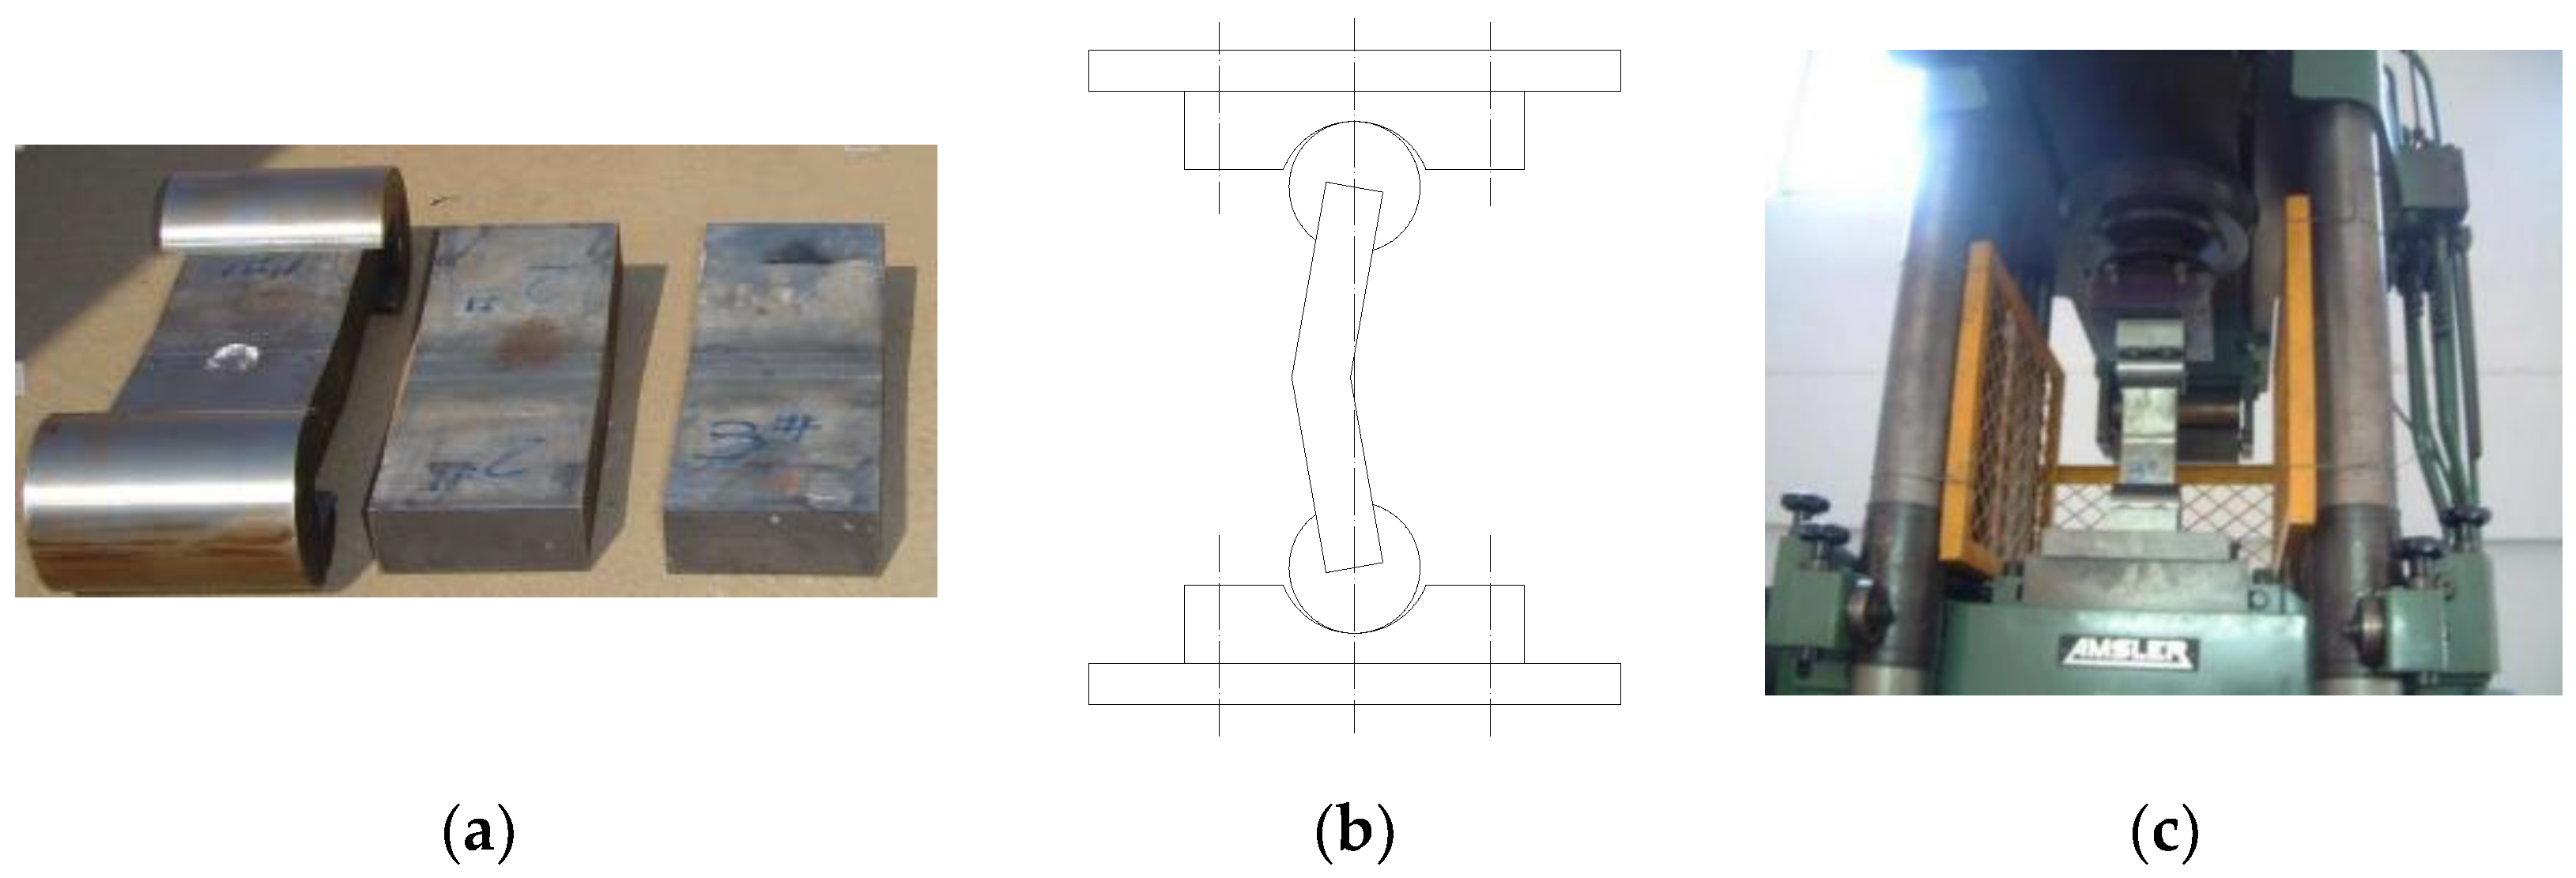
In the present study, the welded Ti-6Al-4V ELI joints are in the as-weld condition. No surface processing and post-processing are conducted for removing underfills or reinforcements. Load-controlled uniaxial fatigue tests are conducted at room temperature in a 100 KN servo-hydraulic testing machine and an applied ratio is R = 0.1. The connection between the test piece and the fatigue testing machine is the special fixture, which is a cylindrical hinge to minimize the additional load generated by the clamp during loading. The photographs of the test piece, the diagram of special fixture and the test setup can be seen in Figure 9a–c.

Figure 9.
(a) The photographs of the test piece; (b) The diagram of the special fixture; (c) Test setup.
The fatigue life of the welded joint in as-weld condition with some surface defects will be certainly poorer with stress concentrations, but it can be applied for conservative consideration. In the compression state, cracks are less likely to expand. To shorten the test time, a sharp notch of 6.35 mm long, 0.91 mm wide and 0.8 mm deep is pre-machined at the boundary between the base metal and the weld to artificially create a crack source. A sinusoidal loading curve with frequency of 1 Hz is applied to the specimen with the maximum load of 235.2 kN and the minimum load of 2.352 kN. During the fatigue experiment, the surface state of the sample is observed every 2000 cycles for recording the surface length of the crack size by using optical techniques.
4. Results and Discussions
4.1. Experimental Observation
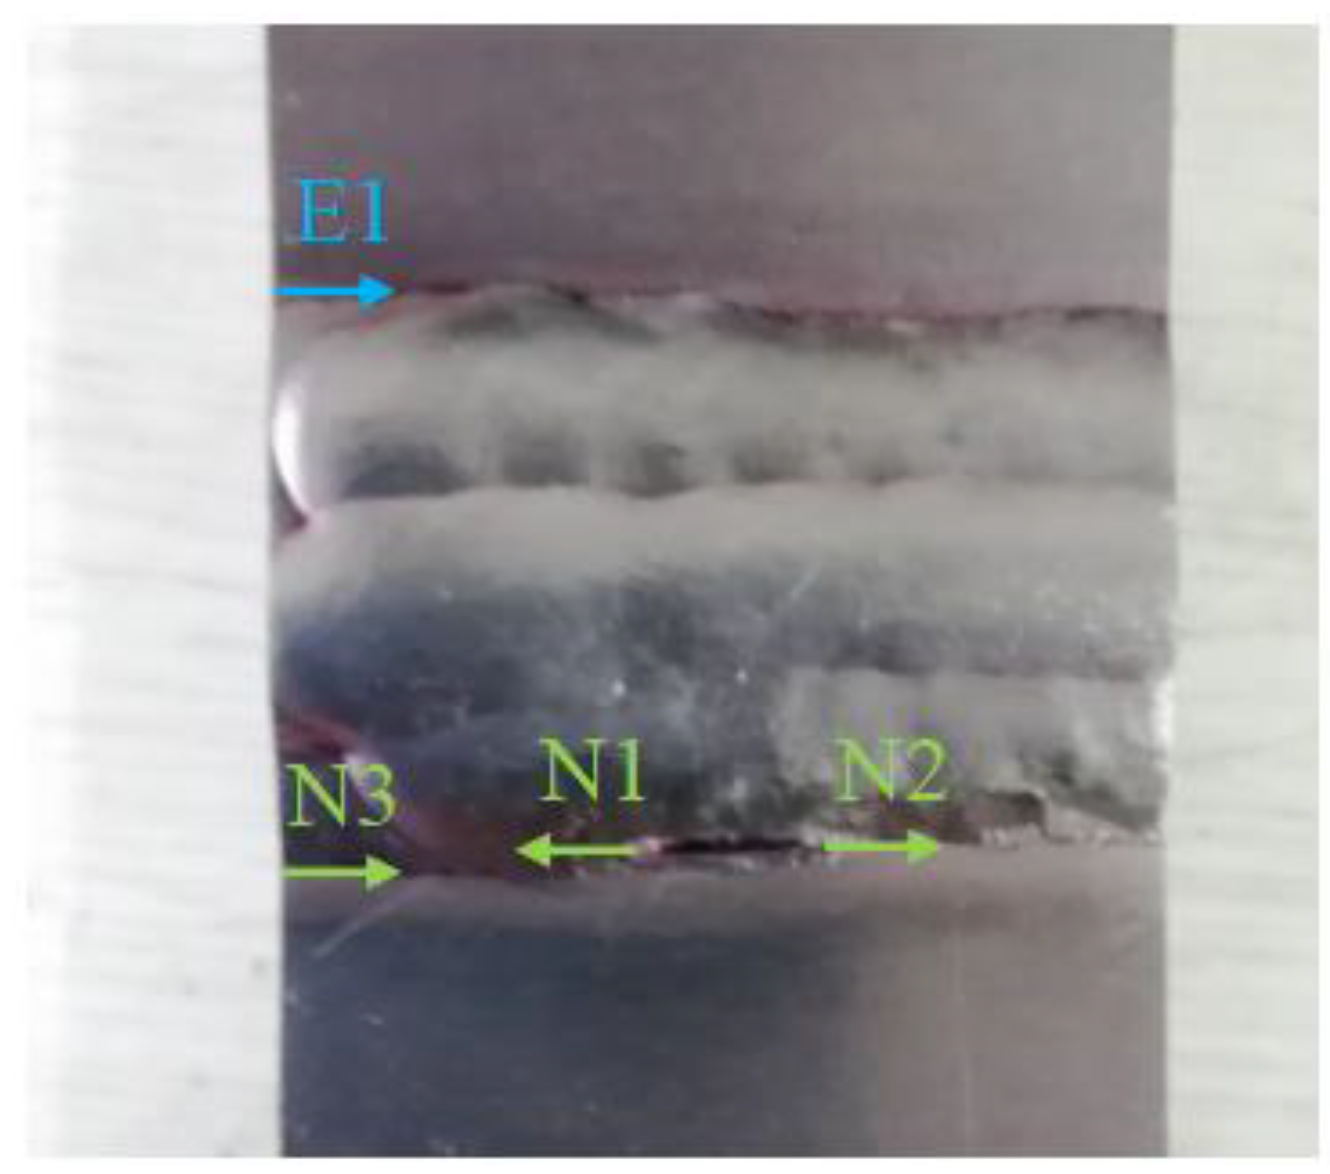
The cracking points are observed at E1, N1, N2 and N3 on the surface of the sample, and the cracking directions are shown in Figure 10. A total of 113,402 cycles are applied from the initial state to the final failure before breaking.
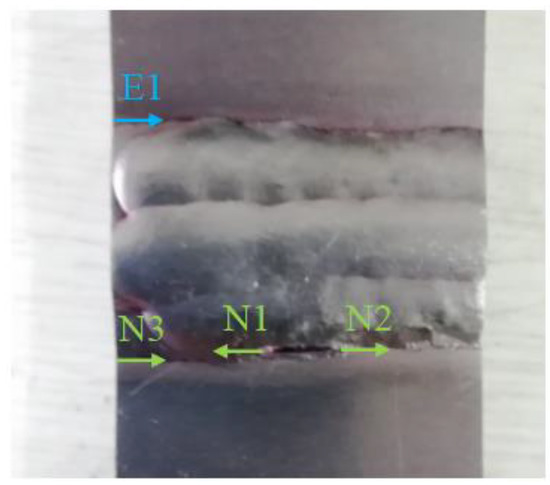
Figure 10.
The illustration of crack initiation positions and growth direction.
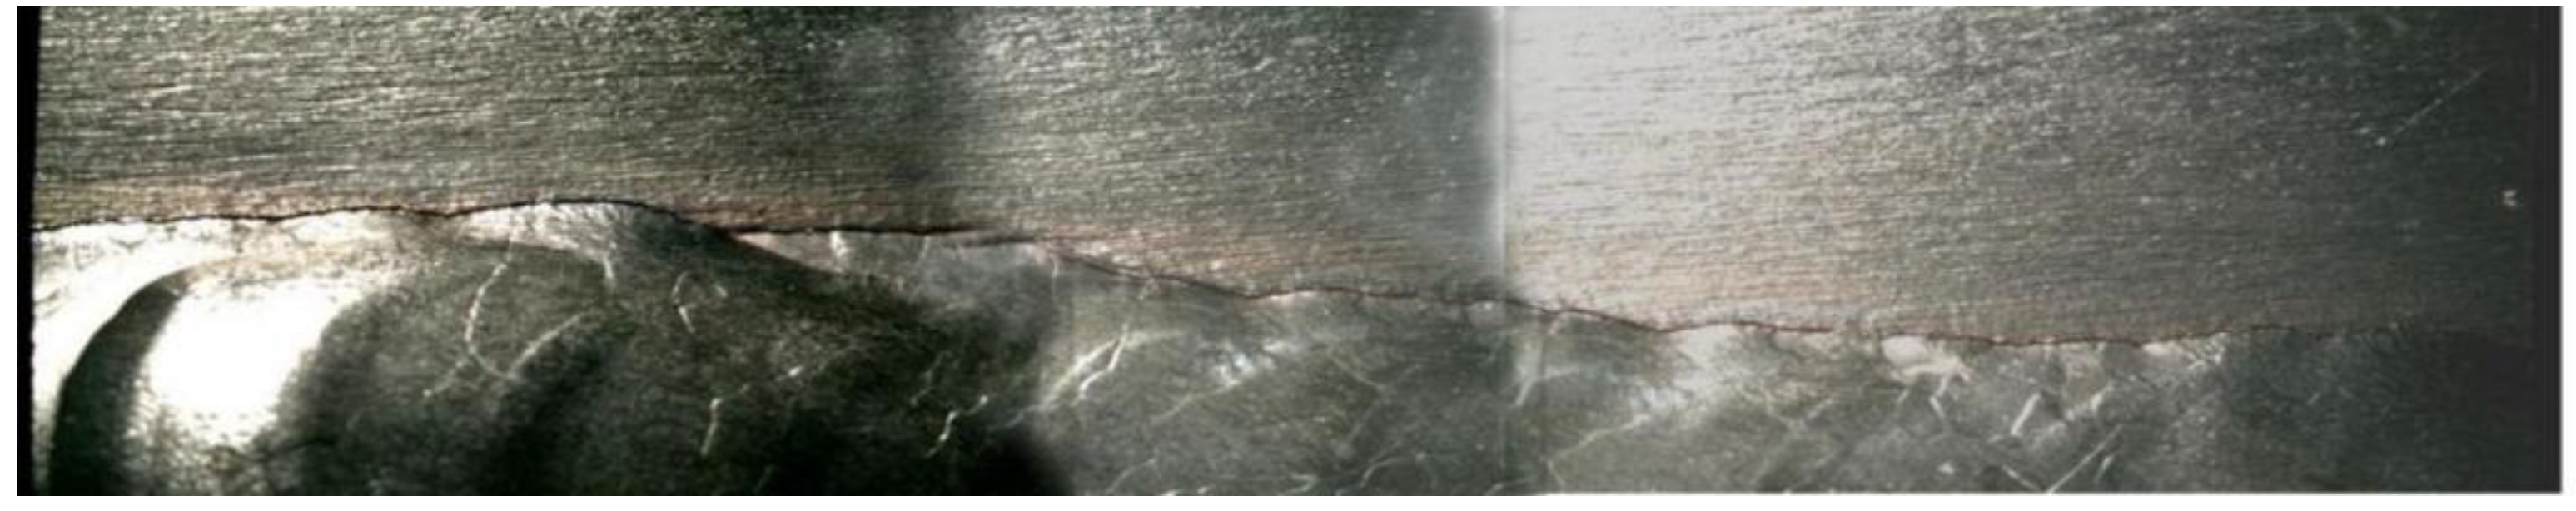
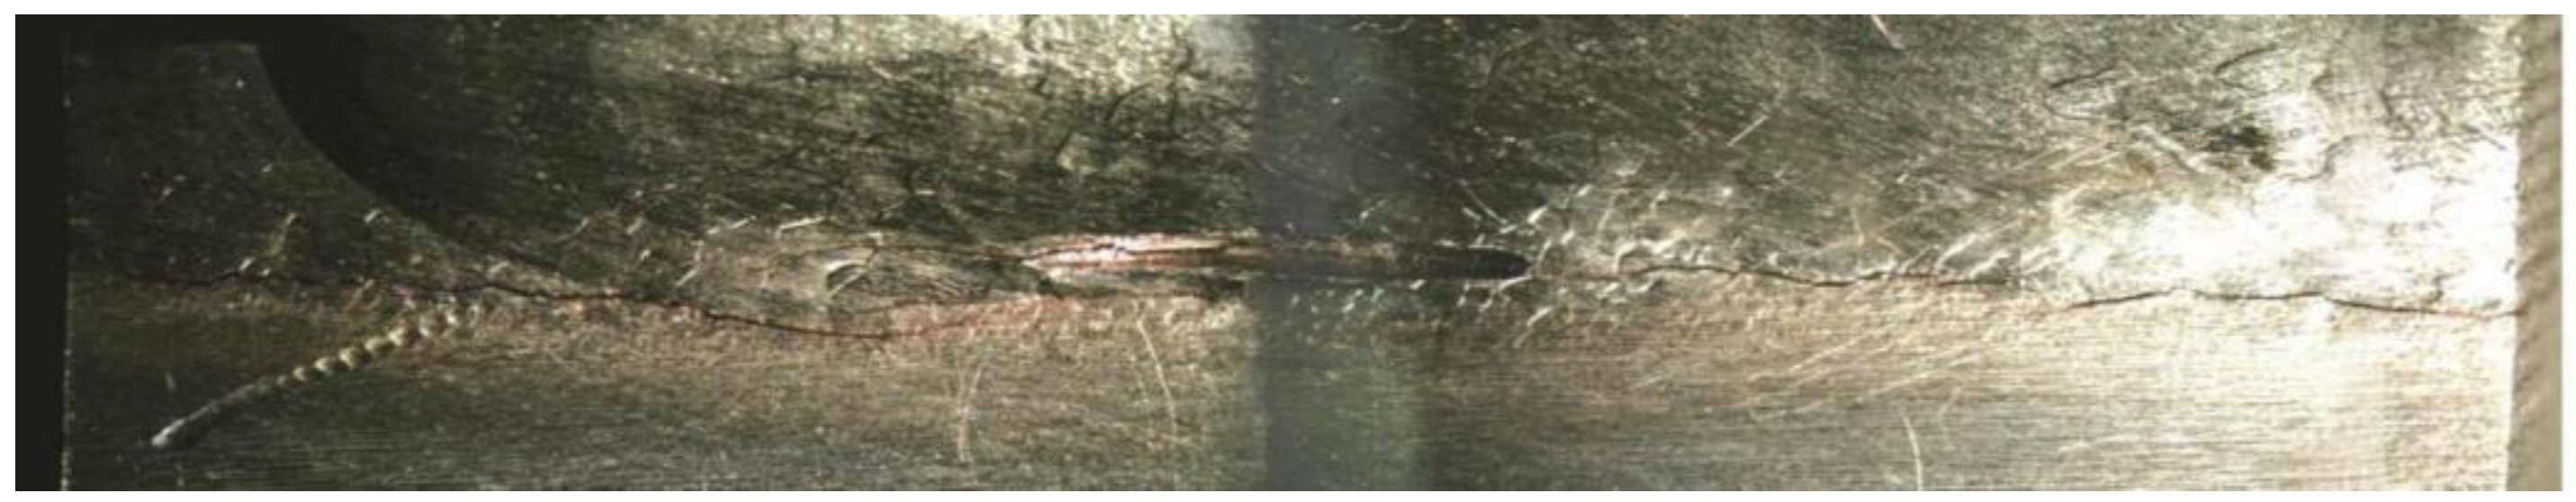
The upper and lower edges of the weld in Figure 10 are observed using a stereo microscope. In addition, the macroscopic photographs of the cracks are shown in Figure 11 and Figure 12. It can be seen from Figure 10 that there is a single crack at the upper edge of the weld, which initiates between the weld and the base material and extends along the edge of the weld. Figure 12 illustrates a plurality of cracks appearing at the lower edge of the weld, and the non-continuous cracks start to propagate at both ends of the notch and the intersection of the weld and the base material. It is worth noting that multi-cracks initiate and propagate along their own direction but interact with each other in the lower edge. The crack denoted by N3 initiates from the edge of the specimen and the crack denoted by N1 initiates from the left point of the notch. The two cracks have a certain longitudinal distance but with equivalent propagation rates. When the two cracks approach to each other and the crack tips will eventually connect together.

Figure 11.
The macroscopic photograph of the crack along the upper edge.

Figure 12.
The macroscopic photograph of the crack along the lower edge.
After the fatigue experiment, the upper and lower fracture surfaces in the positions indicated in Figure 13a are observed by a stereo microscope, and the macroscopic morphology of the fracture surfaces are shown in Figure 13b,c. It can be seen from the macroscopic photographs of the upper and lower sections that both sections are uneven with high and low undulations, and there are obvious steps showing a typical low-cycle fatigue fracture morphology. The step is caused by the crack propagation of different crack source regions not being in the same plane.
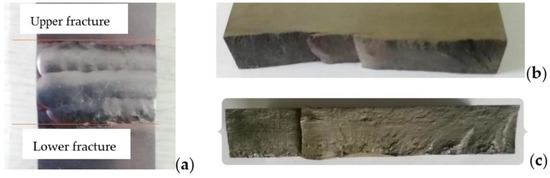
Figure 13.
(a) Upper and lower fracture positions; (b) Upper fracture surface; (c) Lower fracture surface.
High magnification metallographic diagrams shown in Figure 14a,b demonstrate the locations of the fatigue source. Multiple source regions of both fracture sections are located on the surface of the sample. The source region is undulating, and radial stripes converge on the source region during crack propagation. Bead line points to the source area. During the fatigue experiment, the contact and friction of the crack surfaces caused by the compression process make its fracture morphology significantly different, compared to the fracture morphology of tensile crack propagation.
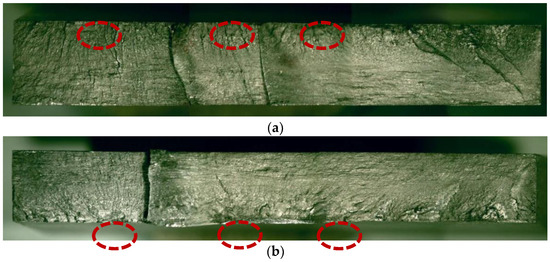
Figure 14.
(a) Upper fracture morphology; (b) Lower fracture morphology.
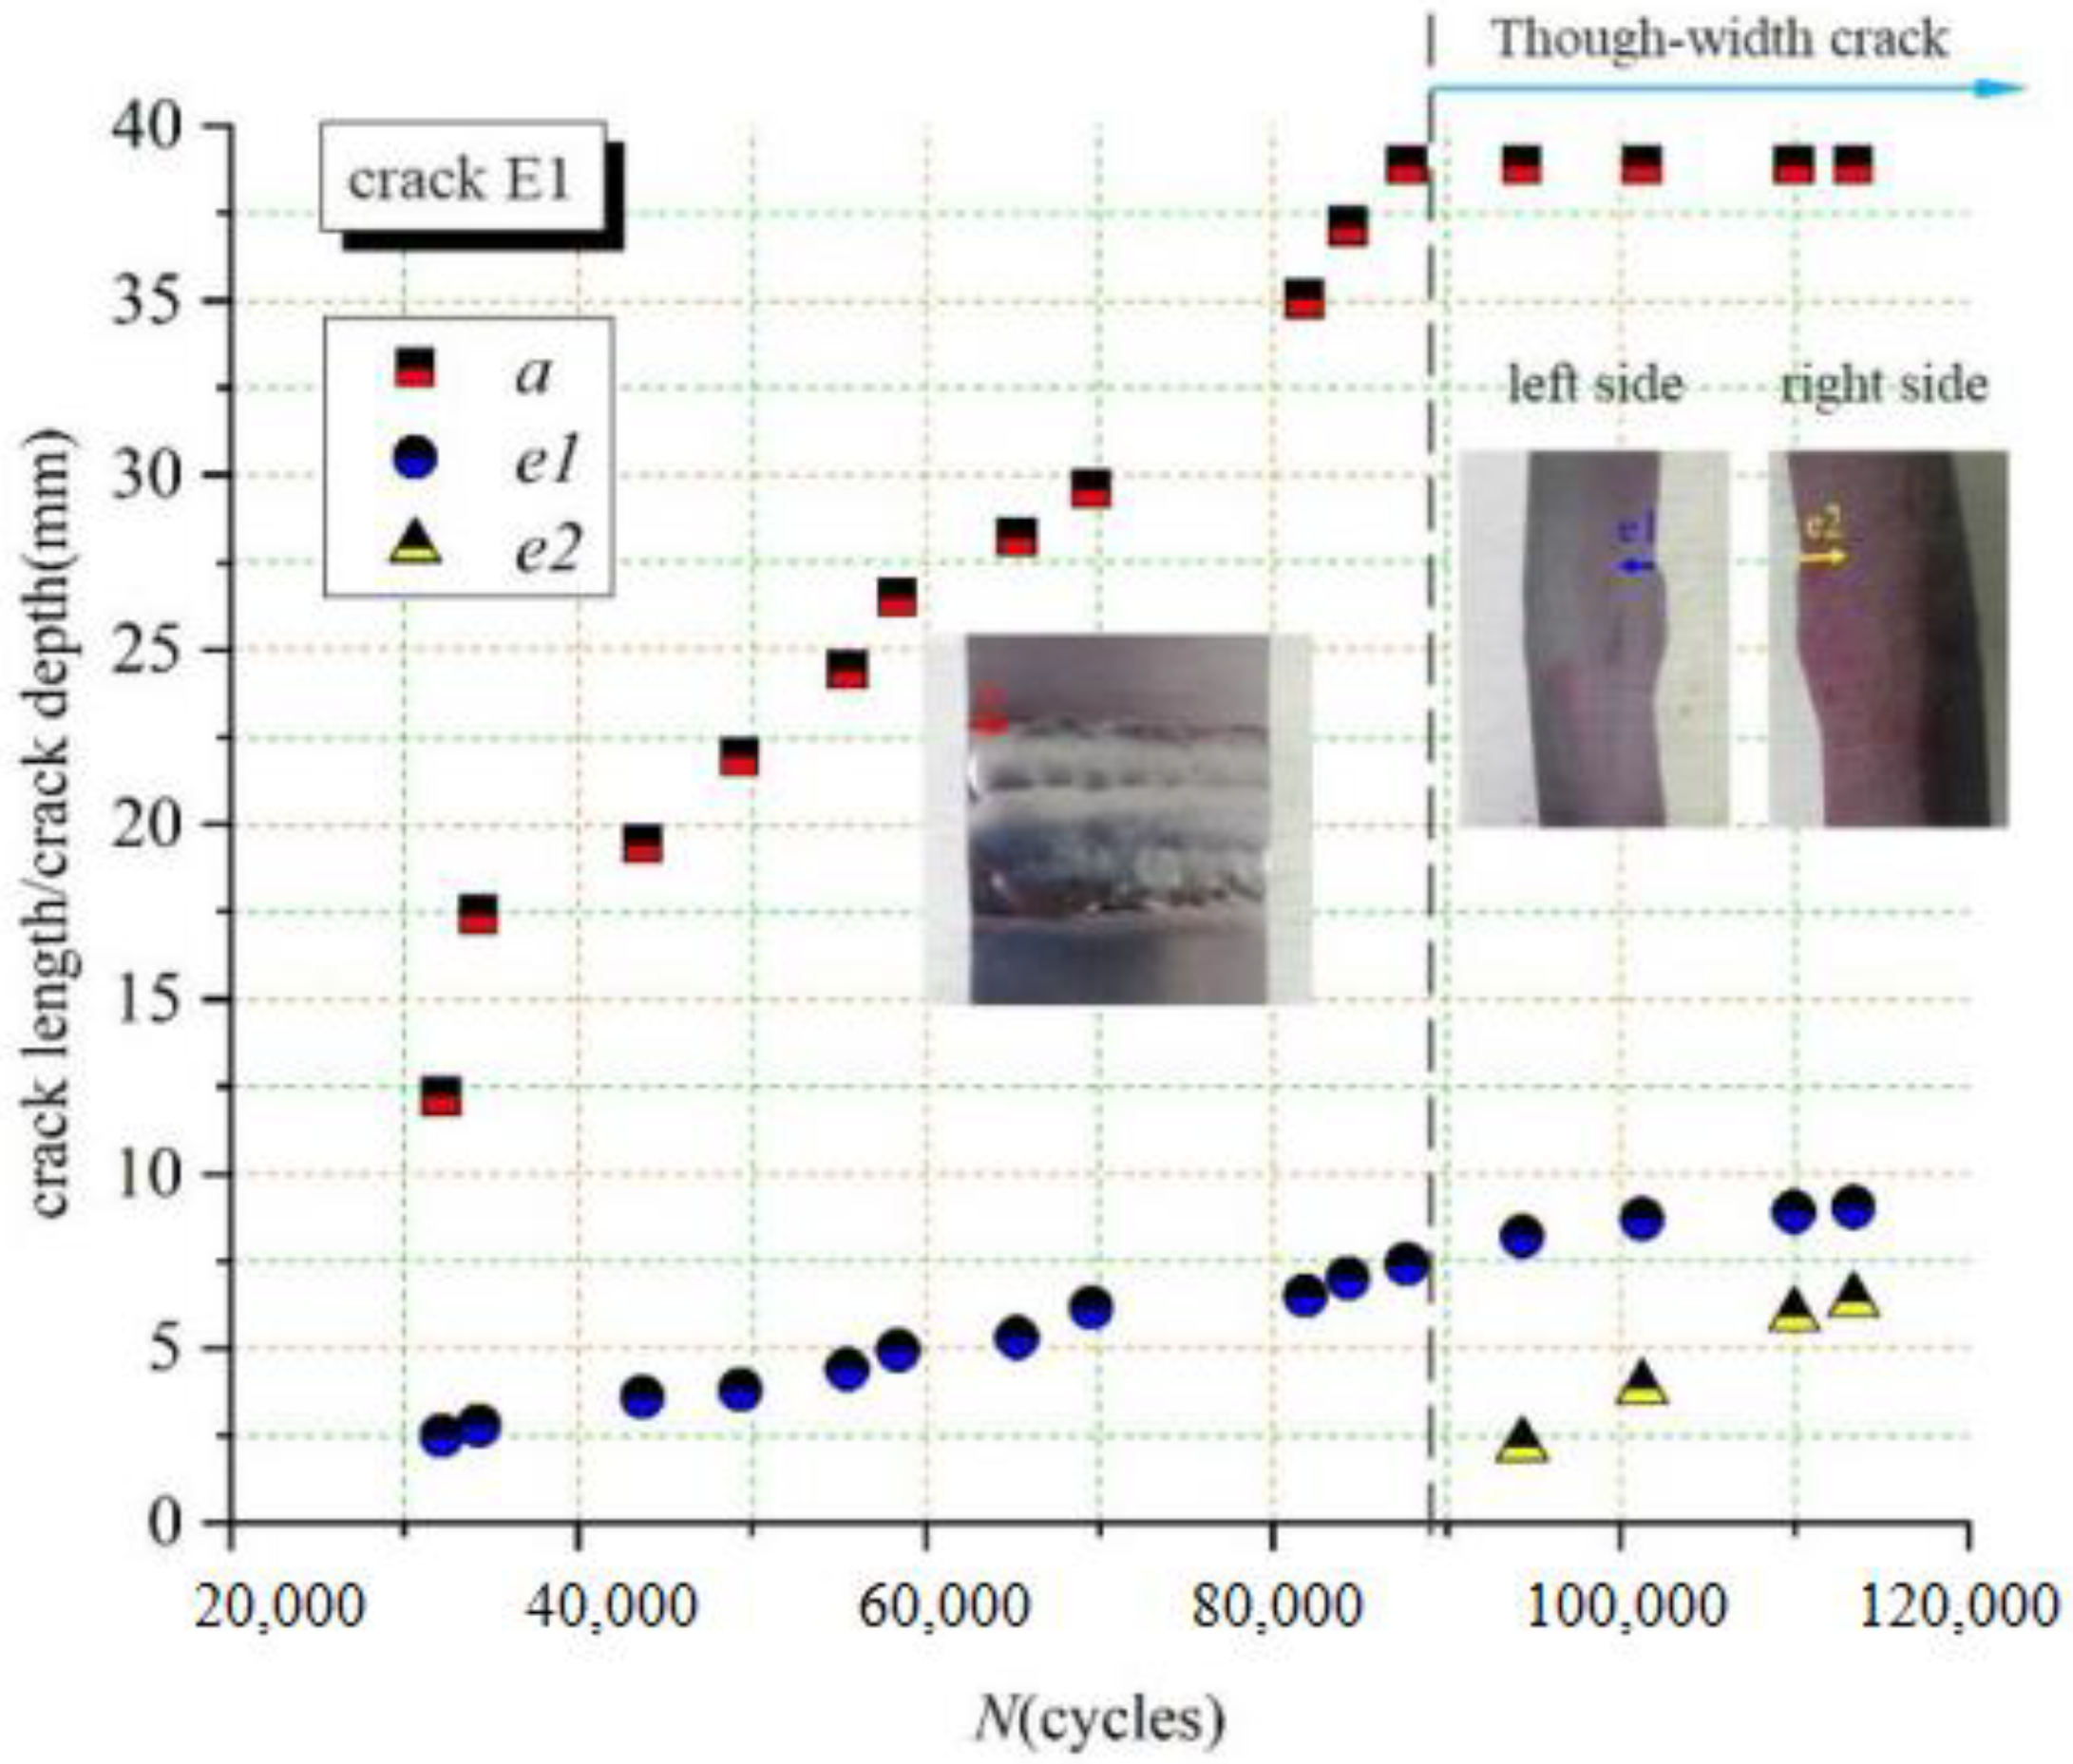
Figure 14a,b show multiple crack sources coexisting in the surface. Limited by the measurement technique in the current experiment, it is unknown which crack initiates first. Macroscopic observation indicates a longer surface crack of about 12.2 mm long and 2.5 mm deep being first observed in the position of E1 but not appearing at the ends of the prefabricated notch as expected. The crack group composed of a dominant crack and some distributed cracks propagating both in the surface and the thickness directions, which is the cause of the final failure after experiencing more than 32,000 load cycles. The length and depth observed from the left side of the crack in position E1 are denoted by a and e1, the propagation rates of which are depicted in Figure 15. The failure is approached when the leading crack propagates to the rightmost side to form a crack of penetrating width after 87,700 load cycles. The through-width crack continues to propagate along the depth direction until the final fracture happens. Its depth can be measured on both sides (data for e1 and e2 in Figure 15).
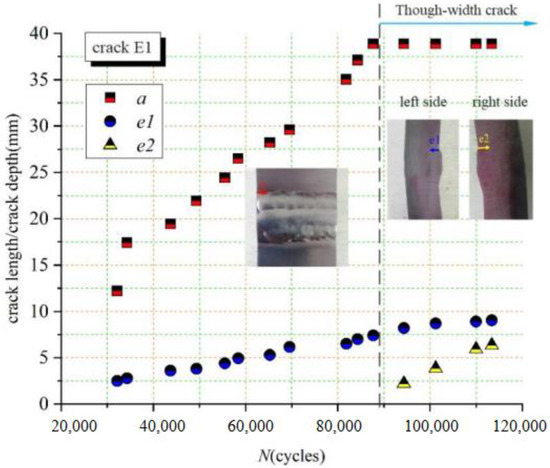
Figure 15.
Crack growth versus cycles in positions E1.
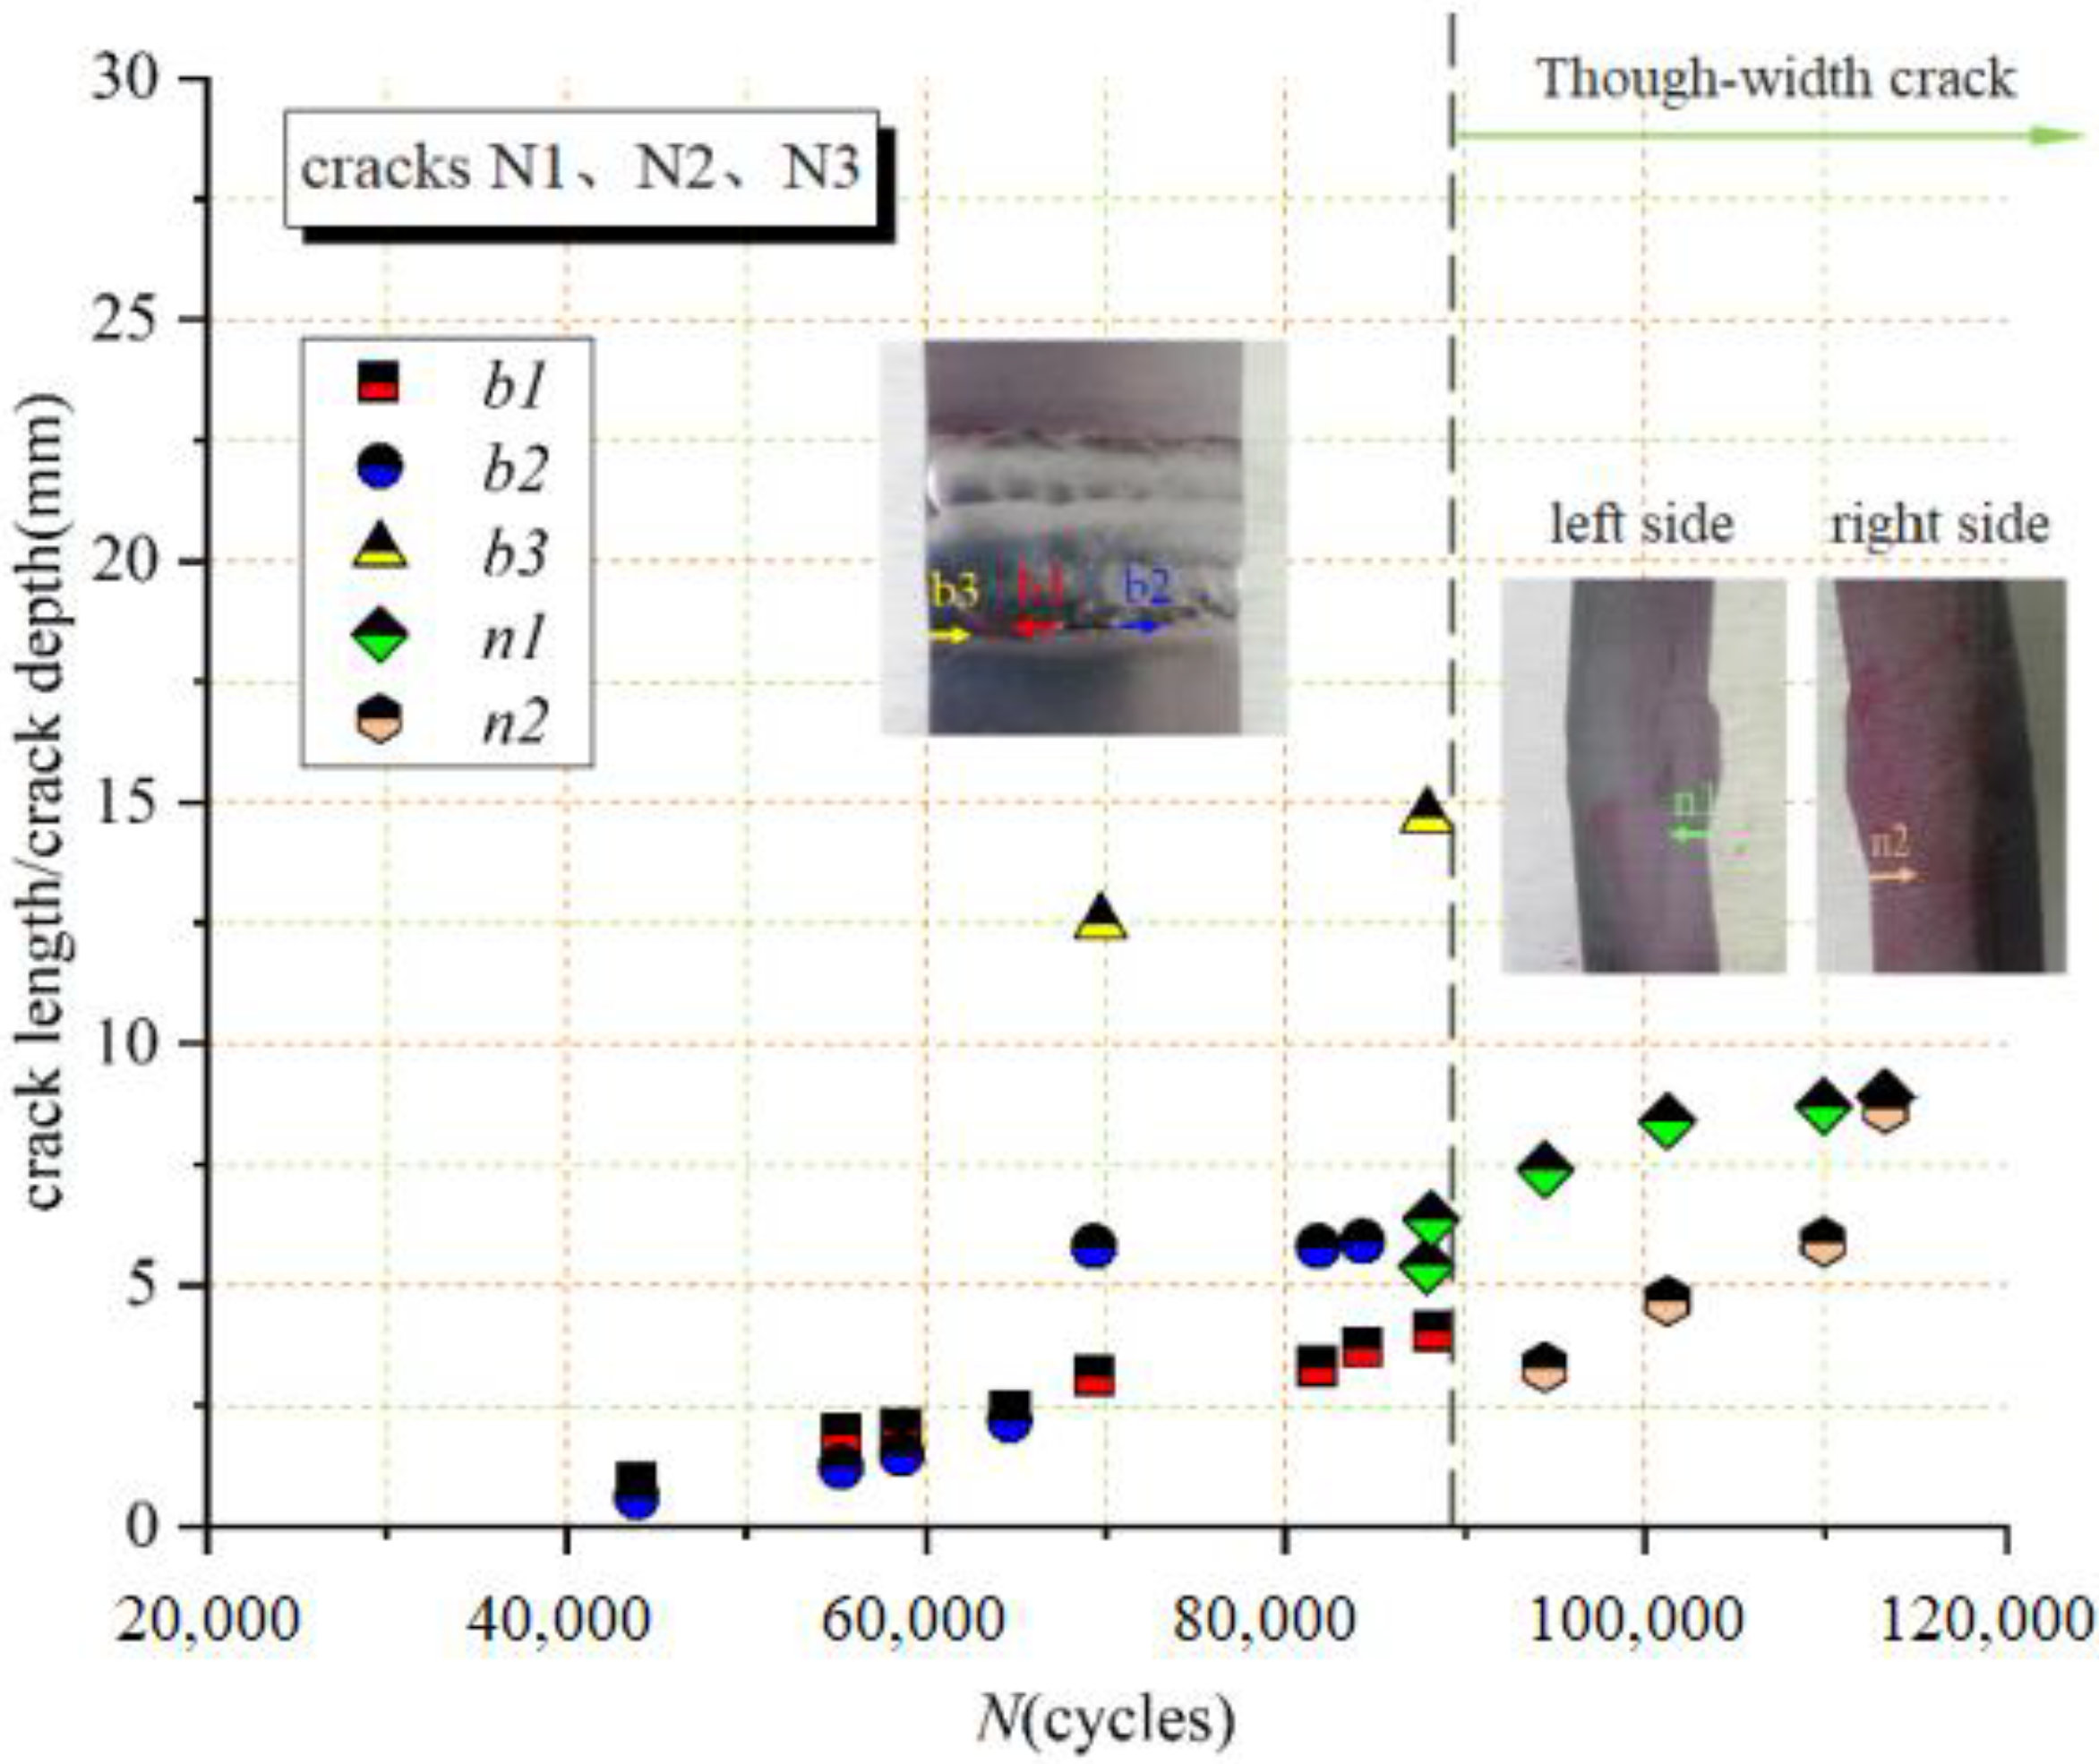
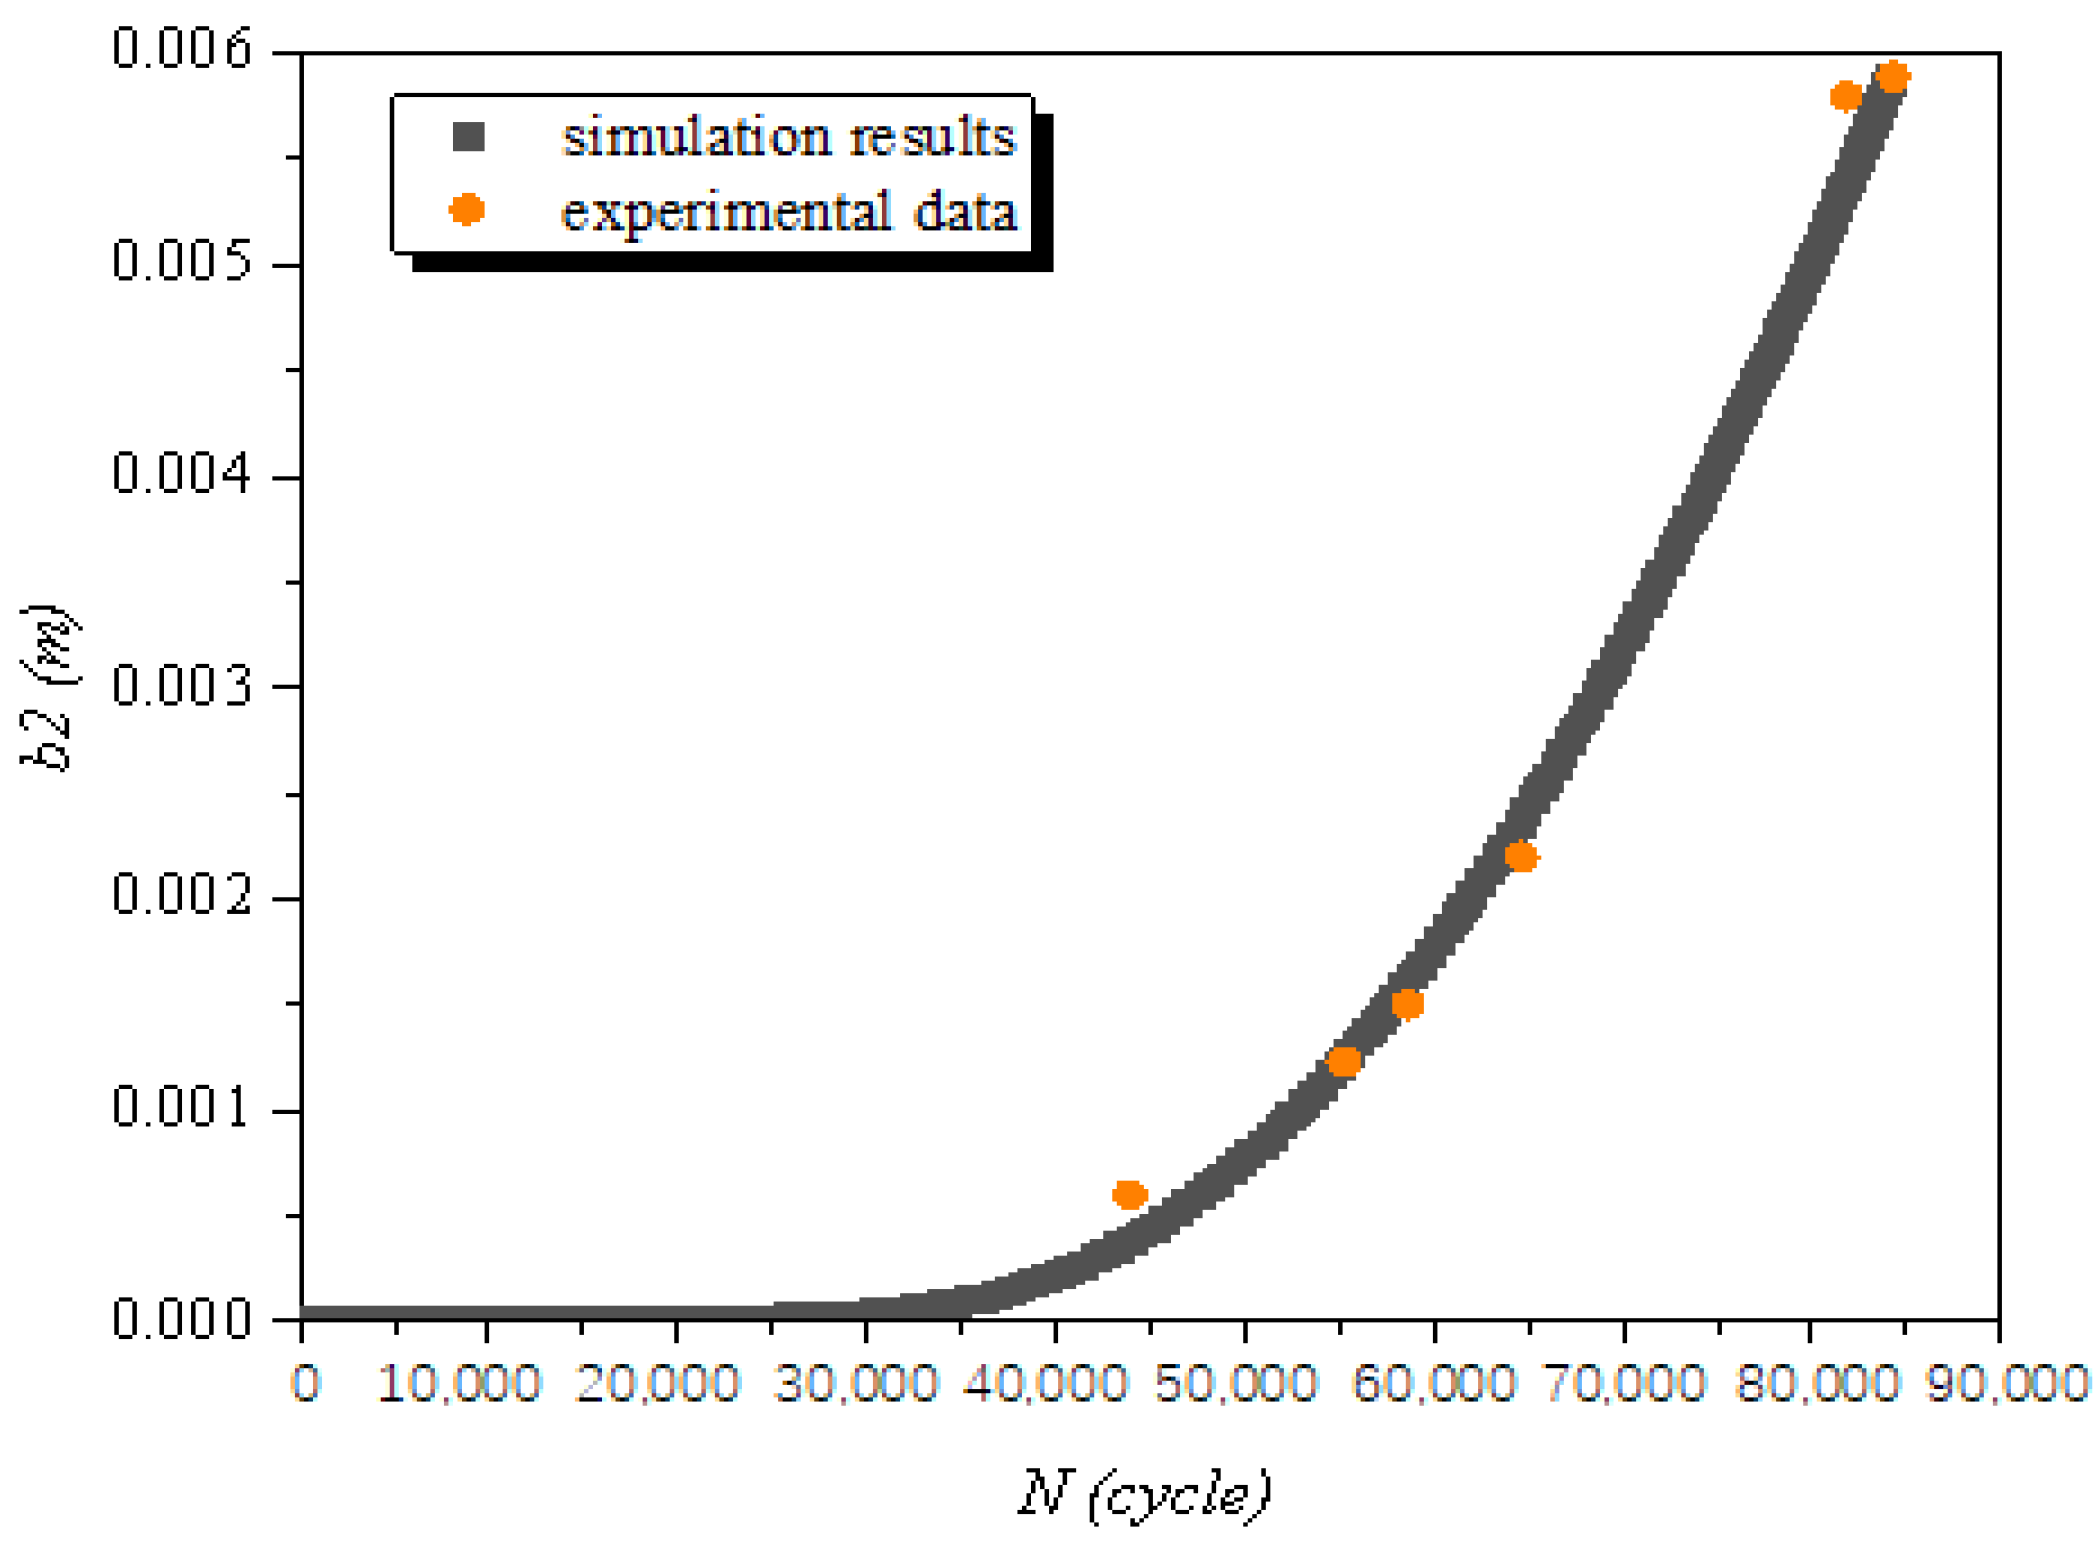
Figure 16 displays the crack growth versus cycles in positions N1, N2 and N3. b1, b2 and b3 are used to express the crack lengths in N1, N2 and N3, respectively. The cracks in N1 and N2 are observed when load cycles reach to 43,939, where the longest length is only 0.9 mm with slower propagating rate, compared to the crack in E1. The crack in N3 is observed after load cycles of 69,737 in which its crack length is 12.5 mm. The cracks from N1 and N3 connected with each other at load cycles of about 88,000. Then, the crack from N2 keeps on propagating until to the rightmost of the width followed with continued propagation in depth.
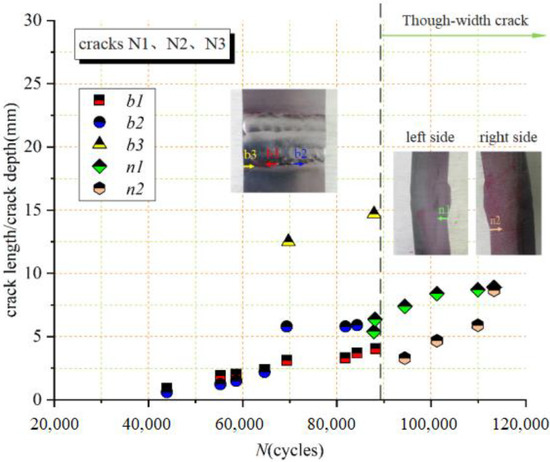
Figure 16.
Crack growth versus cycles in positions N1, N2 and N3.
4.2. Numerical Simulation
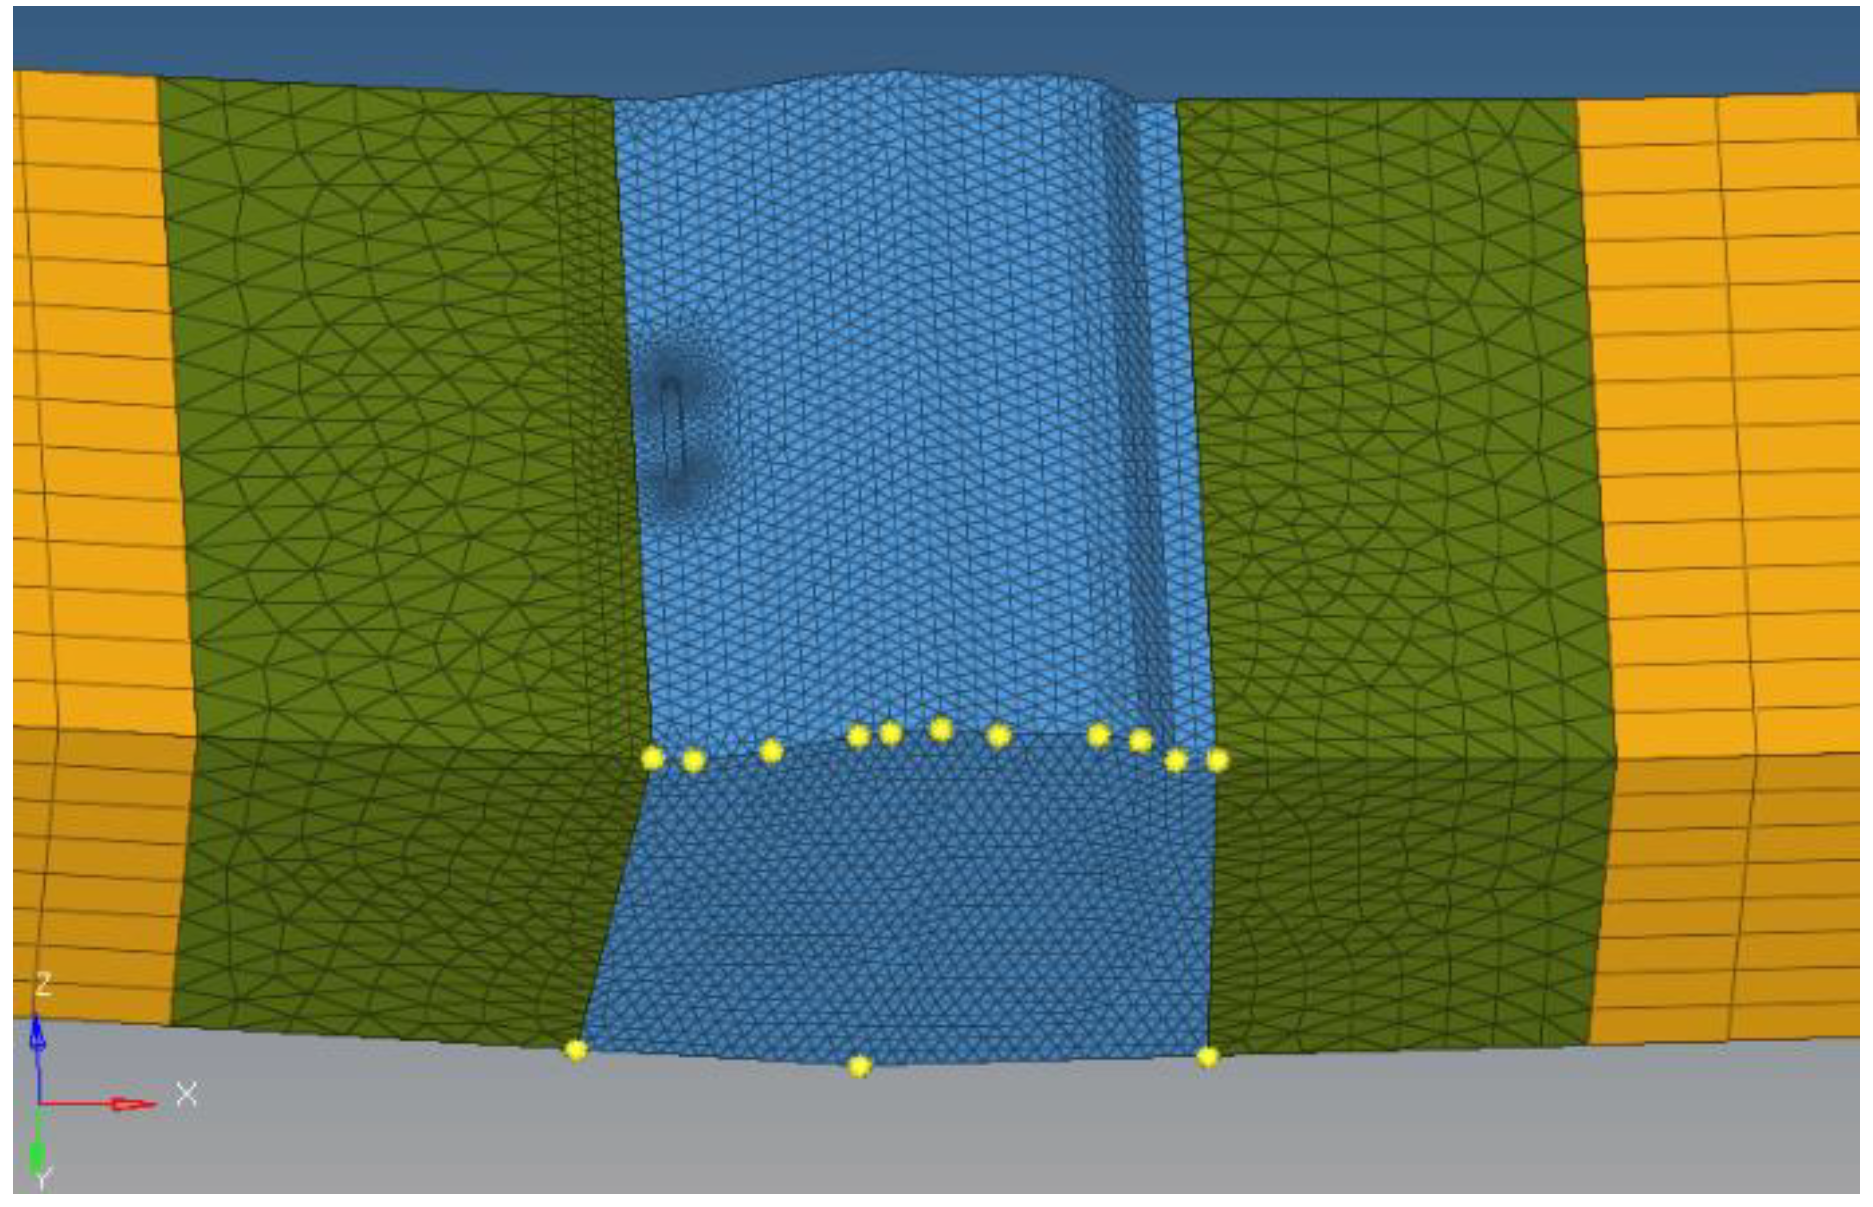
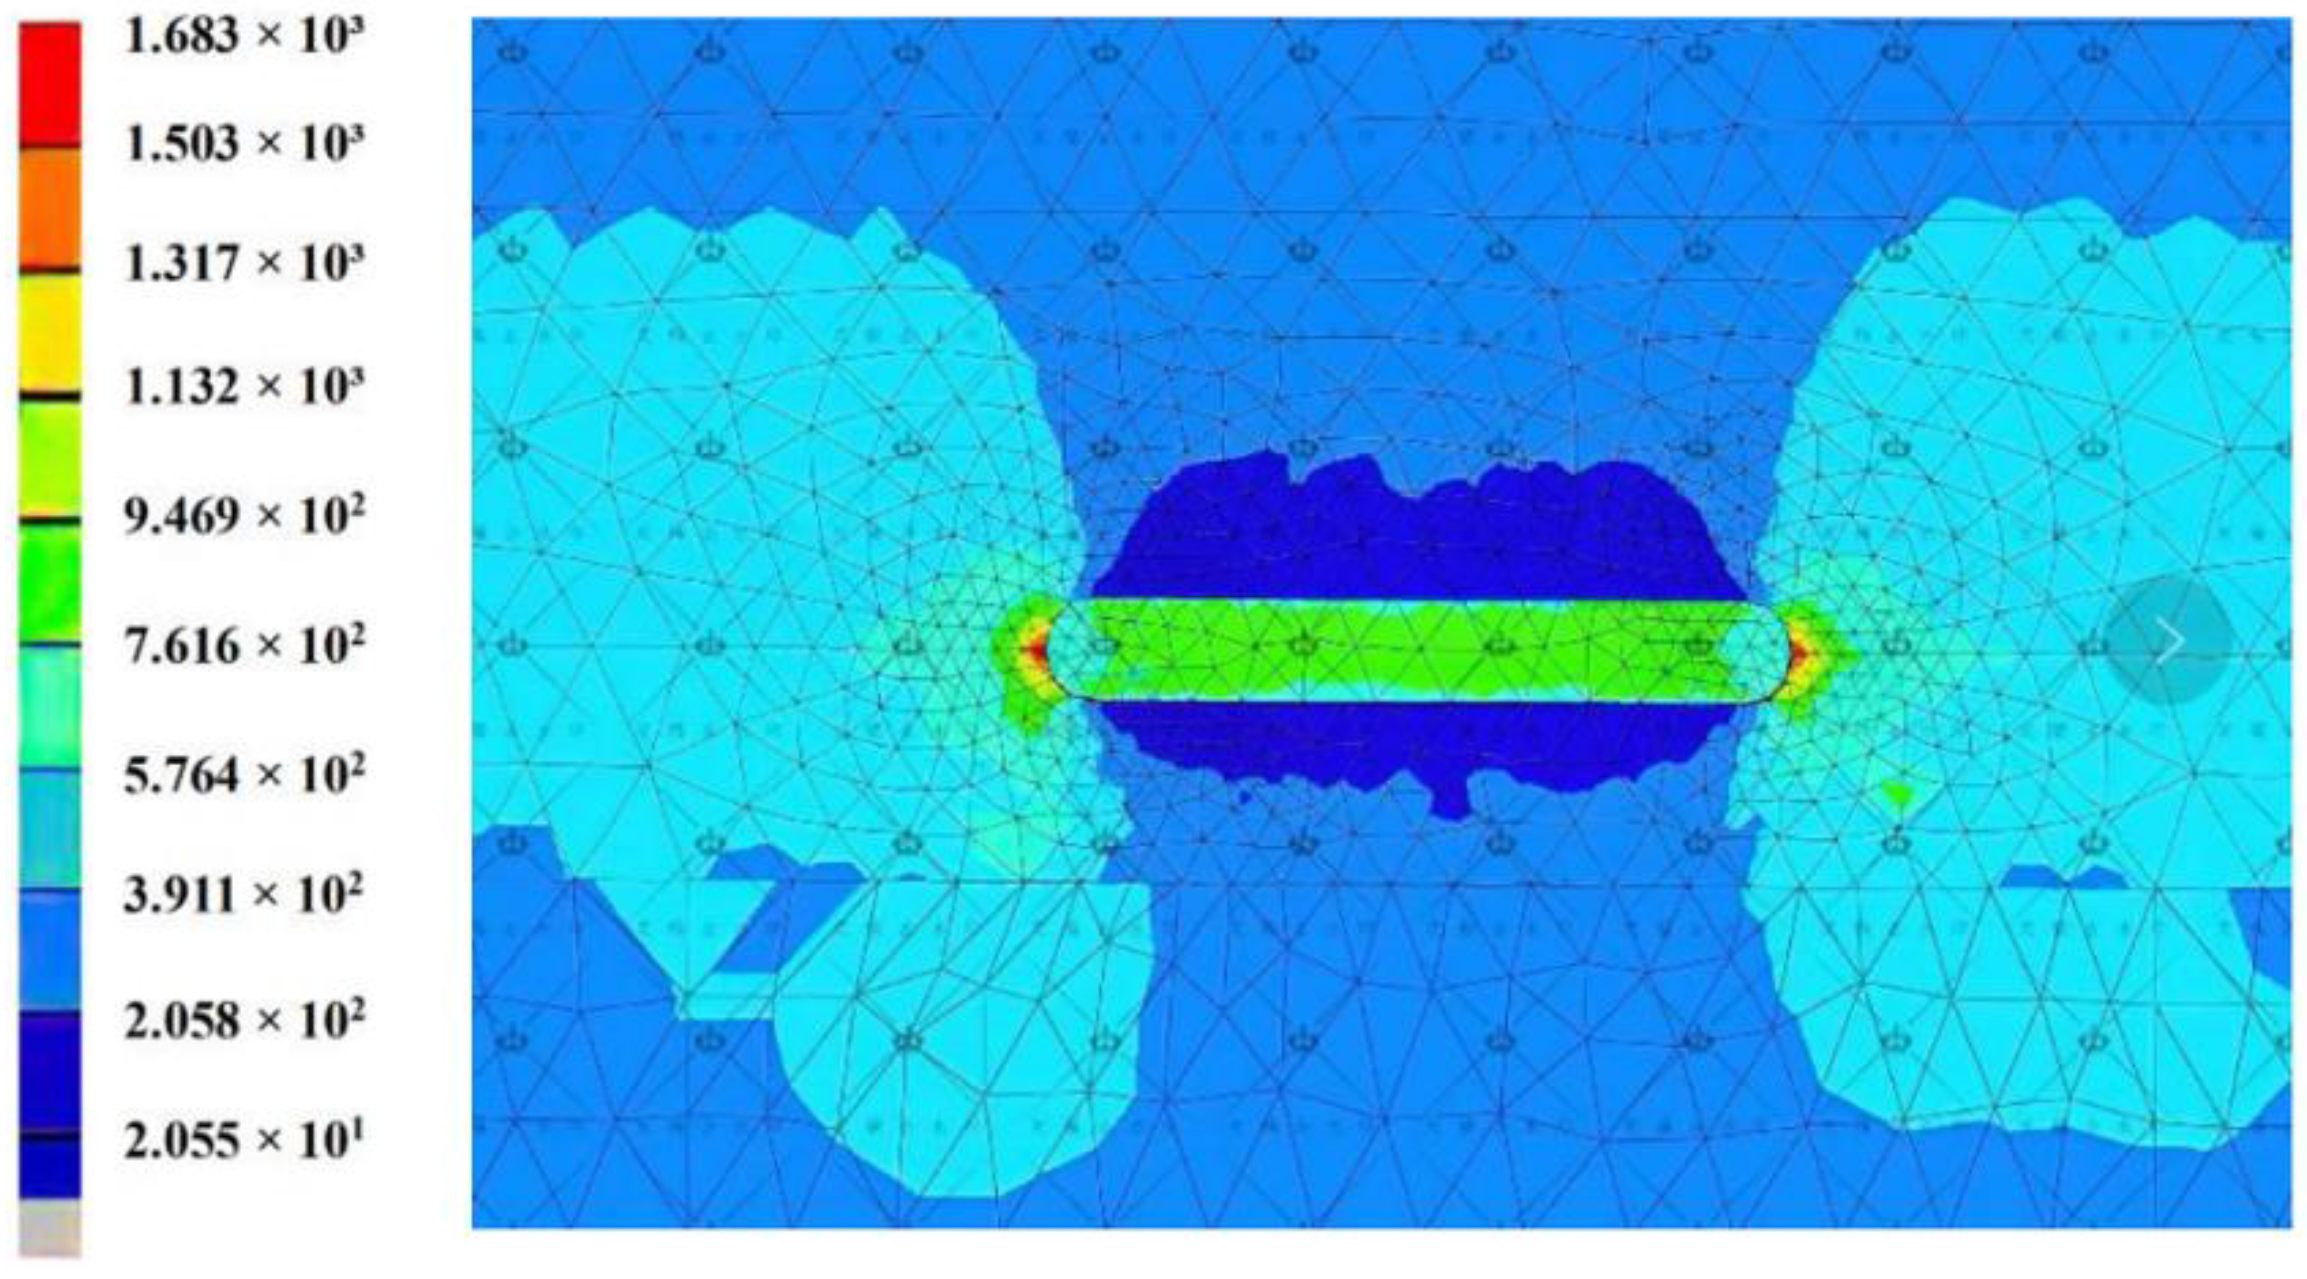
The three-dimensional modelling by using the commercial software FRANC3D for the equivalent welling joint with prefabricated notch and basically consistent weld zone shape is carried out with a refined mesh size of 1 mm in the cracked area. The weld area and its transition area with the base metal are meshed by tetrahedral element, and the other areas are meshed by hexahedral element; finally, the total element number is 122,093, as shown in Figure 17. Fixed constraint is applied in one end of the model and the other end is subjected to an axial compression of 235.2 kN. Static analysis is carried out to check the equivalent stress nephogram of the overall model and the stress nephogram in the vicinity of the prefabricated notch. Obvious stress concentration areas are shown in Figure 18 and Figure 19, verifying the effects loading and constraints.
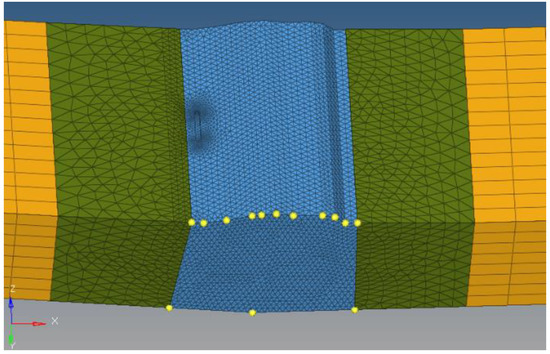
Figure 17.
The meshed model of the welded specimen.
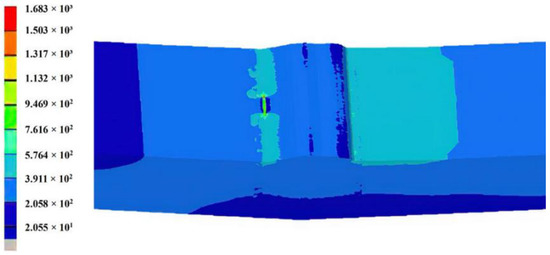
Figure 18.
Equivalent stress nephogram of the whole model.

Figure 19.
Stress nephogram of precast notch.
Based on the experimental observation, cracks successively appeared at the upper and lower edges of the weld, and it is reasonably supposed that crack E1 in the upper side and the cracks N1, N2, N3 in the bottom side propagate independently. The geometric correction factor Y(a) corresponding to the crack length is pre-calculated based on the above numerical model to represent the structure geometry effect on the stress intensity factor, K, and the mathematical expression of Y(a) will be obtained by fitting for the calculation of the subsequent crack propagation. Crack E1 is firstly introduced at the upper edge of the weld. The initial size of the elliptical crack E1 is defined as the value when the number of load cycles calculated in Figure 15 reaches 32,160. The length and depth of the crack are 12.2 mm and 2.5 mm, respectively. Then, the crack N2 is introduced to the right of the prefabricated notch in the welding area, and the size of the crack under 43,939 load cycles, as shown in Figure 17, is defined as the initial crack size. The crack shape is assumed to be round with the radius size of 0.6 mm. Re-meshing is conducted after the crack introduced and contact effect is set between the crack surfaces. The residual stress field based on the measurement data in Figure 8 is applied on the crack surface.
An improved crack growth model proposed by the author’s group is adopted for crack growth calculation, which can be described as [29,36,37],
where,
It can be noticed that Kmax, fop and KC are all the functions of crack length a, where A is a materially and environmentally sensitive constant of dimensions (MPa)−2; m is a constant representing the slope of the corresponding fatigue crack growth rate curve; n is the index indicating the unstable fracture; KC is the plane stress fracture toughness of the material; KIc is the plan stain fracture toughness of the material; KCf is the fracture toughness of the material under fatigue loading; re is an empirical material constant of the inherent flaw length of the order of 1 μm, which is set to 1μm int the present calculation; a is the modified crack length, which is equal to re plus the actual crack length; smax is the maximum applied stress, smin is the minimum applied stress; Y(a) is a geometrical factor; Y(re) is a geometrical factor when a is equal to re; R is the stress ratio, which is 0 in the present study; ∆Keff is the effective range of the stress intensity factor; ∆Keffth is the effective range of the stress intensity factor at the threshold level; Kop is the stress intensity factor at the opening level; α’ is the crack tip stress/strain constraint ratio, which is 1 for the plane stress state and 1/(1–2 ν) for the plane strain state; σu is the ultimate strength of the material; σY is the yield strength of the material; n’ is the hardening exponent of the power-law material; ν is the Poisson’s ratio. The effect of n is significant only in the unstable propagation region; a constant value of 6 is recommended for a quick and simple engineering analysis. The values of A, m, ∆Keffth for Ti-6Al-4V ELI are 3.74 × 10⁻¹¹, 3.35 and 4.34 MPam0.5, respectively [9].
The value of a in the crack E1 and the value of b2 in the crack of N2 are used to compare with the experimental data as typical parameters of calculation, which are, respectively, shown in Figure 20 and Figure 21. The experimental data agree well with the calculated curve. This not only verifies the improved crack growth rate model proposed by our research group, but also proves the reliability of the numerical simulation method adopted in this paper.
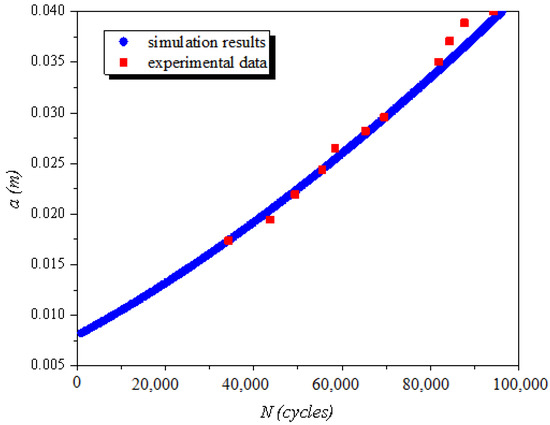
Figure 20.
Comparison of crack propagation curves based on crack length a.
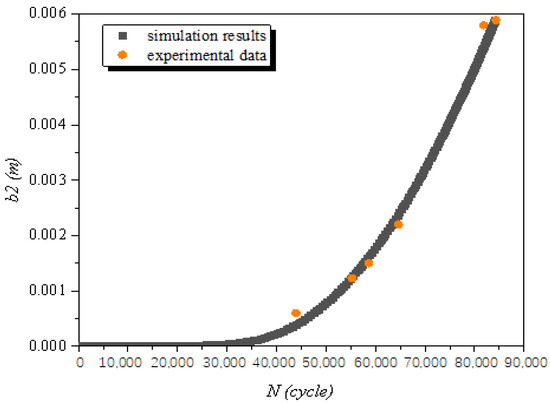
Figure 21.
Comparison of crack propagation curves based on crack length b2.
When a notch is artificially prefabricated on the specimen as the crack source, it is used as the initial dominant crack, in order to cause more crack initiation in the specimen or on the surface and accelerate the failure rate of the specimen. However, unexpectedly, due to the limitations of the observing equipment used in this test, the first long crack (E1) observed was the leftmost part of the upper edge specimen, located at the junction of the weld and the base metal. This phenomenon only indicates that E1 crack growth rate is obviously massive among all cracks but does not indicate that the E1 crack is the first crack. The reason for initiation of the E1 crack is that it is located at the toe of welding, which is the region with the largest stress concentration, which further indicates the importance of residual stress to structural crack. The prefabricated crack does not reach the expected situation; this may be due to the influence of the observation equipment in this paper or it may be because the stress at the prefabricated crack is not as big as that at the toe. However, when multiple cracks appear on the surface of the specimen, the crack (E2) at the left end of the prefabricated notch and the crack (E1) at the left end of the lower edge expand separately; due to the constant changes in the stress at the crack tip, it is possible to influence each other and accelerate the growth rate of each other, thus accelerating the failure rate of the specimen. This is a reasonable inference, but more tests are needed to verify the synergistic effect of multiple cracks.
5. Summary and Conclusions
An equivalent welding joint made of high-strength titanium alloy Ti-6Al-4V ELI is designed based on the principle that the ratio of the stress in outer surface to the stress in the inner surface of the specimen should be similar to or smaller than the actual stress ratio characteristics in the critical zone of the spherical hull. More conservative consideration is made by decreasing the calculated specimen angle of about 179 to 175° for easier specimen fabrication. A wide welded joint is sampled to three fatigue specimens by wire cutting as the equivalent welded joints and the ultrasonic stress measurement analyzer is applied for residual stress measurement. Load-controlled uniaxial fatigue experiment on the specimen in as-weld condition is conducted at room temperature under the load ratio of 0.1. The crack length is recorded once every 2000 load cycles when a certain macro crack is observed on each side of the weld. Multi-cracks lead to final fracture after 113,402 load cycles, which are regarded as the conservative service life of the studied manned cabin. The designed submergence frequency of such a deep-sea manned cabin is generally 6000 times in the whole life cycle, that is to say, based on the equivalent method proposed in this paper, the life of the studied manned cabin meets the requirements.
Crack propagation is simulated based on an improved crack growth rate model for multiple cracks at the upper and lower edge of the weld. The curve of fatigue crack versus number of load cycles is calculated and compared with the experimental data to verify the method. In the initial design stage of the manned cabin, when the repeated experimental conditions are not satisfied, the equivalent specimen size can be designed according to the static analysis of the manned cabin first, and then the fatigue life can be evaluated based on the improved crack growth rate model to preliminarily judge the rationality of the design, which is helpful to repeat the optimization design and evaluation process.
The similar method can be extended to evaluate the long-term service life of other underwater pressure resistant structures.
Author Contributions
Conceptualization, F.W.; methodology, F.W. & L.Y.; software, H.Z. & F.C.; validation, F.C. & Y.W. (Yu Wu); formal analysis, L.Y., H.Z. & Y.W. (Yu Wu); investigation, J.Z.; resources, Y.W. (Yongmei Wang) & R.L.; data curation, J.Z.; writing—original draft preparation, F.W., H.Z. & L.Y.; writing—review and editing, Y.W. (Yongmei Wang); supervision, F.W.; project administration, F.W.; funding acquisition, F.W. All authors have read and agreed to the published version of the manuscript.
Funding
This work is supported by the National Natural Science Foundation of China (Grant No. 52071203 and No. 52101320) and National Key Research and Development Program of China (Grand No. 2021YFC2800600).
Institutional Review Board Statement
Not applicable.
Informed Consent Statement
Not applicable.
Data Availability Statement
Not applicable.
Acknowledgments
The authors would like to express their gratitude for the support of Fishery Engineering and Equipment Innovation Team of Shanghai High-level Local University.
Conflicts of Interest
The authors declare no conflict of interest.
References
- Gorman, J.J.; Louie, L.L. Submersible pressure hull design parametrics. SNAME Trans. 1991, 99, 119–146. [Google Scholar]
- Cui, W.C.; Wang, F.; Pan, B.B.; Hu, Y.; Du, Q.H. Chapter 1 Issues to be Solved in the Design, Manufacture and Maintenance of a Full Ocean Depth Manned Cabin. In Advances in Engineering Research; Petrova, V.M., Ed.; Nova Science Publishers: New York, NY, USA, 2015; Volume 11. [Google Scholar]
- Wang, F.; Zhang, S.J.; Yu, S.; Du, Q.H.; Zhang, J.; Jiang, Z.; Cui, W.C. Design and analysis on a model sphere made of maraging steel to verify the applicability of the current design code. Ships Offshore Struct. 2019, 14, 86–94. [Google Scholar] [CrossRef]
- Zhang, J.; Di, C.; Wang, F.; Tang, W. Buckling of segmented toroids under external pressure. Ocean Eng. 2021, 239, 109921. [Google Scholar] [CrossRef]
- ASME PVHO-1-2007; Safety Standard for Pressure Vessels for Human Occupancy, Edition 2007. The American Society of Mechanical Engineers: New York, NY, USA, 2007.
- Wang, F.; Wang, W.W.; Cui, W.C. Influential factors to be considered for a tentative long-term service life assessment method of the deep-sea manned cabins. Chin. J. Ship Res. 2019, 14, 39–46. [Google Scholar]
- Zhang, J.; Zhang, Y.W.; Wang, F.; Zhu, Y.M.; Cui, W.C.; Chen, Y. Experimental and numerical studies on the buckling of the hemispherical shells made of maraging steel subjected to extensively high external pressure. Int. J. Press. Vessel. Pip. 2019, 172, 56–64. [Google Scholar] [CrossRef]
- Wang, F.; Pan, B.; Shen, Y.; Cui, W. On fracture resistance parameter from non-standard fracture test specimens of titanium alloy. Ships Offshore Struct. 2012, 9, 177–185. [Google Scholar] [CrossRef]
- Wang, F.; Cui, W.; Pan, B.; Shen, Y.; Huang, X. Normalised fatigue and fracture properties of candidate titanium alloys used in the pressure hull of deep manned submersibles. Ships Offshore Struct. 2014, 9, 297–310. [Google Scholar] [CrossRef]
- Li, L.B.; Bao, H.N.; Wan, Z.Q.; Li, Y.Q.; Sun, K.X.; Luo, G.E. Influence of residual stress due to the equatorial weld on the ultimate strength of a Ti80 spherical pressure shell. Int. J. Adv. Manuf. Technol. 2021, 116, 1831–1841. [Google Scholar] [CrossRef]
- Zhu, Y.M.; Yao, X.; Yang, L.F.; Wang, F.; Zhang, J. Effect of stress intensity factor on surface crack of deep-sea spherical shell. J. Ship Mech. 2019, 5, 476–484. [Google Scholar]
- Zhang, S.J.; Wang, F.; Cui, W.C. Fatigue Crack Growth Properties of 18Ni(250) and 18Ni(350) Used for Full-Ocean-Depth Pressure Hull. J. Ship Mech. 2018, 22, 1540–1548. [Google Scholar]
- Jasion, P.; Magnucki, K. Elastic buckling of clothoidalspherical shells under external pressure-theoretical study. ThinWalled Struct. 2015, 86, 18–23. [Google Scholar]
- Yu, C.L.; Chen, Z.T.; Chen, C.; Chen, Y.T. Influence of initial imperfections on ultimate strength of spherical shells. Int. J. Nav. Archit. Ocean. Eng. 2017, 9, 473–483. [Google Scholar] [CrossRef]
- Zhu, Y.M.; Ma, Q.L.; Zhang, J.; Tang, W.X.; Dai, Y.J. Opening reinforcement design and buckling of spherical shell subjected to external pressure. Int. J. Press. Vessel. Pip. 2017, 158, 29–36. [Google Scholar] [CrossRef]
- Zhang, J.; Zhang, M.; Cui, W.; Tang, W.; Wang, F.; Pan, B. Elastic-plastic buckling of deep sea spherical pressure hulls. Mar. Struct. 2018, 57, 38–51. [Google Scholar] [CrossRef]
- Zhang, J.; Hu, H.F.; Wang, F.; Li, Y.S.; Tang, W.X. Buckling of externally pressurized torispheres with uniform and stepwise thickness. Thin-Walled Struct. 2022, 173, 109045. [Google Scholar] [CrossRef]
- Huang, C.; Zhang, J.; Wang, F.; Di, C.Y. Restoration of Ultimate Strength of Dented Hemispheres Under External Hydrostatic Pressure. China Ocean. Eng. 2022, 36, 500–507. [Google Scholar] [CrossRef]
- China Classification Society (CCS). Specification for Classification of Diving Systems and Submersibles; China Classification Society: Beijing, China, 2018. [Google Scholar]
- Wang, F.; Wang, K.; Cui, W.C. A simplified life estimation method for the spherical hull of deep manned submersibles. Mar. Struct. 2015, 44, 159–170. [Google Scholar] [CrossRef]
- Wang, F.; Cui, W.C. Recent Developments on the Unified Fatigue Life Prediction Method and its Applications. J. Mar. Sci. Eng. 2020, 8, 427. [Google Scholar] [CrossRef]
- Wang, F.; Hu, Y.; Wang, Y.Y.; Lu, Z.Q.; Du, Q.H.; Cui, W.C. Life assessment procedure of PMMA viewport in full-ocean-depth manned submersible. In Proceedings of the 1st International Conference on Ships and Offshore Structures (ICSOS), Hamburg, Germany, 31 August–2 September 2016. [Google Scholar]
- Sun, C.; Li, Y.; Xu, K.; Xu, B. Effects of intermittent loading time and stress ratio on dwell fatigue behavior of titanium alloy ti-6al-4v eli used in deep-sea submersibles. J. Mater. Sci. Technol. 2021, 77, 223–236. [Google Scholar] [CrossRef]
- Labeas, G.; Diamantakos, I.; Kermanidis, T. Assessing the effect of residual stresses on the fatigue behavior of integrally stiffened structures. Theor. Appl. Fract. Mech. 2009, 51, 95–101. [Google Scholar] [CrossRef]
- Hobbacher, A. Recommendations for Fatigue Design of Welded Joints and Components; Springer International Publishing: Cham, Switzerland, 2016. [Google Scholar]
- Yu, C.L.; Guo, Q.B.; Gong, X.B.; Yang, Y.F.; Zhang, J. Fatigue life assessment of pressure hull of deep-sea submergence vehicle. Ocean. Eng. 2022, 245, 110528. [Google Scholar] [CrossRef]
- Miskulski, Z.; Lassen, T. Fatigue crack initiation and subsequent crack growth in fillet welded steel joints. Int. J. Fatigue 2019, 120, 303–318. [Google Scholar] [CrossRef]
- Cui, W.; Wang, F.; Huang, X. A unified fatigue life prediction method for marine structures. Mar. Struct. 2011, 24, 153–181. [Google Scholar] [CrossRef]
- Cui, W.C.; Huang, X.P. A general constitutive relation for fatigue crack growth analysis of metal structures. Acta Metall. Sin. (Engl. Lett.) 2009, 16, 342–354. [Google Scholar]
- Wang, F.; Zhang, X.Z.; Zhang, J.F.; Luo, R.L.; Zhang, J.; Wang, Y.M. An improved small-time-scale crack growth rate model considering overloading and load-sustaining effects for deep-sea pressure hulls. Ocean. Eng. 2022, 247, 110361. [Google Scholar] [CrossRef]
- Kang, Y.T.; Feng, Y.L.; Lin, J.G.; Zhang, W.M. Load spectrum for creep-fatigue life prediction of viewport used in human occupied vehicle. Comput. Model. New Technol. 2014, 18, 1185–1190. [Google Scholar]
- Wang, F.; Wang, M.Q.; Wang, W.W.; Yang, L.; Zhang, X.Z. Time-dependent axial displacement of PMMA frustums designed for deep-sea manned cabin. Ships Offshore Struct. 2020, 16, 827–837. [Google Scholar] [CrossRef]
- Wang, F.; Wang, Y.Y.; Cui, W.C. Prediction of crack growth rates of a high strength titanium alloy for deep sea pressure hull under three loading patterns. J. Ship Mech. 2016, 20, 699–709. [Google Scholar]
- Wang, F.; Cui, W.C.; Wang, Y.Y.; Shen, Y.S. Overload and dwell time effects on crack growth property of high strength titanium alloy TC4 ELI used in submersibles. In Proceedings of the Analysis and Design of Marine Structures V, Southampton, UK, 25–27 March 2015. [Google Scholar]
- ASTM E837-08; Standard Test Method for Determining Residual Stresses by the Hole-Drilling Strain-Gage Method. ASTM: West Conshohocken, PA, USA, 2008.
- Wang, Y.; Cui, W.; Wu, X.; Wang, F.; Huang, X. The extended McEvily model for fatigue crack growth analysis of Metal Structures. Int. J. Fatigue 2008, 30, 1851–1860. [Google Scholar] [CrossRef]
- Wang, F.; Cui, W.C. Approximate method to determine the model parameters in a new crack growth rate model. Mar. Struct. 2009, 22, 744–757. [Google Scholar] [CrossRef]


Publisher’s Note: MDPI stays neutral with regard to jurisdictional claims in published maps and institutional affiliations. |
© 2022 by the authors. Licensee MDPI, Basel, Switzerland. This article is an open access article distributed under the terms and conditions of the Creative Commons Attribution (CC BY) license (https://creativecommons.org/licenses/by/4.0/).