Article

Structure, Microstructure, Hyperfine, Mechanical and Magnetic Behavior of Selective Laser Melted Fe92.4Si3.1B4.5 Alloy

1
Laboratoire de Magnétisme et Spectroscopie des Solides (LM2S), Badji Mokhtar Annaba University, BP 12, Annaba 23000, Algeria
2
Department of Physics, Universitat of Girona, Campus Montilivi, 17004 Girona, Spain
3
Laboratoire Interdisciplinaire Carnot de Bourgogne, Procédés Métallurgiques, Durabilité, Matériaux, Université Bourgogne Franche-Comté, 90400 Sevenans, France
4
Laboratoire Interdisciplinaire Carnot de Bourgogne, Procédés Métallurgiques, Durabilité, Matériaux, Université de Technologie Belfort-Montbéliard, 90400 Sevenans, France
5
Institut des Molécules et Matériaux du Mans, IMMM UMR CNRS 6283, Le Mans Université, CEDEX 9, 72085 Le Mans, France
*
Author to whom correspondence should be addressed.
Metals 2022, 12(10), 1620; https://doi.org/10.3390/met12101620
Submission received: 26 August 2022 / Revised: 16 September 2022 / Accepted: 23 September 2022 / Published: 27 September 2022
(This article belongs to the Section Powder Metallurgy)

Abstract

:
A disordered ε-FeSi crystalline structure was produced by selective laser melting in Fe92.4Si3.1B4.5 powder alloys fabricated with different laser powers at a laser scanning speed of 0.4 m/s. The phase formation, microstructure, roughness, microhardness, and hyperfine and magnetic properties were studied using X-ray diffraction, scanning electron microscopy, atomic force microscopy, a profilometer, a microdurometer, transmission 57Fe Mössbauer spectrometry and vibrating sample magnetometry. The aim of this work was therefore to study the effect of laser power on the phase formation, microstructure, morphology, and mechanical, hyperfine and magnetic properties. The XRD patterns revealed the coexistence of a bcc α-Fe0.95Si0.05, a tetragonal Fe2B boride phase and a disordered ε-FeSi type structure. The existence of the disorder was confirmed by the presence of different FeSi environments observed in the Mössbauer spectra. The Fe2B boride contained about 51–54% of Fe atoms. The porosity and roughness decreased whereas laser power increased. The sample produced with a laser power of 90 W had a smooth and dense surface, high microhardness (~1843 Hv) and soft magnetic properties (saturation magnetization Ms = 200 emu/g and coercivity Hc = 79 Oe).

1. Introduction

Nanocrystalline (NC) and/or amorphous FeSiB alloys have been extensively studied due to their microstructures, which consist of crystalline nanograins embedded in a residual amorphous matrix [1,2,3,4,5]. Consequently, they are very interesting from an economical point of view because they are relatively cheap due to the natural abundance of their elements in the earth. From a technological point of view, amorphous FeSiB alloys are fascinating because they exhibit high hardness, superior corrosion resistance, small initial magnetic permeability, high saturation magnetization and low coercivity. In addition, FeSiB metallic glasses can be used in fusion devices because the components contained in those alloys are low-activation elements and therefore reduce irradiation-induced radioactivity [6]. Furthermore, due to their relatively low glass-forming ability (GFA), the application range of Fe-rich magnetic compounds as innovative structural and functional materials can be considerably restricted. Hence, the addition of boron to FeSi alloys is necessary to achieve a high GFA, as it inhibits the coarsening of bcc grains, improving thus both the magnetic properties and the thermal stability of the remaining amorphous phase [7,8,9].
Partially or fully amorphous FeSiB alloys have been produced in various forms such as powders [10,11,12], ribbons [13], thin films [14] and coatings [15,16]. Pulsed laser heating [17] and laser-irradiation [18] have also been used to induce nanocrystallization in FeSiB amorphous metallic glasses. Nevertheless, there are no studies on amorphization/nanocrystallization induced by selective laser melting (SLM) technology in 3D FeSiB samples. SLM, as one of the layers of additive manufacturing (AM) techniques and rising 3D technologies, has received much attention due to its ability to build full-density, high-precision and high-performance metal parts, and fabricate various components of materials from powdered alloys and build parts with complex lattice structures particularly suitable for magnetic losses in electrical engineering [19,20,21]. However, one of the challenges in SLM is the manufacturing of overhanging surfaces, defined as the bottom or downward facing surfaces of an object built on top of an underlying free powder material rather than a solidified material [22]. Many parameters such as the powder surface quality, evaporation of elements, trapped gases, and the reduced solubility of dissolved elements in the melt pool during cooling and solidification, might lead to the fabrication of almost full density (98–99%) 3D objects [23] in order to improve the magnetic response of bulk specimens. Consequently, it is important to optimize the production conditions such as laser power, laser scanning speed, scan spacing and layer thickness [24,25].
The aim of this work is therefore to study the effect of laser power on the phase formation, microstructure, morphology, and mechanical, hyperfine and magnetic properties of the produced Fe92.4Si3.1B4.5 alloys, using several characterization techniques such as X-ray diffraction (XRD), scanning electron microscopy (SEM) coupled with X-ray spectroscopy analysis (EDX), atomic force microscopy (AFM), Vickers microhardness, profilometry, transmission 57Fe Mössbauer spectrometry and vibrating sample magnetometry (VSM).

2. Materials and Methods

2.1. Selective Laser Melting

Fe92.4Si3.1B4.5 alloy powders, produced by inert gas atomization from cast materials, were obtained from the NANOVAL company. The morphology of the powder particles exhibited smaller and bigger spherical particles, with the majority of sizes less than 30 μm (Figure 1). The fluctuation in particle composition was evidenced with an elemental analysis (Table 1). The selective laser melted Fe92.4Si3.1B4.5 samples had been produced using a commercial SLM machine MCP-Realizer SLM 250 system (MCP-HEK Tooling GmbH, Lübeck, Germany). An Ytterbium fiber laser source with a maximum theoretical power output of 120 W and a wavelength of 1064 μm was used. The laser focus beam had a diameter of 34 μm. The building chamber dimension was 25 cm × 25 cm × 25 cm. The vacuum atmosphere was controlled by a combination of a primary pump and a Roots system, providing an even and accurate vacuum level, reaching a minimum pressure of 10−3 mbar. The machine was filled with a shielding gas during all experiments, to remove smoke and maintain a stable pressure. The chamber was purged of residual oxygen below 0.1% to avoid oxidation. A set of 3D 5 mm × 5 mm × 5 mm cubic parts was prepared under an argon atmosphere using different laser powers (50, 70, 90 and 110 W), a laser scanning speed of 0.4 m/s, a laser beam diameter of 34 μm, a scan line spacing of 40 μm and a powder layer thickness of 50 μm. The samples produced at 50, 70, 90 and 110 W are named hereafter as P50, P70, P90 and P110, respectively.

2.2. Characterization

The structural evolution of the selective laser melted specimens was investigated with X-ray diffraction (XRD) in a PANalytical Empyrean diffractometer (Malvern Panalytical, Malvern, UK) (θθ), Bragg Brentano geometry and Co-Kα radiation (λCo = 1.78901 Å). The phase evolution and microstructural parameters (lattice parameters version 2.993, crystallite size, microstrain percentage and phases percentage) were calculated with an XRD pattern fitting applying the MAUD software [26], based on the Rietveld refinement technique [27]. The local 57Fe environment was analyzed with transmission Mössbauer spectrometry (TMS), at room temperature, with a conventional constant acceleration drive and a 57Co source diffused in a Rh matrix. The Mössbauer spectra were fitted using the least-squares MOSFIT software (version 1.1, Mosfit, France) [28]. The isomer shift parameter is obtained with respect to α-Fe at 300 K. The percentages of the several Fe species were calculated from their respective relative absorption areas. This calculation assumes the same values of the recoilless f Lamb-Mössbauer factor. The morphology of the selective laser melted samples was followed by scanning electron microscopy (SEM, JEOL GSM-5800LV; JEOL, Tokyo, Japan), coupled with a microanalysis with energy-dispersive X-ray spectroscopy (EDX). Atomic force microscopy (AFM, Asylum Research MFP3D; Oxford Instruments Asylum Research, Santa Barbara, CA, USA) was utilized to analyze the surface topography, with a scan scope of 10 µm × 10 µm. The density was calculated by applying the Archimedean method, and the Vickers microhardness was measured under 100 g of load with a loading time of 10 s. The surface roughness (ISO 4288-section 7 for profile and ISO-25178-2 for areal surface texture) of the specimens was obtained with a Taylor-Hobson Surtonic 3P profilometer (Taylor-Hobson, Leicester, UK). Magnetic measurements were performed in a vibrating sample magnetometer (VSM) LakeShore 7404 (Lake Shore Cryotronics, Inc., Westerville, OH, USA) at room temperature (300 K) with an external field of 20 kOe.

3. Results

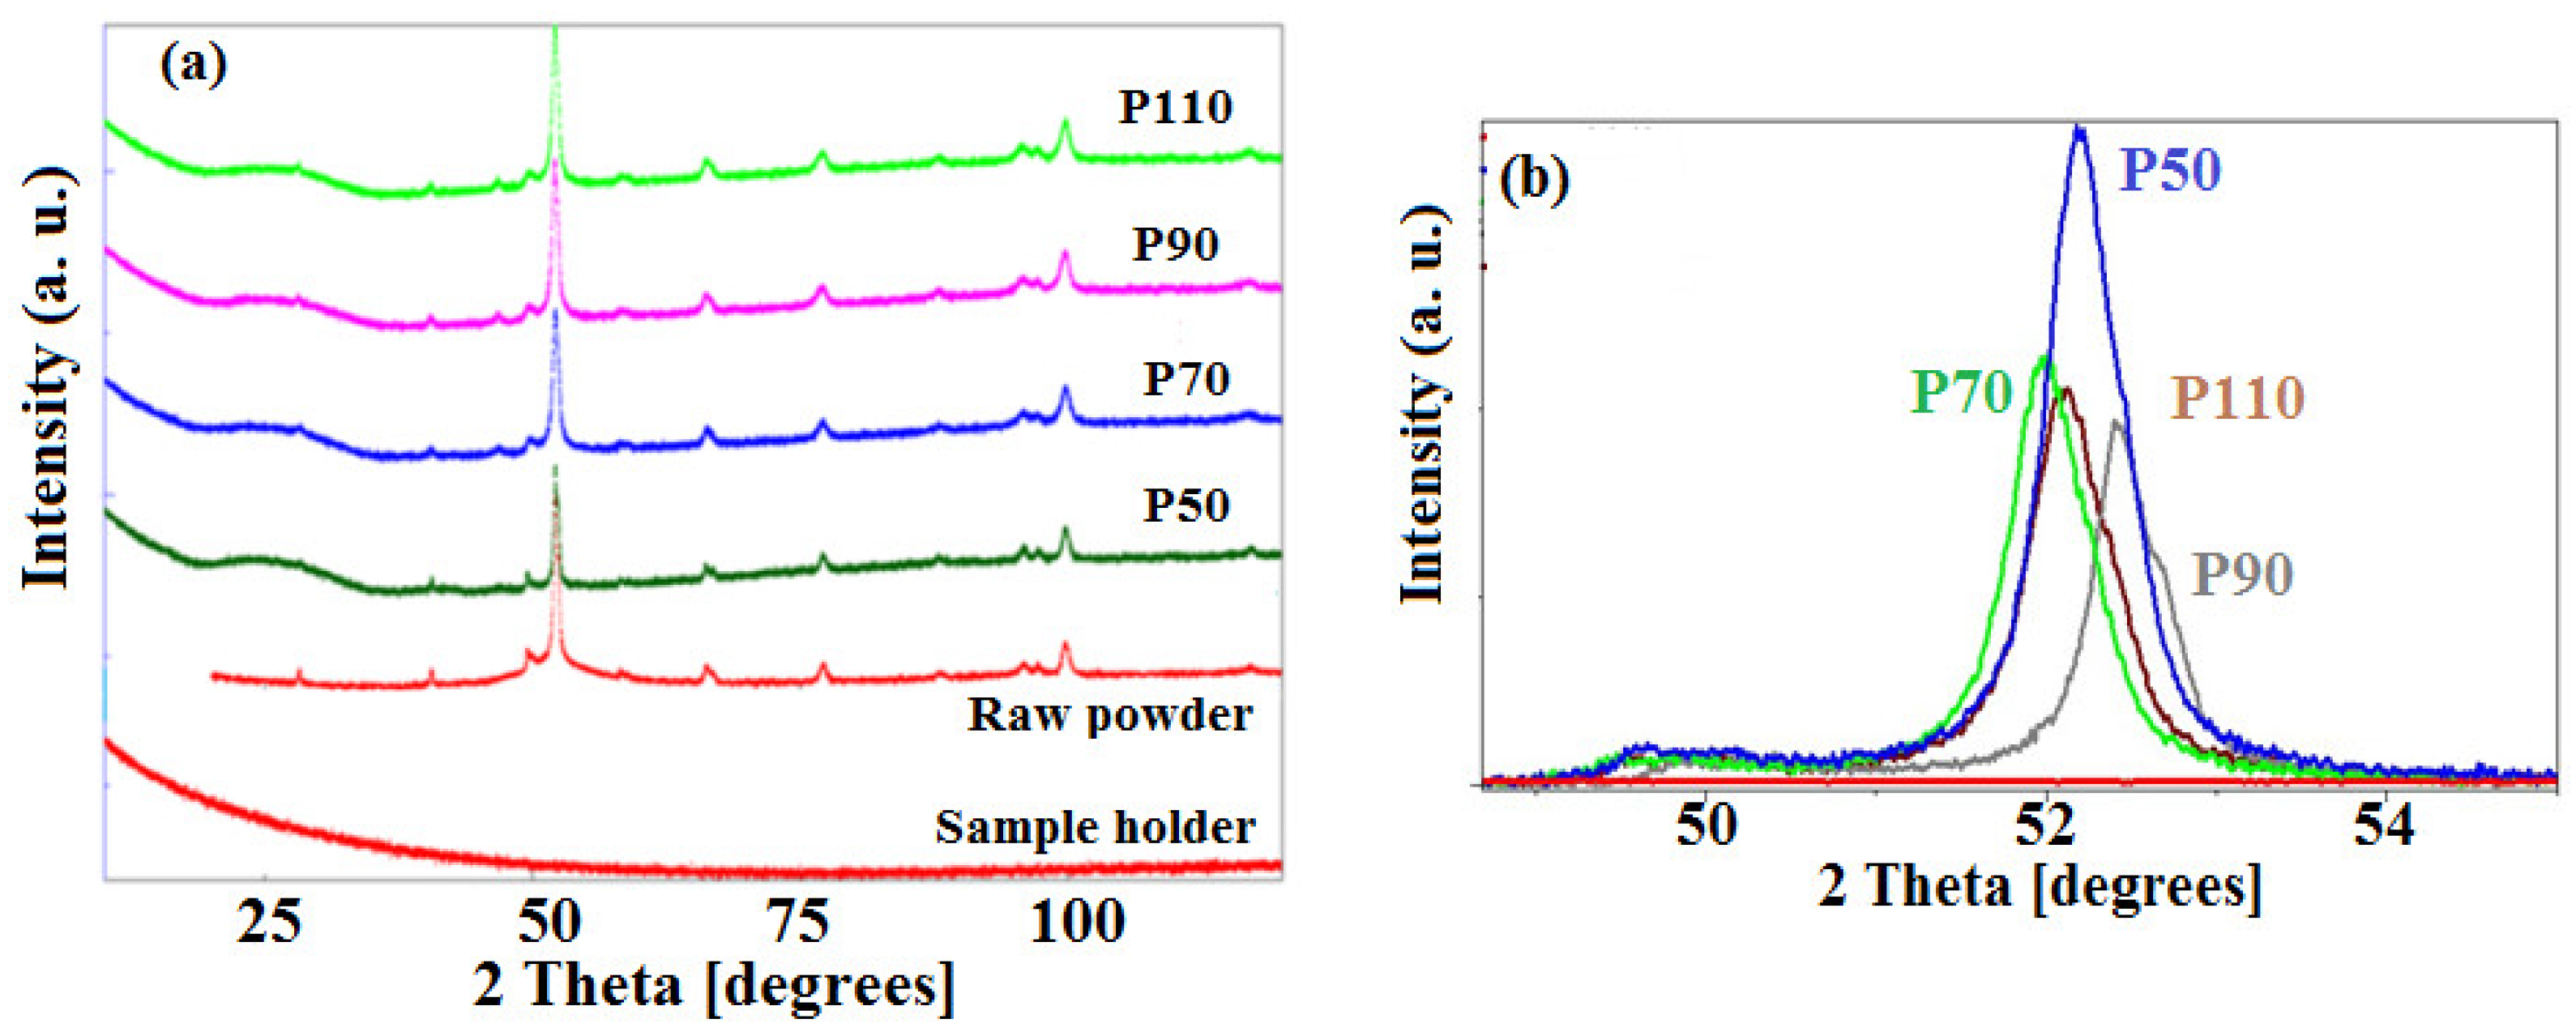
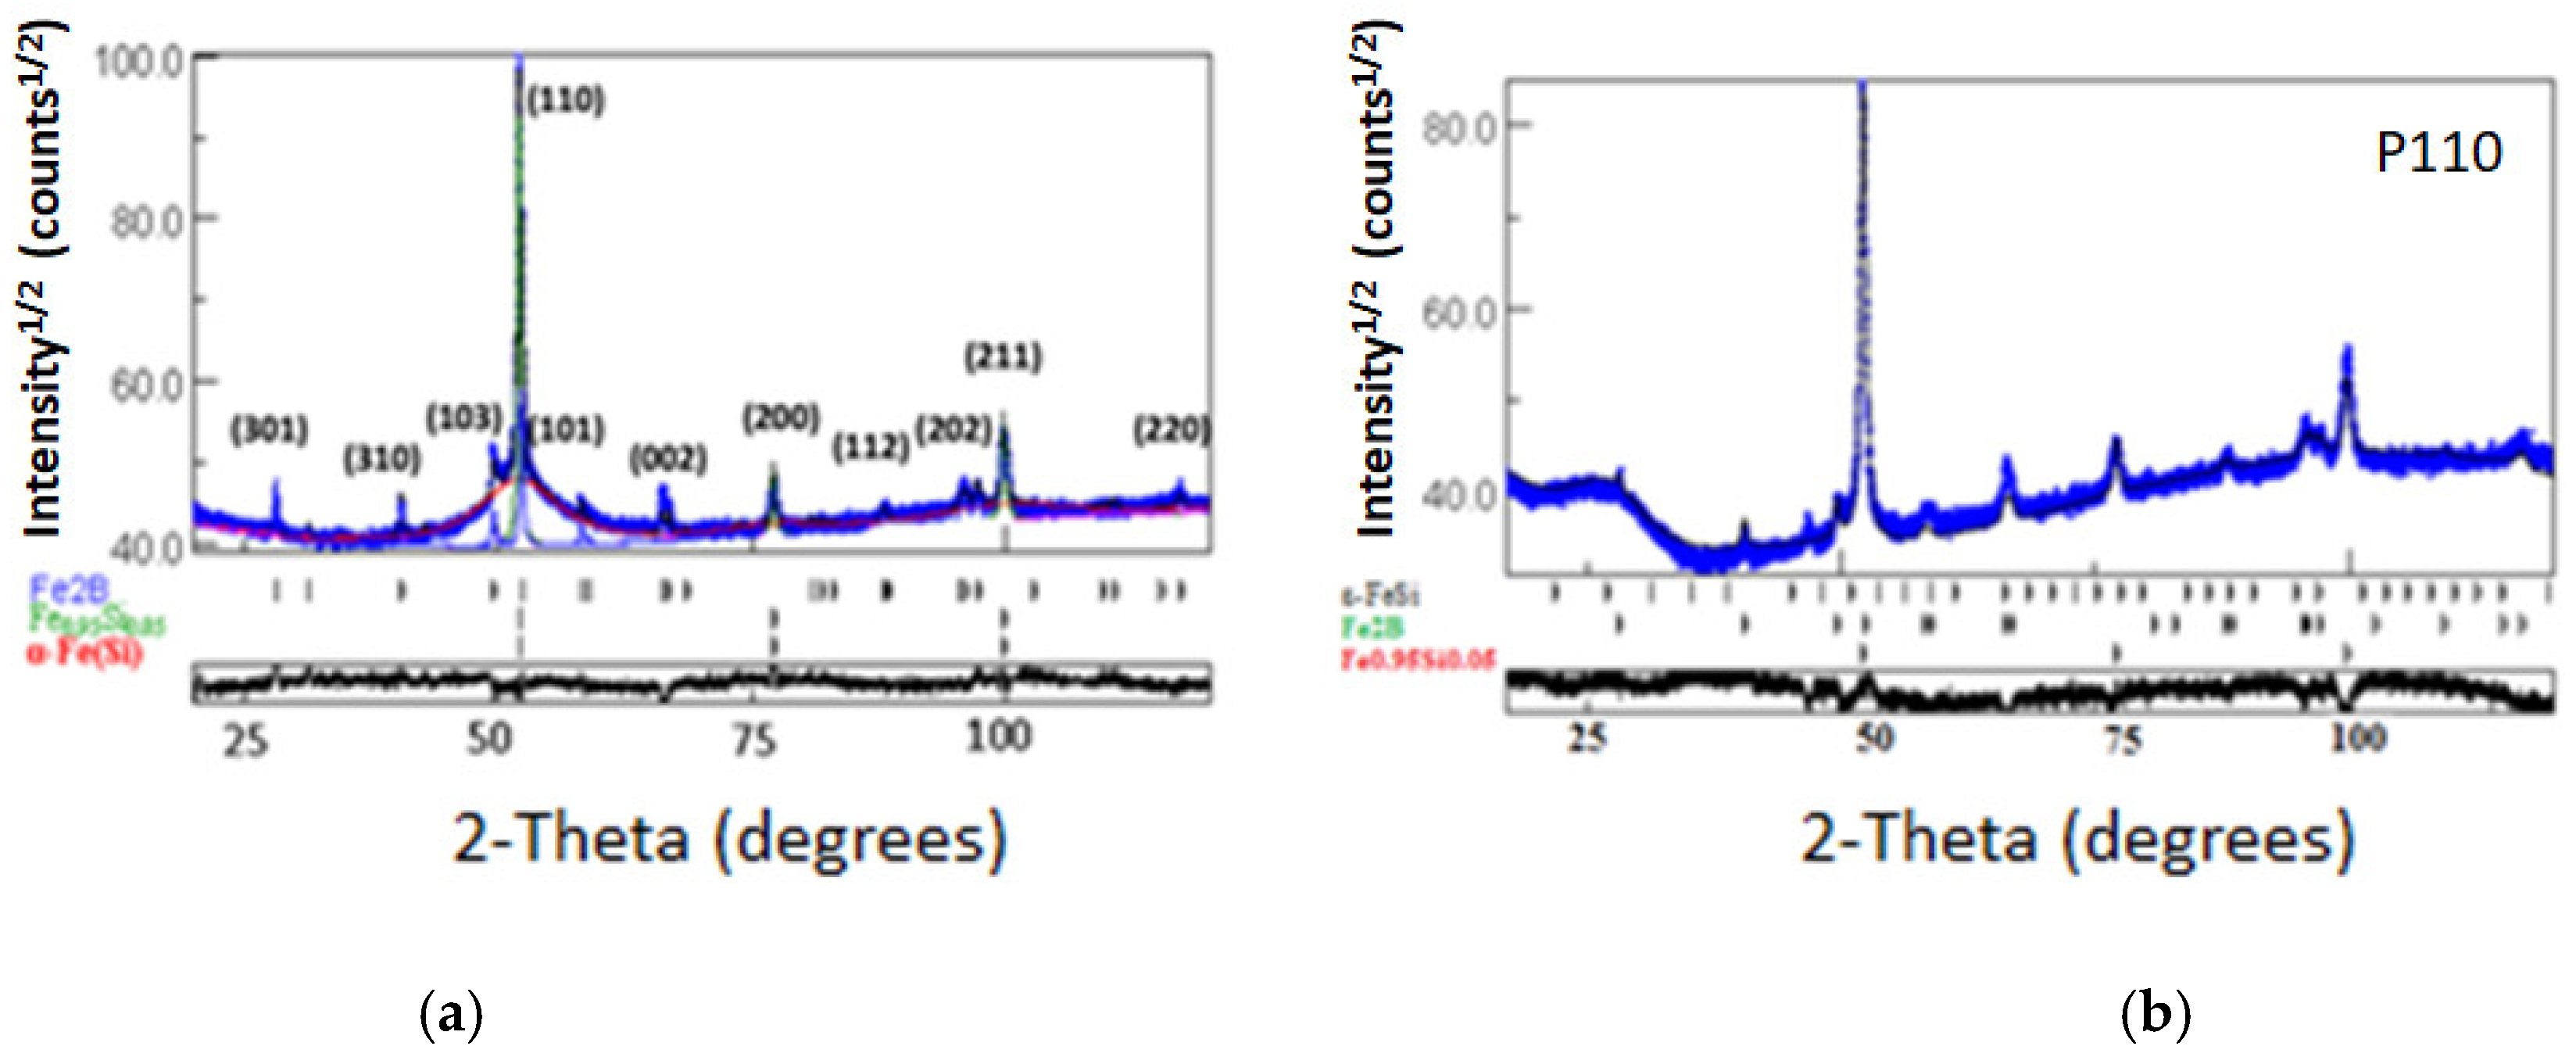
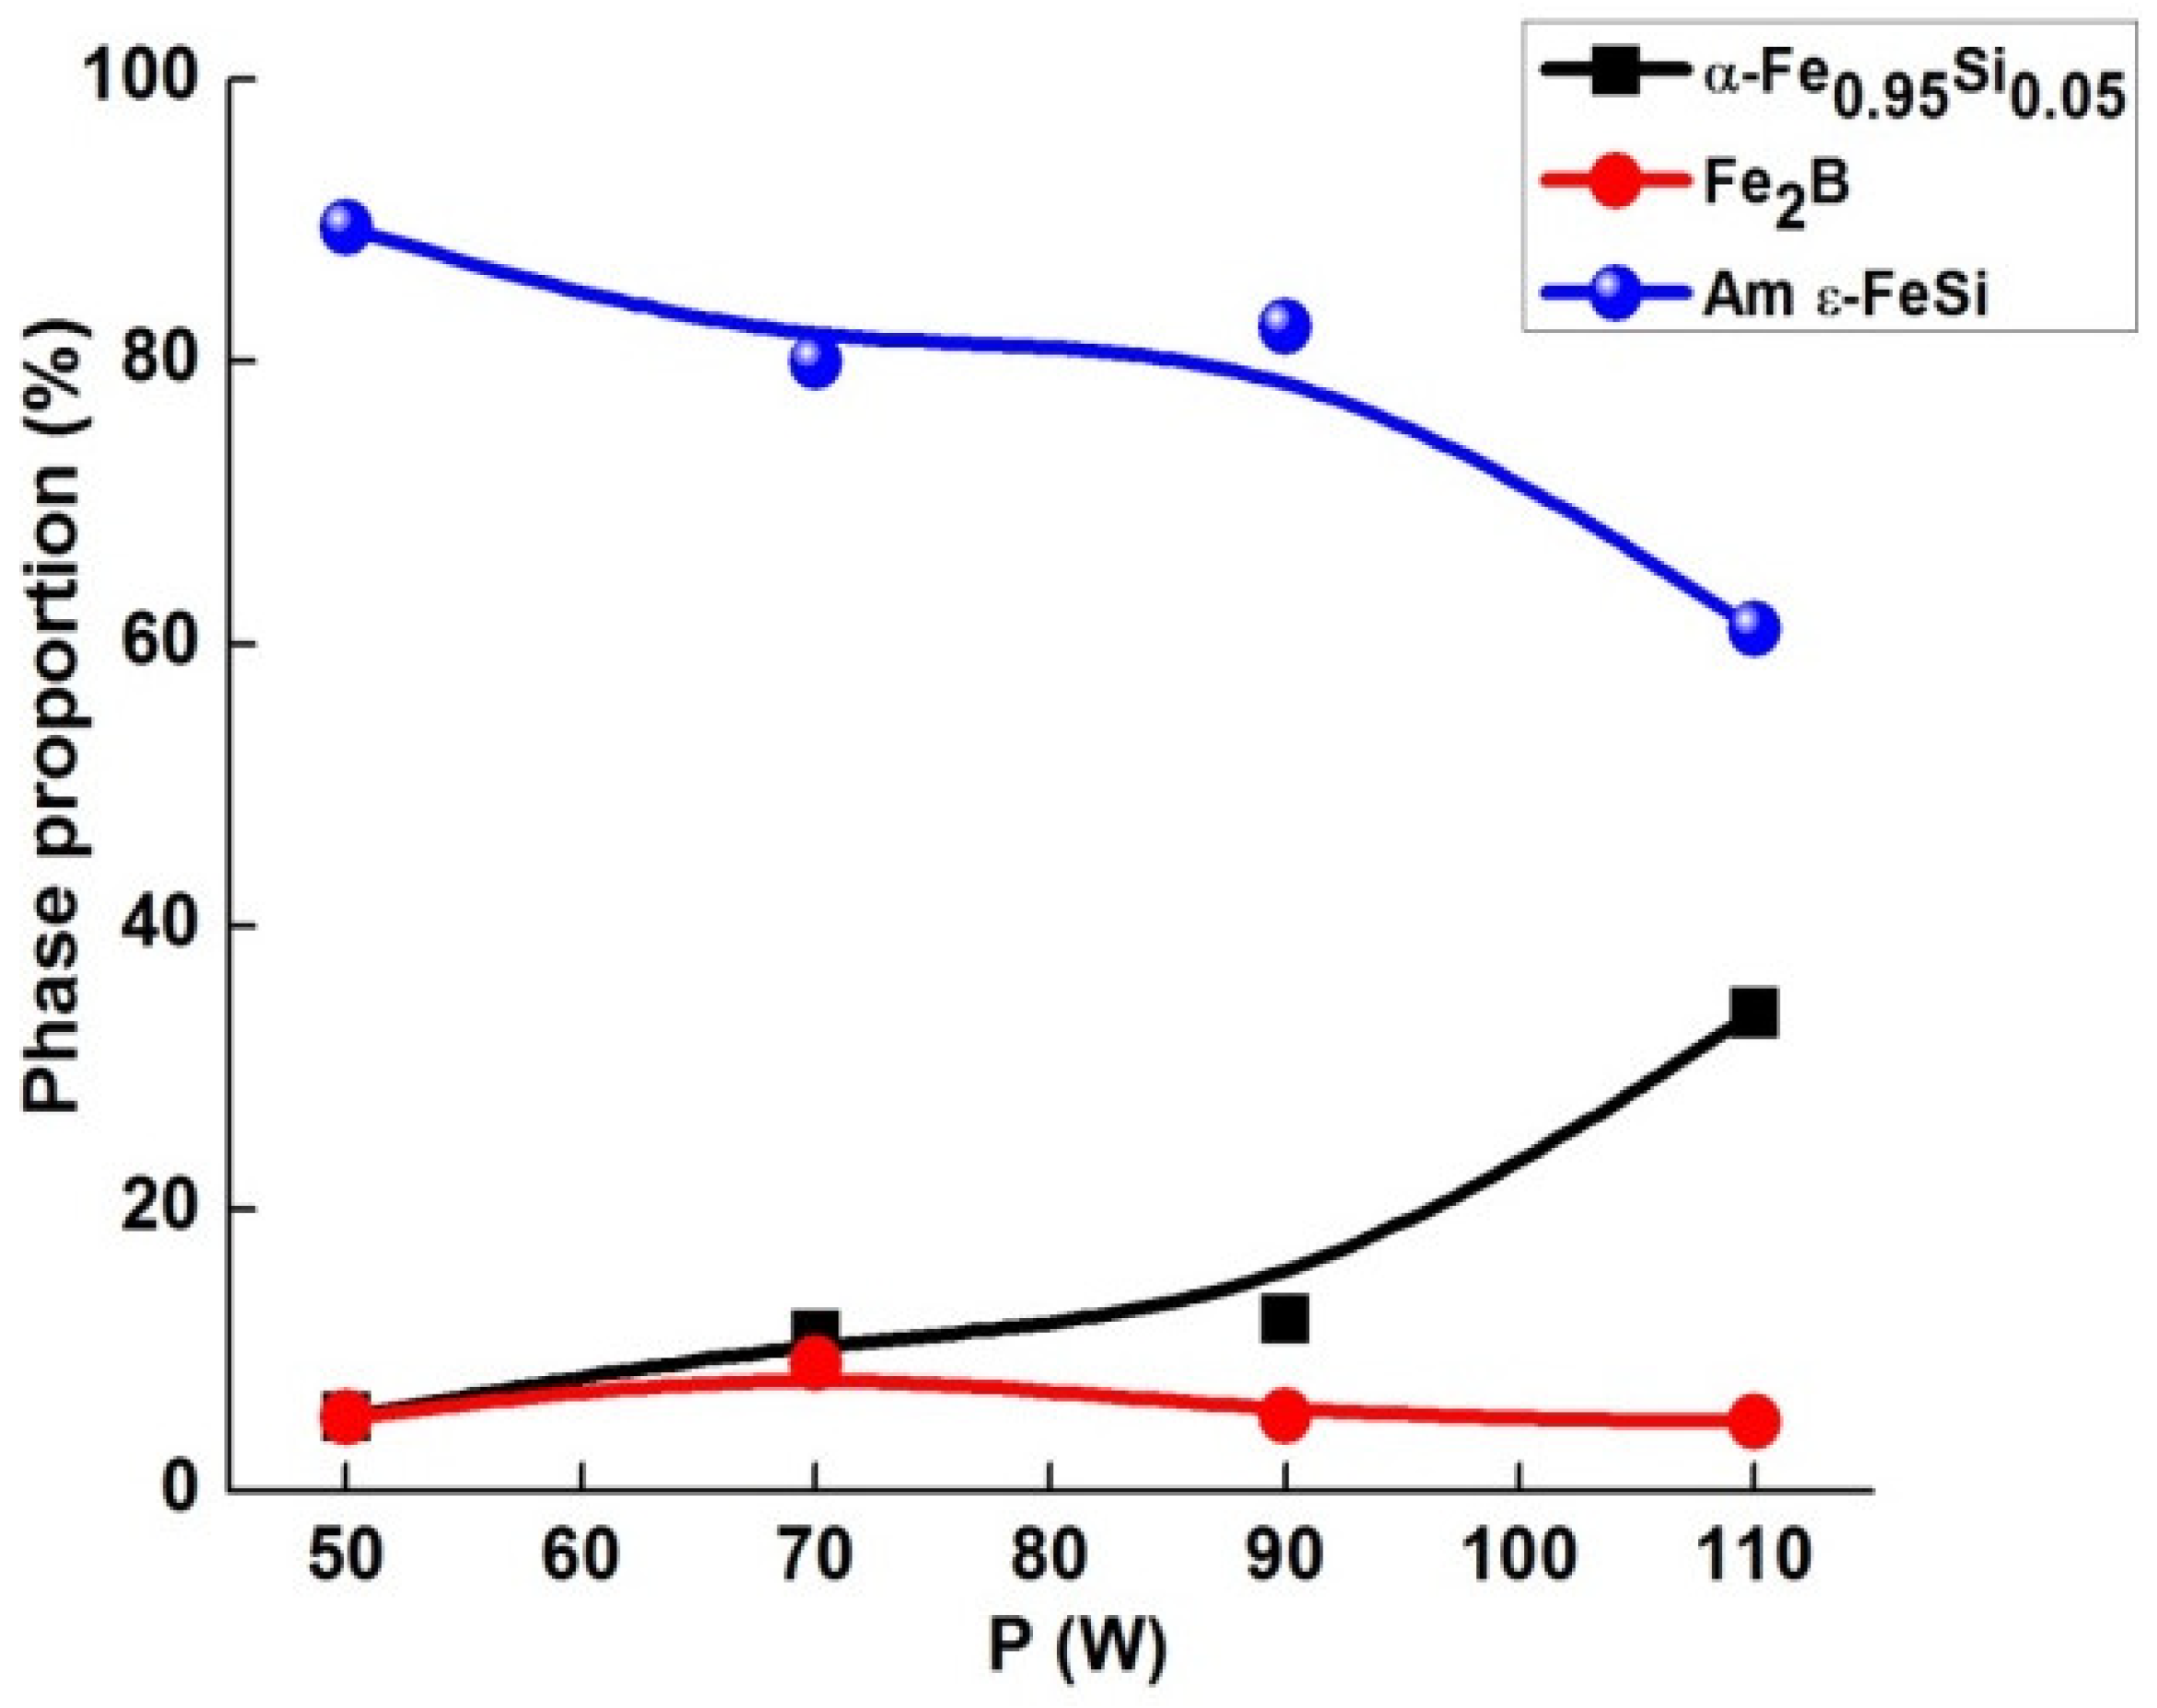
3.1. Structure and Microstructure

Figure 2a shows the XRD patterns of the produced samples with that of the sample holder. All the XRD patterns consist of broad and sharp peaks (due to the coexistence of the disordered and nanocrystalline phases). The laser irradiation favors the development of a disordered structure by the modification in the atomic positions, as confirmed by the presence of a broad halo peak that extends over the 2θ angles’ range from 18 to 35°, compared due to the variation in the composition and structure. In addition, the variation in the main peak’s intensity (Figure 2b) might be attributed to the change in the crystallite size, while the small shift in the peak position can be related to the lattice parameters modification.
The structural and microstructural parameters were deduced from the Rietveld refinement. The best structural refinement was achieved with different phases: α-Fe0.95Si0.05.
The (a0 = 0.2856 nm, space group Im-3m) body-centered tetragonal Fe2B (a0 = 0.511 nm, c0 = 0.4249 nm, space group I4/mcm) boride and cubic ε-FeSi type crystalline phase [28] (a0 = 0.4550 nm, space group P213). In the latter, Fe atoms are located at (0.736, 0.736, 0.736) and Si atoms at (−0.0562, −0.0562, −0.0562). The Rietveld refinement reveals, in addition to α-Fe0.95Si0.05 and Fe2B phases, the presence of the disordered α-FeSi type structure in the raw powders and ε-FeSi type in the self-laser melted samples (Figure 3). The crystallite size, lattice parameters and their relative deviations are summarized in Table 2. The relative deviations are given by: Δ a = a a 0 a 0 and Δ c = c c 0 c 0 where a0 and c0 are the lattice parameters of the ideal crystal, a and c are those of the produced samples.
The average crystallite size decreases with the increase in the laser power. The reduction in the crystallite size is due to the high cooling rate involved in the laser melting procedure and, consequently, the rapid solidification of the droplets inhibits the crystallites from coarsening.
The interaction between the laser beam and the powder favors a melt in which the temperature of the molten track can reach values above the crystallization temperature (780 K) of FeSiB alloys [29]. The structural disorder is linked to the variation of the local atomic coordination number, which is due to the presence of atomic impurities in the interstitial/substitutional sites. In addition, the difference in the atomic sizes between Fe, Si and B [(rFe (0.124 nm) > rSi (0.110 nm) > rB (0.088 nm)], as well as the negative heat of mixing (−38 kJ/mol for Fe/B and −26 kJ/mol for Fe/Si [30]), can promote a short-range order of the molten pool. In the case of the SLM technology, the formation of a highly disordered structure should be associated with the fast solidification of the molten pool in the course of the laser irradiation. Since the physical phenomenon involved in the SLM process is the melting, partial melting or liquid phase sintering of the powder particles, one expects that the laser energy melts the powder layer near the surface, and the latent heat released from the liquid during its solidification increases the temperature of the re-solidified powders, causing the underlying powder to melt. In addition, the repeated passages of the laser beam result in heat accumulations and an increase in the temperature with the powder thickness due to a volumetric absorption of the laser radiation. Likewise, the deformation of the powders in the laser point increases the distances between the nearest-neighbor (nn) atoms in the crystal lattice and, hence, the local volume strain increases. The topological disorder due to the spread of the atomic arrangement distances and the local environment of each atom induces a chemical disorder. This could explain the formation of the disordered ε-FeSi structure in the self-laser melted specimens. The atomic positions of Fe and Si atoms in the ε-FeSi crystal lattice vary slightly with the laser power (Table 3). The non-stoichiometry of the iron silicide can be confirmed by occupancy.
The increase in the lattice parameter of the α-Fe0.95Si0.05 structure for the P90 and P110 samples is evidenced by their relative deviations of about 0.21 and 0.28%, respectively. Such a deviation might be attributed to the composition change and/or to Si depletion because the atomic substitution (Fe by Si) leads to the lattice contraction (Si atoms are smaller). It has been published that the lattice parameter of Fe-Si alloys remains constant over the disordered range (<10 at.% Si), but a reduction of about 0.3% was observed at 10 at.% Si [31,32]. The crystal structure of Fe2B boride exhibits a contraction along the c axis for all samples, and a contraction/expansion along the a axis. Comparable values of the lattice parameters have been reported for the deposited coatings by atmospheric plasma spraying (APS) from the same initial powders [16]. According to the refinement, the lattice parameter range of the α-FeSi type structure is a = 0.628–0.6549 nm. One notes an important deviation of the crystal structure from that of an ideal one (a = 0.45507 nm, ICSD file), characterized by a relative deviation of the lattice parameter of about 38–44%. Iron monosilicide α-FeSi crystallizes with an unusual cubic structure (Z = 4), in which each species lies in sevenfold coordination [33]. It has a modified NaCl structure in which the Si and Fe atoms are displaced along the <1 1 1> directions [34].
Figure 4 displays the evolution of the volumetric fraction of the phases by increasing the laser power. The small decrease in the Fe2B volumetric fraction in the produced samples, compared to that of the raw powder (24.4%), might be due to its decomposition. It is well known that Fe2B is stable up to 1400 °C (Si percentage ~13 at.%) [35]. For α-Fe0.95Si0.05, the relative fraction is increased slightly up to 90 W and highly to ~34% for the P110 sample. At the same time, the disordered phase fraction reaches a maximum value of 89.5% with a laser power of 50 W, and then decreases to about 61% for 110 W. It is obvious that the increase in the α-Fe0.95Si0.05 volume fraction occurs at the expense of that of the α-FeSi type structure. Such a behavior can be correlated to the atoms’ movement under the laser irradiation, particularly the Si atoms. This assumption was consistent with the fact that the lattice parameter of the new structure is close to that of the dense form of Si (space group Ia-3, lattice parameter a = 0.6405 nm) [36]. The reduction of the α-Fe0.95Si0.05 relative proportion on the one hand, and the relatively low melting temperature of Si (1414 °C) compared to that of Fe (1538 °C) on the other hand, allow us to assume that Fe atoms can be trapped into the Si-rich liquid leading to the formation of a new non-stoichiometric ε-FeSi structure (Table 2).

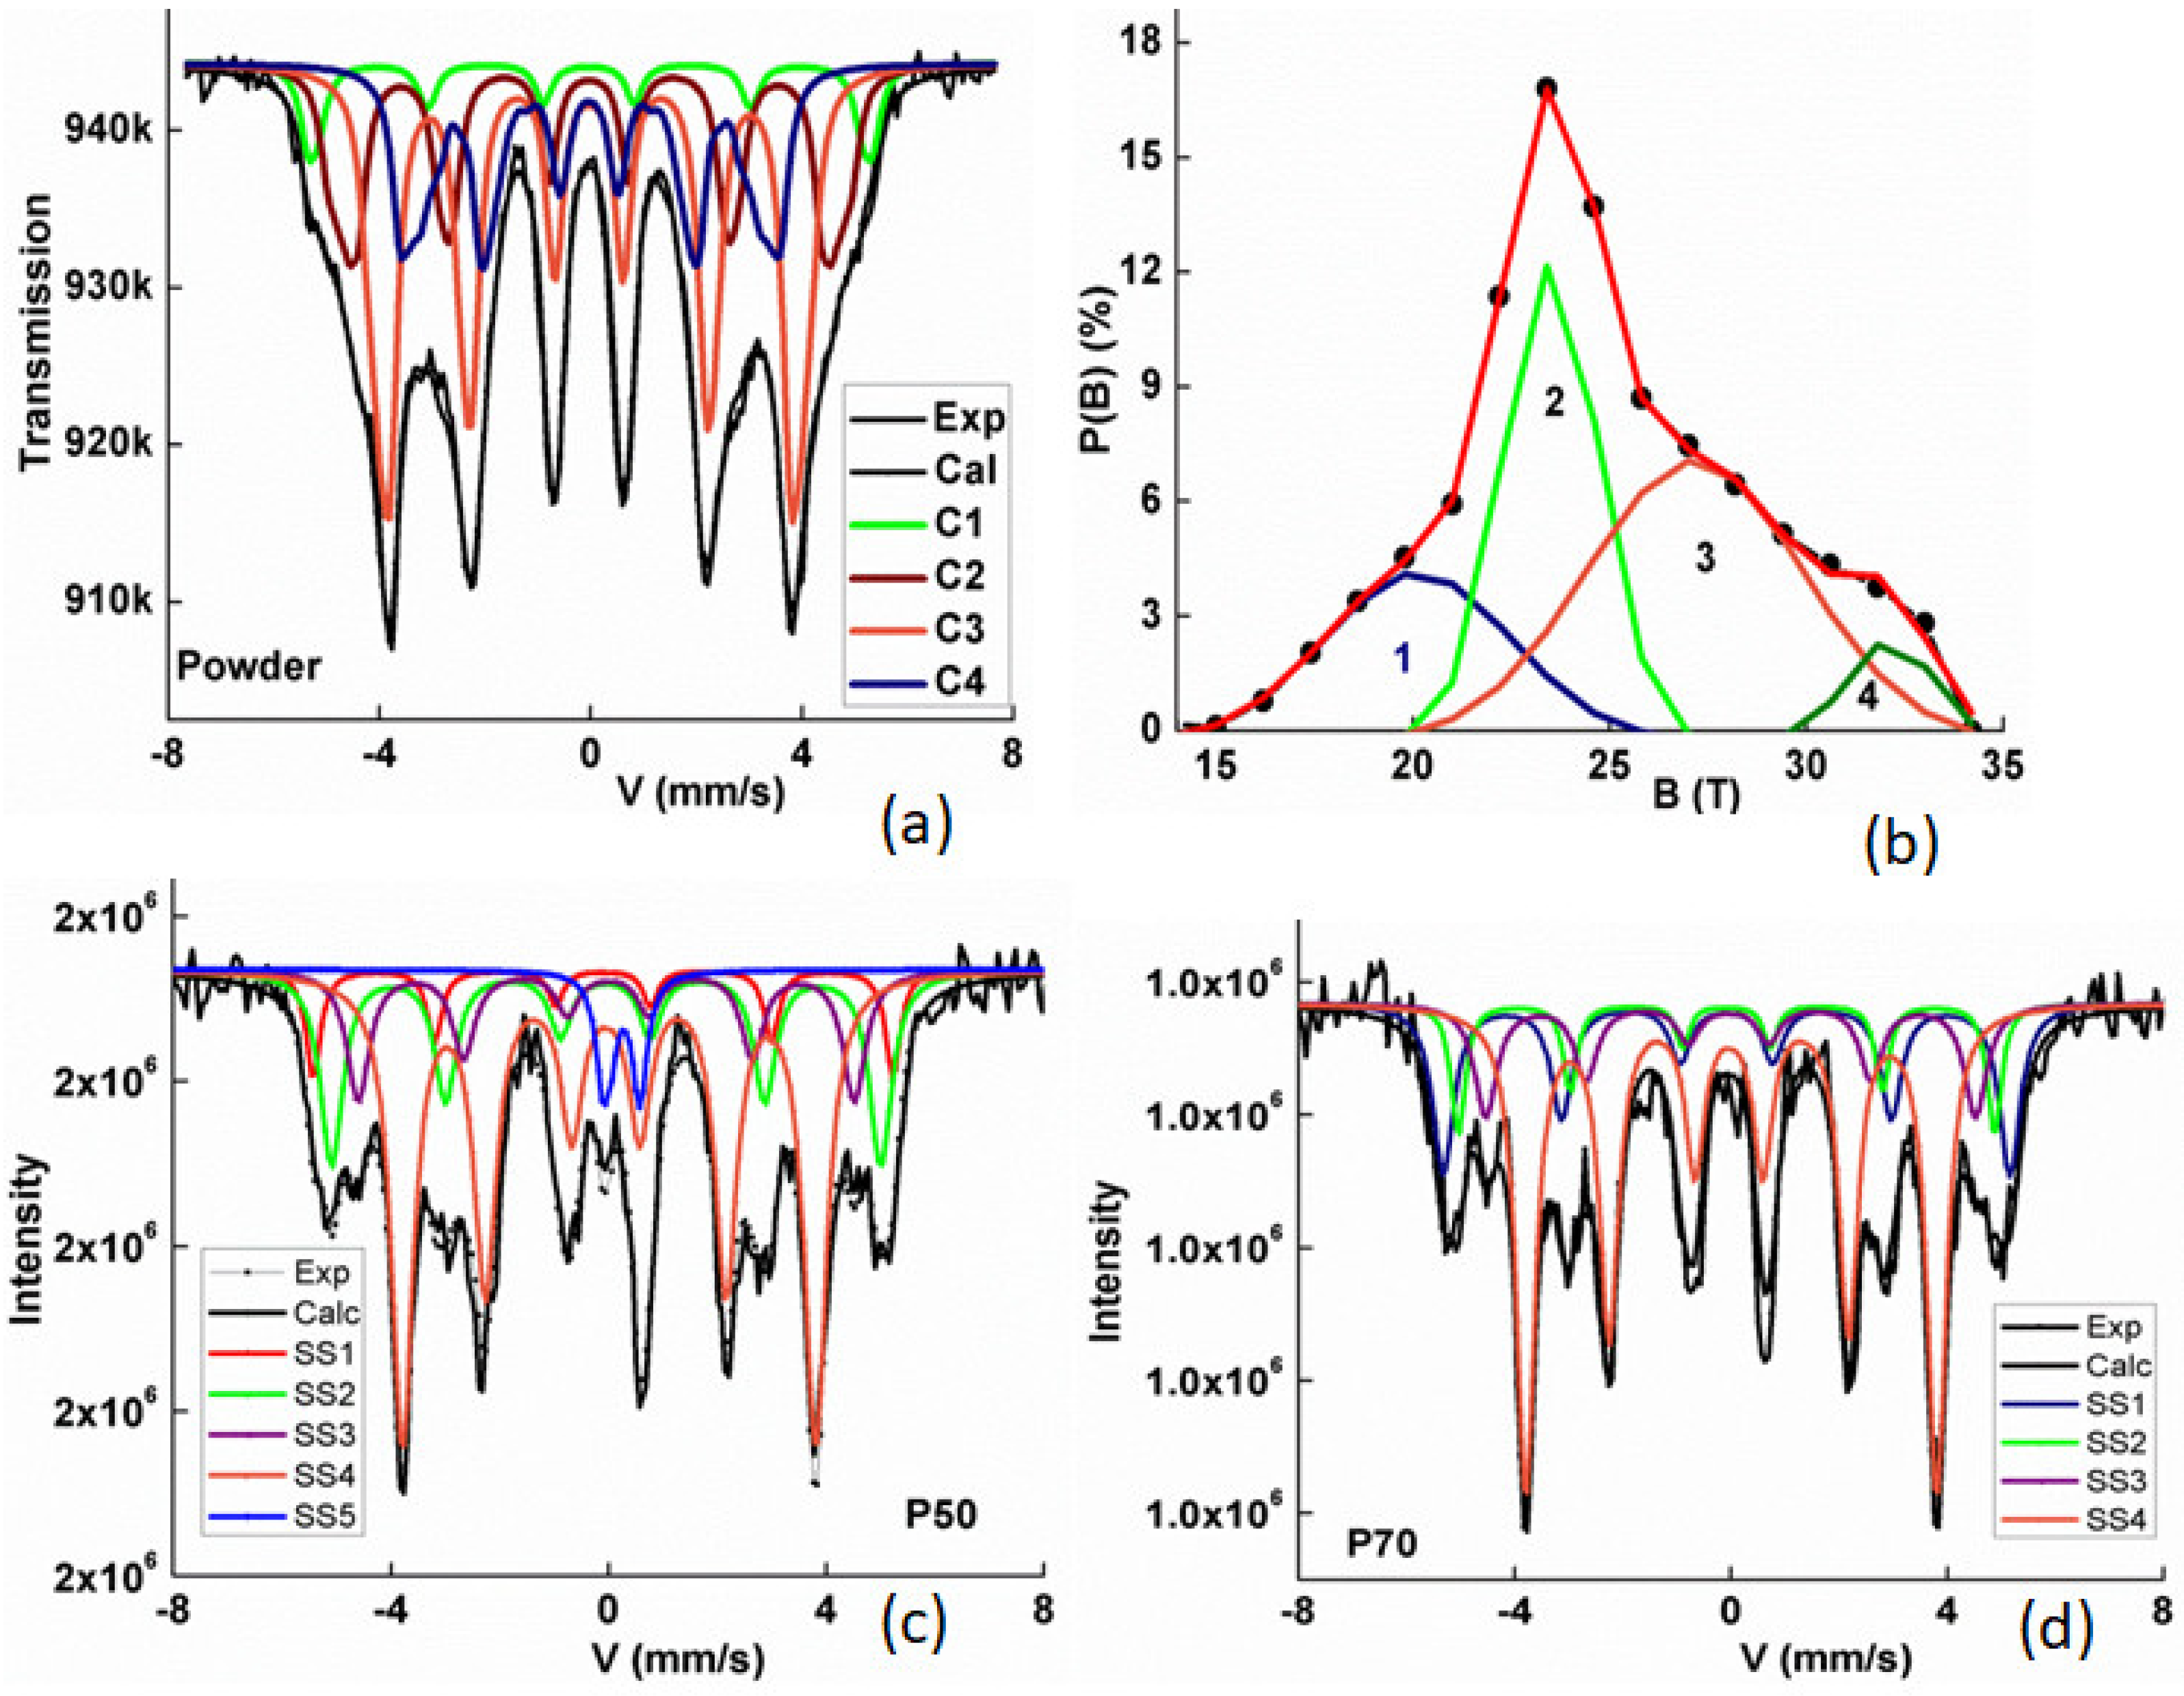
3.2. Mössbauer Spectrometry Results

The quantitative evaluation of the local structure was studied by transmission 57Fe Mössbauer spectrometry (MS) and the spectra are shown in Figure 5. MS should provide knowledge about the essence of electron transfer between an iron atom and its Si and B neighbors (metalloid atoms). The effect of the laser melting is confirmed by the shape of the Mössbauer spectra. Indeed, the presence of Si and B atoms in the vicinity of the Fe atoms causes an atomic disorder and a variety of structurally non-equivalent Fe sites, and thus leads to line broadening (Mössbauer spectra). The TMS spectra of the P50 and P70 samples are almost similar, but still different from that of the raw powder. Therefore, the Mössbauer spectra were fitted using two models for the raw powder: (i) a discrete and continuous hyperfine field distribution (HFD); (ii) four magnetic sextets and an HFD; and (iii) several independent sextets for samples P50 (Figure 5b) and P70 (Figure 5c), in addition to a central paramagnetic doublet for P50. The refined values of the hyperfine parameters (hyperfine magnetic field, Bhf, isomer shift, IS, quadrupole shift, , quadrupolar splitting, Δ, line width, Γ and relative area) are shown in Table 4.
The HFD P(B) curve reveals the structural disorder in the initial powder and confirms thus the XRD results. The deconvolution of the P(B) curve with Gaussians shows the presence of four zones related to different Fe environments. According to their hyperfine magnetic fields of about 31.2 T and 27.6 T, the fourth and third zones might be attributed to the Fe-rich FeSi environment. The second zone, which is centered on the hyperfine field of about 24 T, is associated with Fe2B boride, while the first zone, having smaller hyperfine magnetic fields, can be associated with the highly disordered Fe environments.
The presence of several sites (SS1, SS2, SS3, and SS5) related to different local neighboring Fe environments confirms the atomic disorder in the produced samples. The diminution of the hyperfine magnetic field and the positive raise of the isomer shift is related to the increase in silicon sites in the number of nearest-neighbors, and hence to the variation of the charge density and spin density. The isomer shift is proportional to the total s-electron nuclei density, and is very sensitive to the variation of the 3d density near the nucleus, which changes the screening effect of the 3d- on the 3s-electrons. Indeed, the presence of a Si atom near an Fe atom decreases the hyperfine magnetic field by ~2.6 T [37].
The variation of Bhf and IS shows the same trend as that reported for ball-milled Fe-Si powder alloys, where it has been observed that as the Si percentage increases, the internal field diminishes and the isomer shift increases [34]. Moreover, the effects of neighboring Si atoms are independent of each other for the internal magnetic field, while the IS becomes more positive because the number of nn Si sites is increased due to the increase in the d electrons number of Fe atoms. The latter provokes more shielding of the 3s electrons and as a consequence, the charge density at the nucleus diminishes. The SS4 sextet with Bhf = 23.4 T can be related to the Fe2B boride phase, which contains a little more than half of the iron atoms (51–54%). The densities of both the 3d and 4s orbitals will change when the structure evolves from pure iron to an interstitial compound. The nn B interstitial atoms decrease the hyperfine field by about 3 T [33] and increase the IS by about 0.07 mm/s [33]. In the Fe2B structure, an iron atom has 4 nn B atoms at 2.18 Å and 11 nn Fe atoms between 2.41 and 2.72 Å. B atoms are placed interstitially in the close-packed lattice of Fe atoms and the effect of B on the Fe atoms should be short-range. According to the donor model, B donates about 2.8 electrons to the d-band of Fe in Fe2B [34]. Furthermore, in the Fe-rich interstitial compounds [36] the averages of both the hyperfine magnetic field and the magnetic moment are related to each other. Furthermore, the end result of the laser power on the local structure is confirmed by the shift of both the average hyperfine magnetic field, <Bhf>, and the average isomer shift, <IS>. While <Bhf> increases from 24.7 T for the raw powder to 25.4 T, and to 26.7 T for the P50 and P70 samples, respectively, <IS> decreases from 0.11 mm/s for the raw powder and P50, to 0.09 mm/s for P70. Comparable values of Bhf = 27 T and IS = 0.10 mm/s were obtained in the mechanically alloyed sample containing 18.1 at.% Si [34].

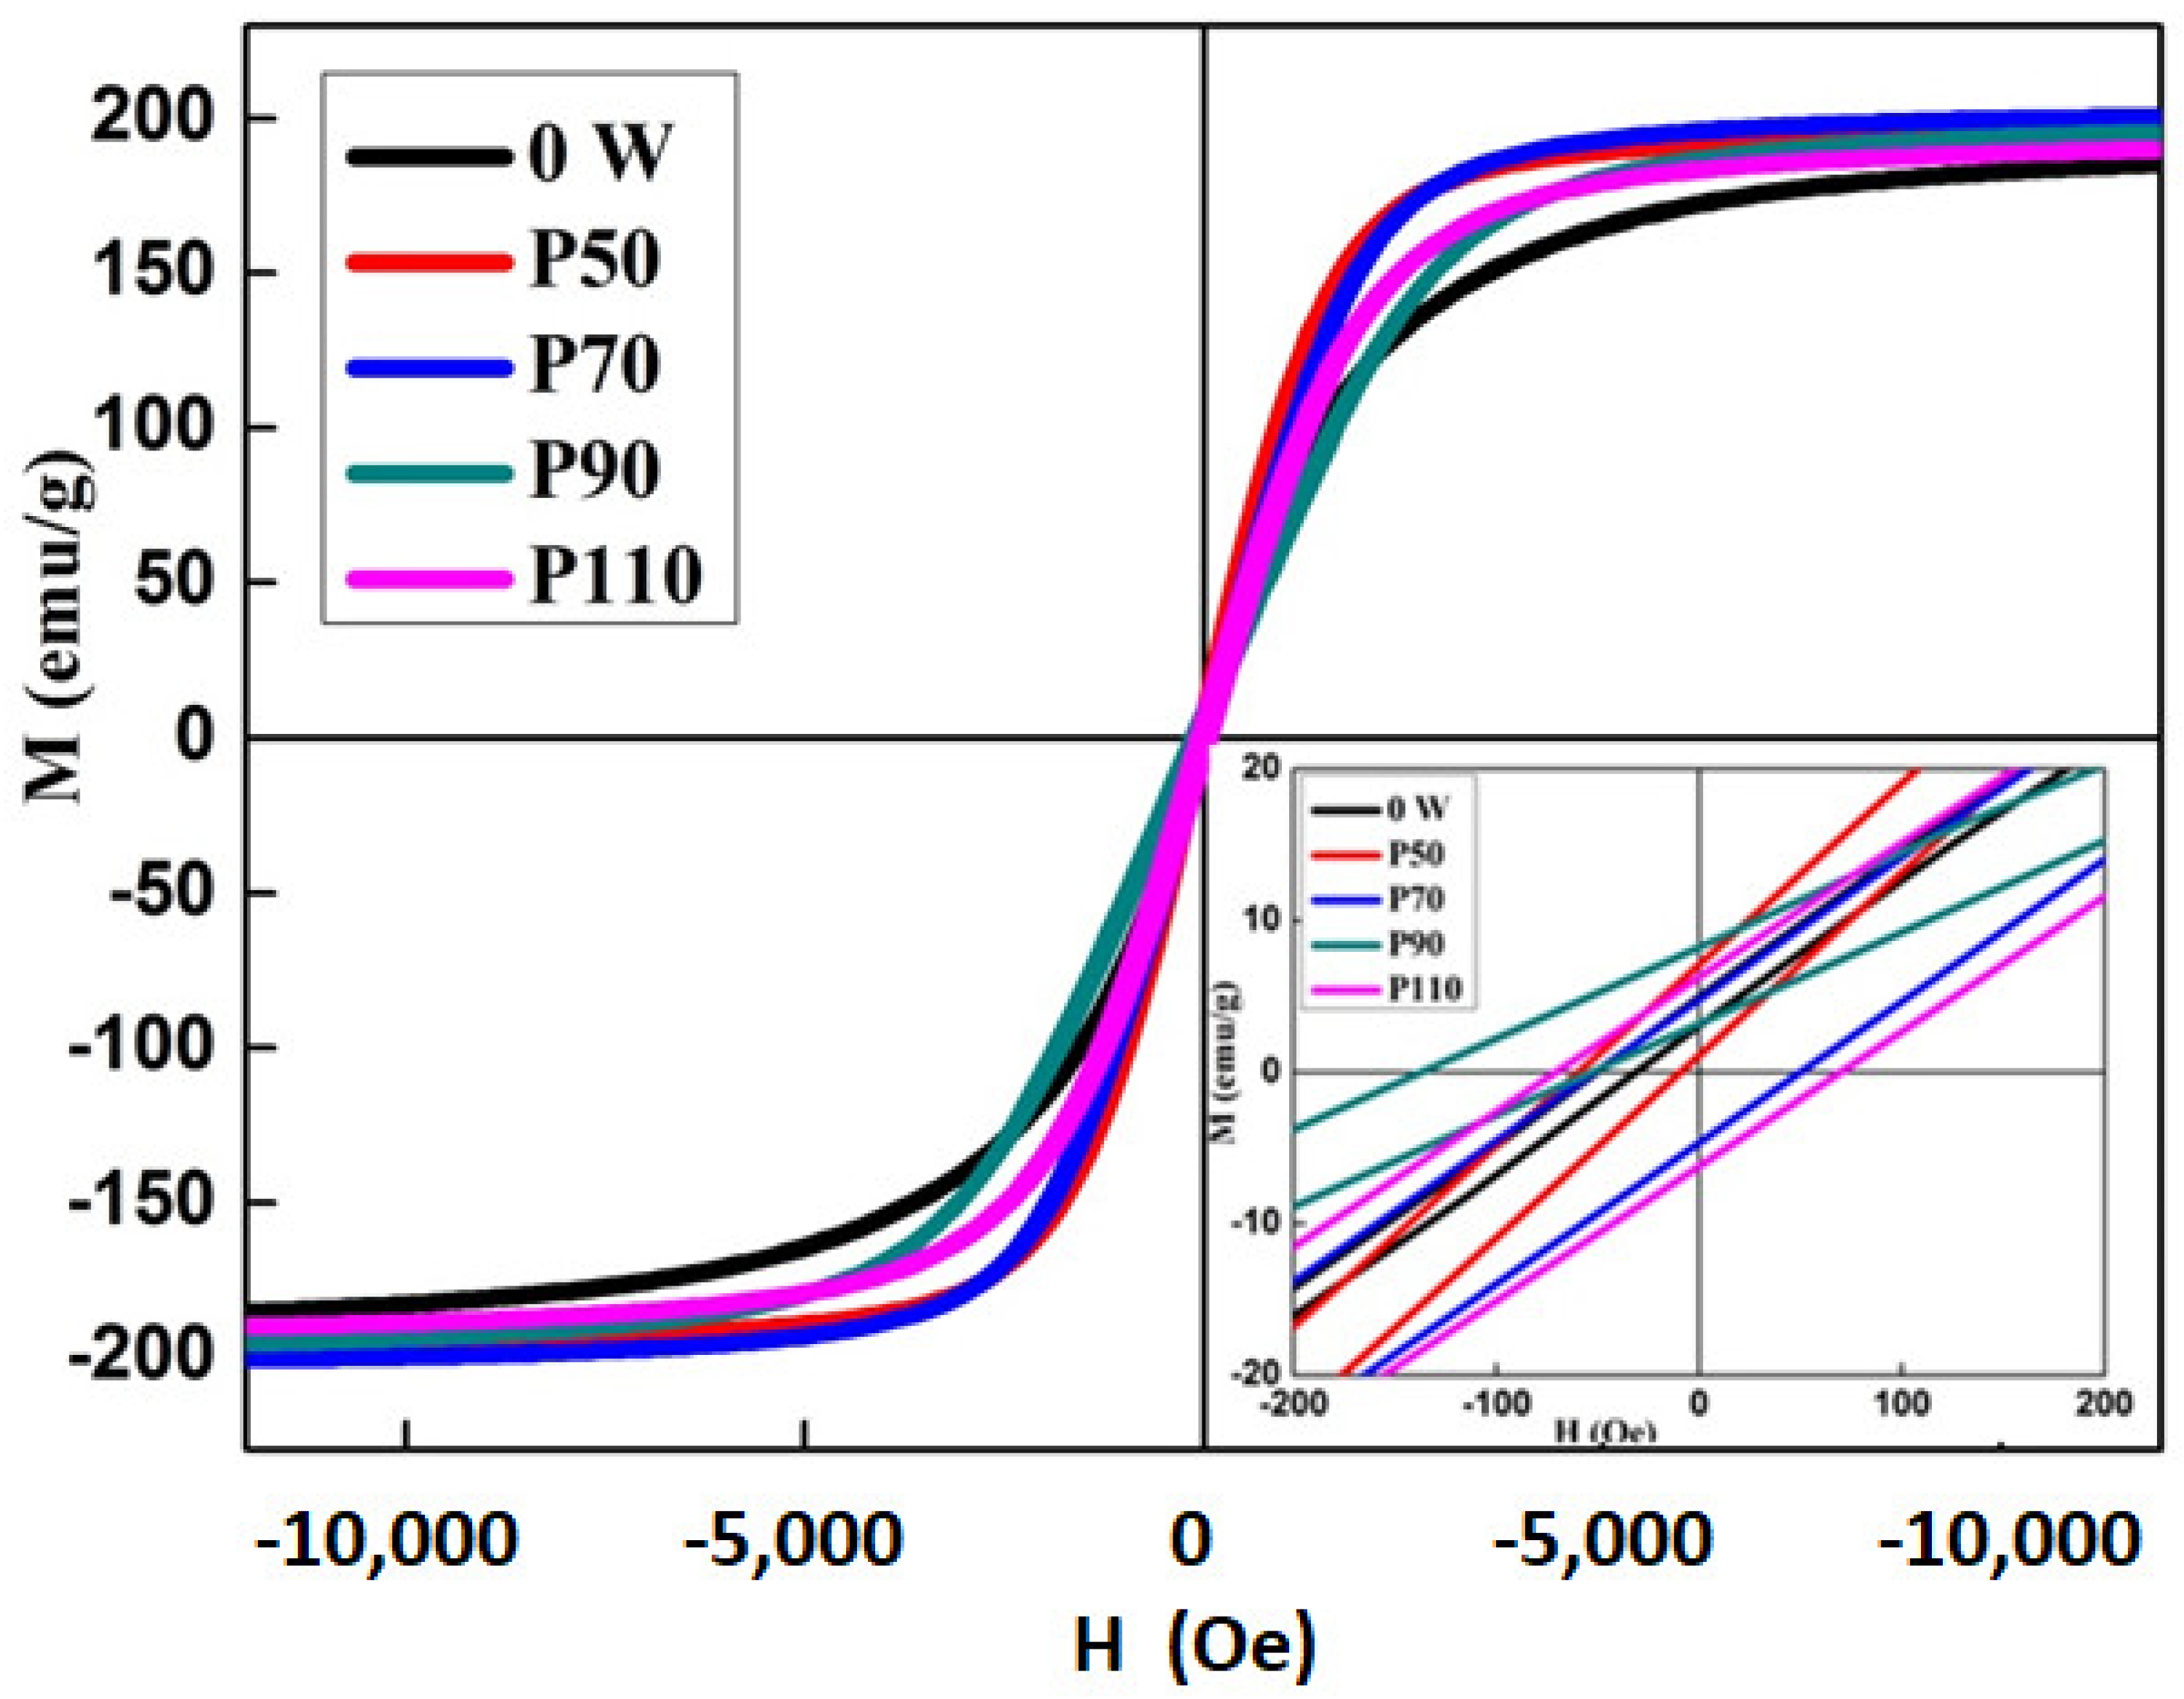
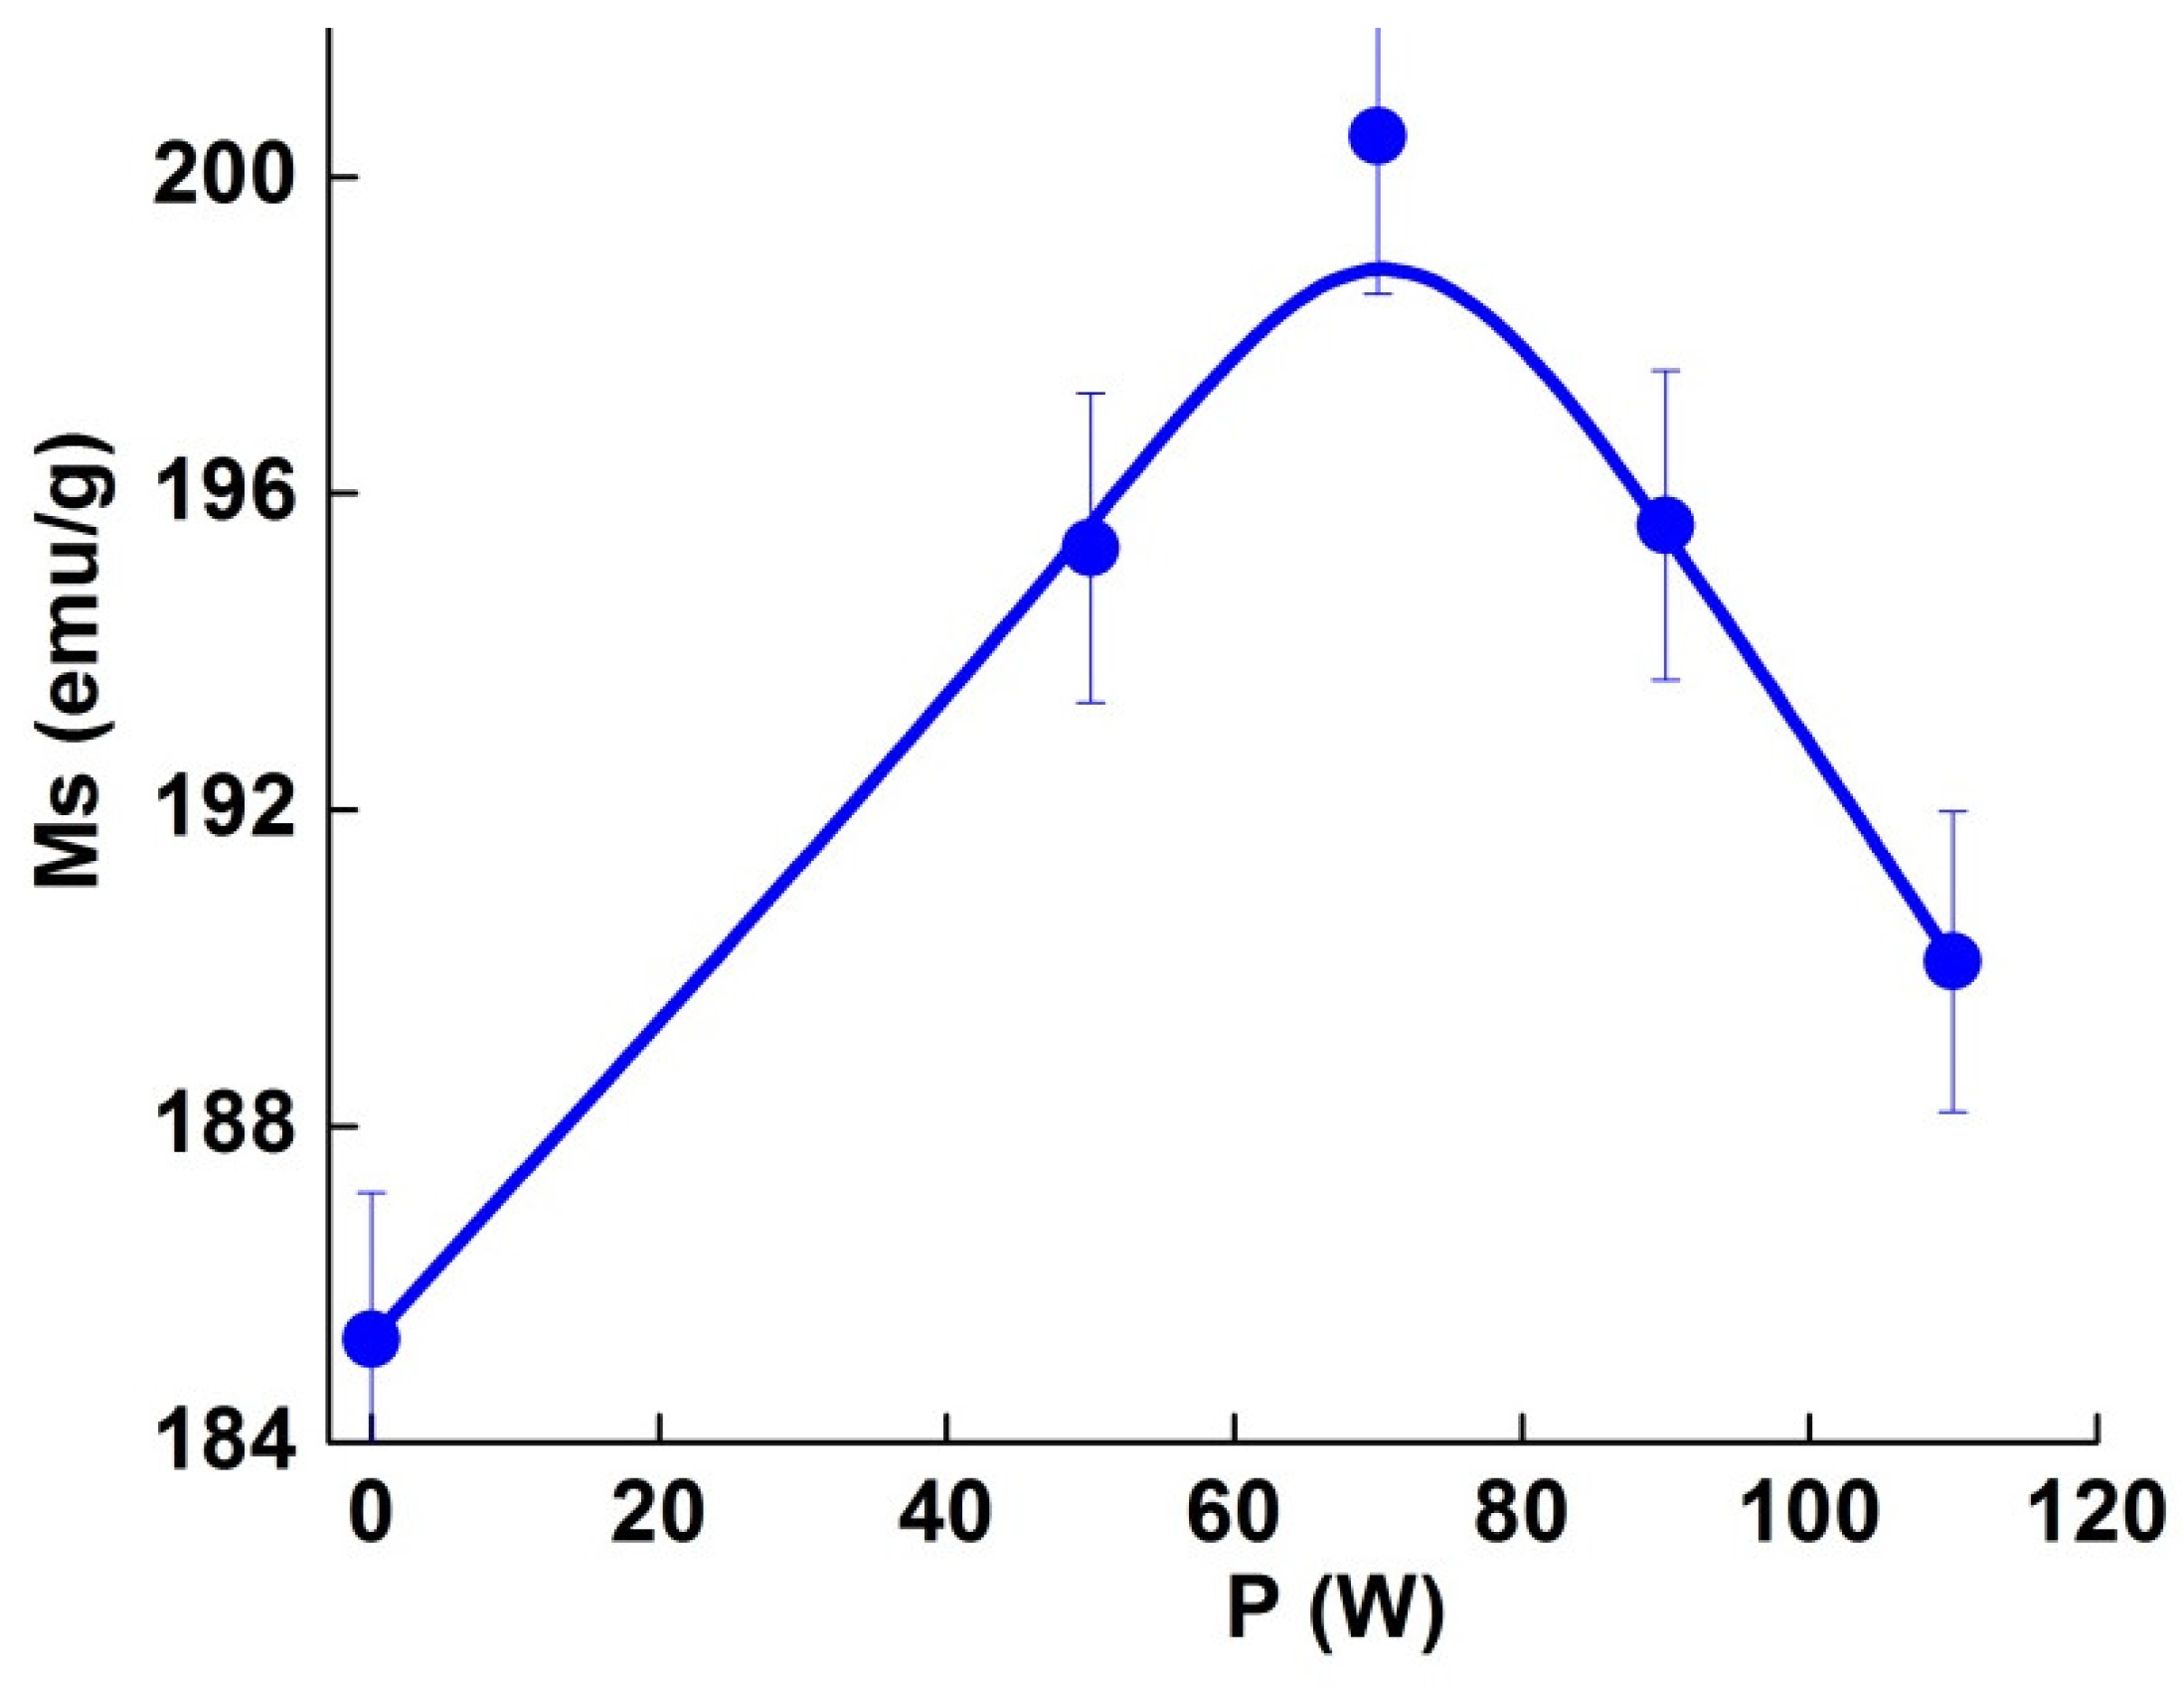
3.3. Magnetic Properties

The hysteretic loops of the raw powder and selectively laser melted specimens versus the laser power are compared in Figure 6. The low magnetic field region of the magnetization curve is shown in the inset. The hysteresis loops exhibit a sigmoidal and slender shape with high magnetization and low coercivity, indicating the soft magnetic behavior of the produced specimens. Usually, both the rapid increase and fast saturation of magnetization for a small applied magnetic field is related to the domain’s wall movement.
The effect of the laser power on the variation of saturation magnetization (Ms) is shown in Figure 7. The M(H) curves of the P50 and P90 samples display a positive vertical shift and a negative horizontal shift. The former might be ascribed to strong antiferromagnetic (AFM) interactions and/or to the short-range AFM magnetic coupling in the Si-rich zones due to the fast solidification that leads to structural heterogeneities, and the latter can be linked to an exchange bias (EB), such as behavior at room temperature. The slight changes in the magnetization behavior compared to the initial powder can be related to the local fluctuation in the composition of the material components. The magnetization dependency of the magnetic moment is in a linear way on the one hand, and in the non-ordered zone the magnetic moment is due to the Fe atoms and is constant and equal to that of pure iron, on the other hand. The improvement of the Ms can be related to the important fraction of iron silicide. This result is coherent with the fact that in the Fe-Si system, the best magnetic properties were obtained with a Si content around 6.5 wt.% due to the low magnetostriction and suppression of magnetocrystalline anisotropy [37]. The selectively laser melted specimens show higher magnetization values than FeSiB coatings, elaborated using powder of the same composition [16].
The horizontal shift of the M(H) curves can be related to the development of a magnetically non-homogeneous antiferromagnetic (AFM)/ferromagnetic (FM) matrix, resulting from the pinning effect at the interface between the soft and hard magnetic substances. Therefore, the EB effect can be ascribed to an FM unidirectional anisotropy (texture) developed at the interface between different magnetic phases (intergranular coupling) upon the fast solidification process during the SLM process. The exchange bias (HE = −(H1 + H2)/2) is about 33.9 Oe, 94.4 Oe and 40.6 Oe for P70, P110 and the raw powders, respectively. The coercive fields (Hc = (|H1 − H2|)/2) are of about 50.5 Oe and 70.3 Oe for the P70 and P110 samples, respectively. The coercivity of the P70 and P110 samples is about 50.5 Oe and 70.3 Oe, respectively. The increase in Hc is related to the presence of structural defects, in addition to the Fe2B boride (which could obstruct the domain wall motion). Moreover, the increase in Hc should be attributed to shape anisotropy (due to the non-spherical shape of particles and/or surface irregularities). The saturation to remanence magnetization ratio, Mr/Ms, is a useful marker of the domain state. Consequently, the produced samples are multidomain because the Mr/Ms < 0.04.

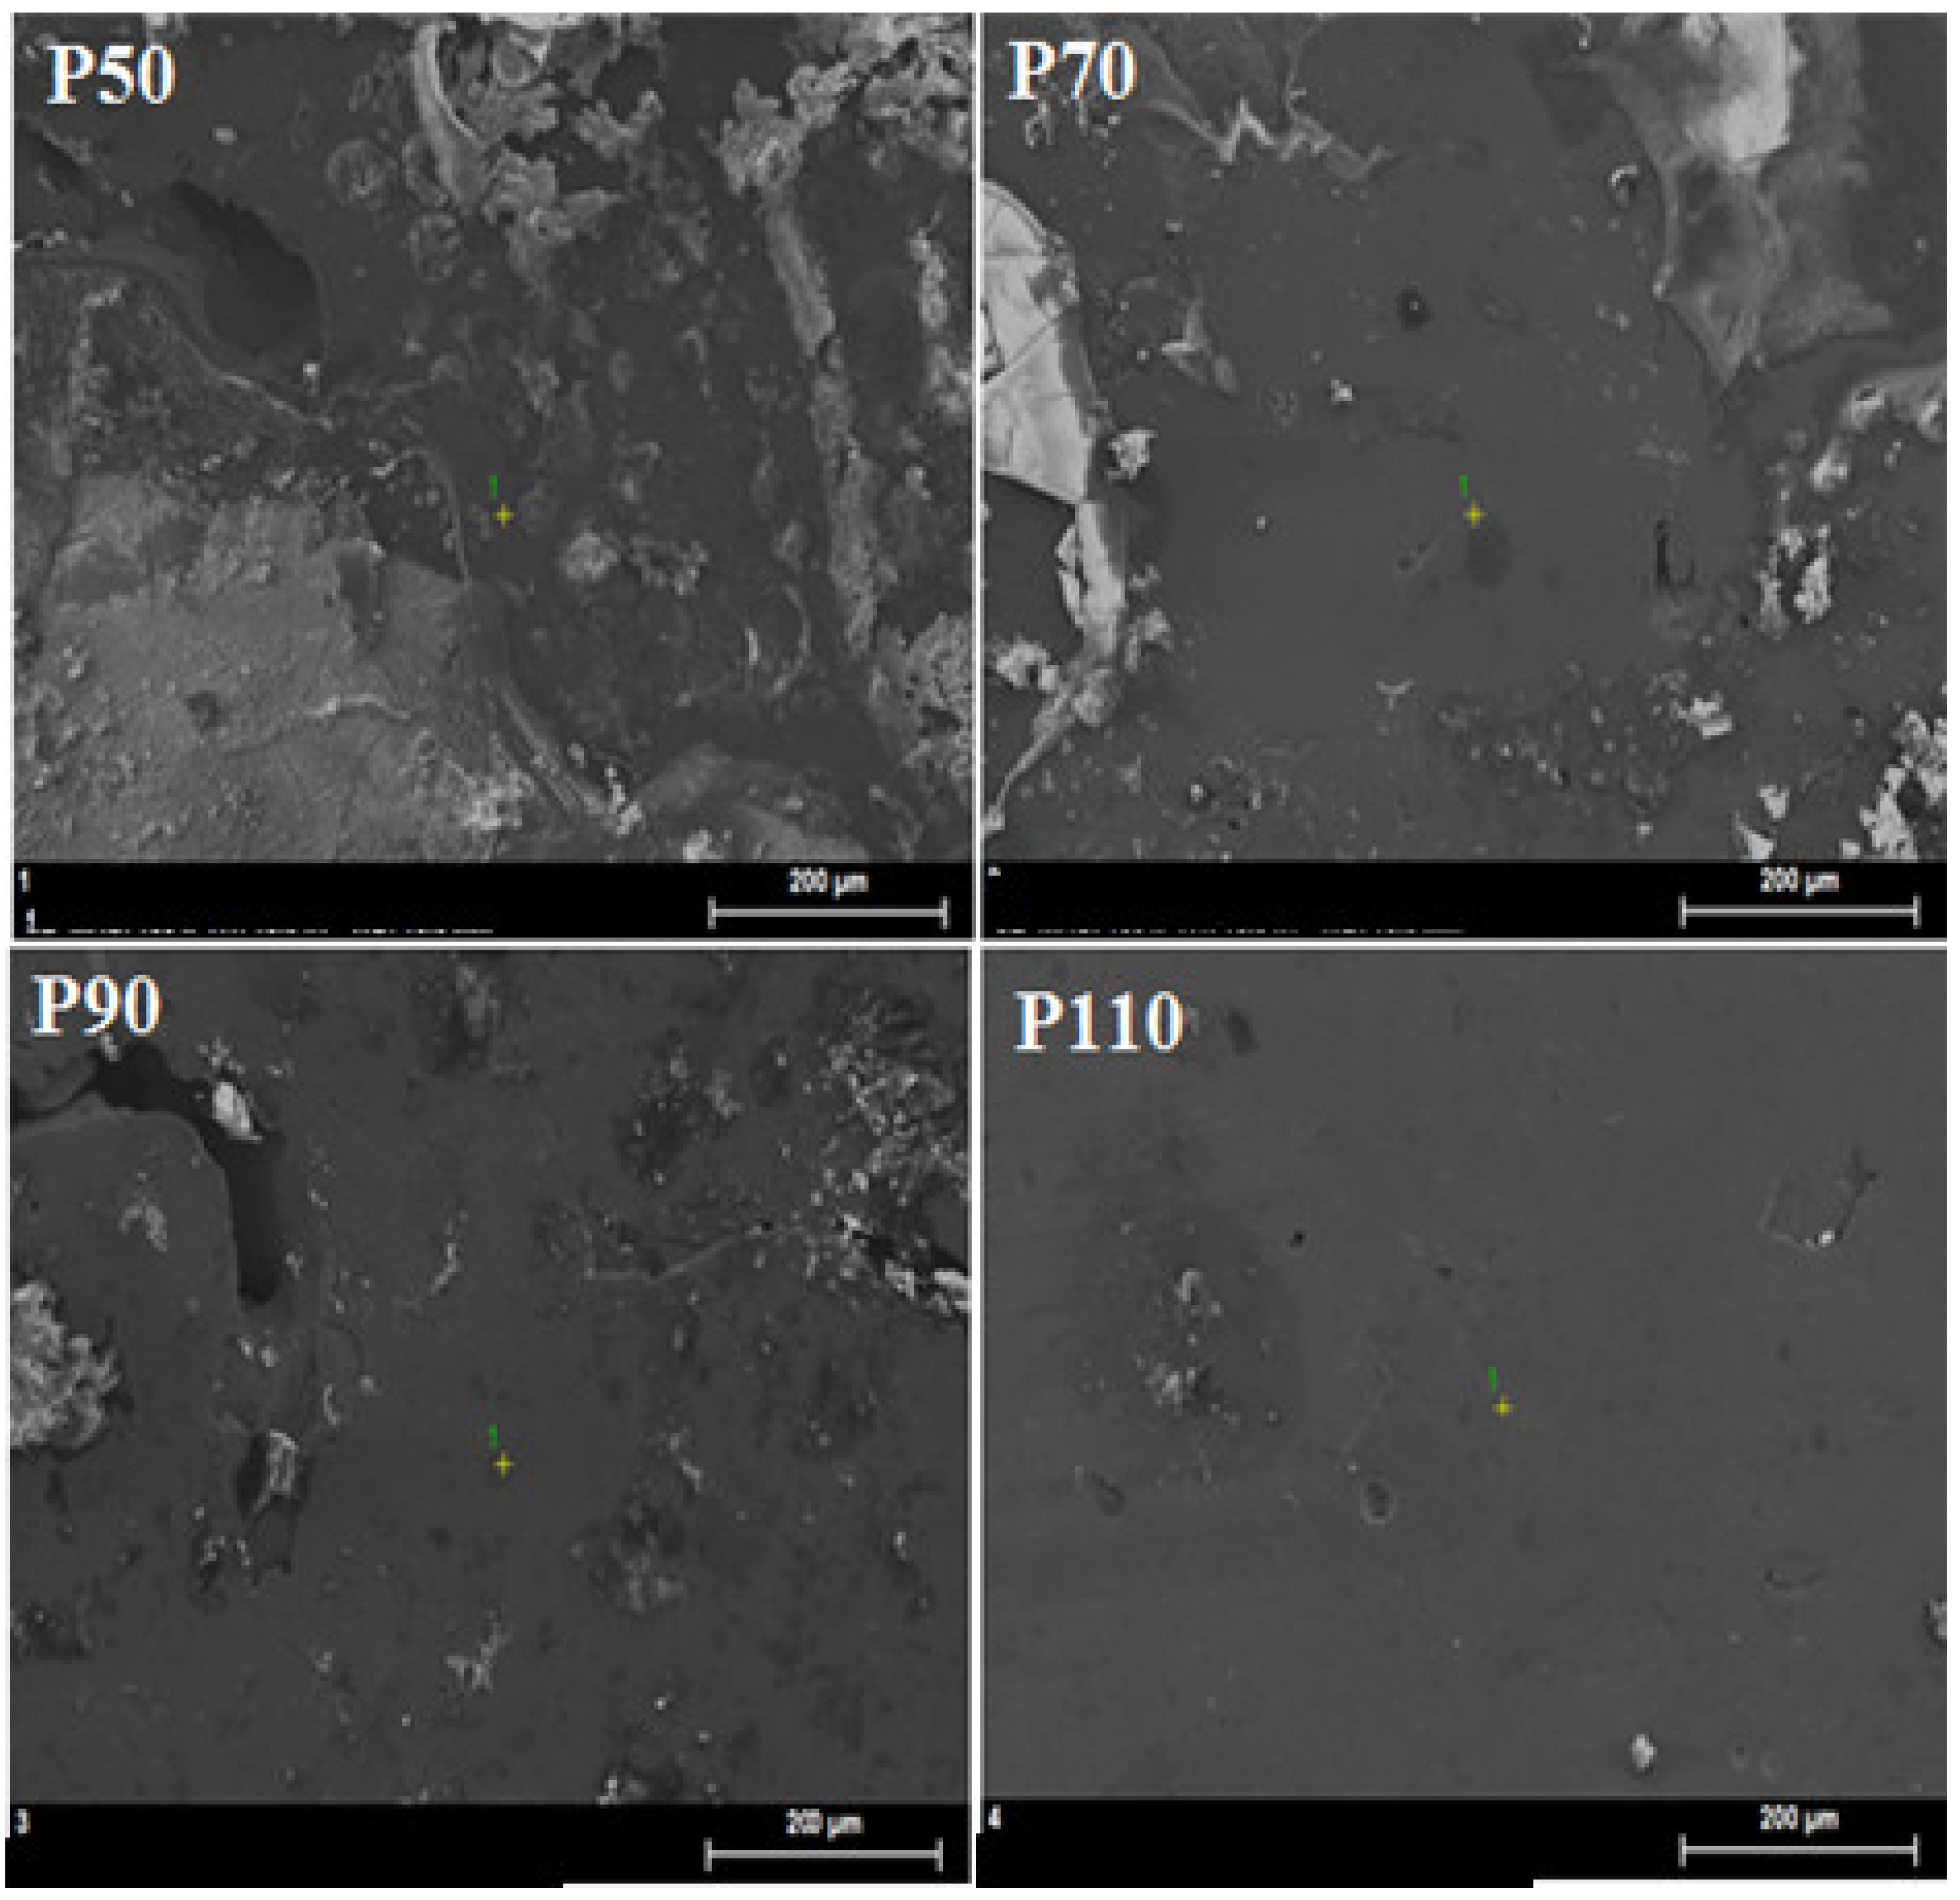
3.4. Morphology Changes

Figure 8 illustrates the influence of laser power on the top-surface morphology of the samples. A non-homogeneous microstructure with unmelted particles and some pores is observed in the P50, P70 and P90 samples. Several balls and splashed particles with narrow and deep cracks have been detected on the surface of the laser-melted tracks. The smooth and dense surface of the P110 sample (without high pores) can be ascribed to the complete melting of the initial powders. Thus, sample P110 has better printing conditions. The presence of a few narrow and deep cracks can be related to metallurgical bonding [38]. The surface morphology of the fabricated samples is denser than that of the coating deposited by the APS from the same raw powders [16]. The measured density of the laser melted samples with the Archimedes method is about 98.5–98.7%. These values are associated with a small presence of porosity, partially melted tracks, etc.
The EDX analysis (Table 5) reveals that the elemental percentage of the P50 sample is almost comparable to the percentage of the initial powder. Moreover, when the laser power increases from 70 to 110 W, the Si content shows a small variation (5.58–4.90 at.%), while the amount of B increases and the Fe content decreases. This behavior might be related to the fact that since Fe2B is stable up to 1400 °C, the intensification of the effective laser power (P/v) could increase the probability of its decomposition (Fe2B→2Fe + B) leading to more Fe and B in the melt, and thus to the reaction of Fe with Si to form Fe-rich and/or Si-rich silicide. Such an assumption agrees well with the XRD results, where the Fe2B percentage decreases compared to that of the feedstock powder. Therefore, the fluctuation in the elemental composition reflects the heterogeneity of the prepared samples, which might be related to the rapid non-equilibrium solidification, as well as the microstructural evolution, which takes place in the laser melt during solidification.

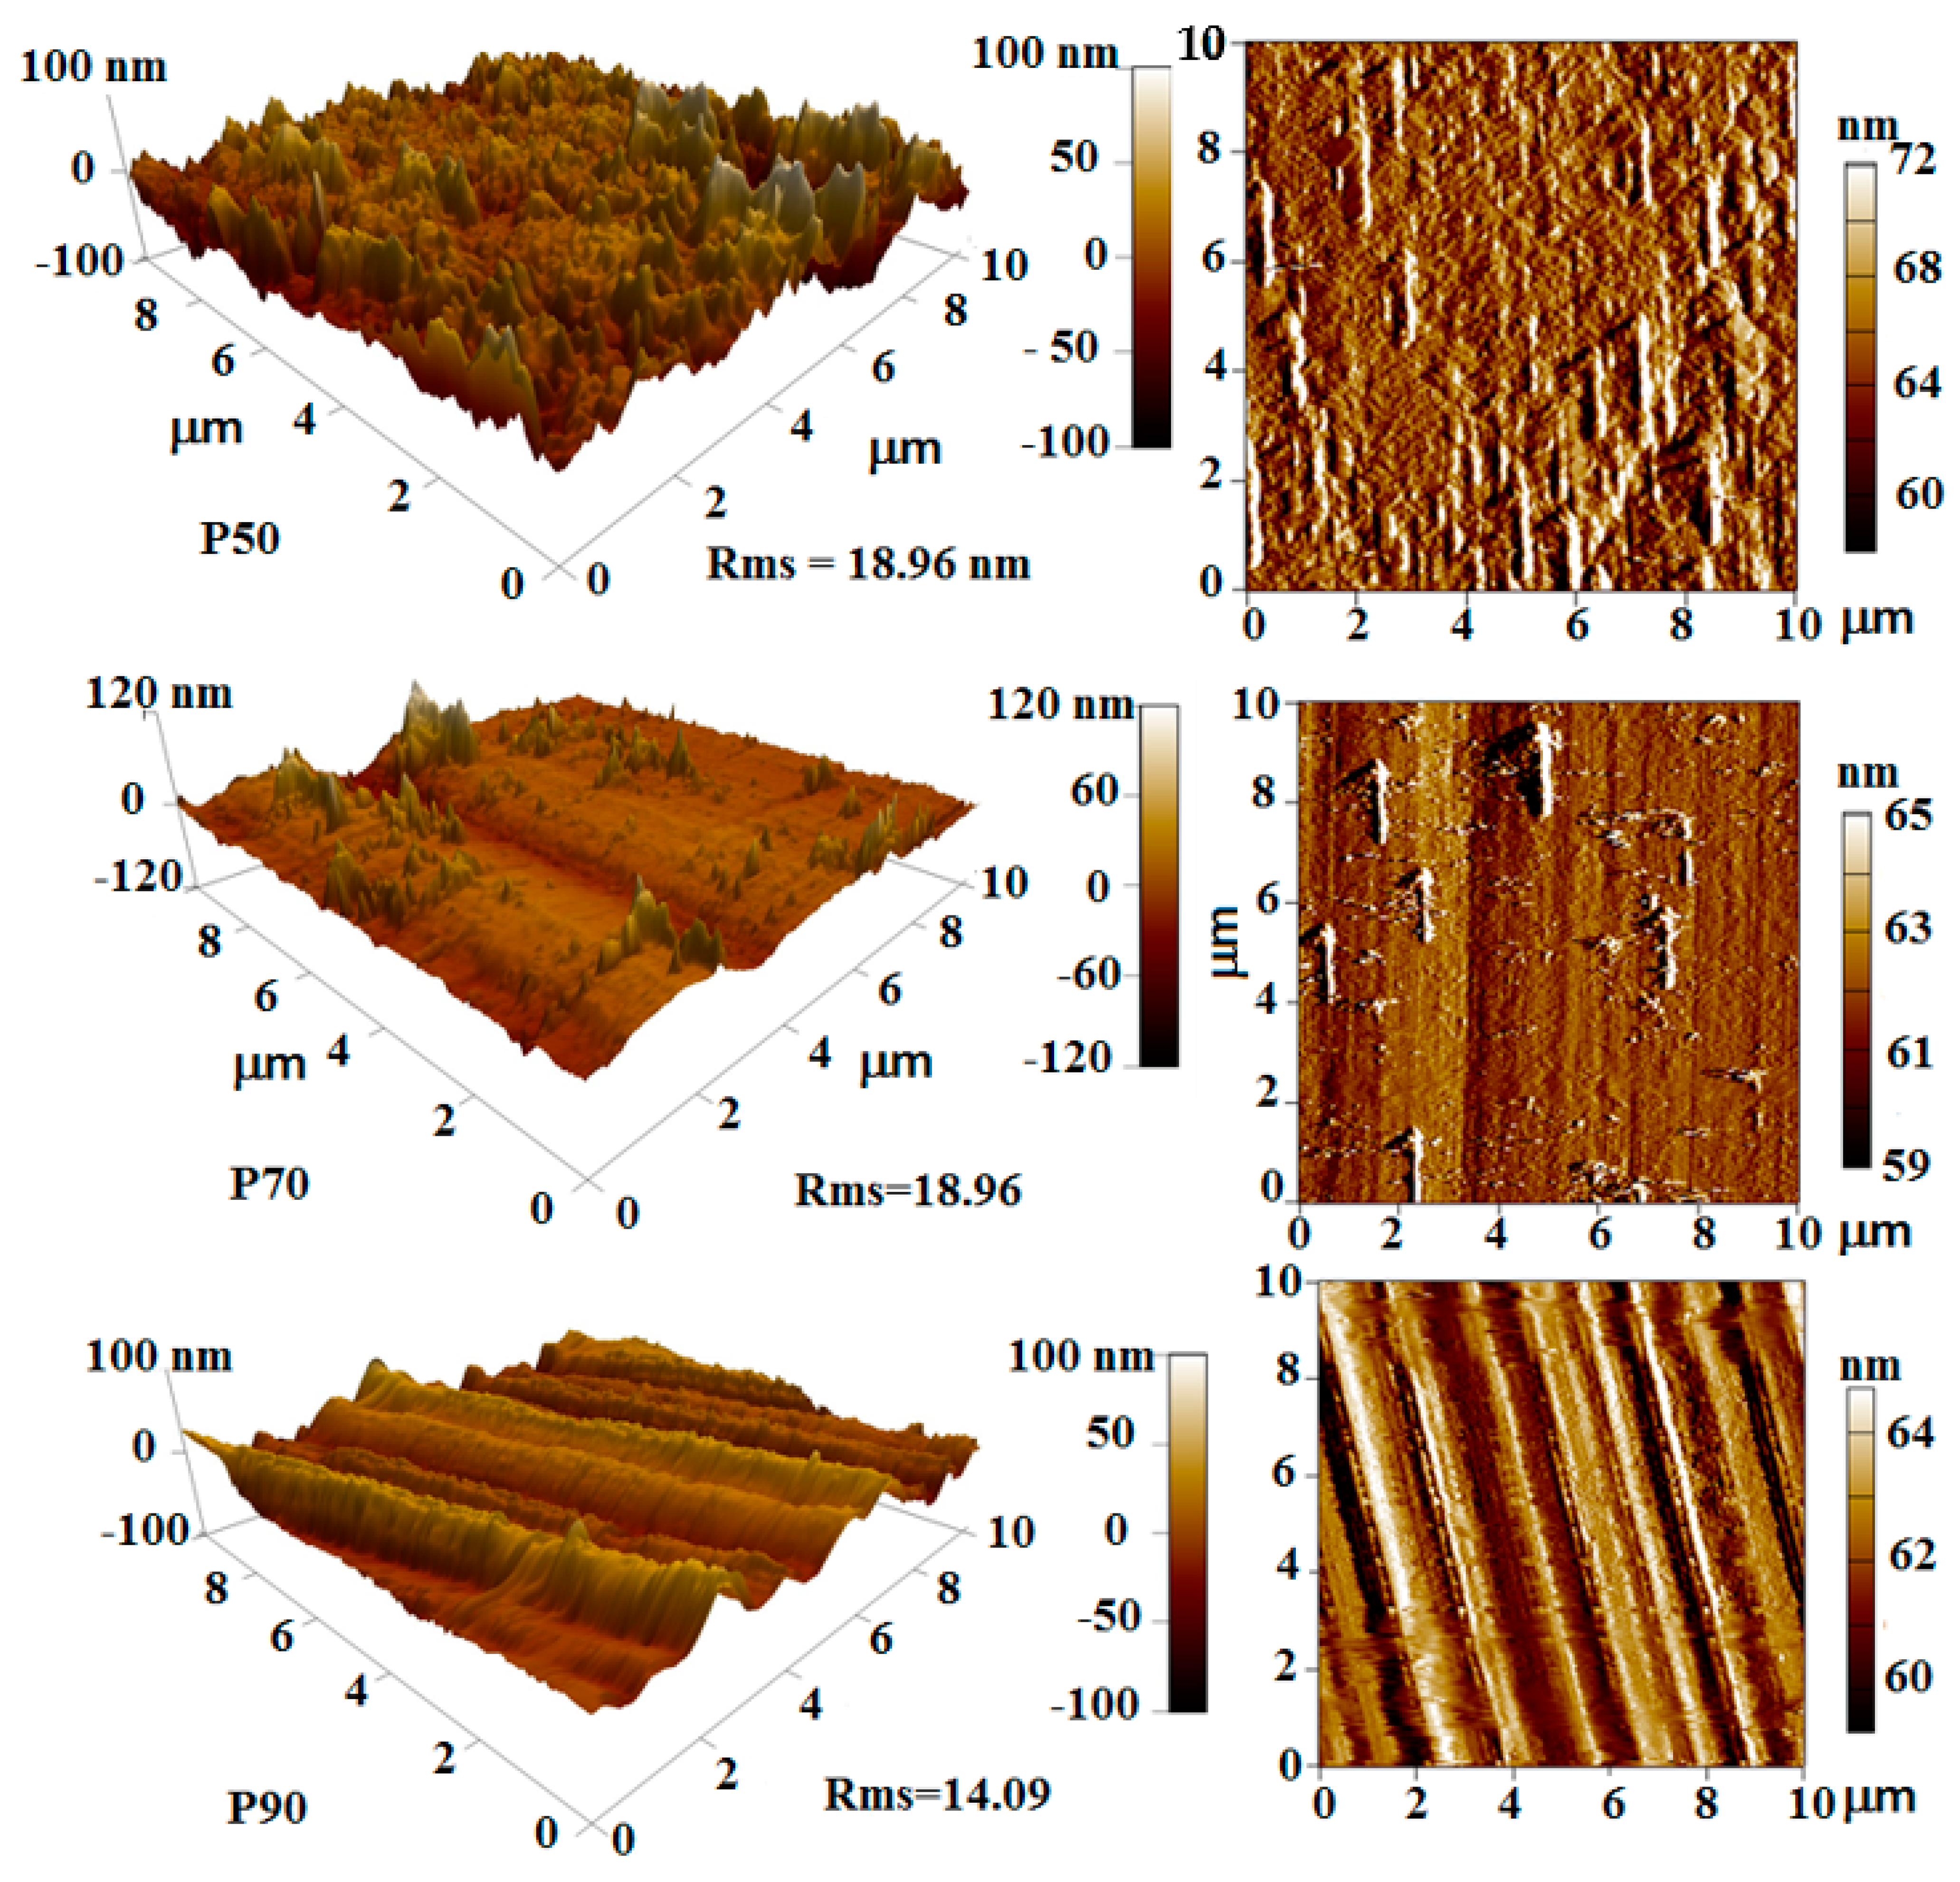
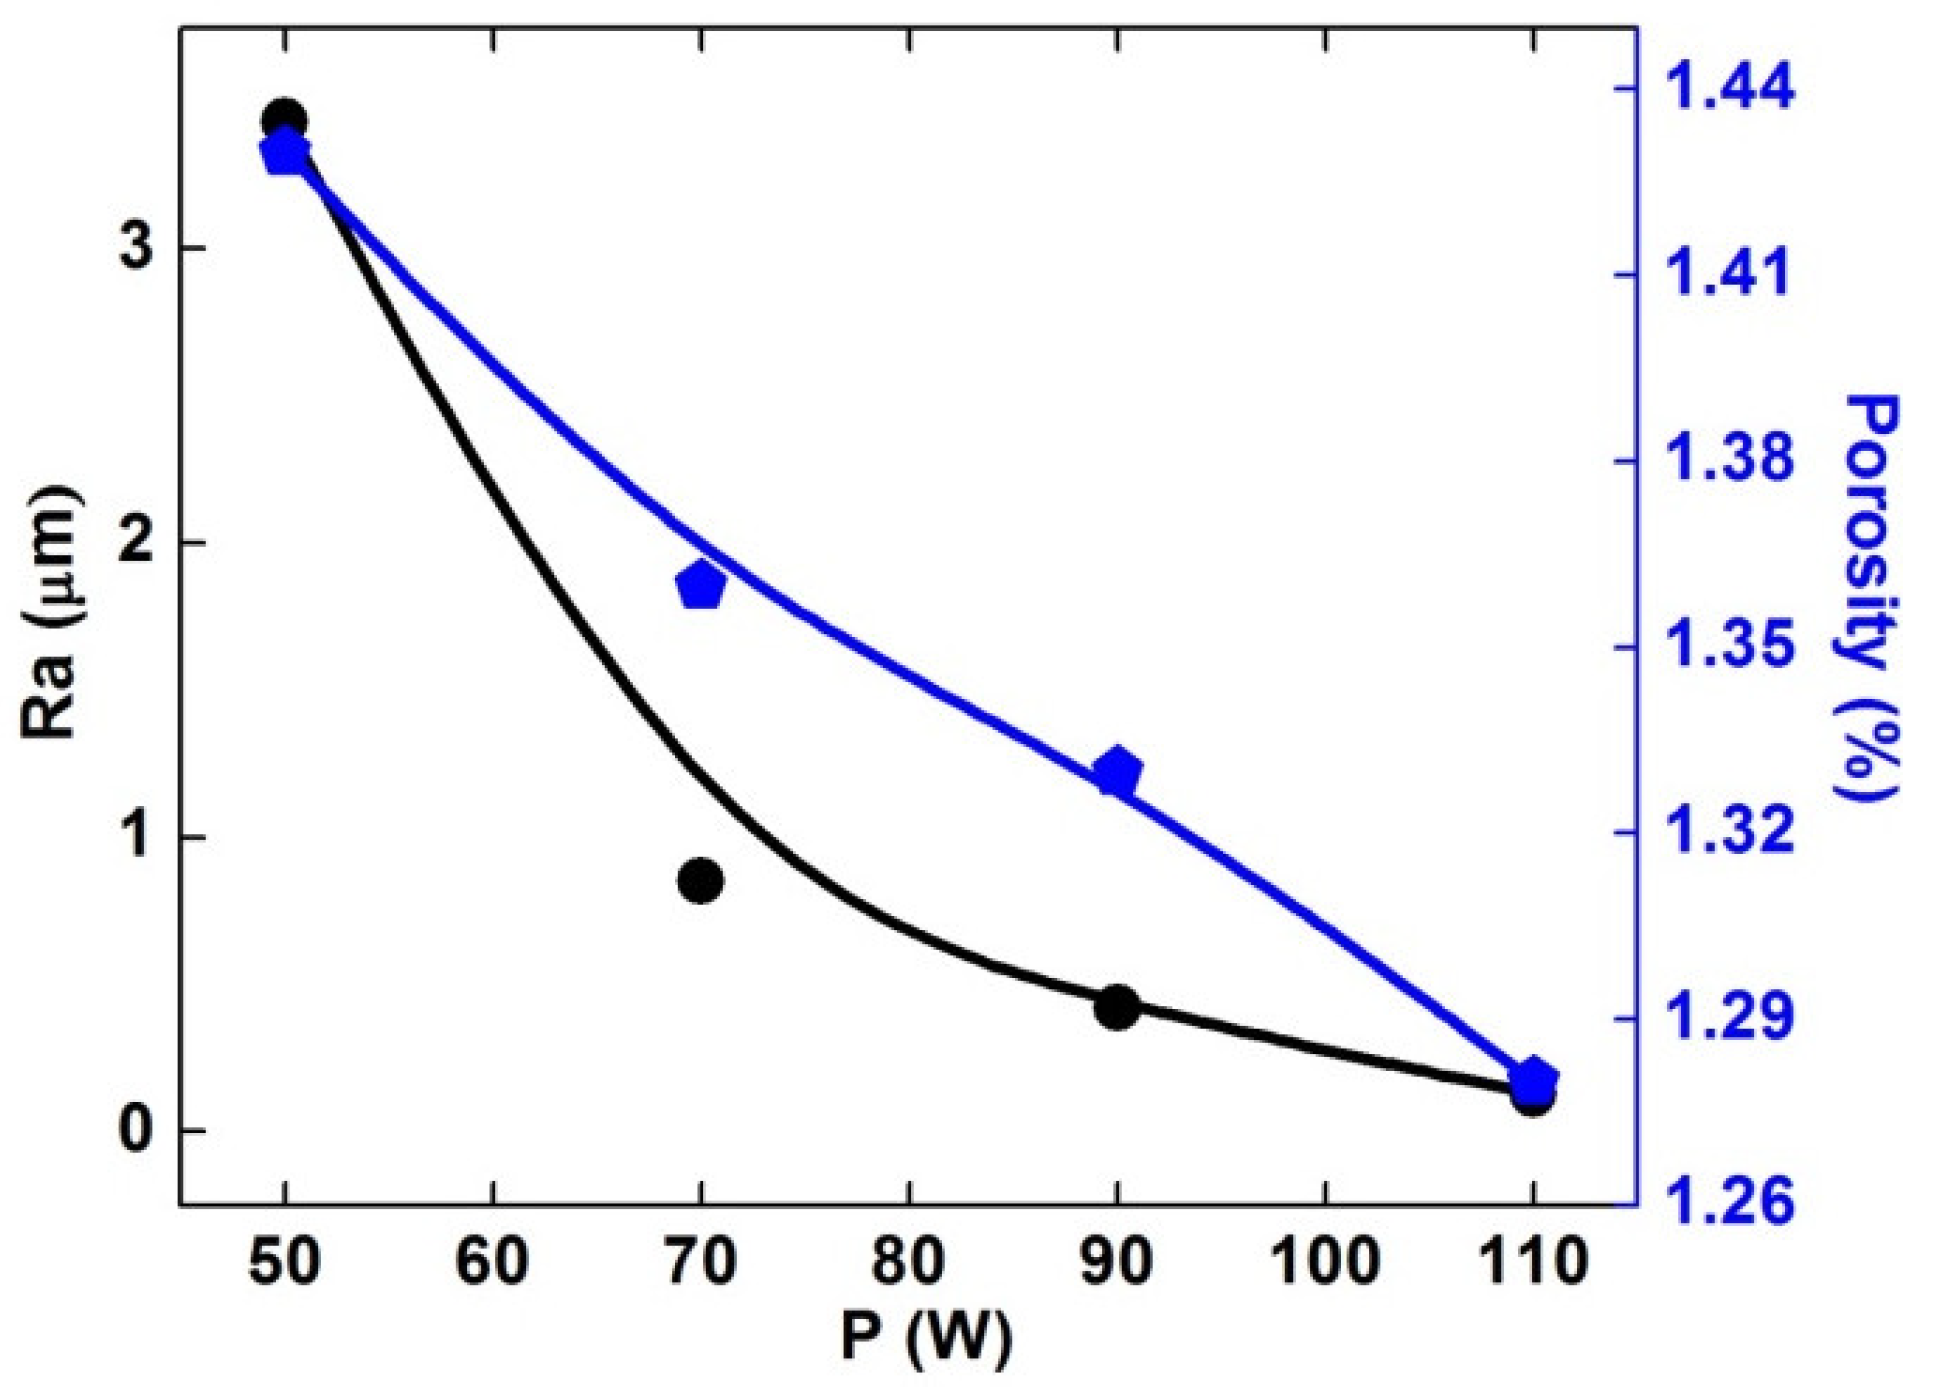
3.5. Surface Roughness
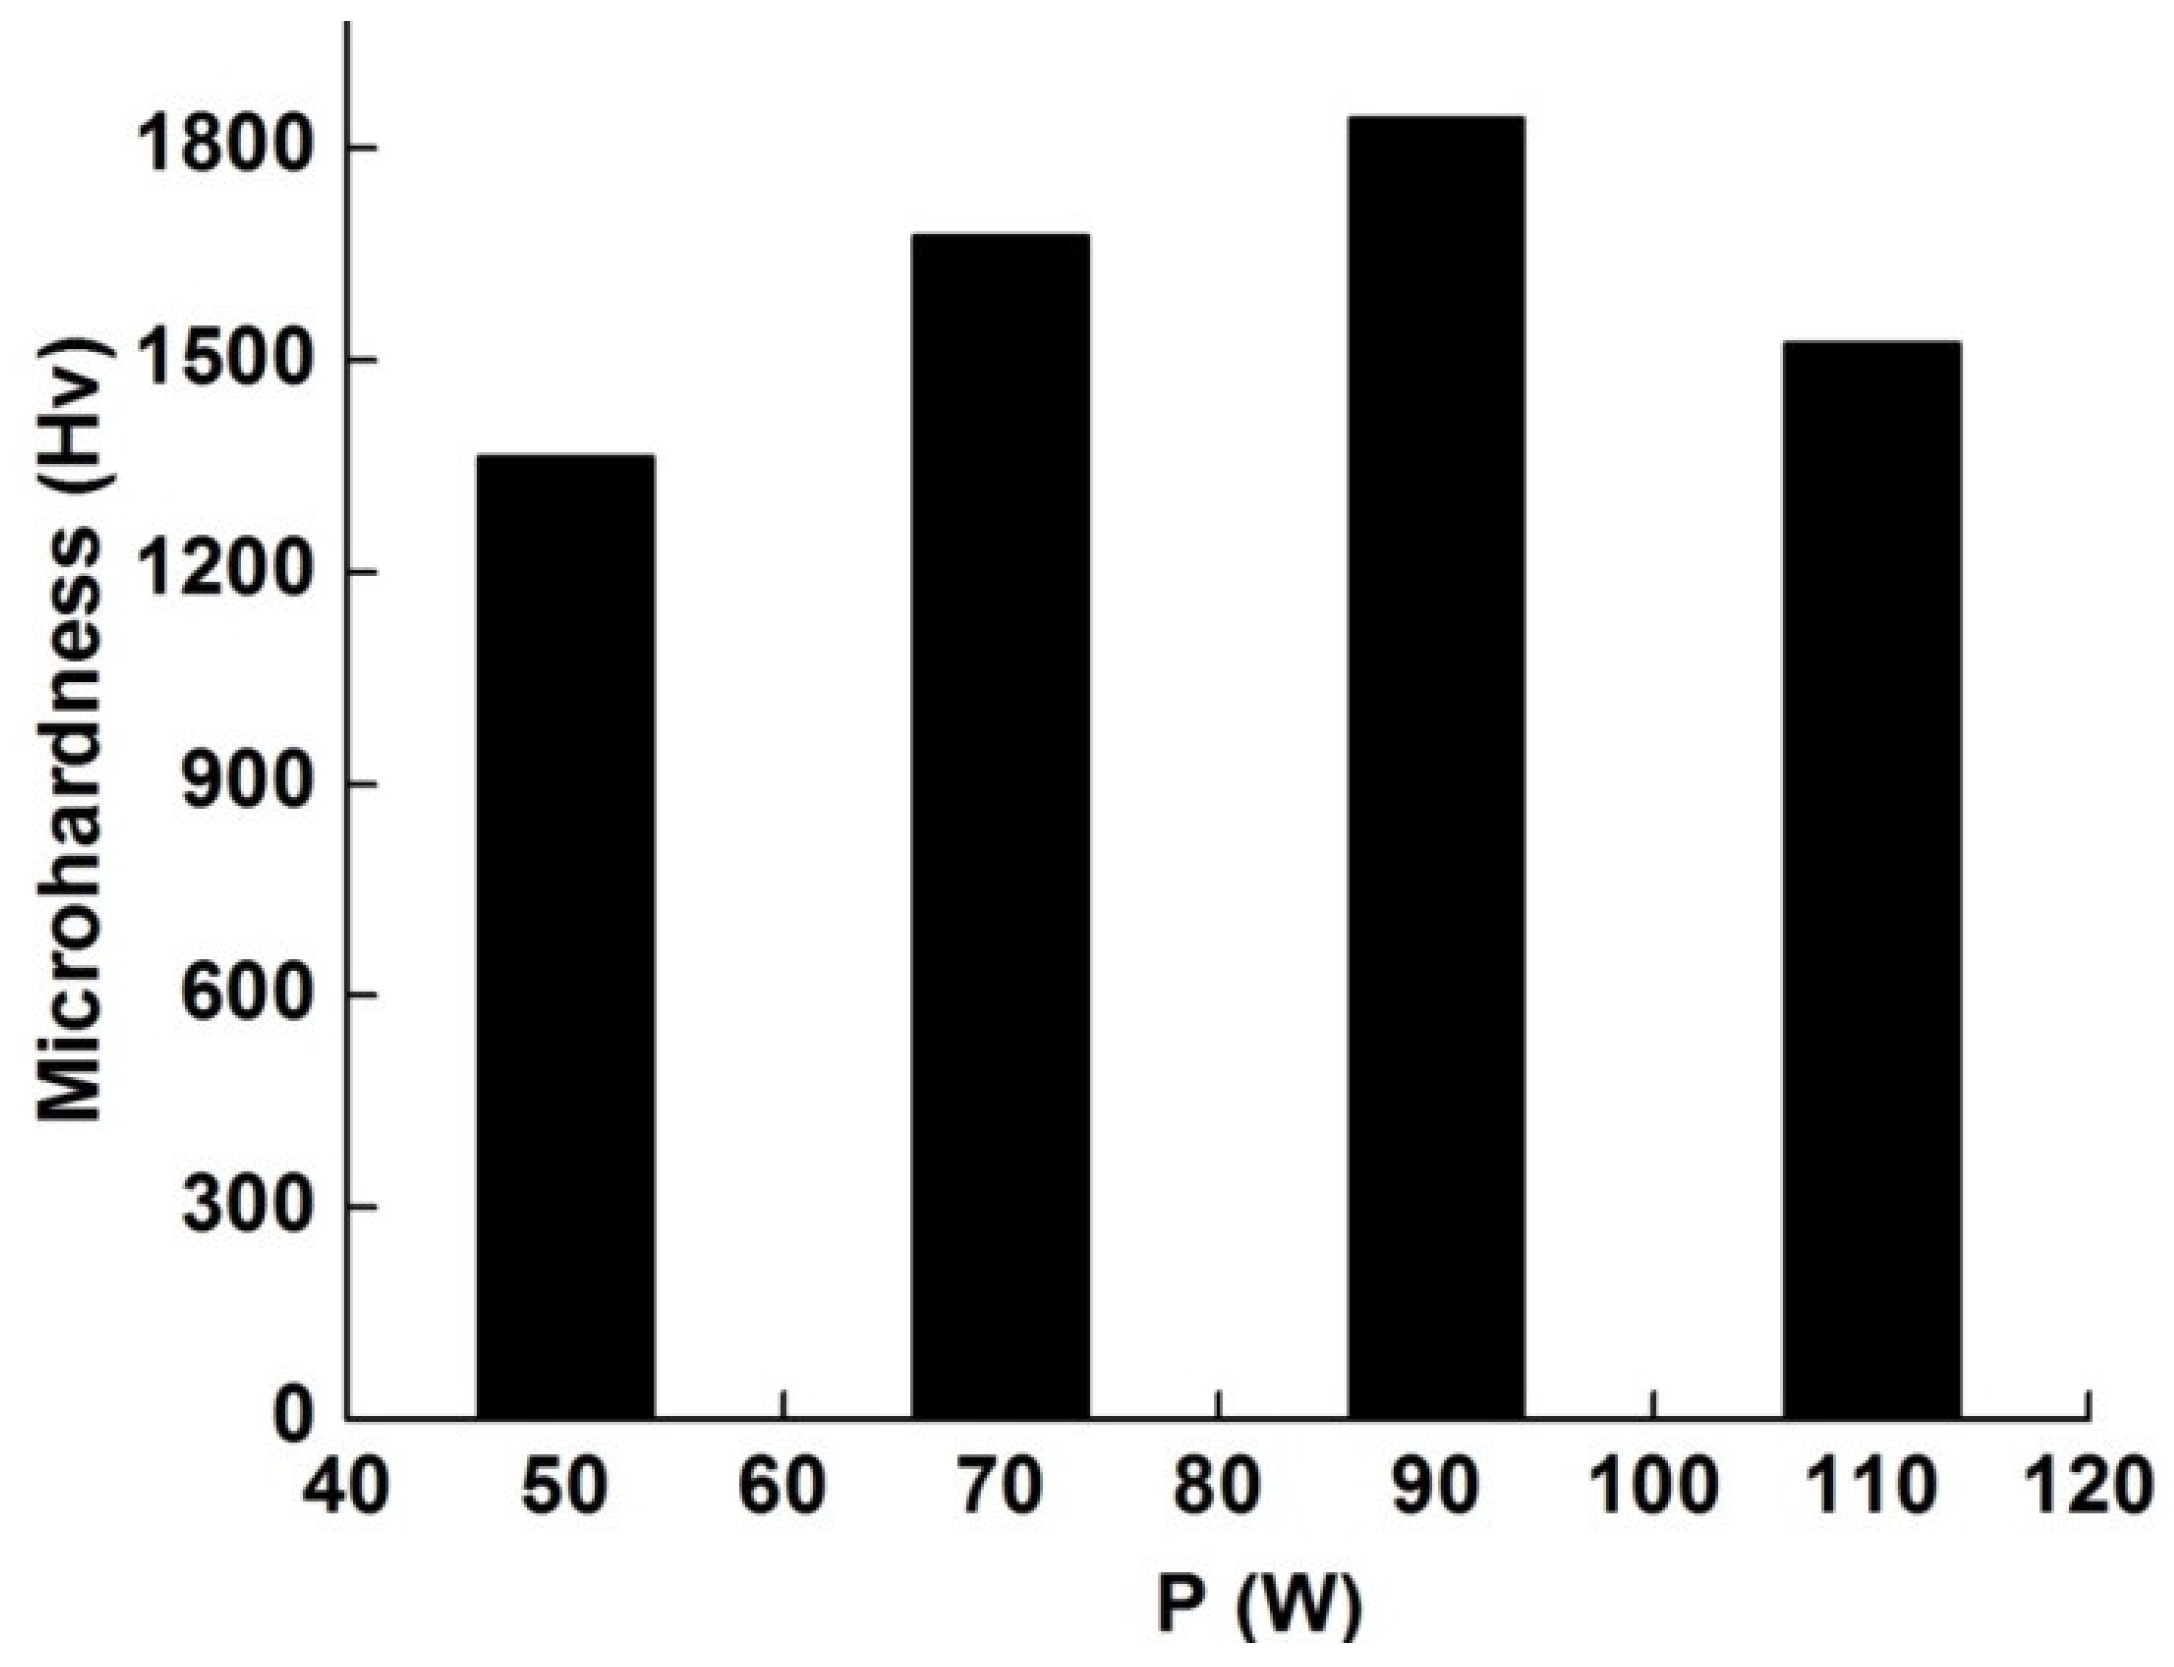
The surface roughness of the prepared samples was followed by atomic force microscopy (AFM) (Figure 9) and profilometry (not shown here). The AFM gives the root-mean-square surface roughness (Rq or Rms) of the height variation detected by the mean image data plane, and the profilometer gives the arithmetic average surface roughness or waviness (Ra) of the absolute value of the surface height change measured from the mean plane. The AFM surface morphology shows that the overall shape has in-homogeneities, and changes with the laser power. As can be seen in the 3D images, the P50 structure has a relatively larger agglomeration with coarse particles if a comparison is performed between P70 and P90. The Rms roughness of the P90 sample is slightly smaller (Rms = 14.09 nm) than those of the P50 and P70 samples (Rms = 18.964 nm). The decrease in roughness from 3.42 μm to 0.12 μm, when the laser power increases from 50 W to 110 W, respectively, can be associated with the reduction in the porosity percentage (Figure 10). This latter point can be due to the fact that the detected individual tracks show a good metallurgical bonding between them as the energy density provided during the SLM process increases. The differences between Ra and Rms values can be associated to the high-resolution measurement of superficial roughness by each method.

3.6. Microhardness

Microhardness is an important mechanical property that is strongly correlated to the material’s structure and microstructure. The structural hardening can be affected by the distribution and behavior of the formed precipitates. The produced samples display higher microhardness values with a maximum of about 1843 ± 28 Hv for the P90 sample (Figure 11). The increase in microhardness can be correlated to the increase in densification, and the decrease in porosity and roughness. Furthermore, the increase in microhardness is related to the crystallite size diminution. The increase in microhardness results from the microstructure uniformity and the intrinsic high hardness of the nanostructures [38]. Comparable values of the microhardness have been obtained in FeSiB-based coatings obtained by the one-step laser cladding method [39], laser melting [40], high-power laser deposition [40,41] and laser irradiation [42]. However, the microhardness of the selectively laser melted samples is three to four times higher than those of the deposited FeSiB coatings by plasma spray and dry-ice blasting from the same feedstock powders [16]. Furthermore, the microhardness values are higher than the measured values in FeSiB coatings deposited by HVOF from powders produced by mechanical alloying [15].

4. Conclusions

Fe92.4Si3.1B4.5 specimens were produced by the SLM method by varying the laser power at a constant laser scanning speed of 0.4 m/s. The obtained results are summarized as follows:
-
A disordered α-FeSi type phase was induced by SLM technology.
-
The α-Fe0.95Si0.05 and Fe2B boride phases were preserved from the feedstock powder with small variations in the lattice parameters.
-
The crystallite size of both α-Fe0.95Si0.05 and Fe2B boride decreased with increasing laser power.
-
The Mössbauer spectrometry results confirmed the presence of Fe2B and a disordered FeSi-type structure.
-
Almost completely dense samples could be obtained and their roughness and porosity decreased with increasing laser power.
-
The selectively laser melted specimens showed high microhardness values (ranged between 1364 and 1843 Hv), and soft magnetic behavior with Ms = 188–201 emu/g. Higher Ms and microhardness values could be obtained for the P90 sample.
-
An EB has been observed in the hysteresis loops of the P50 and P90 samples at room temperature.

Author Contributions

Conceptualization, R.D. and S.A.; methodology, R.D.; validation, S.A., L.E. and N.-E.F.; formal analysis, R.D.; investigation, J.-M.G.; data curation, R.D.; writing—original draft preparation, R.D.; writing—review and editing, S.A. and J.-J.S.; supervision, S.A. and J.-J.S. All authors have read and agreed to the published version of the manuscript.

Funding

This research was partially supported by MINECO project PID2020-115215RB-C22.

Data Availability Statement

Data will be requested to the authors.

Acknowledgments

This work was supported by the DGRSDT/Ministère de l’Enseignement Supérieur et de la Recherche Scientifique Algeria.

Conflicts of Interest

The authors declare no conflict of interest.

References

  1. Takahare, Y. Irreversible structural relaxation in FeSiB amorphous alloys. Mater. Sci. Eng. 1997, A231, 128–133. [Google Scholar] [CrossRef]
  2. Yue, S.; Zhang, H.; Cheng, R.; Wang, A.; Dong, Y.; He, A.; Liu, C.T. Magnetic and thermal stabilities of FeSiB eutectic amorphous alloys: Compositional effects. J. Alloys Compds. 2019, 776, 833–838. [Google Scholar] [CrossRef]
  3. Xu, D.D.; Zhou, B.L.; Wang, Q.Q.; Zhou, J.; Yang, W.M.; Yuan, C.C.; Shen, B.L. Effects of Cr addition on thermal stability, soft magnetic properties and corrosion resistance of FeSiB amorphous alloys. Corr. Sci. 2018, 138, 20–27. [Google Scholar] [CrossRef]
  4. Luborsky, F.E.; Becker, J.J.; Walter, J.L.; Liebermann, H.H. Formation and magnetic properties of Fe–B–Si amorphous alloys. IEEE Trans. Magn. 1979, 31, 146–1149. [Google Scholar] [CrossRef]
  5. Inoue, A.; Komuro, M.; Masumoto, T. Fe-Si-B amorphous alloys with high silicon concentration. J. Mater. Sci. 1984, 19, 4125–4132. [Google Scholar] [CrossRef]
  6. Zhang, H.; Mei, X.; Wang, Y.; Wang, Z.; Wang, Y. Resistance to H+ induced irradiation damage in metallic glass Fe80Si7.43B12.57. J. Nuclear Mater. 2015, 456, 344–350. [Google Scholar] [CrossRef]
  7. Zhou, J.; Kong, D. Immersion corrosion and electrochemical performances of laser cladded FeSiB, FeSiBCr and FeSiBCrMo coatings in 3.5 wt% NaCl solution. Surf. Coat. Technol. 2020, 383, 125229. [Google Scholar] [CrossRef]
  8. Tokunaga, T.; Ohtani, H.; Hasebe, M. Thermodynamic evaluation of the phase equilibria and glass-forming ability of the Fe–Si–B system. Calphad 2004, 28, 354–362. [Google Scholar] [CrossRef]
  9. Zeng, C.; Xu, Y.; Liu, R.; Zhao, H.; Zhu, Z.; Jia, Z. Effect of oriented magnetic field on the solidified structure and soft magnetic properties of Fe78Si13B9 alloy. Res. Phys. 2021, 28, 104584. [Google Scholar] [CrossRef]
  10. Alleg, S.; Ibrir, M.; Fenineche, N.E.; Azzaza, S.; Suñol, J.J. Magnetic and structural characterization of the mechanically alloyed Fe75Si15B10 powders. J. Alloys Compds. 2010, 494, 109–115. [Google Scholar] [CrossRef]
  11. Murty, B.S.; Ranganathan, S. Novel materials synthesis by mechanical alloying/milling. Int. Mater. Rev. 1998, 43, 101–141. [Google Scholar] [CrossRef]
  12. Quispe Marcatoma, J.; Peña Rodrígueze, V.A.; Baggio-Saitovitch, M. FeSiB amorphous alloy prepared by mechanosynthesis. Hyperfine Int. 2001, 134, 207–212. [Google Scholar] [CrossRef]
  13. Takahara, Y.; Matsuda, H. Effect of cold rolling on the physical properties and the structure of Fe79B16Si15 amorphous alloy. Trans. JIM 1987, 28, 535. [Google Scholar] [CrossRef]
  14. Coïsson, M.; Celegato, F.; Olivetti, E.; Tiberto, P.; Vinai, F.; Baricco, M. Stripe domains and spin reorientation transition in Fe78B13Si9 thin films produced by rf sputtering. J. Appl. Phys. 2008, 104, 033902. [Google Scholar] [CrossRef]
  15. Alleg, S.; Ibrir, M.; Fenineche, N.E.; Suñol, J.J. Microstructure and magnetic properties of HVOF thermally sprayed Fe75Si15B10 coatings. Surf. Coat. Technol. 2010, 205, 281–286. [Google Scholar] [CrossRef]
  16. Dong, S.; Song, B.; Zhang, X.; Deng, C.; Fenineche, N.E.; Hansz, B.; Liao, H.; Coddet, C. Fabrication of FeSiB magnetic coatings with improved saturation magnetization by plasma spray and dry-ice blasting. J. Alloys Compds. 2014, 584, 254–260. [Google Scholar] [CrossRef]
  17. Sypień, A.; Kusiński, J.; Kusiński, G.J.; Nelson, E.C. TEM study of the FeSiB amorphous alloy nanocrystallized by means of Nd: YAG pulsed laser heating. Mat. Chem. Phys. 2003, 81, 390–392. [Google Scholar] [CrossRef]
  18. Katakam, S.; Hwang, J.Y.; Vora, H.; Harimkar, S.P.; Banerjee, R.; Dahotre, N.B. Laser-induced thermal and spatial nanocrystallization of amorphous Fe–Si–B alloy. J. Scr. Mater. 2012, 66, 538–554. [Google Scholar] [CrossRef]
  19. Chua, C.K.; Leong, K.F. 3D Printing and Additive Manufacturing: Principles and Applications, 4th ed.; World Scientific Publishing Co. Pte. Ltd.: Singapore, 2014. [Google Scholar]
  20. Dong, W.; Han, B.; Hui, J.; Yan, M. Bending behavior and fracture surface characters for FeSiB amorphous ribbons in different free volume state. Appl. Phys. A 2020, 126, 670. [Google Scholar] [CrossRef]
  21. Nagalingam, A.P.; Vohra, M.S.; Kapur, P.; Yen, S.H. Effect of cut-off, evaluation length, and measurement area in profile and areal surface texture characterization of as-built metal additive manufactured components. Appl. Sci. 2021, 11, 5089. [Google Scholar] [CrossRef]
  22. Zhang, B.; Coddet, C. Selective laser melting of iron powder: Observation of melting mechanism and densification behavior via point-track-surface-part research. J. Manuf. Sci. Eng. 2016, 138, 051001. [Google Scholar] [CrossRef]
  23. Agarwala, M.; Bourell, D.; Beaman, J.; Marcus, H.; Barlow, J. Direct selective laser sintering of metals. Rap. Prototyp. J. 1995, 1, 26–36. [Google Scholar] [CrossRef]
  24. Simchi, A.; Pohl, H. Effects of laser sintering processing parameters on the microstructure and densification of iron powder. Mater. Sci. Eng. 2003, A359, 119–128. [Google Scholar] [CrossRef]
  25. Alleg, S.; Drablia, R.; Fenineche, N.E. Effect of the laser scan rate on the microstructure, magnetic properties and microhardness of selective laser melted FeSiB. J. Supercond. Nov. Magn. 2018, 31, 3565–3577. [Google Scholar] [CrossRef]
  26. Lutterotti, L. MAUD CPD Newsletter (IUCr) 24 (2000). Available online: http://maud.radiographema.eu/ (accessed on 30 May 2022).
  27. Rietveld, H.M. A profile refinement method for nuclear and magnetic structures. Acta Crystallogr. 1969, 2, 65–71. [Google Scholar] [CrossRef]
  28. Varret, F.; Teillet, J. Unpublished Mosfit Program; Le Mans Université: Le Mans, France, 1976. [Google Scholar]
  29. Vocadlo, L.; Knight, K.S.; Price, G.D.; Wood, I.G. Thermal expansion and crystal structure of FeSi between 4 and 1173 K determined by time-of-flight neutron powder diffraction. Phys. Chem. Min. 2002, 29, 132–139. [Google Scholar] [CrossRef]
  30. Stoica, M. Glass-forming ability of [(Fe0.5Co0.5)0.75B0.2Si0.05]96Nb4 alloy. In Fe-Based Bulk Metallic Glasses; MatWerk Springer: Wiesbaden, Germany, 2017; pp. 53–78. [Google Scholar] [CrossRef]
  31. de Boer, F.R.; Boom, R.; Mattens, W.C.M.; Miedema, A.R.; Niessen, A.K. Cohesion in Metals; North-Holland: Amsterdam, The Netherlands, 1988; p. 276. [Google Scholar]
  32. Poletti, M.G.; Battezzati, L. Assessment of the ternary Fe–Si–B phase diagram. Calphad 2013, 43, 40–47. [Google Scholar] [CrossRef]
  33. Imafuku, M.; Sato, S.; Koshiba, H.; Matsubara, E.; Inoue, A. Structural variation of Fe-Nb-B metallic glasses during crystallization process. Scripta Mater. 2001, 44, 2369. [Google Scholar] [CrossRef]
  34. Souilah, S.; Alleg, S.; Djebbari, C.; Suñol, J.J. Magnetic and microstructural properties of the mechanically alloyed Fe57Co21Nb7B15 powder mixture. Mater. Chem. Phys. 2012, 132, 766–772. [Google Scholar] [CrossRef]
  35. Liu, F.; Yao, K.; Ding, H.Y. Fe-based glassy alloys with high iron content and high saturation magnetization. Intermetallics 2011, 19, 1674–1677. [Google Scholar] [CrossRef]
  36. Iga, A.; Tawara, Y.; Yanase, A. Magnetocrystalline anisotropy of Fe2B. J. Phys. Soc. Jpn. 1966, 21, 404. [Google Scholar] [CrossRef]
  37. Song, B.; Dong, S.; Deng, S.; Liao, H.; Coddet, C. Microstructure and tensile properties of iron parts fabricated by selective laser melting Comp. J. Opt. Las. Technol. 2014, 56, 451–460. [Google Scholar] [CrossRef]
  38. Aronsson, B.; Engström, I. X-ray Investigations on Me-Si-B Systems (Me=Mn, Fe, Co). Acta Chem. Scand. 1960, 14, 1403–1413. [Google Scholar] [CrossRef]
  39. Zhu, Y.Y.; Li, Z.G.; Li, R.F.; Li, M.; Feng, K.; Wu, Y.X.; Wada, T.; Kato, H. High power diode laser cladding of Fe–Co–B–Si–C–Nb amorphous coating: Layered microstructure and properties. Surf. Coat. Technol. 2013, 235, 699–705. [Google Scholar] [CrossRef]
  40. Li, R.F.; Li, Z.G.; Huang, J.; Zhu, Y. Dilution effect on the formation of amorphous phase in the laser cladded Ni–Fe–B–Si–Nb coatings after laser remelting process. App. Surf. Sci. 2012, 258, 7956–7961. [Google Scholar] [CrossRef]
  41. Zhang, P.; Yan, H.; Yao, C.; Li, Z.; Yu, Z.; Xu, P. Synthesis of Fe–Ni–B–Si–Nb amorphous and crystalline composite coatings by laser cladding and remelting. Surf. Coat. Technol. 2011, 206, 1229–1236. [Google Scholar] [CrossRef]
  42. Li, R.; Li, Z.; Huang, J.; Zhang, P.; Zhu, Y. Effect of Ni-to-Fe ratio on structure and properties of Ni–Fe–B–Si–Nb coatings fabricated by laser processing. Appl. Surf. Sci. 2011, 257, 3554–3557. [Google Scholar] [CrossRef]
Figure 1. SEM micrograph (a) and particle size distribution (b) of the feedstock powders.
Metals 12 01620 g001
Figure 2. (a): XRD patterns of the sample holder, initial powder, and laser melted samples; (b): Zoom of the main diffraction peak.
Metals 12 01620 g002
Figure 3. Rietveld refinement of the XRD patterns of (a): the initial powder; and (b): laser melted P110 sample.
Metals 12 01620 g003
Figure 4. Evolution of the volumetric fraction of the phases versus the laser power.
Metals 12 01620 g004
Figure 5. Mössbauer spectrum of the feedstock powder (a) and corresponding HFD (b) and Mössbauer spectra of the laser melted samples P50 (c) and P70 (d).
Metals 12 01620 g005
Figure 6. Hysteresis loops of the feedstock powders and selectively laser melted specimens.
Metals 12 01620 g006
Figure 7. Evolution of the saturation magnetization versus the laser power.
Metals 12 01620 g007
Figure 8. Morphology of the selective laser melted samples.
Metals 12 01620 g008
Figure 9. Typical AFM morphologies of selective laser melted samples.
Metals 12 01620 g009
Figure 10. Variation of the surface roughness and porosity as a function of laser power.
Metals 12 01620 g010
Figure 11. Variation of the microhardness as a function of laser power.
Metals 12 01620 g011
Table 1. Elemental analysis of the initial powder.
PointElement (at.%) ±0.1
FeSiB
188.09.62.4
284.912.32.8
387.410.42.0
491.83.54.7
591.34.04.7
690.33.95.8
789.73.86.5
Mean value90.46.84.1
Table 2. Phases, lattice parameters (a, c), relative deviations (Δa, Δc), and crystallite sizes deduced from the XRD Rietveld refinement.
SamplePhasesa (nm)
±10−4
Δa
(%)
c (nm)
±10−4
Δc
(%)
<L> (nm)
±5
Raw powderAmorphous type--------------------
α-Fe0.95Si0.05
Fe2B
0.2857
0.5108
0.035
−0.039
----
0.4229
----
−0.47
102
90

P50
ε-FeSi type
α-Fe0.95Si0.05
0.6549
0.2856
43.93
0
----
----
----
----
43
66
Fe2B0.5106−0.0780.4230−0.4460
ε-FeSi type0.640540.76--------36
P70α-Fe0.95Si0.050.28560--------41
Fe2B0.5105−0.0970.4232−0.4058
P90ε-FeSi type
α-Fe0.95Si0.05
Fe2B
0.6515
0.2862
0.5124
43.18
0.21
0.27
----
----
0.4241
----
----
−0.18
30
40
61
P110ε-FeSi type
α-Fe0.95Si0.05
Fe2B
0.6280
0.2864
0.5125
38.02
0.28
0.29
----
----
0.4243
----
----
−0.14
37
45
62
Table 3. Atomic positions and occupancy of Fe and Si atoms in the ε-FeSi crystal lattice.
SampleAtomxyzOccupancy
P50Fe0.7360.7360.7600.62
Si−0.0560.055−0.0551.0
P70Fe0.7360.7360.7351.0
Si−0.0560.0560.0560.2
P90Fe0.7360.7370.7360.97
Si0.0580.0560.0560.84
P110Fe0.7360.7360.7600.62
Si−0.0560.055−0.0551.0
Table 4. Hyperfine parameters (hyperfine field, Bhf (T), isomer shift, IS (mm/s), quadrupolar shift, (mm/s), quadrupolar splitting, Δ (mm/s), linewidth at half height, Γ (mm/s), area (%), average hyperfine field, <Bhf>, and average isomer shift, <IS>, of the raw powder, P50 and P70 samples.
SamplePhaseSiteBhf ±0.5IS ±0.012ε or Δ ±0.01% ±0.02Area ±2<Bhf><IS>
Powder HFD--------0.020.3610024.70.11
 
FeSi
SS132.50.0300.364
SS230.50.07−0.030.5311
SS327.40.09−0.030.501921.00.09
Fe2BSS423.90.120.010.5547
HFD----0.05−0.020.3019
P50  
FeSi
 
Fe2B
SS132.90.0400.328
SS231.10.080.010.4921
SS328.10.11−0.030.501425.40.11
SS500.380.600.335
SS423.40.110.060.4952
P70  
FeSi
 
Fe2B
SS132.40.0500.2721
SS230.60.05−0.000.321126.70.09
SS328.00.110.040.5014
SS423.40.120.040.4254
Table 5. Elemental analysis of the selective melted samples.
SampleElement (at.%) ± 0.5
FeSiB
P5093.403.33.3
P7083.105.611.4
P9081.805.213.0
P11078.854.916.25
Publisher’s Note: MDPI stays neutral with regard to jurisdictional claims in published maps and institutional affiliations.

